CLINICAL VISUAL OPTICS (OPTO 223) Weeks XII & XIII Dr Salwa Alsaleh
|
|
|
- Gwendoline Booth
- 6 years ago
- Views:
Transcription

1 CLINICAL VISUAL OPTICS (OPTO 223) Weeks XII & XIII Dr Salwa Alsaleh
2 OUTLINE OF WEEKS XII & XIII Temporal resolution Temporal Summation. Broca-Sulzer effect. Critical flicker frequency (CFF). Temporal Contrast Sensitivity.
3 INTRODUCTION The eye can function over a large range of luminance levels; it must also be able to handle the different rates of change in luminance. Our eyes are constantly sampling information of images projected onto the retina in a periodic manner. Information is then integrated so objects around us appear to be stable or move smoothly. Since there is a finite amount of time required to collect and process information, there are limitations to the responsiveness of our visual system to rates of change
4 INTRODUCTION. When intermittent stimuli are presented to the eye they are perceived as separate if the rate at which they are presented is below a certain value. If the rate of presentation of the intermittent stimuli is slow, it appears to stay on but with changes in intensity, producing the sensation called flicker. Above a certain critical rate, the flicker ceases. This point is called the critical flicker frequency and is influenced by a number of factors. The first factor to be considered is temporal summation properties of the visual system
5 TEMPORAL RESOLUTION AND.TEMPORAL SUMMATION In the spatial domain, detection of two lights in space requires the appropriate detector array (figure 1). In order for us to discriminate the two lines, a response given by detector array C to F is required. All these detector arrays provide a Yes-No-Yes response and thus allow the discrimination of the two lines.
6
7 In the temporal domain, the same principle applies, except now, the stimulus is separated in time (figure 2). The separation between the two lines is in the temporal domain (two flashes are delivered) after a time interval t. The detector array now has different temporal integration times. For example, detector A integrates over time = t, whereas detector array B has an integration time of time = 0.5t, array C, time = 0.33t and so on. Because of the shorter integration time for detector array C and beyond, such an array will be able to discriminate the two flashes that are separated by an interval of t
8
9 To detect a flash of light one after the other, an appropriate integration time is required (figure 3). The period of integration is up to 0.1 seconds or 100 ms (for rods) and 10 to 15 ms for cones. The advantage of long integration time is that under limited light level conditions, threshold will be reached, whereas when light levels are not limiting (cone or photopic vision), a short integration time is preferable to improve temporal resolution.
10
11 Temporal integration time is related to temporal summation. Temporal summation refers to the eye s ability to sum the effects of individual quanta of light over time. However, temporal summation only occurs within a certain period of time, called the critical duration or critical period. According to Bloch s law of vision, within this critical duration, threshold is reached when the total luminous energy is reached. Bloch s Law of temporal summation is analogous to Ricco s Law of spatial summation.

12 BLOCH S LAW Bloch s law states that total luminous energy is a constant value (k), thus threshold is reached when the product of luminance (L) and stimulus duration (t) equals this constant. In other words, when luminance is halved, a doubling in stimulus duration is required to reach threshold. When luminance is doubled, threshold can be reached in half the duration. Bloch s Law is expressed as: where is the luminance of the stimulus, is the duration of the stimulus, is a constant value and describes whether temporal summation is complete or partial (. No temporal summation occurs when.
13
14 Critical duration is shorter for stimulus of high luminance as threshold is reached faster and slower for stimulus of low luminance as a longer period of time is required to sum the quanta to reach threshold. Temporal summation ceases beyond the temporal integration time. Above this value, threshold is dependent only on luminance rather than the product of luminance and duration.
15 Temporal summation is also affected by other test variables such as background luminance and the size of the stimulus size. Critical duration is longer for brighter background and smaller test stimuli. When temporal summation data is plotted as log L.t versus log t rather than log L versus log t (as in figure 4), the slope of zero identifies Bloch s Law.
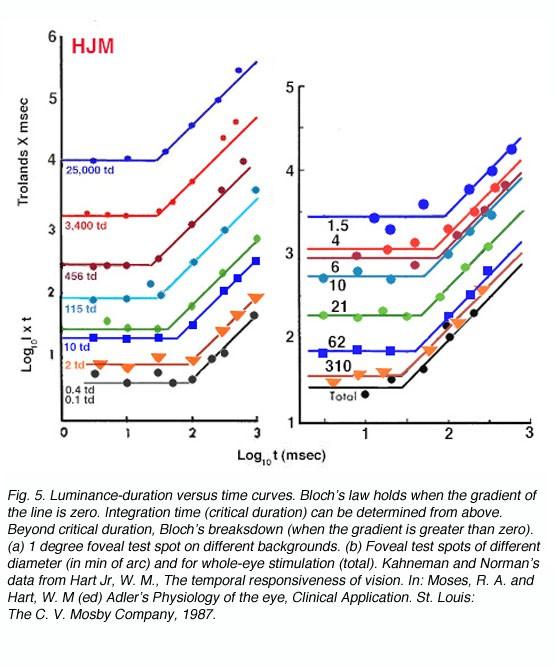
16
17 The previous plots show that temporal summation is longer for low light levels indicating the larger temporal summation characteristics for scotopic vision. As light intensity is increased, eg, 25,000 trolands, the critical duration is of the order of 20-30msec. The interrelationship between temporal integration and spatial summation is shown on the right panel where Bloch s law is measured for different size test stimuli. Decreasing test size results in increased temporal summation, and hence poorer temporal discrimination. We will investigate this phenomenon further when we review flicker discrimination for different sized stimuli in the next section
18 .BROCA-SULZER EFFECT In addition to basic discrimination characteristics of temporal resolution, there are several interesting perceptual phenomena. One of these phenomena is the Broca-Sulzer effect that describes the apparent transient increase in brightness of a flash of short duration. Subjective flash brightness occur with flash duration of 50 to 100 milliseconds.
19 This phenomenon is associated with temporal summation and explains the levelling off of brightness to a plateau. When the light is turned on, time is required for temporal summation to reach threshold for light of low luminance. Light of high luminance reach this threshold very quickly. As flash duration increases, brightness levels off to a plateau as temporal summation begins to breakdown according to Bloch s law after the critical duration. The apparent transient peak in brightness is probably due to an underlying neural mechanism
20
21 .CRITICAL FLICKER FREQUENCY (CFF) Critical flicker frequency (CFF) is the transition point of an intermittent light source where the flickering light ceases and appears as a continuous light. There are a multitude of factors that determine our perception of flicker that includes the intensity and size of the test stimulus.
.")
22 .FACTORS AFFECTING CFF The Ferry-Porter Law states that CFF is proportional to the logarithm of the luminance of flickering stimulus (). It can be expressed as Where and are constants.

23 With foveal observation, this relationship holds over a wide range (0.5 to 10,000 trolands). The previous equation implies that when CFF is plotted as a function of, a straight line will identify the region where the Ferry-Porter Law holds. As the intensity of the test stimulus is increased, our perception of flicker also increases. From a practical point of view, if a stimulus is flickering, such as computer monitor, decreasing the intensity level will eliminate the flicker.
24
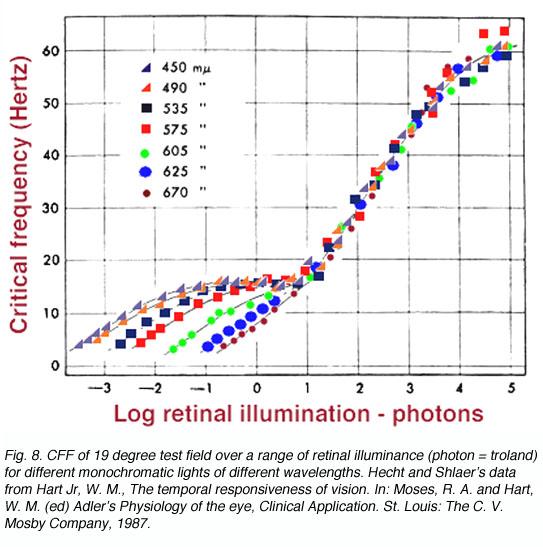
25 SPECTRAL COMPOSITION Under photopic levels, lights of different wavelengths, when adjusted to match them for brightness, conforms to the FerryPorter Law, and follows the logarithmic function as brightness increases. However, under scotopic levels (rods functioning), the wavelengths fan out (figure 8). This is due to the different spectral sensitivity of the scotopic system to the photopic system. I f plotted as scotopic photons, the bottom part of the curve would collapse into one and appear like the 19o curve in figure 10. Note that the temporal resolution to short wavelength test stimuli is different
26 ..An important aspect of cone vision is that when the short- wavelength pathway is isolated (Kelly, 1974), the temporal resolution is lower, close to Hz, rather than the closer to 60 Hz for the longer wavelength pathways. This general phenomenon, is characteristic of the short- wavelength pathway that is known to have larger spatial summation approximately 15 at about one degree eccentricity (the location of high S-cone density), whereas the longer wavelength pathways have a spatial summation of 4 (Brindley, 1954). In the temporal domain, at high light levels, the S-cone pathways has a temporal summation time of approximately 100ms, whereas the longer-wavelength cone pathway has a temporal integration of approximately 50msec (Krauskopf and Mollon, 1971).
27
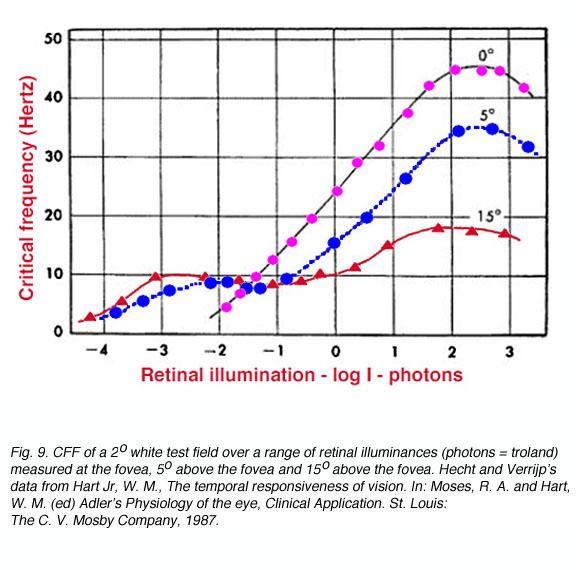
28 RETINAL POSITION Since the CFF is different for rod and cones, the CFF for the test field will depend on the proportion of rods and cones being stimulated. Because the proportion of rod and cones change with eccentricity, a foveal test stimulus will follow the Ferry-Porter Law and show no kink (one branch only) in the curve since only cones are present at the fovea. An extrafoveal test stimulus will show a kink (two branches) in the CFF function since the rods determine the CFF at low retinal illuminances and the cones determining CFF at higher retinal illuminance. Note that the Ferry-Porter Law applies over a decreasing range as the eccentricity increases and that temporal resolution is poorer for eccentric locations
29
30 The Ferry-Porter law has been further examined for a single cone type, using conditions that eliminate detection of the flickering stimulus by rods. Under these conditions, the law has been found to hold despite changes in stimulus size or modulation amplitude (Tyler and Hamer, 1990). However, the slope of the FerryPorter law changes with eccentricity, becoming steeper with eccentrically presented targets. This latter finding is consistent with previous work suggesting that there is an increase in the speed of photopic retinal responses in the periphery, once stimuli have been appropriately scaled (Tyler, 1985).
31 This increase in speed has been hypothesized to relate to the change in cone photoreceptor outer-segment length that occurs in the periphery (Tyler, 1985). Such scaling has not been performed to the classic data sets presented here.
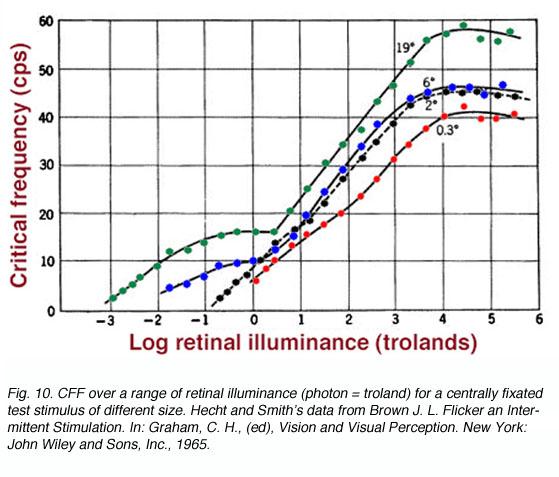
32 SIZE OF TEST FIELD Due to the different population of rods and cones in the retina and different spatial summation properties, CFF will be dependent on the area of the retina being stimulated. Instead of varying retinal eccentricity as above, the size of the centrally fixated test field is varied As the test field increases, two branches begin to appear. The lower branch representing rod function. The maximum CFF, and hence maximum temporal resolution is achieved by large test targets that have
33
34 TALBOT-PLATEAU LAW The Talbot-Plateau Law describes the brightness of an intermittent light source which has a frequency above the CFF. This law states that above CFF, subjectively fused intermittent light and objectively steady light (of equal colour and brightness) will have exactly the same luminance. In another words, brightness sensation from the intermittent light source is the same as if the light perceived during the various periods of stimulation had been uniformly distributed over the whole time. The Talbot-Plateau Law applies only above the CFF.
35 BRÜCKE-BARTLEY The Brücke-Bartley (brightness enhancement) effect is a phenomenon related to the Broca-Sulzer effect. When the frequency is gradually lowered below the CFF, the effective brightness of the test field begins to rise. Not only does the brightness reach a value equal to that of the uninterrupted light, but even transcends it, reaching a maximum when the flash rate is about 8 to 10 Hz.
36 TEMPORAL CONTRAST SENSITIVITY In the spatial domain, spatial vision can be characterised by the contrast sensitivity function (CSF). To thoroughly investigate the visual system to flicker, a Temporal Contrast Sensitivity Function (TSF) or a de Lange Function can be plotted (De Lange, 1958). A TSF is a plot of how flicker varies with contrast and vice versa. The eye appears to be most sensitive to a frequency of 15 to 20 Hz at high luminances (photopic vision). At photopic light levels, less than 1% contrast is required to detect the stimulus and the high temporal frequency cut off is close to 60 Hz. At low light levels the maximum contrast is about 20% and the high temporal frequency cut off is approximately 15 Hz. To detect flicker of high frequencies, maximum contrast is required. Temporal resolution is not as efficient at low luminances (scotopic vision)
37
38 Different sensitivity profiles exist for the different components of the visual system (opponent versus non-opponent), to discriminate motion. For the luminance system, detection, identification and direction discrimination provide equivalent thresholds. However, at all eccentricities tested, the chromatic system required approximately 0.3 log units higher contrast levels to signal direction of motion. Overall, these results imply that both luminance (non-opponent) and chromatic (opponent) visual channels are involved in motion discrimination
39
40 END OF LECTURE References for further reading : Brown JL. Flicker: an intermittent dtimulation. In: Graham CH, editor. Vision and visual perception. New York: John Wiley and Sons, Inc., Brindley GS. The summation areas of human colour-receptive mechanisms at increment threshold. J Physiol. 1954;124: [PubMed] De Lange DZN H. Research into the dynamic nature of the human fovea cortex systems with intermittent and modulated light. II. Phase shift in brightness and delay in color perception. J Opt Soc Am. 1958;48: [PubMed] Hart WM Jr. The temporal responsiveness of vision. In: Moses RA, Hart WM, editors. Adler s physiology of the eye. Clinical application. St. Louis (MO): The C. V. Mosby Company; Kelley DH. Spatio-temporal frequency characteristics of color-vision mechanisms. J Opt Soc Am. 1974;64: [PubMed]

41 Homework 4 is due to next week Have a nice week!
BASIC VISUAL SCIENCE CORE
 BASIC VISUAL SCIENCE CORE Absolute and Increment Thresholds Ronald S. Harwerth Fall, 2016 1. Psychophysics of Vision 2. Light and Dark Adaptation Michael Kalloniatis and Charles Luu 1 The Neuron Doctrine
Surround effects on the shape of the temporal contrast-sensitivity function
 B. Spehar and Q. Zaidi Vol. 14, No. 9/September 1997/J. Opt. Soc. Am. A 2517 Surround effects on the shape of the temporal contrast-sensitivity function Branka Spehar School of Psychology, University of
Vision & Perception. Simple model: simple reflectance/illumination model. image: x(n 1,n 2 )=i(n 1,n 2 )r(n 1,n 2 ) 0 < r(n 1,n 2 ) < 1
=i(n 1,n 2 )r(n 1,n 2 ) 0 < r(n 1,n 2 ) < 1") Simple model: simple reflectance/illumination model Eye illumination source i(n 1,n 2 ) image: x(n 1,n 2 )=i(n 1,n 2 )r(n 1,n 2 ) reflectance term r(n 1,n 2 ) where 0 < i(n 1,n 2 ) < 0 < r(n 1,n 2 )
Simple model: simple reflectance/illumination model Eye illumination source i(n 1,n 2 ) image: x(n 1,n 2 )=i(n 1,n 2 )r(n 1,n 2 ) reflectance term r(n 1,n 2 ) where 0 < i(n 1,n 2 ) < 0 < r(n 1,n 2 )
Detectability measures the difference between the means of the noisy ``signal'' distribution and the ``noise-only'' distribution.
 VISUAL PERCEPTION Here is the Visual Perception Video Outline. Visual Perception is another subject where a conceptual understanding of the big picture is critical. When there are equations, pay particular
COLOR SCIENCE. Concepts and Methods, Quantitative Data and Formulae, 2nd Edition. John Wiley & Sons New York Chichester Brisbane Toronto Singapore
 COLOR SCIENCE Concepts and Methods, Quantitative Data and Formulae, 2nd Edition GÜNTER WYSZECKI National Research Council, Ottawa, Ontario, Canada W. S. STILES Richmond, Surrey, England t^- n M 1982 A
Color vision and colorimetry
 Color vision and colorimetry Photoreceptor types Rods Scotopic vision (low illumination) Do not mediate color perception High density in the periphery to capture many quanta Low spatial resolution Many-to-one
Introduction to Colorimetry
 IES NY Issues in Color Seminar February 26, 2011 Introduction to Colorimetry Jean Paul Freyssinier Lighting Research Center, Rensselaer Polytechnic Institute Troy, New York, U.S.A. sponsored by www.lrc.rpi.edu/programs/solidstate/assist
University of California, Berkeley, California, U.S.A. (Received 14 June 1965)
") J. Phy8iol. (1965), 181, pp. 881-894 881 With 8 text-ftgure8 Printed in Great Britain SPATIAL INTERACTION IN THE HUMAN RETINA DURING SCOTOPIC VISION BY G. WESTHEIMER From the Neurosensory Laboratory, School
J. Phy8iol. (1965), 181, pp. 881-894 881 With 8 text-ftgure8 Printed in Great Britain SPATIAL INTERACTION IN THE HUMAN RETINA DURING SCOTOPIC VISION BY G. WESTHEIMER From the Neurosensory Laboratory, School
Sustained and transient channels
 Sustained and transient channels Chapter 5, pp. 141 164 19.12.2006 Some models of masking are based on two channels with different temporal properties Dual-channel models Evidence for two different channels
Visual Imaging and the Electronic Age Color Science
 Visual Imaging and the Electronic Age Color Science Grassman s Experiments & Trichromacy Lecture #5 September 6, 2016 Prof. Donald P. Greenberg Light as Rays Light as Waves Light as Photons What is Color
Hue discrimination in peripheral vision under conditions of dark and light adaptation*
 Perception & Psychophysics 1974, Vol. 15, No.3, 586-590 Hue discrimination in peripheral vision under conditions of dark and light adaptation* BRUCE A. AMBLERt University of Oregon, Eugene, Oregon 97403
OPTO 5320 VISION SCIENCE I
 OPTO 5320 VISION SCIENCE I Monocular Sensory Processes of Vision: Color Vision Mechanisms of Color Processing VI. Retinal fundamentals A. Retinal fundamentals and cone photopigments B. Properties of cone
background light falling not only on the tested region, but also on surrounding stimuli, whereas here we were dealing with an adaptation rather
 J. Physiol. (197), 26, pp. 129-143 129 With 1 text-figures Printed in Great Britain DISTANCE EFFECTS IN HUMAN SCOTOPIC RETINAL INTERACTION BY GERALD WESTHEIMER AND R. W. WILEY* From the Department of Physiology-Anatomy,
A Model of Local Adaptation supplementary information
 A Model of Local Adaptation supplementary information Peter Vangorp Bangor University, UK & MPI Informatik, Germany Karol Myszkowski MPI Informatik, Germany Erich W. Graf University of Southampton, United
Color and compositing
 Color and compositing 2D Computer Graphics: Diego Nehab Summer 208. Radiometry Measurement of radiant energy in terms of absolute power Wave vs. particle Wavelength (λ), frequency (ν = c λ ), and amplitude
Adaptation in the Neural Code of the Retina
 Adaptation in the Neural Code of the Retina Lens Retina Fovea Optic Nerve Optic Nerve Bottleneck Neurons Information Receptors: 108 95% Optic Nerve 106 5% After Polyak 1941 Visual Cortex ~1010 Mean Intensity
Adaptation to a 'spatial-frequency doubled' stimulus
 Perception, 1980, volume 9, pages 523-528 Adaptation to a 'spatial-frequency doubled' stimulus Peter Thompson^!, Brian J Murphy Department of Psychology, University of Pennsylvania, Philadelphia, Pennsylvania
Limulus. The Neural Code. Response of Visual Neurons 9/21/2011
 Crab cam (Barlow et al., 2001) self inhibition recurrent inhibition lateral inhibition - L16. Neural processing in Linear Systems: Temporal and Spatial Filtering C. D. Hopkins Sept. 21, 2011 The Neural
Visual Imaging and the Electronic Age Color Science
 Visual Imaging and the Electronic Age Color Science Grassman s Experiments & Trichromacy Lecture #5 September 8, 2015 Prof. Donald P. Greenberg What is Color Science? Quantifying the physical energy which
The Visual Perception of Images
 C. A. Bouman: Digital Image Processing - January 8, 2018 1 The Visual Perception of Images In order to understand images you must understand how humans perceive visual stimulus. Objectives: Understand
Temporal summation in human vision: Simple reaction time measurements
 Perception &Psychophysics 1978, Vol. 23 (1), 43-5 Temporal summation in human vision: Simple reaction time measurements TAKEHIRO DENO Osaka City University, Sumiyoshi-ku, Osaka 558, Japan Simple reaction
APPARENT CONTRAST OF SPATIALLY AND TEMPORALLY SAMPLED GRATINGS
 ACTA NEUROBIOL. DXP. 1988, 48: 283-293 APPARENT CONTRAST OF SPATIALLY AND TEMPORALLY SAMPLED GRATINGS T. RADIL, G. NYMAN and P. LAURLNEN Institute of Physiology, Czechoslovak Academy of Sciences Videiiska
The functional organization of the visual cortex in primates
 The functional organization of the visual cortex in primates Dominated by LGN M-cell input Drosal stream for motion perception & spatial localization V5 LIP/7a V2 V4 IT Ventral stream for object recognition
What is it? Where is it? How strong is it? Perceived quantity. Intensity Coding in Sensory Systems. What must sensory systems encode?
 Sensory Neurophysiology Neural response Intensity Coding in Sensory Systems Behavioral Neuroscience Psychophysics Percept What must sensory systems encode? What is it? Where is it? How strong is it? Perceived
An Experimental Approach to a Definition of the Mesopic Adaptation Field
 May 29 June 1, 2012 NRC Ottawa, Ontario CORM 2012 Annual Conference and Business Meeting An Experimental Approach to a Definition of the Mesopic Adaptation Field Tatsukiyo Uchida*, Yoshi Ohno** *Panasonic
Spatial Vision: Primary Visual Cortex (Chapter 3, part 1)
") Spatial Vision: Primary Visual Cortex (Chapter 3, part 1) Lecture 6 Jonathan Pillow Sensation & Perception (PSY 345 / NEU 325) Princeton University, Spring 2015 1 Chapter 2 remnants 2 Receptive field:
Spatial Vision: Primary Visual Cortex (Chapter 3, part 1) Lecture 6 Jonathan Pillow Sensation & Perception (PSY 345 / NEU 325) Princeton University, Spring 2015 1 Chapter 2 remnants 2 Receptive field:
A Three-dimensional Physiologically Realistic Model of the Retina
 A Three-dimensional Physiologically Realistic Model of the Retina Michael Tadross, Cameron Whitehouse, Melissa Hornstein, Vicky Eng and Evangelia Micheli-Tzanakou Department of Biomedical Engineering 617
Theory of colour measurement Contemporary wool dyeing and finishing
 Theory of colour measurement Contemporary wool dyeing and finishing Dr Rex Brady Deakin University Colour measurement theory Topics 1. How we see colour 2. Generation of colours 3. Measurement of colour
Motion Perception 1. PSY305 Lecture 12 JV Stone
 Motion Perception 1 PSY305 Lecture 12 JV Stone 1 Structure Human visual system as a band-pass filter. Neuronal motion detection, the Reichardt detector. The aperture problem. 2 The visual system is a temporal
Deviations from strict M scaling
 ol. 9, No. 8/August 199/J. Opt. Soc. Am. A 133 Deviations from strict M scaling P. Bijl* J. J. Koenderink, and A. M.. Kappers Buys Ballot aboratory, Utrecht Biophysics Research nstitute, University of
0*521. (see Fig. 5, p. 43 in Denton & Pirenne, 1954) was mounted in front of the source. The
 was mounted in front of the source. The") 369 J. Physiol. (I959) I45, 369-373 THE MINIMUM FLUX OF ENERGY DETECTABLE BY THE HUMAN EYE F. H. C. MARRIOTT,* VALERIE B. MORRIS AND M. H. PIRENNE From the University Laboratory of Physiology, Oxford (Received
369 J. Physiol. (I959) I45, 369-373 THE MINIMUM FLUX OF ENERGY DETECTABLE BY THE HUMAN EYE F. H. C. MARRIOTT,* VALERIE B. MORRIS AND M. H. PIRENNE From the University Laboratory of Physiology, Oxford (Received
Color vision and colorimetry
 Color vision and colorimetry Photoreceptor types Rods Scotopic vision (low illumination) Do not mediate color perception High density in the periphery to capture many quanta Low spatial resolution Many-to-one
15 Grossberg Network 1
 Grossberg Network Biological Motivation: Vision Bipolar Cell Amacrine Cell Ganglion Cell Optic Nerve Cone Light Lens Rod Horizontal Cell Retina Optic Nerve Fiber Eyeball and Retina Layers of Retina The
THE DELAYED ROD AFTERIMAGE
 Vision Res. Vol. 22, pp. 1313 to 1328, 1982 0042-6989/82/101313-16$03.00/0 Printed in Great Britain Pergamon Press Ltd THE DELAYED ROD AFTERIMAGE EDWARD H. ADELSON* Vision Research Laboratory, University
Σ S(x )δ x. x. Σ S(x )δ x ) x Σ F(S(x )δ x ), by superposition x Σ S(x )F(δ x ), by homogeneity x Σ S(x )I x. x. Σ S(x ) I x (y ) = x
δ x. x. Σ S(x )δ x ) x Σ F(S(x )δ x ), by superposition x Σ S(x )F(δ x ), by homogeneity x Σ S(x )I x. x. Σ S(x ) I x (y ) = x") 4. Vision: LST approach - Flicker, Spatial Frequency Channels I. Goals Stimulus representation System identification and prediction II. Linear, shift-invariant systems Linearity Homogeneity: F(aS) = af(s)
4. Vision: LST approach - Flicker, Spatial Frequency Channels I. Goals Stimulus representation System identification and prediction II. Linear, shift-invariant systems Linearity Homogeneity: F(aS) = af(s)
(Rushton), but that the equivalent background effectively adds to the real. dichotomy by using C. B. B. as subject, for, as described in the foregoing
, but that the equivalent background effectively adds to the real. dichotomy by using C. B. B. as subject, for, as described in the foregoing") J. Physiol. (1965), 181, pp. 629-640 629 With 3 text-figures Printed in Great Britain THE ROD INCREMENT THRESHOLD DURING DARK ADAPTATION IN NORMAL AND ROD MONOCHROMAT BY C. B. BLAKEMORE AND W. A. H. RUSHTON
J. Physiol. (1965), 181, pp. 629-640 629 With 3 text-figures Printed in Great Britain THE ROD INCREMENT THRESHOLD DURING DARK ADAPTATION IN NORMAL AND ROD MONOCHROMAT BY C. B. BLAKEMORE AND W. A. H. RUSHTON
Lab NotesIssue. Disability Glare in the Outdoor Workplace
 Lab NotesIssue 10 Disability Glare in the Outdoor Workplace 1.00 Introduction : This Lab Note is one of several which discusses the matter of glare in the workplace. They have been issued as a series of
Color perception SINA 08/09
 Color perception Color adds another dimension to visual perception Enhances our visual experience Increase contrast between objects of similar lightness Helps recognizing objects However, it is clear that
Mesopic Photometry for SSL. Teresa Goodman Metrology for SSL Meeting 24 th April 2013
 Mesopic Photometry for SSL Teresa Goodman Metrology for SSL Meeting 24 th April 2013 Outline Brief overview of CIE system for mesopic photometry Relevance of mesopic photometry for SSL Is mesopic photometry
Perception of brightness. Perception of Brightness. Physical measures 1. Light Ray. Physical measures 2. Light Source
 Perception of Brightness The physics and psychophysics Perception of brightness psychophysics: relate psychological measures to physical ones perception of brightness is one of the simplest aspects of
Radiometry. Energy & Power
 Radiometry Radiometry is the measurement of optical radiation, corresponding to wavelengths between 0.01 and 1000 μm, and includes the regions commonly called the ultraviolet, the visible and the infrared.
ACUITY AND THE CONE CELL DISTRIBUTION
 Brit. J. Ophthal. (1953) 37, 538. VISUALI ACUITY AND THE CONE CELL DISTRIBUTION OF THE RETINA* BY E. R. HARRISON Harwell, Didcot, Berks. BoTH Polyak (1941) and Ludvigh (1941) have discussed the acuity
SIGNAL DETECTION BY HUMAN OBSERVERS" Prof. J. A. Swets P. D. Donahue Louise Iarussi
 XIV. SIGNAL DETECTION BY HUMAN OBSERVERS" Prof. J. A. Swets P. D. Donahue Louise Iarussi Prof. D. M. Green Susan A. Sewall A. COLOR VISION The "law of additivity of luminances" has long been regarded as
Supplementary Figure 1. Characterization of the single-photon quantum light source based on spontaneous parametric down-conversion (SPDC).
.") .2 Classical light source.8 g (2) ().6.4.2 EMCCD SPAD 2 3.2.4.6.8..2.4.6.8.2 Mean number of photon pairs per pump pulse 4 5 6 7 8 9 2 3 4 Supplementary Figure. Characterization of the single-photon quantum
.2 Classical light source.8 g (2) ().6.4.2 EMCCD SPAD 2 3.2.4.6.8..2.4.6.8.2 Mean number of photon pairs per pump pulse 4 5 6 7 8 9 2 3 4 Supplementary Figure. Characterization of the single-photon quantum
Effect of luminance on suprathreshold contrast perception
 1352 J. Opt. Soc. Am. A/Vol. 8, No. 8/August 1991 Peli et al. Effect of luminance on suprathreshold contrast perception Eli Peli Physiological Optics nit, Eye Research Institute, Boston, Massachusetts
Cone rod receptor spaces with illustrations that use CRT phosphor and light-emitting-diode spectra
 Shapiro et al. Vol. 13, No. 12/December 1996/J. Opt. Soc. Am. A 2319 Cone rod receptor spaces with illustrations that use CRT phosphor and light-emitting-diode spectra Arthur G. Shapiro Department of Psychology,
DEA 350: HUMAN FACTORS: THE AMBIENT ENVIRONMENT (Spring 2008)
") DEA 350: HUMAN FACTORS: THE AMBIENT ENVIRONMENT (Spring 2008) NAME: HOMEWORK II Due Date: 24 th April in class (NOTE: You will need to consult the readings as well as your class notes to complete the homework.
DEA 350: HUMAN FACTORS: THE AMBIENT ENVIRONMENT (Spring 2008) NAME: HOMEWORK II Due Date: 24 th April in class (NOTE: You will need to consult the readings as well as your class notes to complete the homework.
Contrast Sensitivity
 Contrast Sensitivity Performance in a vision based task, such as reading text, recognizing faces, or operating a vehicle, is limited by the overall quality of the image. Image quality depends on many factors,
Cone dystrophy with supernormal rod ERG: psychophysical testing shows comparable rod and cone temporal sensitivity losses with no gain in rod function
 Cone dystrophy with supernormal rod ERG: psychophysical testing shows comparable rod and cone temporal sensitivity losses with no gain in rod function Andrew Stockman 1, G. Bruce Henning 1, Michel Michaelides
Flash masking and facilitation by nearby luminance perturbations
 750 J. Opt. Soc. Am. A/Vol. 16, No. 3/March 1999 T. E. Cohn and D. I. A. MacLeod Flash masking and facilitation by nearby luminance perturbations Theodore E. Cohn Program in Vision Science, School of Optometry,
Color Basics. Lecture 2. Electromagnetic Radiation - Spectrum. Spectral Power Distribution
 ectur Color Basics Wavelength Encoding Trichromatic Color Theory Color Matching Experiments -2-8 -4 4 8 Wavelength in meters (m) Newton s Experiment Visible light 4nm 5nm 6nm 7nm Wavelength 665, Cambridge
excluding the region of the stimulus, in the hope that the stray light from produced a slightly larger response than one that lay a little nasal or
 518 J. Physiol. (1965), 179, pp. 518-537 With 1 plate and 11 text-figure8 Printed in Great Britain THE SPATIAL PROPERTIES OF THE HUMAN ELECTRORETINOGRAM By G. S. BRINDLEY* AND G. WESTHEIMER From the Neurosensory
Colour Part One. Energy Density CPSC 553 P Wavelength 700 nm
 Colour Part One Energy Density 400 Wavelength 700 nm CPSC 553 P 1 Human Perception An Active Organising Process Many illusions experiments from psychology Colour not just a matter of measuring wavelength
A Model of Local Adaptation
 A Model of Local Adaptation Peter Vangorp Karol Myszkowski Erich W. Graf Rafał K. Mantiuk Bangor University and MPI Informatik MPI Informatik University of Southampton Bangor University and University
Leber s congenital amaurosis (LCA) is a group of severe,
 is a group of severe,") Visual Psychophysics and Physiological Optics Nature of the Visual Loss in Observers With Leber s Congenital Amaurosis Caused by Specific Mutations in RPE65 Caterina Ripamonti, 1 G. Bruce Henning, 1 Robin
Visual Psychophysics and Physiological Optics Nature of the Visual Loss in Observers With Leber s Congenital Amaurosis Caused by Specific Mutations in RPE65 Caterina Ripamonti, 1 G. Bruce Henning, 1 Robin
Cell division takes place next to the RPE. Neuroblastic cells have the capacity to differentiate into any of the cell types found in the mature retina
 RPE is a monolayer of hexagonal shaped neural epithelial cells that have the same embryological origin as the neural retina. They mature before the neural retina and play a key role in metabolic support
JNDs, adaptation, and ambient illumination
 JNDs, adaptation, and ambient illumination Giovanni Ramponi IPL, University of Trieste, Italy Rev. Jul 2012 The observations we make are based on: some properties of the Human Visual System (HVS), the
Screen-space processing Further Graphics
 Screen-space processing Rafał Mantiuk Computer Laboratory, University of Cambridge Cornell Box and tone-mapping Rendering Photograph 2 Real-world scenes are more challenging } The match could not be achieved
POST-PROCESSING OF RADIANCE IMAGES: VIRTUAL LIGHTING LABORATORY
 Scientific Applications Using Radiance University of Applied Sciences of Fribourg Sep. 30 -- Oct. 1, 2002. POST-PROCESSING OF RADIANCE IMAGES: VIRTUAL LIGHTING LABORATORY Mehlika Inanici University of
The subject of this investigation is an unusual, autosomal
 Visual Psychophysics and Physiological Optics Cone Dystrophy With Supernormal Rod ERG: Psychophysical Testing Shows Comparable Rod and Cone Temporal Sensitivity Losses With No Gain in Rod Function Andrew
DEA 3500: HUMAN FACTORS: THE AMBIENT ENVIRONMENT (Fall 2017)
") DEA 3500: HUMAN FACTORS: THE AMBIENT ENVIRONMENT (Fall 2017) NAME: HOMEWORK 3 Due Date: November 21st in class (NOTE: You will need to consult the readings as well as your class notes to complete the homework)
DEA 3500: HUMAN FACTORS: THE AMBIENT ENVIRONMENT (Fall 2017) NAME: HOMEWORK 3 Due Date: November 21st in class (NOTE: You will need to consult the readings as well as your class notes to complete the homework)
Brightness induction: Unequal spatial integration with increments and decrements
 Visual Neuroscience (2004), 21, 353 357. Printed in the USA. Copyright 2004 Cambridge University Press 0952-5238004 $16.00 DOI: 10.10170S0952523804213037 Brightness induction: Unequal spatial integration
Effects of Betaxolol on Hodgkin-Huxley Model of Tiger Salamander Retinal Ganglion Cell
 Effects of Betaxolol on Hodgkin-Huxley Model of Tiger Salamander Retinal Ganglion Cell 1. Abstract Matthew Dunlevie Clement Lee Indrani Mikkilineni mdunlevi@ucsd.edu cll008@ucsd.edu imikkili@ucsd.edu Isolated
Contrast gain control: a bilinear model for chromatic selectivity
 B. Singer and M. D Zmura Vol. 12, No. 4/April 1995/J. Opt. Soc. Am. A 667 Contrast gain control: a bilinear model for chromatic selectivity Benjamin Singer and Michael D Zmura Department of Cognitive Sciences
Outline. Photosensors in biology and in semiconductors. The visual pathway Bottom view. The visual pathway Side view
 Outline Photosensors in biology and in semiconductors CNS WS07-08 Class 1 Photosensors in biology The visual pathway and the retina Photoreceptors and the fovea Giacomo Indiveri Institute of Neuroinformatics
Transient and steady-state response properties of movement detectors
 116 J. Opt. Soc. Am. A/Vol. 6, No. 1/January 1989 M. Egelhaaf and A. Borst Transient and steady-state response properties of movement detectors Martin Egelhaaf and Alexander Borst Max-Planck-nstitut fr
Spatial pattern summation is phase-insensitive in the fovea but not in the periphery
 Spatial pattern summation is phase-insensitive in the fovea but not in the periphery CHIEN-CHUNG CHEN * and CHRISTOPHER W. TYLER Smith-Kettlewell Eye Research Institute, 2318 Fillmore Street, San Francisco,
following paper deals with a very limited range of parameters but the
 J. Phyeiol. (1969), 202, pp. 355-377 355 With 13 text-figure8 Printed in Great Britain ROD INCREMENT THRESHOLDS ON STEADY AND FLASHED BACKGROUNDS BY P. E. HALLETT From the Department of Physiology, University
Danjon noticed that the length (cusp to cusp) of the new crescent. moon was less than 180 degrees and suggested that the cause of the
 of the new crescent. moon was less than 180 degrees and suggested that the cause of the") From The Observatory, Vol. 125, No. 1187, pp. 227-232, 2005 August EXPLAINING AND CALCULATING THE LENGTH OF THE NEW CRESCENT MOON By A. H. Sultan Physics Department, Sana a University, Yemen Danjon noticed
From The Observatory, Vol. 125, No. 1187, pp. 227-232, 2005 August EXPLAINING AND CALCULATING THE LENGTH OF THE NEW CRESCENT MOON By A. H. Sultan Physics Department, Sana a University, Yemen Danjon noticed
A Luminous Efficiency Function, V D65 * (l), for Daylight Adaptation: A Correction
, for Daylight Adaptation: A Correction") A Luminous Efficiency Function, V D65 * (l), for Daylight Adaptation: A Correction Lindsay T. Sharpe, 1 Andrew Stockman, 1 Wolfgang Jagla, 2 Herbert Jägle 2,3 * 1 Institute of Ophthalmology, University
A Luminous Efficiency Function, V D65 * (l), for Daylight Adaptation: A Correction Lindsay T. Sharpe, 1 Andrew Stockman, 1 Wolfgang Jagla, 2 Herbert Jägle 2,3 * 1 Institute of Ophthalmology, University
Section III. Biochemical and Physiological Adaptations
 Section III Biochemical and Physiological Adaptations Introduction S.N. ARCHER and M.B.A. DJAMGOZ For a sensory system to function optimally, it must be adapted to receiving and responding to specific
magnitude of the quantum fluctuations. Now imagine a human subject Definition. The overall quantum efficiency (F) of vision is most simply
 of vision is most simply") J. Phy8iol. (1962), 160, pp. 155-168 155 With 2 text-ftgure8 Printed in Great Britain A METHOD OF DETERMINING THE OVERALL QUANTUM EFFICIENCY OF VISUAL DISCRIMINATIONS BY H. B. BARLOW From the Physiological
J. Phy8iol. (1962), 160, pp. 155-168 155 With 2 text-ftgure8 Printed in Great Britain A METHOD OF DETERMINING THE OVERALL QUANTUM EFFICIENCY OF VISUAL DISCRIMINATIONS BY H. B. BARLOW From the Physiological
Luminance. Lennie et al.
 Vol. 10, No. 6/June 1993/J. Opt. Soc. Am. A 1283 Luminance Peter Lennie Center for Visual Science, University of Rochester, Rochester, New York 14627 Joel Pokorny and Vivianne C. Smith Visual Sciences
Color luminance relationships and the McCollough effect
 Perception & Psychophysics 2000, 62 (4), 659-672 Color luminance relationships and the McCollough effect MICHAEL A. WEBSTER and GOKHAN MALKOC University of Nevada, Reno, Nevada The McCollough effect is
Extracellular Electrical Stimulation of Retinal Ganglion Cells
 Extracellular Electrical Stimulation of Retinal Ganglion Cells by Andrew Eli Grumet Submitted to the Department of Electrical Engineering and Computer Science in partial fulfillment of the requirements
March 26, Title: TEMPO 21 Report. Prepared for: Sviazinvest, OJSC. Prepared by: Cree Durham Technology Center (DTC) Ticket Number: T
 Ticket Number: T") March 26, 2012 Title: TEMPO 21 Report Prepared for: Sviazinvest, OJSC Prepared by: Cree Durham Technology Center (DTC) Ticket Number: 10806-T Co NVLAP lab code 500070-0 The accreditation of the Cree Durham
March 26, 2012 Title: TEMPO 21 Report Prepared for: Sviazinvest, OJSC Prepared by: Cree Durham Technology Center (DTC) Ticket Number: 10806-T Co NVLAP lab code 500070-0 The accreditation of the Cree Durham
Modeling retinal high and low contrast sensitivity lters. T. Lourens. Abstract
 Modeling retinal high and low contrast sensitivity lters T. Lourens Department of Computer Science University of Groningen P.O. Box 800, 9700 AV Groningen, The Netherlands E-mail: tino@cs.rug.nl Abstract
COMPUTATIONAL INSIGHT IN THE VISUAL GANGLION DYNAMICS
 COMPUTATIONAL INSIGHT IN THE VISUAL GANGLION DYNAMICS D. E. CREANGÃ 1, S. MICLAUS 2 1 Al. I. Cuza University, Faculty of Physics, 11A Blvd. Copou, Iaºi, Romania dorinacreanga@yahoo.com 2 Terrestrial Troupe
SIMPLE REACTION TIMES AND THE BLONDEL-REY LAW Q
 CHAPTER 13 SIMPLE REACTION TIMES AND THE BLONDEL-REY LAW Q INTRODUCTION The process of deriving empirical sensory laws from an entropic or information theoretical base, namely Equation (9.19), will be
Sequence Quantization y. C. B. Atkins, T. J. Flohr, D. P. Hilgenberg, C. A. Bouman, and J. P. Allebach
 Model-Based Color Image Sequence Quantization y C. B. Atkins, T. J. Flohr, D. P. Hilgenberg, C. A. Bouman, and J. P. Allebach School of Electrical Engineering, Purdue University, West Lafayette, IN 4797-1285
Color Image Correction
 FLDE. p. 1/48 Color Image Correction Benasque, September 2007 Vicent Caselles Departament de Tecnologia Universitat Pompeu Fabra joint work with M.Bertalmío, R. Palma, E. Provenzi FLDE. p. 2/48 Overview
Evidence for the stochastic independence of the blue-yellow, red-green and luminance detection mechanisms revealed by subthreshold summation
 Vision Research 39 (1999) 733 745 Evidence for the stochastic independence of the blue-yellow, red-green and luminance detection mechanisms revealed by subthreshold summation Kathy T. Mullen *, Marcel
Radiometry, photometry, measuring color
 Radiometry, photometry, measuring color Lecture notes are done by Géza Várady, based on the lecture notes of Prof. János Schanda varady.geza@mik.pte.hu University of Pécs, Faculty of Engineering and Information
channels to brightness
 Vol. 1, No. 6/June 1993/J. Opt. Soc. Am. A 1373 ndividual differences of the contribution of chromatic channels to brightness Hirohisa Yaguchi, Atsuo Kawada,* Satoshi Shioiri, and Yoichi Miyake Department
What is a receptive field? Why a sensory neuron has such particular RF How a RF was developed?
 What is a receptive field? Why a sensory neuron has such particular RF How a RF was developed? x 1 x 2 x 3 y f w 1 w 2 w 3 T x y = f (wx i i T ) i y The receptive field of a receptor is simply
Note on Posted Slides. History of Light. History of Light
 Note on Posted Slides These are the slides that I intended to show in class on Wed. Mar. 27, 2013. They contain important ideas and questions from your reading. Due to time constraints, I was probably
Opponent Color Spaces
 C. A. Bouman: Digital Image Processing - January 8, 2018 1 Opponent Color Spaces Perception of color is usually not best represented in RGB. A better model of HVS is the so-call opponent color model Opponent
RELATIONSHIP BETWEEN STATIC AND DYNAMIC STEREO ACUITY 1
 Journal of Experimental Psychology 1968, Vol. 76, No. 1, 51-56 RELATIONSHIP BETWEEN STATIC AND DYNAMIC STEREO ACUITY 1 S. M. LURIA AND SEYMOUR WEISSMAN 2 Naval Submarine Medical Center, Naval Submarine
Accommodation to stimuli in peripheral vision
 Vol., No. 8/August 987/J. Opt. Soc. Am. A 8 Accommodation to stimuli in peripheral vision Yuanchao Gu and Gordon E. Legge University of Minnesota, Minneapolis, Minnesota Received November, 98; accepted
Ângelo Cardoso 27 May, Symbolic and Sub-Symbolic Learning Course Instituto Superior Técnico
 BIOLOGICALLY INSPIRED COMPUTER MODELS FOR VISUAL RECOGNITION Ângelo Cardoso 27 May, 2010 Symbolic and Sub-Symbolic Learning Course Instituto Superior Técnico Index Human Vision Retinal Ganglion Cells Simple
Visual Imaging and the Electronic Age Color Science Metamers & Chromaticity Diagrams. Lecture #6 September 7, 2017 Prof. Donald P.
 Visual Imaging and the Electronic Age Color Science Metamers & Chromaticity Diagrams Lecture #6 September 7, 2017 Prof. Donald P. Greenberg Matching the Power Spectrum of the Test Lamp with a Full Set
OBSERVATIONAL ASTROPHYSICS AND DATA ANALYSIS. Vitaly Neustroev
 OBSERVATIONAL ASTROPHYSICS AND DATA ANALYSIS Vitaly Neustroev Contact details Location: FY 272 Telephone: 5531930 Email: vitaly.neustroev@oulu.fi Web: http://cc.oulu.fi/~vneustro/ Content Observational
From CIE 2006 Physiological Model to Improved Age- Dependent and Average Colorimetric Observers
 Dependent and Average Colorimetric Observers Abhijit Sarkar, 1, 2, * Florent Autrusseau, 2 Françoise Viénot, 3 Patrick Le Callet, 2 Laurent Blondé 1 1 Technicolor Research & Innovation, 1 av Belle Fontaine
Supplementary Fig. 1: Light propagation simulation in the human retina. (a) Müller cell
 Müller cell") Supplementary Fig. 1: Light propagation simulation the human reta. (a) Müller cell refractive dex distribution (red) along the cell s length (130 µm), and the refractive profile of the surroundg area (blue).
Supplementary Fig. 1: Light propagation simulation the human reta. (a) Müller cell refractive dex distribution (red) along the cell s length (130 µm), and the refractive profile of the surroundg area (blue).
L ight color influence on obstacle recognition in road lighting. 1. Introduction
 Computer Applications in Electrical Engineering L ight color influence on obstacle recognition in road lighting Małgorzata Górczewska, Sandra Mroczkowska, Przemysław Skrzypczak Poznań University of Technology
The CIE 1997 Interim Colour Appearance Model (Simple Version), CIECAM97s. CIE TC1-34 April, 1998
, CIECAM97s. CIE TC1-34 April, 1998") The CIE 1997 Interim Colour Appearance Model (Simple Version), CIECAM97s CIE TC1-34 April, 1998 i The following members of TC1-34, Testing Colour Appearance Models, took part in the preparation of this
The CIE 1997 Interim Colour Appearance Model (Simple Version), CIECAM97s CIE TC1-34 April, 1998 i The following members of TC1-34, Testing Colour Appearance Models, took part in the preparation of this
Evidence From Human Electroretinogram A and Off Responses That Color Processing Occurs in the Cones
 Evidence From Human Electroretinogram A and Off Responses That Color Processing Occurs in the Cones W. Spileers,* F. Falcao-Reis,^ C. Hogg, and G. B. Arden Purpose. To investigate two apparent anomalies
Core Concept. PowerPoint Lectures to accompany Physical Science, 8e. Chapter 7 Light. New Symbols for this Chapter 3/29/2011
 PowerPoint Lectures to accompany Physical Science, 8e Chapter 7 Light Copyright The McGraw-Hill Companies, Inc. Permission required for reproduction or display. Core Concept Light is electromagnetic radiation
Perception of colour, form, depth and movement; organization of associative visual fields. Seminar Prof Maja Valić
 Perception of colour, form, depth and movement; organization of associative visual fields Seminar Prof Maja Valić Perception of colour, form, depth and movement binding problem in the visual system: how
Announcements. Office hours this Tuesday will be 1-2 pm.
 Announcements Scores for first exam on ICON The average was 53.4 or 67%. The curve is A:80-68, B:64-56, C:52-40, D:36-32, F < 30. Material for problem about Kepler satellite was not adequately covered,