Math 2311 Sections 4.1, 4.2 and 4.3
|
|
|
- MargaretMargaret McCarthy
- 5 years ago
- Views:
Transcription
1 Math 2311 Sections 4.1, 4.2 and Density Curves What do we know about density curves? Example: Suppose we have a density curve defined for defined by the line y = x. Sketch: What percent of observations fall below 1?
2 What is the probability that X 5? Where is the median of this curve?
. The Empirical Rule: The Empirical Rule states if a distribution has a normal distribution, 1.")
3 4.2 - The Normal Distribution A density curve that is symmetric, single peaked and bell shaped is called a normal distribution. The normal distribution with mean µ and standard deviation σ is represented by N(µ, σ). The Empirical Rule: The Empirical Rule states if a distribution has a normal distribution, 1. Approximately 68% of all observations fall within one standard deviation of the mean. 2. Approximately 95% of all observations fall within two standard deviations of the mean. 3. Approximately 99.7% of all observations fall within three standard deviations of the mean.
4 Example: The length of time needed to complete a certain test is normally distributed with mean 60 minutes and standard deviation 10 minutes. What is the probability that someone will take between 40 and 80 minutes to complete the test? Sketch the distribution and shade in the area in question. Find the interval that contains the middle 68% of completion times for all people taking the test. What percent of people take more than 80 minutes to complete the test?
5 What if our values are not exactly within one, two or three standard deviations from the mean? Probabilities for these can still be found a number of ways, one of which we will explore in the next section. Using R, the probability can be found with the command pnorm(x, µ, σ). Note that the command in R only gives the probability that X is less than a given value. If we need to find the probability that X is greater than the given value, we will need to subtract the answer from 1. With the TI-83 and TI-84 calculator, the command is normalcdf(lower_limit, upper_limit, µ, σ). Continuing the example above, What is the probability that someone will take less than 45 minutes to complete the test? What is the probability that someone will take more than 30 minutes to complete the test?
6 How long would it take someone to finish the test if they are in the top10% of the times? Popper If a group of students have test scores that are normally distributed with a mean of 82 and a standard deviation of 4, half of the students made below a grade of: a. 78 b. 74 c. 82 d. 70 e. none of these
7 2. If a student made a grade of 87, what is their percentile rank? a. 68 th percentile b. 84 th percentile c. 90 th percentile d. 52 nd percentile e. none of these 3. Find the probability that someone made less than a grade of 74. a. 5% b. 2.5% c. 95% d. 23% e. none of these

8 4.3 - Standard Normal Calculations As suggested in the previous section, all normal distributions share many common properties. In fact, if change the units to σ and center the graph at μ=0, all normal distributions would be exactly the same. This is called standardizing. If x is an observation from a normal distribution with mean μ and standard deviation σ, the standardized value of x is called the z-score and is computed with the formula below. Z-Score: A z-score tells us how many standard deviations the observed value falls from the mean. We can use z-scores to standardize values that are on different scales to compare them.
9 Example: Jill scores 710 on the mathematics part of the SAT. The distribution of SAT scores in a reference population is N(500, 100). Jack takes the ACT mathematics test and scores 29. ACT scores follow the distribution N(18, 6). Find the standardized scores (zscores) for each. Who do you think performed better on their test?
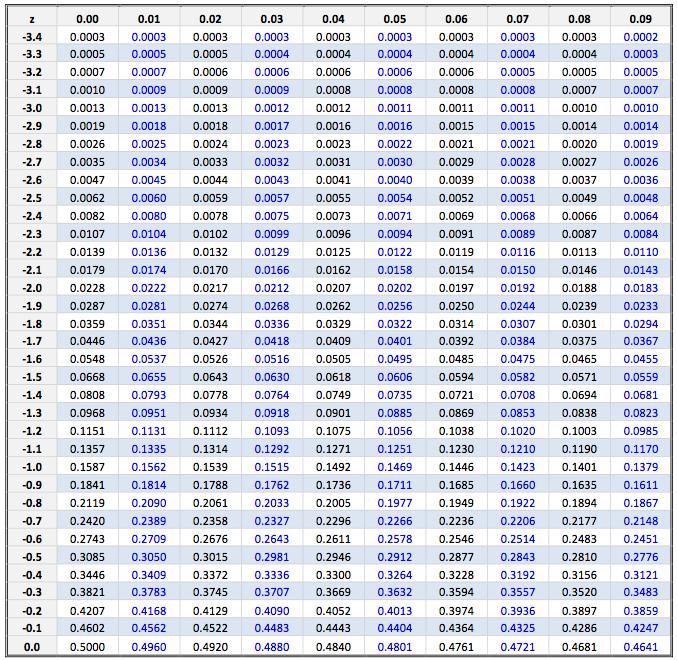
10 When we standardize values, they fit the standard normal distribution. The standard normal distribution is the normal distribution with N(0,1): Table A in your appendix gives areas under the standard normal curve for values of z. The table entry for each value of z gives the area under the curve to the left of z in other words, it gives.
11

12
13 Example: Using Table A, find the following probabilities: A. B. C. D. Now let s repeat with calculator and R-Studio.
14 If we want to use the table for probabilities and are not given z, we must compute the z- score using the formula above. Example: If X has distribution N(90,12), standardize X and use Table A to find the following probabilities: A. B. C. Using the calculator and R, it s a bit easier R-Studio: P(X<x) = pnorm(x, mean, sd) Ti-83/84: normalcdf(low, high, mean, sd)
15 More Examples: The length of time needed to complete a certain test is normally distributed with mean 24 minutes and standard deviation 11 minutes. Find the probability that it will take less than 40 minutes to complete the test.
16 If X is normally distributed with a mean of 30 and a standard deviation of 2, find P(30 X 33.4). Suppose that X is normally distributed with a mean of 60 and a standard deviation of 9. What is P(X 68.73)?
17 Suppose that x is normally distributed with a mean of 20 and a standard deviation of 3. What is P(16.91 x 24.59)? Find a value of c so that P(Z c) = 0.47.
18 Popper A normal density curve has which of the following properties? a. It is symmetric. b. It has a peak centered above its mean. c. The spread of the curve is proportional to its standard deviation. d. All of the properties above are correct. e. None of the properties above are correct. 5. The area under the standard normal curve corresponding to 0.3 <Z<1.6 is a b c
19 d
Statistics Lecture 3
 Statistics 111 - Lecture 3 Continuous Random Variables The probable is what usually happens. (Aristotle ) Moore, McCabe and Craig: Section 4.3,4.5 Continuous Random Variables Continuous random variables
6 THE NORMAL DISTRIBUTION
 CHAPTER 6 THE NORMAL DISTRIBUTION 341 6 THE NORMAL DISTRIBUTION Figure 6.1 If you ask enough people about their shoe size, you will find that your graphed data is shaped like a bell curve and can be described
The empirical ( ) rule
 rule") The empirical (68-95-99.7) rule With a bell shaped distribution, about 68% of the data fall within a distance of 1 standard deviation from the mean. 95% fall within 2 standard deviations of the mean. 99.7%
The empirical (68-95-99.7) rule With a bell shaped distribution, about 68% of the data fall within a distance of 1 standard deviation from the mean. 95% fall within 2 standard deviations of the mean. 99.7%
Probability Distribution for a normal random variable x:
 Chapter5 Continuous Random Variables 5.3 The Normal Distribution Probability Distribution for a normal random variable x: 1. It is and about its mean µ. 2. (the that x falls in the interval a < x < b is
In this chapter, you will study the normal distribution, the standard normal, and applications associated with them.
 The Normal Distribution The normal distribution is the most important of all the distributions. It is widely used and even more widely abused. Its graph is bell-shaped. You see the bell curve in almost
Continuous random variables
 Continuous random variables A continuous random variable X takes all values in an interval of numbers. The probability distribution of X is described by a density curve. The total area under a density
(i) The mean and mode both equal the median; that is, the average value and the most likely value are both in the middle of the distribution.
 The mean and mode both equal the median; that is, the average value and the most likely value are both in the middle of the distribution.") MATH 382 Normal Distributions Dr. Neal, WKU Measurements that are normally distributed can be described in terms of their mean µ and standard deviation σ. These measurements should have the following properties:
MATH 382 Normal Distributions Dr. Neal, WKU Measurements that are normally distributed can be described in terms of their mean µ and standard deviation σ. These measurements should have the following properties:
Section 5.4. Ken Ueda
 Section 5.4 Ken Ueda Students seem to think that being graded on a curve is a positive thing. I took lasers 101 at Cornell and got a 92 on the exam. The average was a 93. I ended up with a C on the test.
Describing Distributions
 Describing Distributions With Numbers April 18, 2012 Summary Statistics. Measures of Center. Percentiles. Measures of Spread. A Summary Statement. Choosing Numerical Summaries. 1.0 What Are Summary Statistics?
Unit 8: Statistics. SOL Review & SOL Test * Test: Unit 8 Statistics
 Name: Block: Unit 8: Statistics Day 1 Sequences Day 2 Series Day 3 Permutations & Combinations Day 4 Normal Distribution & Empirical Formula Day 5 Normal Distribution * Day 6 Standard Normal Distribution
Review. Midterm Exam. Midterm Review. May 6th, 2015 AMS-UCSC. Spring Session 1 (Midterm Review) AMS-5 May 6th, / 24
 AMS-5 May 6th, / 24") Midterm Exam Midterm Review AMS-UCSC May 6th, 2015 Spring 2015. Session 1 (Midterm Review) AMS-5 May 6th, 2015 1 / 24 Topics Topics We will talk about... 1 Review Spring 2015. Session 1 (Midterm Review)
Midterm Exam Midterm Review AMS-UCSC May 6th, 2015 Spring 2015. Session 1 (Midterm Review) AMS-5 May 6th, 2015 1 / 24 Topics Topics We will talk about... 1 Review Spring 2015. Session 1 (Midterm Review)
Describing Distributions With Numbers
 Describing Distributions With Numbers October 24, 2012 What Do We Usually Summarize? Measures of Center. Percentiles. Measures of Spread. A Summary Statement. Choosing Numerical Summaries. 1.0 What Do
The Normal Distribuions
 The Normal Distribuions Sections 5.4 & 5.5 Cathy Poliak, Ph.D. cathy@math.uh.edu Office in Fleming 11c Department of Mathematics University of Houston Lecture 15-3339 Cathy Poliak, Ph.D. cathy@math.uh.edu
Chapter 6 The Standard Deviation as a Ruler and the Normal Model
 Chapter 6 The Standard Deviation as a Ruler and the Normal Model Overview Key Concepts Understand how adding (subtracting) a constant or multiplying (dividing) by a constant changes the center and/or spread
Exploring the Normal Probability Distribution
 Last Name First Name Class Time Chapter 6-1 Chapter 6: The Normal Distribution Bell-shaped probability density function. Graph is symmetric about a vertical line through the mean. Highest point, the peak,
Recall that the standard deviation σ of a numerical data set is given by
 11.1 Using Normal Distributions Essential Question In a normal distribution, about what percent of the data lies within one, two, and three standard deviations of the mean? Recall that the standard deviation
The Normal Distribution. Chapter 6
 + The Normal Distribution Chapter 6 + Applications of the Normal Distribution Section 6-2 + The Standard Normal Distribution and Practical Applications! We can convert any variable that in normally distributed
Math 2311 TEST 2 REVIEW SHEET KEY
 Math 2311 TEST 2 REVIEW SHEET KEY #1 25, Define the following: 1. Continuous random variable 2. Discrete random variable 3. Density curve 4. Uniform density curve 5. Normal distribution 6. Sampling distribution
Z score indicates how far a raw score deviates from the sample mean in SD units. score Mean % Lower Bound
 1 EDUR 8131 Chat 3 Notes 2 Normal Distribution and Standard Scores Questions Standard Scores: Z score Z = (X M) / SD Z = deviation score divided by standard deviation Z score indicates how far a raw score
Standard Normal Calculations
 Standard Normal Calculations Section 4.3 Cathy Poliak, Ph.D. cathy@math.uh.edu Office in Fleming 11c Department of Mathematics University of Houston Lecture 10-2311 Cathy Poliak, Ph.D. cathy@math.uh.edu
Density Curves & Normal Distributions
 Density Curves & Normal Distributions Sections 4.1 & 4.2 Cathy Poliak, Ph.D. cathy@math.uh.edu Office in Fleming 11c Department of Mathematics University of Houston Lecture 9-2311 Cathy Poliak, Ph.D. cathy@math.uh.edu
Normal Distribution: Calculations of Probabilities
 OpenStax-CNX module: m46212 1 Normal Distribution: Calculations of Probabilities Irene Mary Duranczyk Suzanne Loch Janet Stottlemyer Based on Normal Distribution: Calculations of Probabilities by Susan
Math Sec 4 CST Topic 7. Statistics. i.e: Add up all values and divide by the total number of values.
 Measures of Central Tendency Statistics 1) Mean: The of all data values Mean= x = x 1+x 2 +x 3 + +x n n i.e: Add up all values and divide by the total number of values. 2) Mode: Most data value 3) Median:
Chapter (7) Continuous Probability Distributions Examples
 Continuous Probability Distributions Examples") Chapter (7) Continuous Probability Distributions Examples The uniform distribution Example () Australian sheepdogs have a relatively short life.the length of their life follows a uniform distribution between
Chapter (7) Continuous Probability Distributions Examples The uniform distribution Example () Australian sheepdogs have a relatively short life.the length of their life follows a uniform distribution between
4.2 The Normal Distribution. that is, a graph of the measurement looks like the familiar symmetrical, bell-shaped
 4.2 The Normal Distribution Many physiological and psychological measurements are normality distributed; that is, a graph of the measurement looks like the familiar symmetrical, bell-shaped distribution
Section 2.3: One Quantitative Variable: Measures of Spread
 Section 2.3: One Quantitative Variable: Measures of Spread Objectives: 1) Measures of spread, variability a. Range b. Standard deviation i. Formula ii. Notation for samples and population 2) The 95% rule
Chapter 3: The Normal Distributions
 Chapter 3: The Normal Distributions http://www.yorku.ca/nuri/econ2500/econ2500-online-course-materials.pdf graphs-normal.doc / histogram-density.txt / normal dist table / ch3-image Ch3 exercises: 3.2,
Chapter 6. The Standard Deviation as a Ruler and the Normal Model 1 /67
 Chapter 6 The Standard Deviation as a Ruler and the Normal Model 1 /67 Homework Read Chpt 6 Complete Reading Notes Do P129 1, 3, 5, 7, 15, 17, 23, 27, 29, 31, 37, 39, 43 2 /67 Objective Students calculate
Determining the Spread of a Distribution Variance & Standard Deviation
 Determining the Spread of a Distribution Variance & Standard Deviation 1.3 Cathy Poliak, Ph.D. cathy@math.uh.edu Department of Mathematics University of Houston Lecture 3 Lecture 3 1 / 32 Outline 1 Describing
Lesson 100: The Normal Distribution. HL Math - Santowski
 Lesson 100: The Normal Distribution HL Math - Santowski Objectives Introduce the Normal Distribution Properties of the Standard Normal Distribution Introduce the Central Limit Theorem Normal Distributions
MALLOY PSYCH 3000 MEAN & VARIANCE PAGE 1 STATISTICS MEASURES OF CENTRAL TENDENCY. In an experiment, these are applied to the dependent variable (DV)
") MALLOY PSYCH 3000 MEAN & VARIANCE PAGE 1 STATISTICS Descriptive statistics Inferential statistics MEASURES OF CENTRAL TENDENCY In an experiment, these are applied to the dependent variable (DV) E.g., MEASURES
MALLOY PSYCH 3000 MEAN & VARIANCE PAGE 1 STATISTICS Descriptive statistics Inferential statistics MEASURES OF CENTRAL TENDENCY In an experiment, these are applied to the dependent variable (DV) E.g., MEASURES
Unit 4 Probability. Dr Mahmoud Alhussami
 Unit 4 Probability Dr Mahmoud Alhussami Probability Probability theory developed from the study of games of chance like dice and cards. A process like flipping a coin, rolling a die or drawing a card from
Business Statistics: A Decision-Making Approach, 6e. Chapter Goals
 Chapter 4 Student Lecture Notes 4-1 Business Statistics: A Decision-Making Approach 6 th Edition Chapter 4 Using Probability and Probability Distributions Fundamentals of Business Statistics Murali Shanker
The Chi-Square Distributions
 MATH 03 The Chi-Square Distributions Dr. Neal, Spring 009 The chi-square distributions can be used in statistics to analyze the standard deviation of a normally distributed measurement and to test the
C. Incorrect! This symbol means greater than or equal to or at least. D. Correct! This symbol means at most or less than or equal to.
 SAT Math - Problem Drill 10: Inequalities No. 1 of 10 1. Choose the inequality symbol that means at most. (A) > (B) < (C) (D) (E) This symbol means greater than. This symbol means less than. This symbol
Percentile: Formula: To find the percentile rank of a score, x, out of a set of n scores, where x is included:
 AP Statistics Chapter 2 Notes 2.1 Describing Location in a Distribution Percentile: The pth percentile of a distribution is the value with p percent of the observations (If your test score places you in
3/30/2009. Probability Distributions. Binomial distribution. TI-83 Binomial Probability
 Random variable The outcome of each procedure is determined by chance. Probability Distributions Normal Probability Distribution N Chapter 6 Discrete Random variables takes on a countable number of values
6/25/14. The Distribution Normality. Bell Curve. Normal Distribution. Data can be "distributed" (spread out) in different ways.
 in different ways.") The Distribution Normality Unit 6 Sampling and Inference 6/25/14 Algebra 1 Ins2tute 1 6/25/14 Algebra 1 Ins2tute 2 MAFS.912.S-ID.1: Summarize, represent, and interpret data on a single count or measurement
The Distribution Normality Unit 6 Sampling and Inference 6/25/14 Algebra 1 Ins2tute 1 6/25/14 Algebra 1 Ins2tute 2 MAFS.912.S-ID.1: Summarize, represent, and interpret data on a single count or measurement
Elementary Statistics
 Elementary Statistics Q: What is data? Q: What does the data look like? Q: What conclusions can we draw from the data? Q: Where is the middle of the data? Q: Why is the spread of the data important? Q:
STATISTICS - CLUTCH CH.7: THE STANDARD NORMAL DISTRIBUTION (Z-SCORES)
") !! www.clutchprep.com Z-SCORES You have to standardize normal distributions in order to find You standardize by changing all the values into z-scores The z-score represents how many a value is away from
!! www.clutchprep.com Z-SCORES You have to standardize normal distributions in order to find You standardize by changing all the values into z-scores The z-score represents how many a value is away from
The Normal Distribution (Pt. 2)
") Chapter 5 The Normal Distribution (Pt 2) 51 Finding Normal Percentiles Recall that the Nth percentile of a distribution is the value that marks off the bottom N% of the distribution For review, remember
Chapter 5 The Normal Distribution (Pt 2) 51 Finding Normal Percentiles Recall that the Nth percentile of a distribution is the value that marks off the bottom N% of the distribution For review, remember
value mean standard deviation
 Mr. Murphy AP Statistics 2.4 The Empirical Rule and z - Scores HW Pg. 208 #4.45 (a) - (c), 4.46, 4.51, 4.52, 4.73 Objectives: 1. Calculate a z score. 2. Apply the Empirical Rule when appropriate. 3. Calculate
6.3 Use Normal Distributions. Page 399 What is a normal distribution? What is standard normal distribution? What does the z-score represent?
 6.3 Use Normal Distributions Page 399 What is a normal distribution? What is standard normal distribution? What does the z-score represent? Normal Distribution and Normal Curve Normal distribution is one
Density Curves and the Normal Distributions. Histogram: 10 groups
 Density Curves and the Normal Distributions MATH 2300 Chapter 6 Histogram: 10 groups 1 Histogram: 20 groups Histogram: 40 groups 2 Histogram: 80 groups Histogram: 160 groups 3 Density Curve Density Curves
Section 5.1: Probability and area
 Section 5.1: Probability and area Review Normal Distribution s z = x - m s Standard Normal Distribution s=1 m x m=0 z The area that falls in the interval under the nonstandard normal curve is the same
Describing Distributions With Numbers Chapter 12
 Describing Distributions With Numbers Chapter 12 May 1, 2013 What Do We Usually Summarize? Measures of Center. Percentiles. Measures of Spread. A Summary. 1.0 What Do We Usually Summarize? source: Prof.
Math 120 Chapter 3 additional notes
 Math 120 Chapter 3 additional notes MEASURES OF DISPERSION AND NORMAL DISTRIBUTION MEASURES OF DISPERSION In addition to knowing the measures of central tendency, it is often important to know how widely
(i) The mean and mode both equal the median; that is, the average value and the most likely value are both in the middle of the distribution.
 The mean and mode both equal the median; that is, the average value and the most likely value are both in the middle of the distribution.") MATH 183 Normal Distributions Dr. Neal, WKU Measurements that are normally distributed can be described in terms of their mean µ and standard deviation!. These measurements should have the following properties:
MATH 183 Normal Distributions Dr. Neal, WKU Measurements that are normally distributed can be described in terms of their mean µ and standard deviation!. These measurements should have the following properties:
Math 1342 Test 2 Review. Total number of students = = Students between the age of 26 and 35 = = 2012
 Math 1342 Test 2 Review 4) Total number of students = 2041 + 2118 + 1167 + 845 + 226 = 6397 Students between the age of 26 and 35 = 1167 + 845 = 2012 Students who are NOT between the age of 26 and 35 =
MODULE 9 NORMAL DISTRIBUTION
 MODULE 9 NORMAL DISTRIBUTION Contents 9.1 Characteristics of a Normal Distribution........................... 62 9.2 Simple Areas Under the Curve................................. 63 9.3 Forward Calculations......................................
Objective A: Mean, Median and Mode Three measures of central of tendency: the mean, the median, and the mode.
 Chapter 3 Numerically Summarizing Data Chapter 3.1 Measures of Central Tendency Objective A: Mean, Median and Mode Three measures of central of tendency: the mean, the median, and the mode. A1. Mean The
Essential Statistics Chapter 6
 1 Essential Statistics Chapter 6 By Navidi and Monk Copyright 2016 Mark A. Thomas. All rights reserved. 2 Continuous Probability Distributions chapter 5 focused upon discrete probability distributions,
Determining the Spread of a Distribution
 Determining the Spread of a Distribution 1.3-1.5 Cathy Poliak, Ph.D. cathy@math.uh.edu Department of Mathematics University of Houston Lecture 3-2311 Lecture 3-2311 1 / 58 Outline 1 Describing Quantitative
ADMS2320.com. We Make Stats Easy. Chapter 4. ADMS2320.com Tutorials Past Tests. Tutorial Length 1 Hour 45 Minutes
 We Make Stats Easy. Chapter 4 Tutorial Length 1 Hour 45 Minutes Tutorials Past Tests Chapter 4 Page 1 Chapter 4 Note The following topics will be covered in this chapter: Measures of central location Measures
MAT 155. Key Concept. Density Curve
 MAT 155 Dr. Claude Moore Cape Fear Community College Chapter 6 Normal Probability Distributions 6 1 Review and Preview 6 2 The Standard Normal Distribution 6 3 Applications of Normal Distributions 6 4
Summative Assessment #2 for Outer Space and Cyber Space
 Summative Assessment #2 for Outer Space and Cyber Space Table of Contents Item Page Our Planets Aren t Average, Summative Assessment #2 Instructions page 2 Our Planets Aren t Average, Summative Assessment
Determining the Spread of a Distribution
 Determining the Spread of a Distribution 1.3-1.5 Cathy Poliak, Ph.D. cathy@math.uh.edu Department of Mathematics University of Houston Lecture 3-2311 Lecture 3-2311 1 / 58 Outline 1 Describing Quantitative
Announcements. Lecture 5 - Continuous Distributions. Discrete Probability Distributions. Quiz 1
 Announcements Announcements Lecture 5 - Continuous Distributions Statistics 102 Colin Rundel February 3, 2013 HW1 and Lab 1 have been graded and your scores are posted in Gradebook on Sakai (it is good
Describing distributions with numbers
 Describing distributions with numbers A large number or numerical methods are available for describing quantitative data sets. Most of these methods measure one of two data characteristics: The central
Chapter 6 Group Activity - SOLUTIONS
 Chapter 6 Group Activity - SOLUTIONS Group Activity Summarizing a Distribution 1. The following data are the number of credit hours taken by Math 105 students during a summer term. You will be analyzing
Lecture 10/Chapter 8 Bell-Shaped Curves & Other Shapes. From a Histogram to a Frequency Curve Standard Score Using Normal Table Empirical Rule
 Lecture 10/Chapter 8 Bell-Shaped Curves & Other Shapes From a Histogram to a Frequency Curve Standard Score Using Normal Table Empirical Rule From Histogram to Normal Curve Start: sample of female hts
Section 4.4 Z-Scores and the Empirical Rule
 Section 4.4 Z-Scores and the Empirical Rule 1 GPA Example A sample of GPAs of 40 freshman college students appear below (sorted in increasing order) 1.40 1.90 1.90 2.00 2.10 2.10 2.20 2.30 2.30 2.40 2.50
STA 218: Statistics for Management
 Al Nosedal. University of Toronto. Fall 2017 My momma always said: Life was like a box of chocolates. You never know what you re gonna get. Forrest Gump. Simple Example Random Experiment: Rolling a fair
The Standard Deviation as a Ruler and the Normal Model
 The Standard Deviation as a Ruler and the Normal Model Al Nosedal University of Toronto Summer 2017 Al Nosedal University of Toronto The Standard Deviation as a Ruler and the Normal Model Summer 2017 1
Chapter (7) Continuous Probability Distributions Examples Normal probability distribution
 Continuous Probability Distributions Examples Normal probability distribution") Chapter (7) Continuous robability Distributions Examples Normal probability distribution Example () How to find the area under the normal curve? If 50 Find & 6 60.8 50 X 60.8 6 0.8 p 6 0.5 0.464 0.964.8
Chapter (7) Continuous robability Distributions Examples Normal probability distribution Example () How to find the area under the normal curve? If 50 Find & 6 60.8 50 X 60.8 6 0.8 p 6 0.5 0.464 0.964.8
STATISTICS/MATH /1760 SHANNON MYERS
 STATISTICS/MATH 103 11/1760 SHANNON MYERS π 100 POINTS POSSIBLE π YOUR WORK MUST SUPPORT YOUR ANSWER FOR FULL CREDIT TO BE AWARDED π YOU MAY USE A SCIENTIFIC AND/OR A TI-83/84/85/86 CALCULATOR ONCE YOU
Algebra 2. Outliers. Measures of Central Tendency (Mean, Median, Mode) Standard Deviation Normal Distribution (Bell Curves)
 Standard Deviation Normal Distribution (Bell Curves)") Algebra 2 Outliers Measures of Central Tendency (Mean, Median, Mode) Standard Deviation Normal Distribution (Bell Curves) Algebra 2 Notes #1 Chp 12 Outliers In a set of numbers, sometimes there will be
Algebra 2 Outliers Measures of Central Tendency (Mean, Median, Mode) Standard Deviation Normal Distribution (Bell Curves) Algebra 2 Notes #1 Chp 12 Outliers In a set of numbers, sometimes there will be
The Chi-Square Distributions
 MATH 183 The Chi-Square Distributions Dr. Neal, WKU The chi-square distributions can be used in statistics to analyze the standard deviation σ of a normally distributed measurement and to test the goodness
The Central Limit Theorem
 - The Central Limit Theorem Definition Sampling Distribution of the Mean the probability distribution of sample means, with all samples having the same sample size n. (In general, the sampling distribution
Slide 1. Slide 2. Slide 3. Pick a Brick. Daphne. 400 pts 200 pts 300 pts 500 pts 100 pts. 300 pts. 300 pts 400 pts 100 pts 400 pts.
 Slide 1 Slide 2 Daphne Phillip Kathy Slide 3 Pick a Brick 100 pts 200 pts 500 pts 300 pts 400 pts 200 pts 300 pts 500 pts 100 pts 300 pts 400 pts 100 pts 400 pts 100 pts 200 pts 500 pts 100 pts 400 pts
Chapter 6 The Normal Distribution
 Chapter 6 The Normal PSY 395 Oswald Outline s and area The normal distribution The standard normal distribution Setting probable limits on a score/observation Measures related to 2 s and Area The idea
Gamma and Normal Distribuions
 Gamma and Normal Distribuions Sections 5.4 & 5.5 Cathy Poliak, Ph.D. cathy@math.uh.edu Office in Fleming 11c Department of Mathematics University of Houston Lecture 15-3339 Cathy Poliak, Ph.D. cathy@math.uh.edu
6.2 Normal Distribution. Ziad Zahreddine
 6.2 Normal Distribution Importance of Normal Distribution 1. Describes Many Random Processes or Continuous Phenomena 2. Can Be Used to Approximate Discrete Probability Distributions Example: Binomial 3.
Cumulative Frequency & Frequency Density
 For more awesome GCSE and A level resources, visit us at www.savemyexams.co.uk Frequency & Frequency Density Diagrams Question Paper 2 Level IGCSE Subject Maths (0580) Exam Board Cambridge International
Essential Question: What are the standard intervals for a normal distribution? How are these intervals used to solve problems?
 Acquisition Lesson Planning Form Plan for the Concept, Topic, or Skill Normal Distributions Key Standards addressed in this Lesson: MM3D2 Time allotted for this Lesson: Standard: MM3D2 Students will solve
Chapter 1 - Lecture 3 Measures of Location
 Chapter 1 - Lecture 3 of Location August 31st, 2009 Chapter 1 - Lecture 3 of Location General Types of measures Median Skewness Chapter 1 - Lecture 3 of Location Outline General Types of measures What
Biostatistics in Dentistry
 Biostatistics in Dentistry Continuous probability distributions Continuous probability distributions Continuous data are data that can take on an infinite number of values between any two points. Examples
What does a population that is normally distributed look like? = 80 and = 10
 What does a population that is normally distributed look like? = 80 and = 10 50 60 70 80 90 100 110 X Empirical Rule 68% 95% 99.7% 68-95-99.7% RULE Empirical Rule restated 68% of the data values fall within
Chapter 3. Measuring data
 Chapter 3 Measuring data 1 Measuring data versus presenting data We present data to help us draw meaning from it But pictures of data are subjective They re also not susceptible to rigorous inference Measuring
Data Analysis and Statistical Methods Statistics 651
 Data Analysis and Statistical Methods Statistics 651 http://www.stat.tamu.edu/~suhasini/teaching.html Suhasini Subba Rao Review of previous lecture We showed if S n were a binomial random variable, where
Lecture Slides. Elementary Statistics Twelfth Edition. by Mario F. Triola. and the Triola Statistics Series. Section 3.1- #
 Lecture Slides Elementary Statistics Twelfth Edition and the Triola Statistics Series by Mario F. Triola Chapter 3 Statistics for Describing, Exploring, and Comparing Data 3-1 Review and Preview 3-2 Measures
UNIT 14 AREA PROPERTY OF NORMAL DISTRIBUTION
 UNIT 4 AREA PROPERTY OF NORMAL DISTRIBUTION Area Property of Normal Distribution Structure 4. Introduction Objectives 4. Area Property of Normal Distribution 4.3 Fitting of Normal Curve using Area Property
Homework 4 Solutions Math 150
 Homework Solutions Math 150 Enrique Treviño 3.2: (a) The table gives P (Z 1.13) = 0.1292. P (Z > 1.13) = 1 0.1292 = 0.8708. The table yields P (Z 0.18) = 0.571. (c) The table doesn t consider Z > 8 but
Inverse Normal Distribution and Sampling Distributions
 Inverse Normal Distribution and Sampling Distributions Section 4.3 & 4.4 Cathy Poliak, Ph.D. cathy@math.uh.edu Department of Mathematics University of Houston Lecture 11-2311 Cathy Poliak, Ph.D. cathy@math.uh.edu
( )( ) of wins. This means that the team won 74 games.
( ) of wins. This means that the team won 74 games.") AP Statistics Ch. 2 Notes Describing Location in a Distribution Often, we are interested in describing where one observation falls in a distribution in relation to the other observations. The pth percentile
AP Statistics Ch. 2 Notes Describing Location in a Distribution Often, we are interested in describing where one observation falls in a distribution in relation to the other observations. The pth percentile
Identify the scale of measurement most appropriate for each of the following variables. (Use A = nominal, B = ordinal, C = interval, D = ratio.
 Answers to Items from Problem Set 1 Item 1 Identify the scale of measurement most appropriate for each of the following variables. (Use A = nominal, B = ordinal, C = interval, D = ratio.) a. response latency
Name: ID: Rec: Question: Total. Points:
 MATH 125 First Midterm February 22, 2016 ID: Rec: Question: 1 2 3 4 5 6 7 Total Points: 20 20 20 15 10 10 16 111 Score: There are 7 problems in this exam. Make sure that you have them all. Do all of your
Chapter. The Normal Probability Distribution 7/24/2011. Section 7.1 Properties of the Normal Distribution
 Chapter The Normal Probability Distribution 3 7 Section 7.1 Properties of the Normal Distribution 2010 Pearson Prentice Hall. All rights 2010 reserved Pearson Prentice Hall. All rights reserved 7-2 Illustrating
Question. z-scores. What We Will Cover in This Section. On which of the following tests did Pat do best compared to the other students?
 z-scores 9/17/2003 P225 Z-scores 1 What We Will Cover in This Section What a z-score is. Computation. Properties. Assumptions. Uses 9/17/2003 P225 Z-scores 2 Question On which of the following tests did
The response variable depends on the explanatory variable.
 A response variable measures an outcome of study. > dependent variables An explanatory variable attempts to explain the observed outcomes. > independent variables The response variable depends on the explanatory
When should technology be used?
 Using a Graphing Calculator in the Classroom When should technology be used? The graphing calculator is a wonderful tool for teaching concepts. It also can become a crutch. GOOD Examining the effects of
1 Probability Distributions
 1 Probability Distributions In the chapter about descriptive statistics sample data were discussed, and tools introduced for describing the samples with numbers as well as with graphs. In this chapter
Continuous Probability Distributions
 Continuous Probability Distributions Called a Probability density function. The probability is interpreted as "area under the curve." 1) The random variable takes on an infinite # of values within a given
MEASURING THE SPREAD OF DATA: 6F
 CONTINUING WITH DESCRIPTIVE STATS 6E,6F,6G,6H,6I MEASURING THE SPREAD OF DATA: 6F othink about this example: Suppose you are at a high school football game and you sample 40 people from the student section
Ø Set of mutually exclusive categories. Ø Classify or categorize subject. Ø No meaningful order to categorization.
 Statistical Tools in Evaluation HPS 41 Fall 213 Dr. Joe G. Schmalfeldt Types of Scores Continuous Scores scores with a potentially infinite number of values. Discrete Scores scores limited to a specific
Third Grade Report Card Rubric 1 Exceeding 2 Meeting 3 Developing 4 Area of Concern
 Concepts Assessed by Unit and Trimester Units 5, 6, 7, 8 Units 5, 6, 7 Units 5, 6, 7, 8 1 Exceeding 2 Meeting 3 Developing 4 Area of Concern Student exceeds expectations of this unit Student is meeting
Chapter 2: Tools for Exploring Univariate Data
 Stats 11 (Fall 2004) Lecture Note Introduction to Statistical Methods for Business and Economics Instructor: Hongquan Xu Chapter 2: Tools for Exploring Univariate Data Section 2.1: Introduction What is
STAT 200 Chapter 1 Looking at Data - Distributions
 STAT 200 Chapter 1 Looking at Data - Distributions What is Statistics? Statistics is a science that involves the design of studies, data collection, summarizing and analyzing the data, interpreting the
ACMS Statistics for Life Sciences. Chapter 11: The Normal Distributions
 ACMS 20340 Statistics for Life Sciences Chapter 11: The Normal Distributions Introducing the Normal Distributions The class of Normal distributions is the most widely used variety of continuous probability
Homework 7. Name: ID# Section
 Homework 7 Name: ID# Section 1 Find the probabilities for each of the following using the standard normal distribution. 1. P(0 < z < 1.69) 2. P(-1.57 < z < 0) 3. P(z > 1.16) 4. P(z < -1.77) 5. P(-2.46