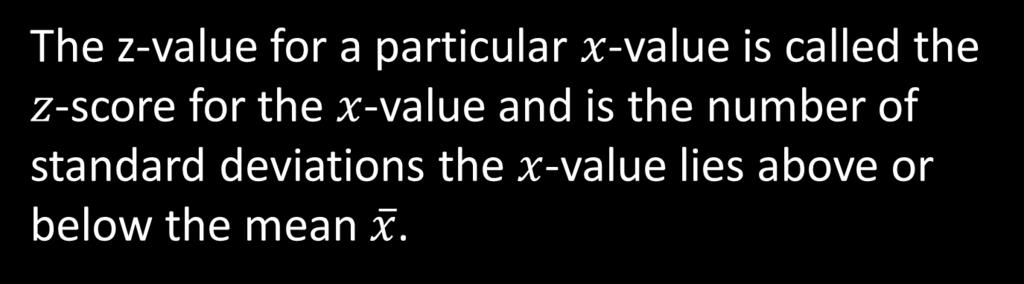
6.3 Use Normal Distributions. Page 399 What is a normal distribution? What is standard normal distribution? What does the z-score represent?
|
|
|
- Homer Gardner
- 5 years ago
- Views:
Transcription
1 6.3 Use Normal Distributions Page 399 What is a normal distribution? What is standard normal distribution? What does the z-score represent?

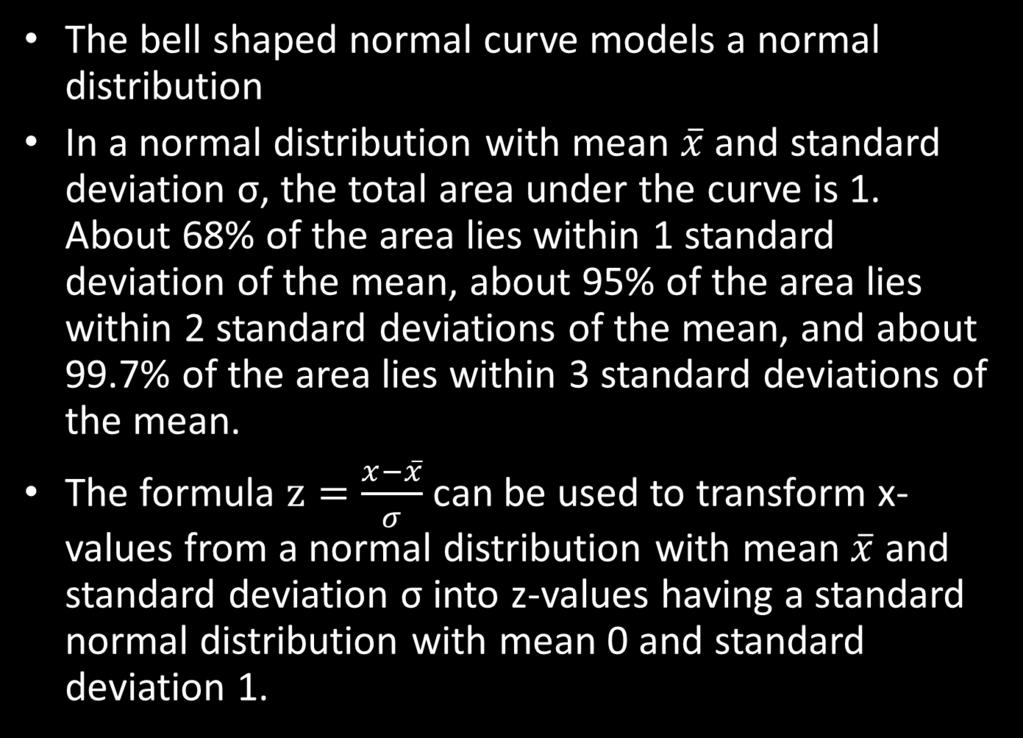
2 Normal Distribution and Normal Curve Normal distribution is one type of probability distribution. It is modeled by a bell shaped curve called a normal curve. A normal curve is symmetric about the mean.
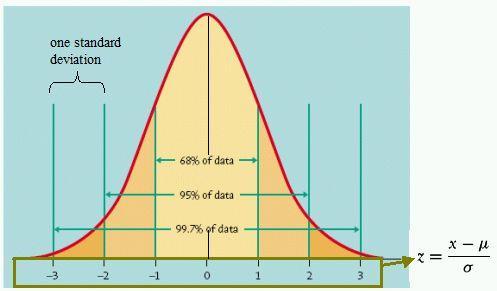
3 Areas Under a Normal Curve A normal distribution with mean x and standard deviation σ has the following properties: The total area under the related normal curve is 1. About 68% of the area lies within 1 standard deviaion of the mean About 95% of the area lies within 2 standard deviations of the mean About 99.7% of the area lies within 3 standard deviations of the mean. See page 399 Key Concept.
4 The total area under the related normal curve is 1. About 68% of the area lies within 1 standard deviaion of the mean About 95% of the area lies within 2 standard deviations of the mean About 99.7% of the area lies within 3 standard deviations of the mean.

5 A normal distribution has mean x and standard deviation σ. For a randomly selected x-value from the distribution, find P(x 2σ x x). SOLUTION The probability that a randomly selected x-value lies between x 2σ and x is the shaded area under the normal curve shown. x x = = 0.475
.")
6 Health The blood cholesterol readings for a group of women are normally distributed with a mean of 172 mg/dl and a standard deviation of 14 mg/dl. a. About what percent of the women have readings between 158 and 186? SOLUTION a. The readings of 158 and 186 represent one standard deviation on either side of the mean, as shown below. So, 68% of the women have readings between 158 and 186 (34% + 34% = 68%). Mg/dl = milligrams per deciliter

7 The blood cholesterol readings for a group of women are normally distributed with a mean of 172 mg/dl and a standard deviation of 14 mg/dl. b. Readings less than 158 are considered desirable. About what percent of the readings are undesirable? b. A reading of 158 is one standard deviation to the left of the mean, as shown. So, the percent of readings that are desirable is 0.15% + 2.3% %, or 16%. Thus 84%of the readings are undesirable.
8 A normal distribution has mean x and standard deviation σ. Find the indicated probability for a randomly selected x-value from the distribution. 1. P( x x ) P( x x) = P( x 3σ) + P( x 2σ) + P( x σ) = ANSWER 0.5
9 A normal distribution has mean x and standard deviation σ. Find the indicated probability for a randomly selected x-value from the distribution. 2. P( x > x ) P( x > x) = P( x + σ) + P( x + 2σ) + P( x + 3σ) = ANSWER 0.5
10 A normal distribution has mean x and standard deviation σ. Find the indicated probability for a randomly selected x-value from the distribution. 3. P( x < x < x + 2σ ) P( x < x< x + 2σ )= P( x+ σ) + P( x + 2σ) = ANSWER 0.475

11 Standard Normal Distribution
12

13 Standard Normal Table
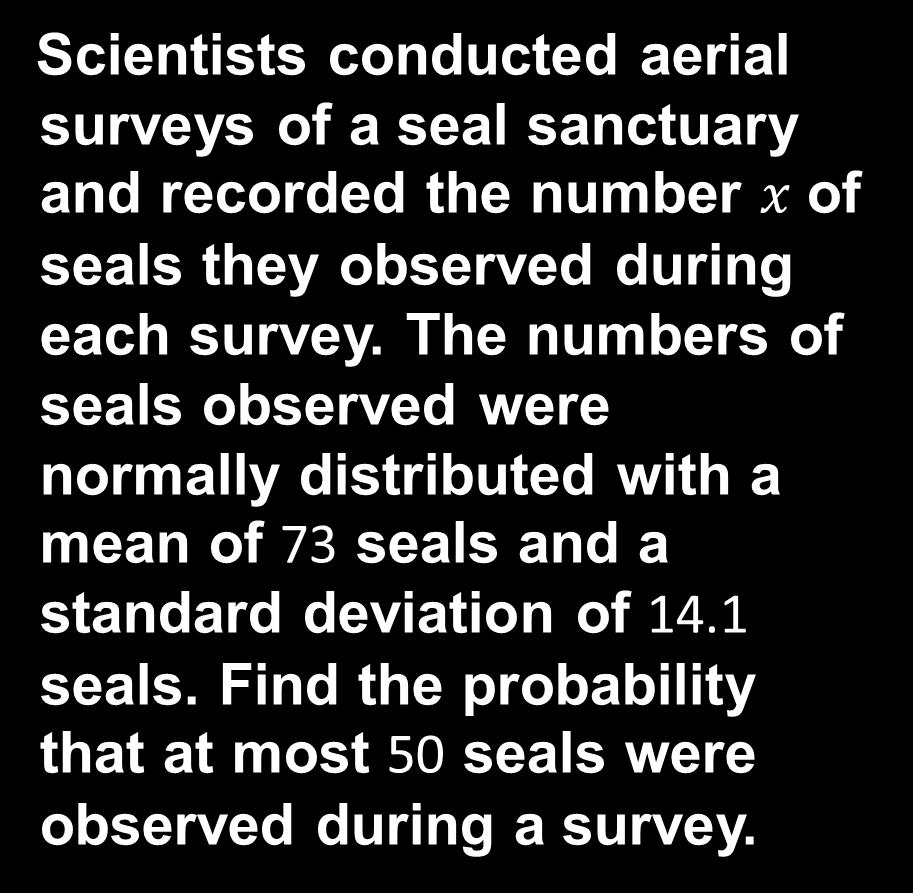

14 Biology
 P(z < 1.6). The table shows that P(z < 1.6) = 0.0548.")
15 SOLUTION STEP 1 Find: the z-score corresponding to an x-value of 50. z= x x = STEP 2 Use: the table to find P(x < 50) P(z < 1.6). The table shows that P(z < 1.6) = So, the probability that at most 50 seals were observed during a survey is about
16 Using the previous problem, find the probability that at most 90 seals were observed during a survey. z= x x = Use: the table to find P(x < 90) P(z < 1.2). The table shows that P(z < 1.2) = So, the probability that at most 90 seals were observed during a survey is about ANSWER
17 9. REASONING: Explain why it makes sense that P(z < 0) = 0.5. ANSWER A z-score of 0 indicates that the z-score and the mean are the same. Therefore, the area under the normal curve is divided into two equal parts with the mean and the z-score being equal to 0.5.
18
19 6.3 Assignment Page 402, 3-14, 19-24
68% 95% 99.7% x x 1 σ. x 1 2σ. x 1 3σ. Find a normal probability
 11.3 a.1, 2A.1.B TEKS Use Normal Distributions Before You interpreted probability distributions. Now You will study normal distributions. Why? So you can model animal populations, as in Example 3. Key
Chapter 3: The Normal Distributions
 Chapter 3: The Normal Distributions http://www.yorku.ca/nuri/econ2500/econ2500-online-course-materials.pdf graphs-normal.doc / histogram-density.txt / normal dist table / ch3-image Ch3 exercises: 3.2,
11. The Normal distributions
 11. The Normal distributions The Practice of Statistics in the Life Sciences Third Edition 2014 W. H. Freeman and Company Objectives (PSLS Chapter 11) The Normal distributions Normal distributions The
Page 312, Exercise 50
 Millersville University Name Answer Key Department of Mathematics MATH 130, Elements of Statistics I, Homework 4 November 5, 2009 Page 312, Exercise 50 Simulation According to the U.S. National Center
Math 2311 Sections 4.1, 4.2 and 4.3
 Math 2311 Sections 4.1, 4.2 and 4.3 4.1 - Density Curves What do we know about density curves? Example: Suppose we have a density curve defined for defined by the line y = x. Sketch: What percent of observations
1) What is the probability that the random variable has a value less than 3? 1)
 What is the probability that the random variable has a value less than 3? 1)") Ch 6 and 7 Worksheet Disclaimer; The actual exam differs NOTE: ON THIS TEST YOU WILL NEED TO USE TABLES (NOT YOUR CALCULATOR) TO FIND PROBABILITIES UNDER THE NORMAL OR CHI SQUARED OR T DISTRIBUTION! SHORT
Ch 6 and 7 Worksheet Disclaimer; The actual exam differs NOTE: ON THIS TEST YOU WILL NEED TO USE TABLES (NOT YOUR CALCULATOR) TO FIND PROBABILITIES UNDER THE NORMAL OR CHI SQUARED OR T DISTRIBUTION! SHORT
Statistics Lecture 3
 Statistics 111 - Lecture 3 Continuous Random Variables The probable is what usually happens. (Aristotle ) Moore, McCabe and Craig: Section 4.3,4.5 Continuous Random Variables Continuous random variables
Chapter (7) Continuous Probability Distributions Examples
 Continuous Probability Distributions Examples") Chapter (7) Continuous Probability Distributions Examples The uniform distribution Example () Australian sheepdogs have a relatively short life.the length of their life follows a uniform distribution between
Chapter (7) Continuous Probability Distributions Examples The uniform distribution Example () Australian sheepdogs have a relatively short life.the length of their life follows a uniform distribution between
ACMS Statistics for Life Sciences. Chapter 11: The Normal Distributions
 ACMS 20340 Statistics for Life Sciences Chapter 11: The Normal Distributions Introducing the Normal Distributions The class of Normal distributions is the most widely used variety of continuous probability
Recall that the standard deviation σ of a numerical data set is given by
 11.1 Using Normal Distributions Essential Question In a normal distribution, about what percent of the data lies within one, two, and three standard deviations of the mean? Recall that the standard deviation
8.1 Frequency Distribution, Frequency Polygon, Histogram page 326
 page 35 8 Statistics are around us both seen and in ways that affect our lives without us knowing it. We have seen data organized into charts in magazines, books and newspapers. That s descriptive statistics!
Chapter 8: Estimating with Confidence
 Chapter 8: Estimating with Confidence Section 8.3 The Practice of Statistics, 4 th edition For AP* STARNES, YATES, MOORE The One-Sample z Interval for a Population Mean In Section 8.1, we estimated the
T test for two Independent Samples. Raja, BSc.N, DCHN, RN Nursing Instructor Acknowledgement: Ms. Saima Hirani June 07, 2016
 T test for two Independent Samples Raja, BSc.N, DCHN, RN Nursing Instructor Acknowledgement: Ms. Saima Hirani June 07, 2016 Q1. The mean serum creatinine level is measured in 36 patients after they received
Homework 7. Name: ID# Section
 Homework 7 Name: ID# Section 1 Find the probabilities for each of the following using the standard normal distribution. 1. P(0 < z < 1.69) 2. P(-1.57 < z < 0) 3. P(z > 1.16) 4. P(z < -1.77) 5. P(-2.46
The Central Limit Theorem
 - The Central Limit Theorem Definition Sampling Distribution of the Mean the probability distribution of sample means, with all samples having the same sample size n. (In general, the sampling distribution
What does a population that is normally distributed look like? = 80 and = 10
 What does a population that is normally distributed look like? = 80 and = 10 50 60 70 80 90 100 110 X Empirical Rule 68% 95% 99.7% 68-95-99.7% RULE Empirical Rule restated 68% of the data values fall within
Continuous random variables
 Continuous random variables A continuous random variable X takes all values in an interval of numbers. The probability distribution of X is described by a density curve. The total area under a density
EQ: What is a normal distribution?
 Unit 5 - Statistics What is the purpose EQ: What tools do we have to assess data? this unit? What vocab will I need? Vocabulary: normal distribution, standard, nonstandard, interquartile range, population
Probability Distribution for a normal random variable x:
 Chapter5 Continuous Random Variables 5.3 The Normal Distribution Probability Distribution for a normal random variable x: 1. It is and about its mean µ. 2. (the that x falls in the interval a < x < b is
13. Sampling distributions
 13. Sampling distributions The Practice of Statistics in the Life Sciences Third Edition 2014 W. H. Freeman and Company Objectives (PSLS Chapter 13) Sampling distributions Parameter versus statistic Sampling
7.1 Sampling Error The Need for Sampling Distributions
 7.1 Sampling Error The Need for Sampling Distributions Tom Lewis Fall Term 2009 Tom Lewis () 7.1 Sampling Error The Need for Sampling Distributions Fall Term 2009 1 / 5 Outline 1 Tom Lewis () 7.1 Sampling
(i) The mean and mode both equal the median; that is, the average value and the most likely value are both in the middle of the distribution.
 The mean and mode both equal the median; that is, the average value and the most likely value are both in the middle of the distribution.") MATH 382 Normal Distributions Dr. Neal, WKU Measurements that are normally distributed can be described in terms of their mean µ and standard deviation σ. These measurements should have the following properties:
MATH 382 Normal Distributions Dr. Neal, WKU Measurements that are normally distributed can be described in terms of their mean µ and standard deviation σ. These measurements should have the following properties:
The MidTerm Next Weak Until the end of Discrete Probability Distribution (Ch 5)
") The MidTerm Next Weak Until the end of Discrete Probability Distribution (Ch 5) 1 1 Chapter 6. Continuous Random Variables Reminder: Continuous random variable takes infinite values Those values can be
The MidTerm Next Weak Until the end of Discrete Probability Distribution (Ch 5) 1 1 Chapter 6. Continuous Random Variables Reminder: Continuous random variable takes infinite values Those values can be
MATH 116 SECOND MIDTERM EXAM Solutions
 1 MATH 116 SECOND MIDTERM EXAM Solutions Fall 24 NAME: INSTRUCTOR: ID NUMBER: SECTION NO: 1. Do not open this exam until you are told to begin. 2. This exam has 9 pages including this cover. There are
6.1 Normal Distribution
 GOALS: 1. Understand properties of: a) Density Curves b) Normal Curves c) Standard Normal Curve 2. Relate area under the curve to proportions of the population represented by the curve. Study Ch. 6.1,
Homework 4 Solutions Math 150
 Homework Solutions Math 150 Enrique Treviño 3.2: (a) The table gives P (Z 1.13) = 0.1292. P (Z > 1.13) = 1 0.1292 = 0.8708. The table yields P (Z 0.18) = 0.571. (c) The table doesn t consider Z > 8 but
Chapter 8: Estimating with Confidence
 Chapter 8: Estimating with Confidence Section 8.3 The Practice of Statistics, 4 th edition For AP* STARNES, YATES, MOORE Chapter 8 Estimating with Confidence n 8.1 Confidence Intervals: The Basics n 8.2
Probability and Samples. Sampling. Point Estimates
 Probability and Samples Sampling We want the results from our sample to be true for the population and not just the sample But our sample may or may not be representative of the population Sampling error
Two sample hypothesis testing
 Statistics February 26, 2014 Debdeep Pati Two sample hypothesis testing 1. Suppose we want to study the relationship between use of oral contraceptives (OC) and level of blood pressure (BP) in women. 2.
Review. A Bernoulli Trial is a very simple experiment:
 Review A Bernoulli Trial is a very simple experiment: Review A Bernoulli Trial is a very simple experiment: two possible outcomes (success or failure) probability of success is always the same (p) the
Sections 3.4 and 3.5
 Sections 3.4 and 3.5 Timothy Hanson Department of Statistics, University of South Carolina Stat 205: Elementary Statistics for the Biological and Life Sciences 1 / 20 Continuous variables So far we ve
Sections 3.4 and 3.5
 Sections 3.4 and 3.5 Shiwen Shen Department of Statistics University of South Carolina Elementary Statistics for the Biological and Life Sciences (STAT 205) Continuous variables So far we ve dealt with
(i) The mean and mode both equal the median; that is, the average value and the most likely value are both in the middle of the distribution.
 The mean and mode both equal the median; that is, the average value and the most likely value are both in the middle of the distribution.") MATH 183 Normal Distributions Dr. Neal, WKU Measurements that are normally distributed can be described in terms of their mean µ and standard deviation!. These measurements should have the following properties:
MATH 183 Normal Distributions Dr. Neal, WKU Measurements that are normally distributed can be described in terms of their mean µ and standard deviation!. These measurements should have the following properties:
Solutions to Additional Questions on Normal Distributions
 Solutions to Additional Questions on Normal Distributions 1.. EPA fuel economy estimates for automobile models tested recently predicted a mean of.8 mpg and a standard deviation of mpg for highway driving.
6 THE NORMAL DISTRIBUTION
 CHAPTER 6 THE NORMAL DISTRIBUTION 341 6 THE NORMAL DISTRIBUTION Figure 6.1 If you ask enough people about their shoe size, you will find that your graphed data is shaped like a bell curve and can be described
3.2 Probability Rules
 3.2 Probability Rules The idea of probability rests on the fact that chance behavior is predictable in the long run. In the last section, we used simulation to imitate chance behavior. Do we always need
Statistics 528: Homework 2 Solutions
 Statistics 28: Homework 2 Solutions.4 There are several gaps in the data, as can be seen from the histogram. Minitab Result: Min Q Med Q3 Max 8 3278 22 2368 2624 Manual Result: Min Q Med Q3 Max 8 338 22.
Section 6-5 THE CENTRAL LIMIT THEOREM AND THE SAMPLING DISTRIBUTION OF. The Central Limit Theorem. Central Limit Theorem: For all samples of
 Section 6-5 The Central Limit Theorem THE CENTRAL LIMIT THEOREM Central Limit Theorem: For all samples of the same size with 30, the sampling distribution of can be approximated by a normal distribution
Algebra 2. Outliers. Measures of Central Tendency (Mean, Median, Mode) Standard Deviation Normal Distribution (Bell Curves)
 Standard Deviation Normal Distribution (Bell Curves)") Algebra 2 Outliers Measures of Central Tendency (Mean, Median, Mode) Standard Deviation Normal Distribution (Bell Curves) Algebra 2 Notes #1 Chp 12 Outliers In a set of numbers, sometimes there will be
Algebra 2 Outliers Measures of Central Tendency (Mean, Median, Mode) Standard Deviation Normal Distribution (Bell Curves) Algebra 2 Notes #1 Chp 12 Outliers In a set of numbers, sometimes there will be
Section 7.1 Properties of the Normal Distribution
 Section 7.1 Properties of the Normal Distribution In Chapter 6, talked about probability distributions. Coin flip problem: Difference of two spinners: The random variable x can only take on certain discrete
Lab #11. Variable B. Variable A Y a b a+b N c d c+d a+c b+d N = a+b+c+d
 BIOS 4120: Introduction to Biostatistics Breheny Lab #11 We will explore observational studies in today s lab and review how to make inferences on contingency tables. We will only use 2x2 tables for today
The Standard Deviation as a Ruler and the Normal Model
 The Standard Deviation as a Ruler and the Normal Model Al Nosedal University of Toronto Summer 2017 Al Nosedal University of Toronto The Standard Deviation as a Ruler and the Normal Model Summer 2017 1
9/19/2012. PSY 511: Advanced Statistics for Psychological and Behavioral Research 1
 PSY 511: Advanced Statistics for Psychological and Behavioral Research 1 The aspect of the data we want to describe/measure is relative position z scores tell us how many standard deviations above or below
What is statistics? Statistics is the science of: Collecting information. Organizing and summarizing the information collected
 What is statistics? Statistics is the science of: Collecting information Organizing and summarizing the information collected Analyzing the information collected in order to draw conclusions Two types
Lesson 100: The Normal Distribution. HL Math - Santowski
 Lesson 100: The Normal Distribution HL Math - Santowski Objectives Introduce the Normal Distribution Properties of the Standard Normal Distribution Introduce the Central Limit Theorem Normal Distributions
Statistics and Sampling distributions
 Statistics and Sampling distributions a statistic is a numerical summary of sample data. It is a rv. The distribution of a statistic is called its sampling distribution. The rv s X 1, X 2,, X n are said
SHORT ANSWER. Write the word or phrase that best completes each statement or answers the question.
 Chapter 7 Exam A Name 1) How do you determine whether to use the z or t distribution in computing the margin of error, E = z α/2 σn or E = t α/2 s n? 1) Use the given degree of confidence and sample data
Content by Week Week of October 14 27
 Content by Week Week of October 14 27 Learning objectives By the end of this week, you should be able to: Understand the purpose and interpretation of confidence intervals for the mean, Calculate confidence
One-sample categorical data: approximate inference
 One-sample categorical data: approximate inference Patrick Breheny October 6 Patrick Breheny Biostatistical Methods I (BIOS 5710) 1/25 Introduction It is relatively easy to think about the distribution
Normal Distribution: Calculations of Probabilities
 OpenStax-CNX module: m46212 1 Normal Distribution: Calculations of Probabilities Irene Mary Duranczyk Suzanne Loch Janet Stottlemyer Based on Normal Distribution: Calculations of Probabilities by Susan
BIOSTATISTICS. Lecture 3 Continuous Probability Distributions. dr. Petr Nazarov
 Genomics Research Unit BIOSTATISTICS Lecture 3 Continuous Probability Distributions dr. Petr Nazarov 7-0-015 6-03-015 petr.nazarov@crp-sante.lu Lecture 3. Continuous probability distributions OUTLINE Lecture
STA 218: Statistics for Management
 Al Nosedal. University of Toronto. Fall 2017 My momma always said: Life was like a box of chocolates. You never know what you re gonna get. Forrest Gump. Simple Example Random Experiment: Rolling a fair
Chapter 6 Sampling Distributions
 Chapter 6 Sampling Distributions Parameter and Statistic A is a numerical descriptive measure of a population. Since it is based on the observations in the population, its value is almost always unknown.
The Normal Model. Copyright 2009 Pearson Education, Inc.
 The Normal Mol Copyright 2009 Pearson Education, Inc. The trick in comparing very different-looking values is to use standard viations as our rulers. The standard viation tells us how the whole collection
Quiz 2 covered materials in Chapter 5 Chapter 6 Chapter 7. Normal Probability Distribution. Continuous Probability. distribution 11/9/2010.
 Quiz covered materials in Chapter 5 Chapter 6 Chapter 7 Normal Probability Distribution Chapter 6 Continuous Probability Distribution Normal Distribution Normal Distribution is symmetrical and bell shaped,
6.2 Normal Distribution. Ziad Zahreddine
 6.2 Normal Distribution Importance of Normal Distribution 1. Describes Many Random Processes or Continuous Phenomena 2. Can Be Used to Approximate Discrete Probability Distributions Example: Binomial 3.
Exploring the Normal Probability Distribution
 Last Name First Name Class Time Chapter 6-1 Chapter 6: The Normal Distribution Bell-shaped probability density function. Graph is symmetric about a vertical line through the mean. Highest point, the peak,
The Normal Distribution Review
 The Normal Distribution Review A. Properties of the Normal Distribution Many continuous variables have distributions that are bell-shaped and are called approximately normally distributed variables. The
Descriptive statistics
 Patrick Breheny February 6 Patrick Breheny to Biostatistics (171:161) 1/25 Tables and figures Human beings are not good at sifting through large streams of data; we understand data much better when it
6/25/14. The Distribution Normality. Bell Curve. Normal Distribution. Data can be "distributed" (spread out) in different ways.
 in different ways.") The Distribution Normality Unit 6 Sampling and Inference 6/25/14 Algebra 1 Ins2tute 1 6/25/14 Algebra 1 Ins2tute 2 MAFS.912.S-ID.1: Summarize, represent, and interpret data on a single count or measurement
The Distribution Normality Unit 6 Sampling and Inference 6/25/14 Algebra 1 Ins2tute 1 6/25/14 Algebra 1 Ins2tute 2 MAFS.912.S-ID.1: Summarize, represent, and interpret data on a single count or measurement
TECHNICAL APPENDIX WITH ADDITIONAL INFORMATION ON METHODS AND APPENDIX EXHIBITS. Ten health risks in this and the previous study were
 Goetzel RZ, Pei X, Tabrizi MJ, Henke RM, Kowlessar N, Nelson CF, Metz RD. Ten modifiable health risk factors are linked to more than one-fifth of employer-employee health care spending. Health Aff (Millwood).
MA 1125 Lecture 33 - The Sign Test. Monday, December 4, Objectives: Introduce an example of a non-parametric test.
 MA 1125 Lecture 33 - The Sign Test Monday, December 4, 2017 Objectives: Introduce an example of a non-parametric test. For the last topic of the semester we ll look at an example of a non-parametric test.
Will Landau. Feb 28, 2013
 Iowa State University The F Feb 28, 2013 Iowa State University Feb 28, 2013 1 / 46 Outline The F The F Iowa State University Feb 28, 2013 2 / 46 The normal (Gaussian) distribution A random variable X is
MAT 155. Key Concept. Density Curve
 MAT 155 Dr. Claude Moore Cape Fear Community College Chapter 6 Normal Probability Distributions 6 1 Review and Preview 6 2 The Standard Normal Distribution 6 3 Applications of Normal Distributions 6 4
12.4. The Normal Distribution: A Problem-Solving Tool
 12.4. The Normal Distribution: A Problem-Solving Tool 1 Objectives A. Find the mean and standard deviation from a normal curve. B. Find the z-score of a measurement from a normally distributed set of data.
Biostatistics in Dentistry
 Biostatistics in Dentistry Continuous probability distributions Continuous probability distributions Continuous data are data that can take on an infinite number of values between any two points. Examples
[ z = 1.48 ; accept H 0 ]
![[ z = 1.48 ; accept H 0 ]](/thumbs/75/71513647.jpg "[ z = 1.48 ; accept H 0 ]") CH 13 TESTING OF HYPOTHESIS EXAMPLES Example 13.1 Indicate the type of errors committed in the following cases: (i) H 0 : µ = 500; H 1 : µ 500. H 0 is rejected while H 0 is true (ii) H 0 : µ = 500; H 1
CH 13 TESTING OF HYPOTHESIS EXAMPLES Example 13.1 Indicate the type of errors committed in the following cases: (i) H 0 : µ = 500; H 1 : µ 500. H 0 is rejected while H 0 is true (ii) H 0 : µ = 500; H 1
Continuous Probability Distributions
 1 Chapter 5 Continuous Probability Distributions 5.1 Probability density function Example 5.1.1. Revisit Example 3.1.1. 11 12 13 14 15 16 21 22 23 24 25 26 S = 31 32 33 34 35 36 41 42 43 44 45 46 (5.1.1)
Assessment Schedule 2011 Statistics and Modelling: Calculate confidence intervals for population parameters (90642)
") NCEA Level 3 Statistics & Modelling (90642) 2011 page 1 of 5 Assessment Schedule 2011 Statistics and Modelling: Calculate confidence intervals for population parameters (90642) Evidence Statement Q Achievement
NCEA Level 3 Statistics & Modelling (90642) 2011 page 1 of 5 Assessment Schedule 2011 Statistics and Modelling: Calculate confidence intervals for population parameters (90642) Evidence Statement Q Achievement
IC 102: Data Analysis and Interpretation
 IC 102: Data Analysis and Interpretation Instructor: Guruprasad PJ Dept. Aerospace Engineering Indian Institute of Technology Bombay Powai, Mumbai 400076 Email: pjguru@aero.iitb.ac.in Phone no.: 2576 7142
The SEQDESIGN Procedure
 SAS/STAT 9.2 User s Guide, Second Edition The SEQDESIGN Procedure (Book Excerpt) This document is an individual chapter from the SAS/STAT 9.2 User s Guide, Second Edition. The correct bibliographic citation
STATPRO Exercises with Solutions. Problem Set A: Basic Probability
 Problem Set A: Basic Probability 1. A tea taster is required to taste and rank three varieties of tea namely Tea A, B and C; according to the tasters preference. (ranking the teas from the best choice
8.4 Application to Economics/ Biology & Probability
 8.4 Application to Economics/ Biology & 8.5 - Probability http://classic.hippocampus.org/course_locat or?course=general+calculus+ii&lesson=62&t opic=2&width=800&height=684&topictitle= Costs+&+probability&skinPath=http%3A%2F%
Probability Distributions: Continuous
 Probability Distributions: Continuous INFO-2301: Quantitative Reasoning 2 Michael Paul and Jordan Boyd-Graber FEBRUARY 28, 2017 INFO-2301: Quantitative Reasoning 2 Paul and Boyd-Graber Probability Distributions:
Continuous Probability Distributions
 1 Chapter 5 Continuous Probability Distributions 5.1 Probability density function Example 5.1.1. Revisit Example 3.1.1. 11 12 13 14 15 16 21 22 23 24 25 26 S = 31 32 33 34 35 36 41 42 43 44 45 46 (5.1.1)
Theoretical Foundations
 Theoretical Foundations Sampling Distribution and Central Limit Theorem Monia Ranalli monia.ranalli@uniroma3.it Ranalli M. Theoretical Foundations - Sampling Distribution and Central Limit Theorem Lesson
3/30/2009. Probability Distributions. Binomial distribution. TI-83 Binomial Probability
 Random variable The outcome of each procedure is determined by chance. Probability Distributions Normal Probability Distribution N Chapter 6 Discrete Random variables takes on a countable number of values
In this chapter, you will study the normal distribution, the standard normal, and applications associated with them.
 The Normal Distribution The normal distribution is the most important of all the distributions. It is widely used and even more widely abused. Its graph is bell-shaped. You see the bell curve in almost
Data Analysis and Statistical Methods Statistics 651
 Data Analysis and Statistical Methods Statistics 651 http://www.stat.tamu.edu/~suhasini/teaching.html Suhasini Subba Rao Review of previous lecture We showed if S n were a binomial random variable, where
The Normal Distribuions
 The Normal Distribuions Sections 5.4 & 5.5 Cathy Poliak, Ph.D. cathy@math.uh.edu Office in Fleming 11c Department of Mathematics University of Houston Lecture 15-3339 Cathy Poliak, Ph.D. cathy@math.uh.edu
5.3 & 5.4 Standard Deviation and Normal Distribution
 5.3 & 5.4 Standard Deviation and Normal Distribution Standard deviation: A measure of how scattered the data values are in relation to the mean. It's always positive. low standard deviation = most data
PHP2510: Principles of Biostatistics & Data Analysis. Lecture X: Hypothesis testing. PHP 2510 Lec 10: Hypothesis testing 1
 PHP2510: Principles of Biostatistics & Data Analysis Lecture X: Hypothesis testing PHP 2510 Lec 10: Hypothesis testing 1 In previous lectures we have encountered problems of estimating an unknown population
The normal distribution
 The normal distribution Patrick Breheny March 3 Patrick Breheny to Biostatistics (BIOS 4120) 1/25 A common histogram shape Histograms of infant mortality rates, heights, and cholesterol levels: Africa
Chapter 3 Probability Distribution
 Chapter 3 Probability Distribution Probability Distributions A probability function is a function which assigns probabilities to the values of a random variable. Individual probability values may be denoted
Lesson 5.4: The Normal Distribution, page 251
 6. For females: Midpoint Salary ($) Frequency 22 5 92 27 5 52 32 5 9 37 5 42 5 4 47 5 52 5 3 57 5 3 x = $27 39.3 = $724.2 For males: Midpoint Salary ($) Frequency 25 86 35 78 45 28 55 2 65 22 75 85 4 95
The Chi-Square Distributions
 MATH 03 The Chi-Square Distributions Dr. Neal, Spring 009 The chi-square distributions can be used in statistics to analyze the standard deviation of a normally distributed measurement and to test the
_~(x_p.)2 CT..}2; I y=--e
2 CT..}2; I y=--e") 25~Ymax 5~Yscl Plotl(Histogram,L 1 ) DispGraph 2~xscl -6~ymin 25~ymax 5~yscl EndPrgm Set up Plot I to be a histogram of listl with a bucket width of 2. Then press ~ [f]] (GRAPH). 2.18 NORMAL DISTRIBUTION
25~Ymax 5~Yscl Plotl(Histogram,L 1 ) DispGraph 2~xscl -6~ymin 25~ymax 5~yscl EndPrgm Set up Plot I to be a histogram of listl with a bucket width of 2. Then press ~ [f]] (GRAPH). 2.18 NORMAL DISTRIBUTION
Chapter 5: Normal Probability Distributions
 Probability and Statistics Mrs. Leahy Chapter 5: Normal Probability Distributions 5.1 Introduction to Normal Distributions and the Standard Normal Distribution What is a Normal Distribution and a Normal
Section 3-3 Measures of Variation
 Section 3-3 Measures of Variation Part B Created by Tom Wegleitner, Centreville, Virginia Slide 2 1 In a data list, every value falls within some number of standard deviations from the mean. Slide 3 Find
Inverse Normal Distribution and Sampling Distributions
 Inverse Normal Distribution and Sampling Distributions Section 4.3 & 4.4 Cathy Poliak, Ph.D. cathy@math.uh.edu Department of Mathematics University of Houston Lecture 11-2311 Cathy Poliak, Ph.D. cathy@math.uh.edu
Section 6-1 Overview. Definition. Definition. Using Area to Find Probability. Area and Probability
 Chapter focus is on: Continuous random variables Normal distributions Figure 6-1 Section 6-1 Overview ( -1 e 2 x-µ σ ) 2 f(x) = σ 2 π Formula 6-1 Slide 1 Section 6-2 The Standard Normal Distribution Key
Stat 6640 Solution to Midterm #2
 Stat 6640 Solution to Midterm #2 1. A study was conducted to examine how three statistical software packages used in a statistical course affect the statistical competence a student achieves. At the end
SAS/STAT 15.1 User s Guide The SEQDESIGN Procedure
 SAS/STAT 15.1 User s Guide The SEQDESIGN Procedure This document is an individual chapter from SAS/STAT 15.1 User s Guide. The correct bibliographic citation for this manual is as follows: SAS Institute
280 CHAPTER 9 TESTS OF HYPOTHESES FOR A SINGLE SAMPLE Tests of Statistical Hypotheses
 280 CHAPTER 9 TESTS OF HYPOTHESES FOR A SINGLE SAMPLE 9-1.2 Tests of Statistical Hypotheses To illustrate the general concepts, consider the propellant burning rate problem introduced earlier. The null
MATH Notebook 2 Spring 2018
 MATH448001 Notebook 2 Spring 2018 prepared by Professor Jenny Baglivo c Copyright 2010 2018 by Jenny A. Baglivo. All Rights Reserved. 2 MATH448001 Notebook 2 3 2.1 Order Statistics and Quantiles...........................
Statistics 2. The Normal Distribution
 Chapter assessment Statistics The Normal Distribution 1. Soup tins have a capacity of 65 ml. The volume of soup, X ml, dispensed into each tin is Normally distributed with mean 610 and standard deviation.
Business Statistics: A Decision-Making Approach, 6e. Chapter Goals
 Chapter 4 Student Lecture Notes 4-1 Business Statistics: A Decision-Making Approach 6 th Edition Chapter 4 Using Probability and Probability Distributions Fundamentals of Business Statistics Murali Shanker
Inference for Distributions Inference for the Mean of a Population
 Inference for Distributions Inference for the Mean of a Population PBS Chapter 7.1 009 W.H Freeman and Company Objectives (PBS Chapter 7.1) Inference for the mean of a population The t distributions The
The Normal Distribution (Pt. 2)
") Chapter 5 The Normal Distribution (Pt 2) 51 Finding Normal Percentiles Recall that the Nth percentile of a distribution is the value that marks off the bottom N% of the distribution For review, remember
Chapter 5 The Normal Distribution (Pt 2) 51 Finding Normal Percentiles Recall that the Nth percentile of a distribution is the value that marks off the bottom N% of the distribution For review, remember
H1 Maths Preliminary Exam Solutions. Section A: Pure Mathematics [35 marks]
![H1 Maths Preliminary Exam Solutions. Section A: Pure Mathematics [35 marks]](/thumbs/77/75889168.jpg "H1 Maths Preliminary Exam Solutions. Section A: Pure Mathematics [35 marks]") RAFFLES INSTITUTION 2010 Year 6 Preliminary Exam HI Mathematics 8864 H1 Maths Preliminary Exam s Section A: Pure Mathematics [35 marks] 1 Find (J(x l)2+3)1 and simplify your answer, dx Hence, evaluate
RAFFLES INSTITUTION 2010 Year 6 Preliminary Exam HI Mathematics 8864 H1 Maths Preliminary Exam s Section A: Pure Mathematics [35 marks] 1 Find (J(x l)2+3)1 and simplify your answer, dx Hence, evaluate