6.2 Normal Distribution. Ziad Zahreddine
|
|
|
- Amberly Conley
- 5 years ago
- Views:
Transcription
1 6.2 Normal Distribution


2 Importance of Normal Distribution 1. Describes Many Random Processes or Continuous Phenomena 2. Can Be Used to Approximate Discrete Probability Distributions Example: Binomial 3. Basis for Classical Statistical Inference


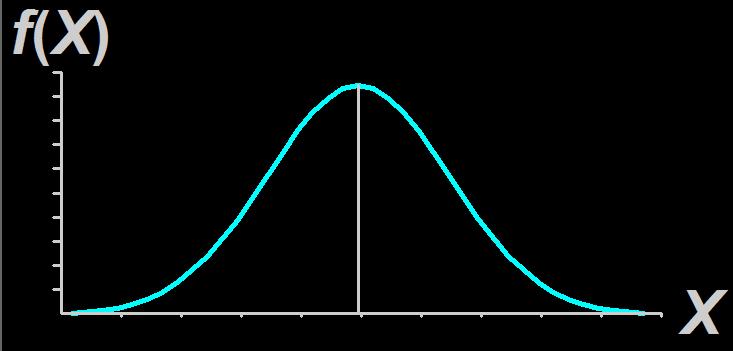
3 Normal Distribution 1. Bell-Shaped & Symmetrical 2. Mean, Median, Mode Are Equal 3. Random Variable Has Infinite Range that cannot be listed. Mean Median Mode

 ( ) x; μ, σ = e x μ σ x = Value")


4 Probability Density Function The Probability Density Function n (x; μ, σ) is given by n where ( ) ( 1 2) ( ) x; μ, σ = e x μ σ x = Value of Random Variable (- < x < ) μ = Mean of the random variable x σ = Population Standard Deviation π = ; e = π [ σ ] 2
 The")


5 Effect of Varying Parameters (μ & σ) The mean and standard deviation affect the flatness and center of the curve, but not the basic shape.
6


![( ) ( ) [ ] dx e d X](/docs-images/92/107944682/images/7-2.jpg "c P d c x = < < 2 2")
, ; ( ) ( = < < d c")
7 6.3 Areas Under the Normal Curve Probability is area under curve! ( ) ( ) [ ] dx e d X c P d c x = < < ) ( σ μ π σ? ), ; ( ) ( = < < d c dx x n d X c P σ μ
8 Standardize the Normal Distribution
 ( x μ ) (")

9 Standardize the Normal Distribution n 1 ( 1 2) ( x μ ) ( x; μ, σ ) = e σ 2π Normal Distribution [ σ ] 2 Infinitely Many Distributions

 ( x μ")


10 Standardize the Normal Distribution n 1 ( 1 2) ( x μ ) ( x; μ, σ ) = e σ 2π Normal Distribution [ σ ] 2 n 1 ( 1 2) z ( z;0,1) = e 2 2π Standard Normal Distribution Infinitely Many Distributions Only One Distribution
 =.0517 Z.00.01.02.03.04.05.06.")
11 The Standard Normal Distribution Table for Standard Normal Distribution contains probability for the area between 0 and z. Partial table below shows components of table Value of z a combination of column and row Probability associated with a particular z value, in this case z=.13, p(0<z<.13) =.0517 Z
 = P(-1.")
12 The Standard Normal Distribution What is P(-1.33 < z < 1.33)? Table gives us area A 1 Symmetry about the mean tell us that A 2 = A 1 P(-1.33 < z < 1.33) = P(-1.33 < z < 0) +P(0 < z < 1.33)= A 2 + A 1 = =.8164

13 The Standard Normal Distribution What is P(z > 1.64)? Table gives us area A 2 Symmetry about the mean tell us that A 2 + A 1 =.5 P(z > 1.64) = A 1 =.5 A 2 = =.0505

14 The Standard Normal Distribution What is P(z <.67)? Table gives us area A 1 Symmetry about the mean tell us that A 2 =.5 P(z <.67) = A 1 + A 2 = =.7486
15 The Standard Normal Distribution What is P( z > 1.96)? P( z > 1.96) = P(z < or z > 1.96) Table gives us area.5 - A 2 =.4750, so A 2 =.0250 Symmetry about the mean tell us that A 2 = A 1 P( z > 1.96) = A 1 + A 2 = =.05
16 Given a standard normal distribution, find the area under the curve that lies (a) to the right of z = 1.84 and (b) Between z = and z = Solution (a) The area to right of z = 1.84 is equal to 0.5 minus the area in the table. That is = (b) The area between 0 and 0.86 is By symmetry the area between and 0 is the same as the area between 0 and 1.97, which is the total area is =
 = 0.1985 is k = 0.52. (b) The area between -0.")
17 Given a standard normal distribution, find the value of k such that (a) P(Z > k) = , and (b) P(k <Z< -0.18) = Solution (a) k lies to the right of 0. Why? The total area to the right of zero is = According to the table, the value of k such that P(0 < Z < k) = is k = (b) The area between and 0 is the same as the area between 0 and 0.18 which is The area between k and 0 becomes: = From the table, the symmetric value of k is Hence k = k k
/1.5 = -1.33 x = 12 z = (12 10)/1.5 = 1.33 z = x μ σ P(8 < x < 12) = P(-1.33 < z < 1.")
18 The Normal Distribution What if values of interest were not standarized? We want to know P (8 < x < 12), with μ = 10 and σ = 1.5 Convert to standard normal using x = 8 z = (8 10)/1.5 = x = 12 z = (12 10)/1.5 = 1.33 z = x μ σ P(8 < x < 12) = P(-1.33 < z < 1.33) = 2(.4082) =.8164
19 The Normal Distribution We want to know P (45 < x < 62), with μ = 50 and σ = 10 Convert to standard normal using x = 45 z = (45 50)/10 = -0.5 x = 62 z = (62 50)/10 = 1.2 z = x μ σ P(45 < x < 62) = P(-0.5 < z < 1.2) = =
20 The Normal Distribution Steps for Finding a Probability Corresponding to a Normal Random Variable Sketch the distribution, locate mean, shade area of interest Convert to standard z values using z = x μ Add z values to the sketch σ Use tables to calculate probabilities, making use of symmetry property where necessary
21 The Normal Distribution Given that X has a normal distribution with mean of 27 and standard deviation of 3, find the probability that X assumes a value less than 20. Z value for x = 20 is P(x < 20) = P(z < -2.33) = =.0099 You could reasonably conclude that this is a rare event

22 The Normal Distribution You can also use the table in reverse to find a z-value that corresponds to a particular probability What is the value of z that will be exceeded only 10% of the time? Look in the body of the table for the value closest to.4, and read the corresponding z value Z = 1.28

23 The Normal Distribution Which values of z enclose the middle 95% of the standard normal z values? Using the symmetry property, z 0 must correspond with a probability of.475 From body of the table, we find that z 0 and z 0 are 1.96 and respectively.
= x0 μ x P 0 z = 0 100,000 P 0 z =. 40 σ 10,000 The z value corresponding with.40 is 1.28. Solving for x 0 x 0 = 100,000 +1.")
24 The Normal Distribution Given a normally distributed variable x with mean 100,000 and standard deviation of 10,000, what value of x identifies the top 10% of the distribution? P ( 100,000 x x0 )= x0 μ x P 0 z = 0 100,000 P 0 z =. 40 σ 10,000 The z value corresponding with.40 is Solving for x 0 x 0 = 100, (10,000) = 100, ,800 = 112,800
= P ( Z < 1.")
25 6.4 Applications of the Normal Distribution Example A certain type of storage battery lasts, on average, 3 years, with a standard deviation of 0.5 year. Assuming that the battery lives are normally distributed, find the probability that a given battery will last less than 2.3 years. Solution z = = P( X < 2. 3)= P ( Z < 1. 4)= P( Z >1.4) = =


 = P( 0.55 < Z < 0.85) = 0.2088+ 0.")
26 Example An electrical firm manufactures light bulbs that have a life, before burn-out, that is normally distributed with mean equal to 800 hours and a standard deviation of 40 hours. Find the probability that a bulb burns between 778 and 834 hours. Solution z1 = = 0.55 and z2 = = P ( 778 < X < 834) = P( 0.55 < Z < 0.85) = = σ = μ = 800
27 Example In an industrial process, the specifications on the diameter of a ball bearing is 3 ± 0.01 cm. The implication is that no part falling outside these specifications will be accepted. It is known that the diameter of a ball bearing has a normal distribution with mean 3 and standard deviation On the average, how many manufactured ball bearings will be scrapped? Solution z1 = = 2 and z2 = = P( 0 < X < 2) = By symmetry P( X > 2) = = P( X > 2 or X < 2) = = Therefore, on the average, 4.56% of manufactured ball bearings will be scrapped.

28 Example Gauges are used to reject all components where a certain dimension is not within the specification 1.50 ± d. It is known that this measurement is normally distributed with mean 1.50 and standard deviation 0.2. Determine the value of d such that the specifications cover 95% of the measurements. Solution From the table, the Z value corresponding to the area 0.95/2 = is Z = In other words P( 0 < Z < 1.96) = ( d) 1.50 Therefore 1.96 = 0.2 From which we obtain d = ( 0.2)(1.96) = d d
29 Example A machine makes electrical resistors having a mean resistance of 40 Ohms and a standard deviation of 2 Ohms. Assuming that the resistance follows a normal distribution and an be measured to any degree of accuracy, what percentage of resistors will have a resistance exceeding 43 Ohms? Solution The Z value corresponding to 43 is From the table P( 0 < Z < 1.5) = Therefore Z = = P (X > 43) = P (Z > 1.5) = 0.5 P (0 < Z < 1.5) = = % of the resistors will have a resistance exceeding 43 Ohms
30 Example The average grade for an exam is 74, and the standard deviation is 7. If 12% of the class are given A s, and the grades are curved to follow a normal distribution, what is the lowest possible A and the highest possible B? Solution = By examining the table, we take Z to be 0.12 the average of 1.17 and Z = = Therefore = X 7 Leading to X = ( 7)(1.175) + 74 = Therefore, the lowest A is 83 and the highest B is 82.
31 Sections 6.1, 6.2, 6.3, 6.4, P. 156 Assignment: 1, 2, 3, 4, 5, 7, 8.
Physics 2020 Lab 5 Intro to Circuits
 Physics 2020 Lab 5 Intro to Circuits Name Section Tues Wed Thu 8am 10am 12pm 2pm 4pm Introduction In this lab, we will be using The Circuit Construction Kit (CCK). CCK is a computer simulation that allows
The Normal Distribution (Pt. 2)
") Chapter 5 The Normal Distribution (Pt 2) 51 Finding Normal Percentiles Recall that the Nth percentile of a distribution is the value that marks off the bottom N% of the distribution For review, remember
Chapter 5 The Normal Distribution (Pt 2) 51 Finding Normal Percentiles Recall that the Nth percentile of a distribution is the value that marks off the bottom N% of the distribution For review, remember
Statistics and Data Analysis in Geology
 Statistics and Data Analysis in Geology 6. Normal Distribution probability plots central limits theorem Dr. Franz J Meyer Earth and Planetary Remote Sensing, University of Alaska Fairbanks 1 2 An Enormously
Math 120 Chapter 3 additional notes
 Math 120 Chapter 3 additional notes MEASURES OF DISPERSION AND NORMAL DISTRIBUTION MEASURES OF DISPERSION In addition to knowing the measures of central tendency, it is often important to know how widely
Unit 4 Probability. Dr Mahmoud Alhussami
 Unit 4 Probability Dr Mahmoud Alhussami Probability Probability theory developed from the study of games of chance like dice and cards. A process like flipping a coin, rolling a die or drawing a card from
Page 312, Exercise 50
 Millersville University Name Answer Key Department of Mathematics MATH 130, Elements of Statistics I, Homework 4 November 5, 2009 Page 312, Exercise 50 Simulation According to the U.S. National Center
Chapter 6 Continuous Probability Distributions
 Math 3 Chapter 6 Continuous Probability Distributions The observations generated by different statistical experiments have the same general type of behavior. The followings are the probability distributions
Math 2311 Sections 4.1, 4.2 and 4.3
 Math 2311 Sections 4.1, 4.2 and 4.3 4.1 - Density Curves What do we know about density curves? Example: Suppose we have a density curve defined for defined by the line y = x. Sketch: What percent of observations
Probability Distribution for a normal random variable x:
 Chapter5 Continuous Random Variables 5.3 The Normal Distribution Probability Distribution for a normal random variable x: 1. It is and about its mean µ. 2. (the that x falls in the interval a < x < b is
Continuous Random Variables
 Continuous Random Variables MATH 130, Elements of Statistics I J. Robert Buchanan Department of Mathematics Fall 2018 Objectives During this lesson we will learn to: use the uniform probability distribution,
MAT 155. Key Concept. Density Curve
 MAT 155 Dr. Claude Moore Cape Fear Community College Chapter 6 Normal Probability Distributions 6 1 Review and Preview 6 2 The Standard Normal Distribution 6 3 Applications of Normal Distributions 6 4
Continuous RVs. 1. Suppose a random variable X has the following probability density function: π, zero otherwise. f ( x ) = sin x, 0 < x < 2
 = sin x, 0 < x < 2") STAT 4 Exam I Continuous RVs Fall 7 Practice. Suppose a random variable X has the following probability density function: f ( x ) = sin x, < x < π, zero otherwise. a) Find P ( X < 4 π ). b) Find µ = E
STAT 4 Exam I Continuous RVs Fall 7 Practice. Suppose a random variable X has the following probability density function: f ( x ) = sin x, < x < π, zero otherwise. a) Find P ( X < 4 π ). b) Find µ = E
Biostatistics in Dentistry
 Biostatistics in Dentistry Continuous probability distributions Continuous probability distributions Continuous data are data that can take on an infinite number of values between any two points. Examples
Some Continuous Probability Distributions: Part I. Continuous Uniform distribution Normal Distribution. Exponential Distribution
 Some Continuous Probability Distributions: Part I Continuous Uniform distribution Normal Distribution Exponential Distribution 1 Chapter 6: Some Continuous Probability Distributions: 6.1 Continuous Uniform
9/19/2012. PSY 511: Advanced Statistics for Psychological and Behavioral Research 1
 PSY 511: Advanced Statistics for Psychological and Behavioral Research 1 The aspect of the data we want to describe/measure is relative position z scores tell us how many standard deviations above or below
Chapter 8: Continuous Probability Distributions
 Chapter 8: Continuous Probability Distributions 8.1 Introduction This chapter continued our discussion of probability distributions. It began by describing continuous probability distributions in general,
Line of symmetry Total area enclosed is 1
 The Normal distribution The Normal distribution is a continuous theoretical probability distribution and, probably, the most important distribution in Statistics. Its name is justified by the fact that
Business Statistics. Chapter 6 Review of Normal Probability Distribution QMIS 220. Dr. Mohammad Zainal
 Department of Quantitative Methods & Information Systems Business Statistics Chapter 6 Review of Normal Probability Distribution QMIS 220 Dr. Mohammad Zainal Chapter Goals After completing this chapter,
280 CHAPTER 9 TESTS OF HYPOTHESES FOR A SINGLE SAMPLE Tests of Statistical Hypotheses
 280 CHAPTER 9 TESTS OF HYPOTHESES FOR A SINGLE SAMPLE 9-1.2 Tests of Statistical Hypotheses To illustrate the general concepts, consider the propellant burning rate problem introduced earlier. The null
1.0 Continuous Distributions. 5.0 Shapes of Distributions. 6.0 The Normal Curve. 7.0 Discrete Distributions. 8.0 Tolerances. 11.
 Chapter 4 Statistics 45 CHAPTER 4 BASIC QUALITY CONCEPTS 1.0 Continuous Distributions.0 Measures of Central Tendency 3.0 Measures of Spread or Dispersion 4.0 Histograms and Frequency Distributions 5.0
Sampling and estimation theories
 Chapter 66 Sampling and estimation theories 66.1 Introduction The concepts of elementary sampling theory and estimation theories introduced in this chapter will provide the basis for a more detailed study
Review. Multiple Choice Identify the letter of the choice that best completes the statement or answers the question.
 Review Multiple Choice Identify the letter of the choice that best completes the statement or answers the question. 1. When more devices are added to a series circuit, the total circuit resistance: a.
Electric Charge and Electric field
 Electric Charge and Electric field ConcepTest 16.1a Electric Charge I Two charged balls are repelling each other as they hang from the ceiling. What can you say about their charges? 1) one is positive,
CIVL 7012/8012. Continuous Distributions
 CIVL 7012/8012 Continuous Distributions Probability Density Function P(a X b) = b ò a f (x)dx Probability Density Function Definition: and, f (x) ³ 0 ò - f (x) =1 Cumulative Distribution Function F(x)
Physics - Grade 12. Revision Sheet for the Final Exam / Second Term. Academic Year: 2018/2019. Student s Name:.. Date: /3/2018
 Physics - Grade 12 Revision Sheet for the Final Exam / Second Term Academic Year: 2018/2019 Student s Name:.. Date: /3/2018 Required Material: Chapter 18: Sections 1,2 & 3 (Textbook Pages: 628-661) Chapter
Electric Current, Resistance and Resistivity. Brief otes
 Electric current, resistance and restivity Electric Current, esistance and esistivity In This small e-book we will learn all we need to know about current electricity but in short and then we ll have some
Negative z-scores: cumulative from left. x z
 Exam #3 Review Chapter 6 Normal Probability Distributions 1 6-2 The Standard Normal Distribution 1 2 Because the total area under the density curve is equal to 1, there is a correspondence between area
4 Electric circuits. Serial and parallel resistors V 3 V 2 V Serial connection of resistors:
 4 lectric circuits PHY67 Spring 006 Serial and parallel resistors Serial connection of resistors: As the current I through each of serially connected resistors is the same, one can use Ohm s law and write...
Chapter 11 Sampling Distribution. Stat 115
 Chapter 11 Sampling Distribution Stat 115 1 Definition 11.1 : Random Sample (finite population) Suppose we select n distinct elements from a population consisting of N elements, using a particular probability
6/25/14. The Distribution Normality. Bell Curve. Normal Distribution. Data can be "distributed" (spread out) in different ways.
 in different ways.") The Distribution Normality Unit 6 Sampling and Inference 6/25/14 Algebra 1 Ins2tute 1 6/25/14 Algebra 1 Ins2tute 2 MAFS.912.S-ID.1: Summarize, represent, and interpret data on a single count or measurement
The Distribution Normality Unit 6 Sampling and Inference 6/25/14 Algebra 1 Ins2tute 1 6/25/14 Algebra 1 Ins2tute 2 MAFS.912.S-ID.1: Summarize, represent, and interpret data on a single count or measurement
Section 5.4. Ken Ueda
 Section 5.4 Ken Ueda Students seem to think that being graded on a curve is a positive thing. I took lasers 101 at Cornell and got a 92 on the exam. The average was a 93. I ended up with a C on the test.
Using the z-table: Given an Area, Find z ID1050 Quantitative & Qualitative Reasoning
 Using the -Table: Given an, Find ID1050 Quantitative & Qualitative Reasoning between mean and beyond 0.0 0.000 0.500 0.1 0.040 0.460 0.2 0.079 0.421 0.3 0.118 0.382 0.4 0.155 0.345 0.5 0.192 0.309 0.6
STAT509: Continuous Random Variable
 University of South Carolina September 23, 2014 Continuous Random Variable A continuous random variable is a random variable with an interval (either finite or infinite) of real numbers for its range.
Chapter 5: Normal Probability Distributions
 Probability and Statistics Mrs. Leahy Chapter 5: Normal Probability Distributions 5.1 Introduction to Normal Distributions and the Standard Normal Distribution What is a Normal Distribution and a Normal
Physics 9 Monday, April 7, 2014
 Physics 9 Monday, April 7, 2014 Handing out HW11 today, due Friday. Finishes induced emf; starts circuits. For today: concepts half of Ch31 (electric circuits); read equations half for Wednesday. Annotated
ME3620. Theory of Engineering Experimentation. Spring Chapter IV. Decision Making for a Single Sample. Chapter IV
 Theory of Engineering Experimentation Chapter IV. Decision Making for a Single Sample Chapter IV 1 4 1 Statistical Inference The field of statistical inference consists of those methods used to make decisions
Physics 212. Lecture 9. Electric Current
 Physics 212 Lecture 9 Electric Current Exam Here, Tuesday, June 26, 8 9:30 AM Will begin at 7:30 for those who must leave by 9. Office hours 1-7 PM, Rm 232 Loomis Bring your ID! Physics 212 Lecture 9,
(i) The mean and mode both equal the median; that is, the average value and the most likely value are both in the middle of the distribution.
 The mean and mode both equal the median; that is, the average value and the most likely value are both in the middle of the distribution.") MATH 183 Normal Distributions Dr. Neal, WKU Measurements that are normally distributed can be described in terms of their mean µ and standard deviation!. These measurements should have the following properties:
MATH 183 Normal Distributions Dr. Neal, WKU Measurements that are normally distributed can be described in terms of their mean µ and standard deviation!. These measurements should have the following properties:
Quiz 2 covered materials in Chapter 5 Chapter 6 Chapter 7. Normal Probability Distribution. Continuous Probability. distribution 11/9/2010.
 Quiz covered materials in Chapter 5 Chapter 6 Chapter 7 Normal Probability Distribution Chapter 6 Continuous Probability Distribution Normal Distribution Normal Distribution is symmetrical and bell shaped,
Introduction to Probability and Statistics Twelfth Edition
 Introduction to Probability and Statistics Twelfth Edition Robert J. Beaver Barbara M. Beaver William Mendenhall Presentation designed and written by: Barbara M. Beaver Introduction to Probability and
PHYSICS 11. Review What is the critical angle for a glass that has an index of refraction of 1.52?
 Waves Review 4 1. Explain, with the help of a sketch, what each of these terms means with respect to waves: (a) crest; (b) trough; (c) wavelength; (d) frequency; (e) amplitude. 2. A dog wags its tail 50
Math 140 Introductory Statistics
 Box Plots Math 140 Introductory Statistics Professor B. Ábrego Lecture 6 Sections 2.3, 2.4, and 2.5 11,12,20,25,30,30,30,32,35, 39,40,40,40,42,45,48,50,70. = 11 Q 1 = 30 Median = 37 Q 3 = 42 = 70. = 70
This is Continuous Random Variables, chapter 5 from the book Beginning Statistics (index.html) (v. 1.0).
 (v. 1.0).") This is Continuous Random Variables, chapter 5 from the book Beginning Statistics (index.html) (v. 1.0). This book is licensed under a Creative Commons by-nc-sa 3.0 (http://creativecommons.org/licenses/by-nc-sa/
This is Continuous Random Variables, chapter 5 from the book Beginning Statistics (index.html) (v. 1.0). This book is licensed under a Creative Commons by-nc-sa 3.0 (http://creativecommons.org/licenses/by-nc-sa/
Test 2 VERSION B STAT 3090 Spring 2017
 Multiple Choice: (Questions 1 20) Answer the following questions on the scantron provided using a #2 pencil. Bubble the response that best answers the question. Each multiple choice correct response is
CHAPTER 6 SOME CONTINUOUS PROBABILITY DISTRIBUTIONS. 6.2 Normal Distribution. 6.1 Continuous Uniform Distribution
 CHAPTER 6 SOME CONTINUOUS PROBABILITY DISTRIBUTIONS Recall that a continuous random variable X is a random variable that takes all values in an interval or a set of intervals. The distribution of a continuous
Student ID Number. Part I. Lecture Multiple Choice (43 points total)
") Name Student ID Number Part I. Lecture Multiple Choice (43 points total). (5 pts.) The voltage between the cathode and the screen of a television set is 22 kv. If we assume a speed of zero for an electron
Name Student ID Number Part I. Lecture Multiple Choice (43 points total). (5 pts.) The voltage between the cathode and the screen of a television set is 22 kv. If we assume a speed of zero for an electron
Math/Stat 352 Lecture 9. Section 4.5 Normal distribution
 Math/Stat 352 Lecture 9 Section 4.5 Normal distribution 1 Abraham de Moivre, 1667-1754 Pierre-Simon Laplace (1749 1827) A French mathematician, who introduced the Normal distribution in his book The doctrine
IB Math Standard Level Year 1: Final Exam Review Alei - Desert Academy
 IB Math Standard Level Year : Final Exam Review Alei - Desert Academy 0- Standard Level Year Final Exam Review Name: Date: Class: You may not use a calculator on problems #- of this review.. Consider the
Chapter (7) Continuous Probability Distributions Examples
 Continuous Probability Distributions Examples") Chapter (7) Continuous Probability Distributions Examples The uniform distribution Example () Australian sheepdogs have a relatively short life.the length of their life follows a uniform distribution between
Chapter (7) Continuous Probability Distributions Examples The uniform distribution Example () Australian sheepdogs have a relatively short life.the length of their life follows a uniform distribution between
Business Statistics Midterm Exam Fall 2015 Russell. Please sign here to acknowledge
 Business Statistics Midterm Exam Fall 5 Russell Name Do not turn over this page until you are told to do so. You will have hour and 3 minutes to complete the exam. There are a total of points divided into
Chapter 4: Continuous Probability Distributions
 Chapter 4: Continuous Probability Distributions Seungchul Baek Department of Statistics, University of South Carolina STAT 509: Statistics for Engineers 1 / 57 Continuous Random Variable A continuous random
General Physics II (PHYS 104) Exam 2: March 21, 2002
 Exam 2: March 21, 2002") General Physics II (PHYS 104) Exam 2: March 21, 2002 Name: Multiple Choice (3 points each): Answer the following multiple choice questions. Clearly circle the response (or responses) that provides the
General Physics II (PHYS 104) Exam 2: March 21, 2002 Name: Multiple Choice (3 points each): Answer the following multiple choice questions. Clearly circle the response (or responses) that provides the
AP Physics C Electricity & Magnetism Mid Term Review
 AP Physics C Electricity & Magnetism Mid Term Review 1984 37. When lighted, a 100-watt light bulb operating on a 110-volt household circuit has a resistance closest to (A) 10-2 Ω (B) 10-1 Ω (C) 1 Ω (D)
P202 Practice Exam 2 Spring 2004 Instructor: Prof. Sinova
 P202 Practice Exam 2 Spring 2004 Instructor: Prof. Sinova Name: Date: (5)1. How many electrons flow through a battery that delivers a current of 3.0 A for 12 s? A) 4 B) 36 C) 4.8 10 15 D) 6.4 10 18 E)
Agenda for Today. Elements of Physics II. Resistance Resistors Series Parallel Ohm s law Electric Circuits. Current Kirchoff s laws
 Resistance Resistors Series Parallel Ohm s law Electric Circuits Physics 132: Lecture e 17 Elements of Physics II Current Kirchoff s laws Agenda for Today Physics 201: Lecture 1, Pg 1 Clicker Question
52 VOLTAGE, CURRENT, RESISTANCE, AND POWER
 52 VOLTAGE, CURRENT, RESISTANCE, AND POWER 1. What is voltage, and what are its units? 2. What are some other possible terms for voltage? 3. Batteries create a potential difference. The potential/voltage
Physics Circuits: Series
 FACULTY OF EDUCATION Department of Curriculum and Pedagogy Physics Circuits: Series Science and Mathematics Education Research Group Supported by UBC Teaching and Learning Enhancement Fund 2012-2013 Series
Procedure for Graphing Polynomial Functions
 Procedure for Graphing Polynomial Functions P(x) = a nx n + a n-1x n-1 + + a 1x + a 0 To graph P(x): As an example, we will examine the following polynomial function: P(x) = 2x 3 3x 2 23x + 12 1. Determine
Chapter 4: Continuous Random Variable
 Chapter 4: Continuous Random Variable Shiwen Shen University of South Carolina 2017 Summer 1 / 57 Continuous Random Variable A continuous random variable is a random variable with an interval (either finite
Lab 4. Current, Voltage, and the Circuit Construction Kit
 Physics 2020, Spring 2009 Lab 4 Page 1 of 8 Your name: Lab section: M Tu Wed Th F TA name: 8 10 12 2 4 Lab 4. Current, Voltage, and the Circuit Construction Kit The Circuit Construction Kit (CCK) is a
Continuous Random Variables
 MATH 38 Continuous Random Variables Dr. Neal, WKU Throughout, let Ω be a sample space with a defined probability measure P. Definition. A continuous random variable is a real-valued function X defined
Standard Normal Curve Areas z
 Table A.3 Standard Normal Curve Areas z.00.01.02.03.04.09-1.2 0.1151 0.1131 0.1112 0.1094 0.1075 0.0985-1.1 0.1357 0.1335 0.1314 0.1292 0.1271 0.1170 1.6 0.9452 0.9463 0.9474 0.9484 0.9495 0.9545 1.7 0.9554
STAT 231 Homework 5 Solutions
 Will Landau September 26, 2011 STAT 231 Homework 5 Solutions Exercise 5.1 (Devore 4.11). f. E(X) = xf(x)dx = xf (x)dx = 2 0 x x 2 dx = (1/2) 2 0 x2 dx = [ ] 2 = 8 6 1.333 x 3 6 0 g. E(X 2 ) = x2 f(x)dx
104 Practice Exam 1-2/21/02
 104 Practice Exam 1-2/21/02 1. One mole of a substance contains 6.02 > 10 23 protons and an equal number of electrons. If the protons could somehow be separated from the electrons and placed in separate
Physics 010 Midterm #2
 Physics 010 Midterm #2 Thursday April 2, 8:30 10:00am This midterm is closed book. No books or notes allowed. Calculators are allowed There are 10 questions on this midterm, with marks noted beside each
Applied Statistics I
 Applied Statistics I (IMT224β/AMT224β) Department of Mathematics University of Ruhuna A.W.L. Pubudu Thilan Department of Mathematics University of Ruhuna Applied Statistics I(IMT224β/AMT224β) 1/158 Chapter
MAT 146. Semester Exam Part II 100 points (Part II: 50 points) Calculator Used Impact on Course Grade: approximately 30% Score
 Calculator Used Impact on Course Grade: approximately 30% Score") MAT 146 Semester Exam Part II Name 100 points (Part II: 50 points) Calculator Used Impact on Course Grade: approximately 30% Score Questions (17) through (26) are each worth 5 points. See the grading rubric
MAT 146 Semester Exam Part II Name 100 points (Part II: 50 points) Calculator Used Impact on Course Grade: approximately 30% Score Questions (17) through (26) are each worth 5 points. See the grading rubric
Recall that the standard deviation σ of a numerical data set is given by
 11.1 Using Normal Distributions Essential Question In a normal distribution, about what percent of the data lies within one, two, and three standard deviations of the mean? Recall that the standard deviation
4Continuous Random. Variables and Probability Distributions CHAPTER OUTLINE LEARNING OBJECTIVES
 4Continuous Random Variables and Probability Distributions CHAPTER OUTLINE 4-1 CONTINUOUS RANDOM VARIABLES 4-2 PROBABILITY DISTRIBUTIONS AND PROBABILITY DENSITY FUNCTIONS 4-3 CUMULATIVE DISTRIBUTION FUNCTIONS
Z-tables. January 12, This tutorial covers how to find areas under normal distributions using a z-table.
 Z-tables January 12, 2019 Contents The standard normal distribution Areas above Areas below the mean Areas between two values of Finding -scores from areas Z tables in R: Questions This tutorial covers
OPIM 303, Managerial Statistics H Guy Williams, 2006
 OPIM 303 Lecture 6 Page 1 The height of the uniform distribution is given by 1 b a Being a Continuous distribution the probability of an exact event is zero: 2 0 There is an infinite number of points in
Instructions: Do not open this examination until the proctor tells you to begin. Read
 University of Maryland Department of Physics Physics 122 Dr. David Noyes: Exam 2 Make up /25 + /30+ /45 Instructions: Do not open this examination until the proctor tells you to begin. Read these instructions
10/14/2018. Current. Current. QuickCheck 30.3
 Current If QCurrent is the total amount of charge that has moved past a point in a wire, we define the current I in the wire to be the rate of charge flow: The SI unit for current is the coulomb per second,
Sections 6.1 and 6.2: The Normal Distribution and its Applications
 Sections 6.1 and 6.2: The Normal Distribution and its Applications Definition: A normal distribution is a continuous, symmetric, bell-shaped distribution of a variable. The equation for the normal distribution
Business Statistics MEDIAN: NON- PARAMETRIC TESTS
 Business Statistics MEDIAN: NON- PARAMETRIC TESTS CONTENTS Hypotheses on the median The sign test The Wilcoxon signed ranks test Old exam question HYPOTHESES ON THE MEDIAN The median is a central value
Calculus Relationships in AP Physics C: Electricity and Magnetism
 C: Electricity This chapter focuses on some of the quantitative skills that are important in your C: Mechanics course. These are not all of the skills that you will learn, practice, and apply during the
LESSON 5: ELECTRICITY II
 LESSON 5: ELECTRICITY II The first two points are a review of the previous lesson 1.1.ELECTRIC CHARGE - Electric charge is a property of all objects and is responsible for electrical phenomena. -All matter
CHAPTER 1. Introduction
 CHAPTER 1 Introduction Engineers and scientists are constantly exposed to collections of facts, or data. The discipline of statistics provides methods for organizing and summarizing data, and for drawing
MATH 117 Statistical Methods for Management I Chapter Three
 Jubail University College MATH 117 Statistical Methods for Management I Chapter Three This chapter covers the following topics: I. Measures of Center Tendency. 1. Mean for Ungrouped Data (Raw Data) 2.
Electricity. Prepared by Juan Blázquez, Alissa Gildemann. Electric charge is a property of all objects. It is responsible for electrical phenomena.
 Unit 11 Electricity 1. Electric charge Electric charge is a property of all objects. It is responsible for electrical phenomena. Electrical phenomena are caused by the forces of attraction and repulsion.
Introduction to Statistical Data Analysis Lecture 3: Probability Distributions
 Introduction to Statistical Data Analysis Lecture 3: Probability Distributions James V. Lambers Department of Mathematics The University of Southern Mississippi James V. Lambers Statistical Data Analysis
Section 8.5 The Normal Distribution
 Section 8.5 The Normal Distribution Properties of the Normal Distribution Curve 1. We denote the normal random variable with X = x. 2. The curve has a peak at x = µ. 3. The curve is symmetric about the
8.4 Application to Economics/ Biology & Probability
 8.4 Application to Economics/ Biology & 8.5 - Probability http://classic.hippocampus.org/course_locat or?course=general+calculus+ii&lesson=62&t opic=2&width=800&height=684&topictitle= Costs+&+probability&skinPath=http%3A%2F%
PHYS 2212 (Modern) Review. Electric Force and Fields
 Review. Electric Force and Fields") PHYS 2212 (Modern) Review Electric Force and Fields A permanent dipole and a charged particle lie on the x-axis and are separated by a distance d as indicated in the figure. The dipole consists of positive
PHYS 2212 (Modern) Review Electric Force and Fields A permanent dipole and a charged particle lie on the x-axis and are separated by a distance d as indicated in the figure. The dipole consists of positive
PhysicsAndMathsTutor.com
 1. Philip and James are racing car drivers. Philip s lap times, in seconds, are normally distributed with mean 90 and variance 9. James lap times, in seconds, are normally distributed with mean 91 and
Test 2 VERSION A STAT 3090 Fall 2017
 Multiple Choice: (Questions 1 20) Answer the following questions on the scantron provided using a #2 pencil. Bubble the response that best answers the question. Each multiple choice correct response is
Chapter 25: Electric Current
 Chapter 25: Electric Current Conductors and Charge Carriers Consider a conducting piece of metal: The valence electrons are weakly bound to the nuclei form a fluidlike sea of electrons that can move through
Chapter 24: Electric Current
 Chapter 24: Electric Current Electric current Electric current is a net flow of electric charge. Quantitatively, current is the rate at which charge crosses a given area. I = dq dt dq = q(n AL)=q(n Av
ELECTRIC CIRCUITS. Checklist. Exam Questions
 ELECTRIC CIRCUITS Checklist Make sure you can. State Ohm's law in words. Determine relationship between current, potential difference and resistance at constant temperature using a simple circuit Draw,
1. A machine produces packets of sugar. The weights in grams of thirty packets chosen at random are shown below.
 No Gdc 1. A machine produces packets of sugar. The weights in grams of thirty packets chosen at random are shown below. Weight (g) 9.6 9.7 9.8 9.9 30.0 30.1 30. 30.3 Frequency 3 4 5 7 5 3 1 Find unbiased
IB Mathematics HL Year 2 Unit 7 (Core Topic 6: Probability and Statistics) Valuable Practice
 Valuable Practice") IB Mathematics HL Year 2 Unit 7 (Core Topic 6: Probability and Statistics) Valuable Practice 1. We have seen that the TI-83 calculator random number generator X = rand defines a uniformly-distributed random
IB Mathematics HL Year 2 Unit 7 (Core Topic 6: Probability and Statistics) Valuable Practice 1. We have seen that the TI-83 calculator random number generator X = rand defines a uniformly-distributed random
Continuous RVs. 1. Suppose a random variable X has the following probability density function: π, zero otherwise. f ( x ) = sin x, 0 < x < 2
 = sin x, 0 < x < 2") STAT 4 Exam I Continuous RVs Fall 27 Practice. Suppose a random variable X has the following probability density function: f ( x ) = sin x, < x < 2 π, zero otherwise. a) Find P ( X < 4 π ). b) Find µ =
STAT 4 Exam I Continuous RVs Fall 27 Practice. Suppose a random variable X has the following probability density function: f ( x ) = sin x, < x < 2 π, zero otherwise. a) Find P ( X < 4 π ). b) Find µ =
STAT 516 Midterm Exam 2 Friday, March 7, 2008
 STAT 516 Midterm Exam 2 Friday, March 7, 2008 Name Purdue student ID (10 digits) 1. The testing booklet contains 8 questions. 2. Permitted Texas Instruments calculators: BA-35 BA II Plus BA II Plus Professional
Exam 3--PHYS 202--S15
 Name: Class: Date: Exam 3--PHYS 202--S15 Multiple Choice Identify the choice that best completes the statement or answers the question 1 Consider this circuit Which of these equations is correct? 3 Which
Chapter 5: HYPOTHESIS TESTING
 MATH411: Applied Statistics Dr. YU, Chi Wai Chapter 5: HYPOTHESIS TESTING 1 WHAT IS HYPOTHESIS TESTING? As its name indicates, it is about a test of hypothesis. To be more precise, we would first translate
Topic 6.3 The normal Distribution
 Topic 6.3 The normal Distribution 1 The Normal Curve The graph of the normal distribution depends on two factors the mean and the standard deviation. The mean of the distribution determines the location
Physics 2401 Summer 2, 2008 Exam II
 Physics 2401 Summer 2, 2008 Exam II e = 1.60x10⁻¹⁹ C, m(electron) = 9.11x10⁻³¹ kg, ε 0 = 8.845x10⁻¹² C 2 /Nm 2, k e = 9.0x10 9 Nm 2 /C 2, m(proton) = 1.67x10⁻²⁷ kg. n = nano = 10-9, µ = micro = 10-6, m
Chapter 3: The Normal Distributions
 Chapter 3: The Normal Distributions http://www.yorku.ca/nuri/econ2500/econ2500-online-course-materials.pdf graphs-normal.doc / histogram-density.txt / normal dist table / ch3-image Ch3 exercises: 3.2,
6. Cold U? Max = 51.8 F Range = 59.4 F Mean = 33.8 F s = 12.6 F med = 35.6 F IQR = 28.8 F
 AP Stat Ch. 6 Practice Worksheet - KEY BOOK PROBLEMS: p. 129 #2-24 even 2. Hotline a) Median = 264 seconds IQR = 138 seconds b) Median = 240 seconds IQR = 138 seconds 4. Hams a) Range = 3.3 lbs. IQR =
1 Probability Distributions
 1 Probability Distributions In the chapter about descriptive statistics sample data were discussed, and tools introduced for describing the samples with numbers as well as with graphs. In this chapter