Statistics and Data Analysis in Geology
|
|
|
- Matthew Roberts
- 6 years ago
- Views:
Transcription
1 Statistics and Data Analysis in Geology 6. Normal Distribution probability plots central limits theorem Dr. Franz J Meyer Earth and Planetary Remote Sensing, University of Alaska Fairbanks 1
2 2

 and")
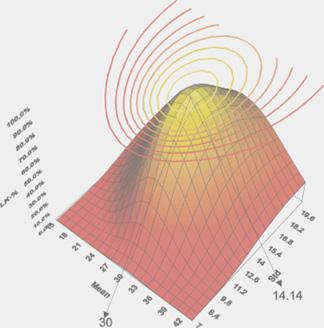
3 An Enormously Important Distribution The normal distribution is the most commonly used distribution in statistics Partly this is due to the fact that the normal distribution is a reasonable description of many processes from industrial processes to intelligence test scores Also, under specific conditions one can assume that sampling distributions are normally distributed even if the samples are drawn from populations that are not normally distributed (this is discussed further when we talk about the Central Limits Theorem) The normal distribution is also referred to as bell curve and you see a few examples below There are an infinite number of normal distributions that differ according to their mean (μ) and variance (σ 2 ) 3 3
4 Almost all natural processes follow the normal distribution The shape of a Normal distribution corresponds to a binomial distribution with p = 0.5 (compare to coin toss example of lecture 5) As N becomes large, the function becomes continuous and can be represented by the following equation f ( X ) = ( X μ) 2σ e for < X < σ 2π it also can be thought of as N! X N X p q for p = 0.5 X! N X! ( ) A normal distribution can be characterized by only two parameters, μ and σ Approximation of histogram by normal distribution Two normal distributions with different mean but same standard deviation Two normal distributions with same mean but different standard deviation 4 4
5 The Standard Normal Distribution or Z Distribution It is often useful to standardize the variables so that populations can be compared. Standardization means that the mean, μ, = 0 and the standard deviation σ, = 1 Then the equation becomes: f X = e X 2 1 ( ) / 2 for < 2π < and the curve is expressed in numbers of standard deviations from the mean X 5

6 The Standard Normal Distribution or Z Distribution So you convert the normal distribution to the Z distribution by converting the original values to standard scores, which allows comparison among populations with different means and variances That s interesting as all normal distributions share the following characteristics: Symmetry Unimodality Continuous range from - to + A total area under the curve of 1 A common values for the mean, median, and mode We can make some assumptions about how the data is distributed within any normal distribution About 68% of the data fall within 1 σ About 95% of all data fall within 2 σ About 99.5% of all data fall within 3 σ 6 6
7 The Standard Normal Distribution or Z Distribution Standardization of normal random variables 7 7
8 The Standard Normal Distribution or Z Distribution For any sample, the way to standardize the data is called Z-transformation. For every point we calculate a Z-score, which is really a measure of how many standard deviations a point is from the mean. X i μ X i X Zi = or Zi = depending on if you are dealing with a sample σ S or population. Z scores can be positive or negative. 8
9 The Standard Normal Distribution or Z Distribution For any sample, the way to standardize the data is called Z-transformation. For every point we calculate a Z-score, which is really a measure of how many standard deviations a point is from the mean. X i μ X i X Zi = or Zi = depending on if you are dealing with a sample σ S or population. Z scores can be positive or negative. Example: A shell specimen with a value of 12 mm (X = 12) is drawn from a population with μ = 10, σ = 2. What is that sample s Z score? Z = ( 12 10) 2 = 2 2 = 1 or the sample is one standard deviation longer than the mean What if that same sample is drawn from a population with μ = 10, σ = 1 (Same mean different variance)? Z = ( 12 10) 1 = 2 1 = 2 In absolute terms the specimen is the same distance from the mean, however relative to the population as a whole, it is further away (more anomalous). 9
10 The Standard Normal Distribution or Z Distribution Example cont.: What if a different specimen (X = 14) is drawn from the population in example 1 with μ = 10, σ = 2? Z = ( 14 10) 2 = 4 2 = 2 So this sample is in the same position relative to the population as that from example 2. Z score mm 10
11 The Standard Normal Distribution or Z Distribution For each normal distribution, the area under the curve is equal to 1. That is, the total probability is equal to 1 (as it was with the binomial distribution). Mathematically we can express this as: + f ( X ) dx =1 For Z-transformed data this is: f ( X ) dx = ( X ) 2 e dx = 1 2π 11

12 The Standard Normal Distribution or Z Distribution Similarly, we can calculate the probability of a sample as being less than or equal to some preset value Z as Z 1 2π e ( X ) 2 2 dx A different way to represent the normal distribution is by Cumulative Probability: They are plots of the area under the curve versus X. They can be made for any distribution. These types of plots are called OGIVE PLOTS, and I will come back to them later. 12
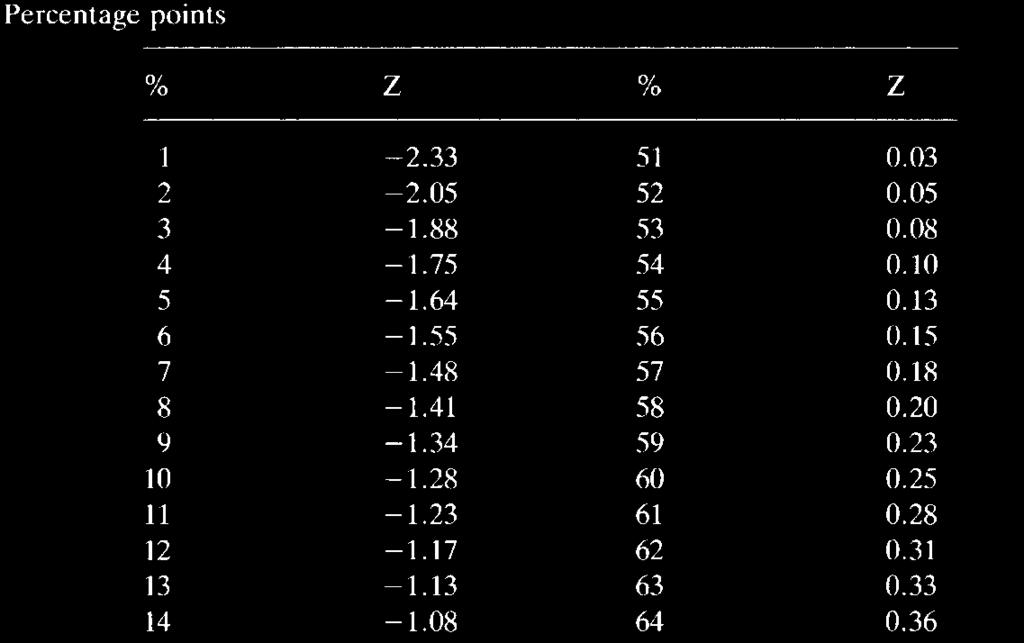
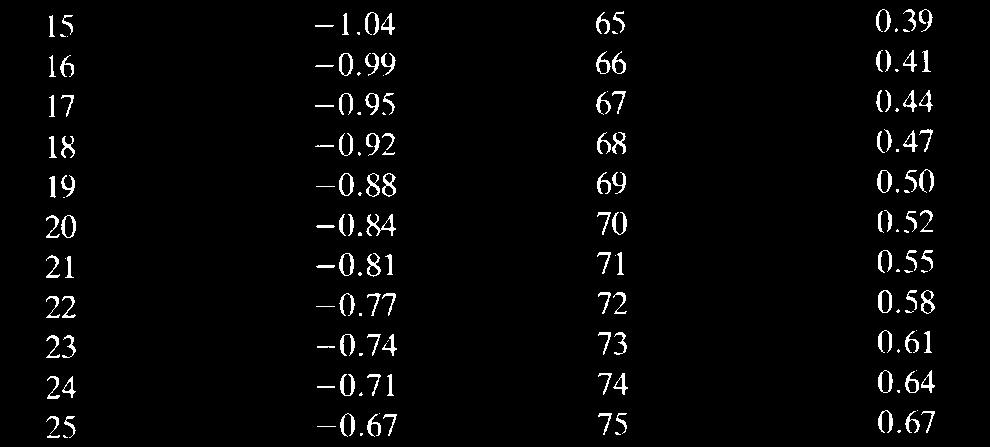
13 For the normal distribution, it is a pain in the neck to calculate this integral for every problem that we are going to do, so tables have been constructed
14 14
15 The numbers in the table below are answers to the question: What is the Z value corresponding to a particular area under the curve? 15
16 Example of Cumulated Probability Grades of chip samples from a body of ore have a normal distribution with a mean of 12% (μ) and a standard deviation of 1.6 % (σ). (curve to the right helps to visualize the distribution) Problem 1: Find the probability of a specimen of 15% or less Calculate Z score (15-12)/1.6 = The chart on slide 13 gives cumulative probability from very small (minus infinity) to the value: = 0.97 (we have to interpolate between +1.8 and +1.9) Make a sketch to see if this makes sense So the probability of finding a sample with less than 15% ore is 97% 16
17 Example of Cumulated Probability Problem 2: What is the probability of finding ore greater than 14%? Z = (14-12)/1.6 = the probability associated with this Z score is This is the probability of 14% or less. The probability of 14% or more is or So the probability of finding a sample more than 14% ore is 10.5% 17
18 Example of Cumulated Probability Problem 3: What is the probability of finding ore grade of less than 8%? Z = (8-12)/1.6 = -2.5 the probability associated with this Z score is So the probability of finding a sample less than 8% ore is 0.62%, not very likely 18
19 Example of Cumulated Probability Problem 4: What is the probability of a sample being between 8% and 15%? Calculate the Z scores for each value: Z 8 = (8-12)/1.6 = > 0.62% Z 15 = (15-12)/1.6 = > 97% Subtract the smaller from the larger: = 96.38%, so about 96% or all samples fall in that range. 19
20 Example of Cumulated Probability area under the curve μ ± 1σ = % μ ± 2σ = % μ±1.96σ = 95% μ ± 3σ = % 20
21 The Central Limits Theorem 21
22 The Central Limits Theorem If you draw a number of samples from a normal distribution population, we find that the sample means will form a normal distribution BUT we don't always know the distribution of the population Central Limits Theorem: CLT states that independent of their original statistical distribution, the re-averaged sum of a sufficiently large number of identically distributed independent random variables will be approximately normally distributed. In other words, if sufficiently large sets of random samples are taken from any population, and the means are calculated for those samples, then these sample means will tend to be normally distributed. 22

23 The Central Limits Theorem Central Limits Theorem: Again in other words: if we take all possible samples of size n from any population with a mean of μ and a standard deviation of σ, the distribution of sample means will have: X = μ mean of also written as Standard deviation of means, This is also called the standard error of the mean, s e will be normally distribution when the parent population is normal will approach a normal distribution as N approaches infinity regardless of the distribution of the parent population. s X X X = σ = μ n 23
24 The Central Limits Theorem


25 The Central Limits Theorem Some animated examples: Uniform distribution: Log-normal distribution: Parabolic distributions: 25
26 The Central Limits Theorem This means, if we average enough we can always reduce data of unknown statistics to data of known properties. Practically, we can use our Z-statistic X i μ Z = (1) useful when we want to infer something from single values taken from a normal population (X i drawn from population) and adapt it for CLT for a sample of size N drawn from a population with known mean and standard deviation. X μ (2) You can see that equation (1) is the same as (2) if n = 1 (a single sample) So both equations are just more specific forms of the general equation s e is the standard deviation of means = Z i Z = = σ X σ σ s e 1/ n μ 1/ n 26
27 The Central Limits Theorem For the example from earlier: A sample with a value of 14% (X = 14) is drawn from a population with μ = 12, σ = 1.6. What is the probability of finding a single sample equal to or greater than 14% ore? First calculate that sample s Z score Z = = = Or the probability of finding one such sample or greater was about 10.5%. 27
28 The Central Limits Theorem For the example from earlier: Now, what if we selected 4 samples (n = 4) and the mean of those specimens was 14%? Z = 1.6 1/ 4 2 = = 1.6 (1/ 2) = 2.5 And the probability of finding four such specimens is less, in fact it is only 0.62%!!! 28
Unit 4 Probability. Dr Mahmoud Alhussami
 Unit 4 Probability Dr Mahmoud Alhussami Probability Probability theory developed from the study of games of chance like dice and cards. A process like flipping a coin, rolling a die or drawing a card from
9/19/2012. PSY 511: Advanced Statistics for Psychological and Behavioral Research 1
 PSY 511: Advanced Statistics for Psychological and Behavioral Research 1 The aspect of the data we want to describe/measure is relative position z scores tell us how many standard deviations above or below
MA 1125 Lecture 15 - The Standard Normal Distribution. Friday, October 6, Objectives: Introduce the standard normal distribution and table.
 MA 1125 Lecture 15 - The Standard Normal Distribution Friday, October 6, 2017. Objectives: Introduce the standard normal distribution and table. 1. The Standard Normal Distribution We ve been looking at
Week 11 Sample Means, CLT, Correlation
 Week 11 Sample Means, CLT, Correlation Slides by Suraj Rampure Fall 2017 Administrative Notes Complete the mid semester survey on Piazza by Nov. 8! If 85% of the class fills it out, everyone will get a
COMP6053 lecture: Sampling and the central limit theorem. Markus Brede,
 COMP6053 lecture: Sampling and the central limit theorem Markus Brede, mb8@ecs.soton.ac.uk Populations: long-run distributions Two kinds of distributions: populations and samples. A population is the set
Statistics, Probability Distributions & Error Propagation. James R. Graham
 Statistics, Probability Distributions & Error Propagation James R. Graham Sample & Parent Populations Make measurements x x In general do not expect x = x But as you take more and more measurements a pattern
6.2 Normal Distribution. Ziad Zahreddine
 6.2 Normal Distribution Importance of Normal Distribution 1. Describes Many Random Processes or Continuous Phenomena 2. Can Be Used to Approximate Discrete Probability Distributions Example: Binomial 3.
IV. The Normal Distribution
 IV. The Normal Distribution The normal distribution (a.k.a., the Gaussian distribution or bell curve ) is the by far the best known random distribution. It s discovery has had such a far-reaching impact
Summary statistics, distributions of sums and means
 Summary statistics, distributions of sums and means Joe Felsenstein Summary statistics, distributions of sums and means p.1/17 Quantiles In both empirical distributions and in the underlying distribution,
Chapter 6 The Normal Distribution
 Chapter 6 The Normal PSY 395 Oswald Outline s and area The normal distribution The standard normal distribution Setting probable limits on a score/observation Measures related to 2 s and Area The idea
Lecture 8 Sampling Theory
 Lecture 8 Sampling Theory Thais Paiva STA 111 - Summer 2013 Term II July 11, 2013 1 / 25 Thais Paiva STA 111 - Summer 2013 Term II Lecture 8, 07/11/2013 Lecture Plan 1 Sampling Distributions 2 Law of Large
Discrete and continuous
 Discrete and continuous A curve, or a function, or a range of values of a variable, is discrete if it has gaps in it - it jumps from one value to another. In practice in S2 discrete variables are variables
COMP6053 lecture: Sampling and the central limit theorem. Jason Noble,
 COMP6053 lecture: Sampling and the central limit theorem Jason Noble, jn2@ecs.soton.ac.uk Populations: long-run distributions Two kinds of distributions: populations and samples. A population is the set
Lecture 27. DATA 8 Spring Sample Averages. Slides created by John DeNero and Ani Adhikari
 DATA 8 Spring 2018 Lecture 27 Sample Averages Slides created by John DeNero (denero@berkeley.edu) and Ani Adhikari (adhikari@berkeley.edu) Announcements Questions for This Week How can we quantify natural
II. The Normal Distribution
 II. The Normal Distribution The normal distribution (a.k.a., a the Gaussian distribution or bell curve ) is the by far the best known random distribution. It s discovery has had such a far-reaching impact
The Normal Distribution. Chapter 6
 + The Normal Distribution Chapter 6 + Applications of the Normal Distribution Section 6-2 + The Standard Normal Distribution and Practical Applications! We can convert any variable that in normally distributed
Lecture 3. The Population Variance. The population variance, denoted σ 2, is the sum. of the squared deviations about the population
 Lecture 5 1 Lecture 3 The Population Variance The population variance, denoted σ 2, is the sum of the squared deviations about the population mean divided by the number of observations in the population,
Math 416 Lecture 3. The average or mean or expected value of x 1, x 2, x 3,..., x n is
 Math 416 Lecture 3 Expected values The average or mean or expected value of x 1, x 2, x 3,..., x n is x 1 x 2... x n n x 1 1 n x 2 1 n... x n 1 n 1 n x i p x i where p x i 1 n is the probability of x i
IV. The Normal Distribution
 IV. The Normal Distribution The normal distribution (a.k.a., a the Gaussian distribution or bell curve ) is the by far the best known random distribution. It s discovery has had such a far-reaching impact
Probability Methods in Civil Engineering Prof. Dr. Rajib Maity Department of Civil Engineering Indian Institution of Technology, Kharagpur
 Probability Methods in Civil Engineering Prof. Dr. Rajib Maity Department of Civil Engineering Indian Institution of Technology, Kharagpur Lecture No. # 36 Sampling Distribution and Parameter Estimation
CVE NORMAL DISTRIBUTION
 CVE 472 Assist. Prof. Dr. Bertuğ Akıntuğ Civil Engineering Program Middle East Technical University Northern Cyprus Campus CVE 472 Statistical Techniques in Hydrology. 1/47 Outline General Normal Distribution
Lecture Slides. Elementary Statistics Tenth Edition. by Mario F. Triola. and the Triola Statistics Series. Slide 1
 Lecture Slides Elementary Statistics Tenth Edition and the Triola Statistics Series by Mario F. Triola Slide 1 Chapter 3 Statistics for Describing, Exploring, and Comparing Data 3-1 Overview 3-2 Measures
STATISTICS. 1. Measures of Central Tendency
 STATISTICS 1. Measures o Central Tendency Mode, median and mean For a sample o discrete data, the mode is the observation, x with the highest requency,. 1 N F For grouped data in a cumulative requency
Chapter 8 Sampling Distributions Defn Defn
 1 Chapter 8 Sampling Distributions Defn: Sampling error is the error resulting from using a sample to infer a population characteristic. Example: We want to estimate the mean amount of Pepsi-Cola in 12-oz.
CENTRAL LIMIT THEOREM (CLT)
") CENTRAL LIMIT THEOREM (CLT) A sampling distribution is the probability distribution of the sample statistic that is formed when samples of size n are repeatedly taken from a population. If the sample statistic
CENTRAL LIMIT THEOREM (CLT) A sampling distribution is the probability distribution of the sample statistic that is formed when samples of size n are repeatedly taken from a population. If the sample statistic
Business Statistics: A Decision-Making Approach, 6e. Chapter Goals
 Chapter 4 Student Lecture Notes 4-1 Business Statistics: A Decision-Making Approach 6 th Edition Chapter 4 Using Probability and Probability Distributions Fundamentals of Business Statistics Murali Shanker
Statistical Inference Theory Lesson 46 Non-parametric Statistics
 46.1-The Sign Test Statistical Inference Theory Lesson 46 Non-parametric Statistics 46.1 - Problem 1: (a). Let p equal the proportion of supermarkets that charge less than $2.15 a pound. H o : p 0.50 H
The Central Limit Theorem
 The Central Limit Theorem Patrick Breheny September 27 Patrick Breheny University of Iowa Biostatistical Methods I (BIOS 5710) 1 / 31 Kerrich s experiment Introduction 10,000 coin flips Expectation and
Essential Statistics Chapter 6
 1 Essential Statistics Chapter 6 By Navidi and Monk Copyright 2016 Mark A. Thomas. All rights reserved. 2 Continuous Probability Distributions chapter 5 focused upon discrete probability distributions,
STA 111: Probability & Statistical Inference
 STA 111: Probability & Statistical Inference Lecture Four Expectation and Continuous Random Variables Instructor: Olanrewaju Michael Akande Department of Statistical Science, Duke University Instructor:
21 ST CENTURY LEARNING CURRICULUM FRAMEWORK PERFORMANCE RUBRICS FOR MATHEMATICS PRE-CALCULUS
 21 ST CENTURY LEARNING CURRICULUM FRAMEWORK PERFORMANCE RUBRICS FOR MATHEMATICS PRE-CALCULUS Table of Contents Functions... 2 Polynomials and Rational Functions... 3 Exponential Functions... 4 Logarithmic
Statistical Intervals (One sample) (Chs )
 (Chs )") 7 Statistical Intervals (One sample) (Chs 8.1-8.3) Confidence Intervals The CLT tells us that as the sample size n increases, the sample mean X is close to normally distributed with expected value µ and
7 Statistical Intervals (One sample) (Chs 8.1-8.3) Confidence Intervals The CLT tells us that as the sample size n increases, the sample mean X is close to normally distributed with expected value µ and
1 Probability Distributions
 1 Probability Distributions In the chapter about descriptive statistics sample data were discussed, and tools introduced for describing the samples with numbers as well as with graphs. In this chapter
To find the median, find the 40 th quartile and the 70 th quartile (which are easily found at y=1 and y=2, respectively). Then we interpolate:
. Then we interpolate:") Joel Anderson ST 37-002 Lecture Summary for 2/5/20 Homework 0 First, the definition of a probability mass function p(x) and a cumulative distribution function F(x) is reviewed: Graphically, the drawings
Joel Anderson ST 37-002 Lecture Summary for 2/5/20 Homework 0 First, the definition of a probability mass function p(x) and a cumulative distribution function F(x) is reviewed: Graphically, the drawings
Example. If 4 tickets are drawn with replacement from ,
 Example. If 4 tickets are drawn with replacement from 1 2 2 4 6, what are the chances that we observe exactly two 2 s? Exactly two 2 s in a sequence of four draws can occur in many ways. For example, (
STAT/SOC/CSSS 221 Statistical Concepts and Methods for the Social Sciences. Random Variables
 STAT/SOC/CSSS 221 Statistical Concepts and Methods for the Social Sciences Random Variables Christopher Adolph Department of Political Science and Center for Statistics and the Social Sciences University
Statistical Methods: Introduction, Applications, Histograms, Ch
 Outlines Statistical Methods: Introduction, Applications, Histograms, Characteristics November 4, 2004 Outlines Part I: Statistical Methods: Introduction and Applications Part II: Statistical Methods:
MA 1125 Lecture 33 - The Sign Test. Monday, December 4, Objectives: Introduce an example of a non-parametric test.
 MA 1125 Lecture 33 - The Sign Test Monday, December 4, 2017 Objectives: Introduce an example of a non-parametric test. For the last topic of the semester we ll look at an example of a non-parametric test.
3. Tests in the Bernoulli Model
 1 of 5 7/29/2009 3:15 PM Virtual Laboratories > 9. Hy pothesis Testing > 1 2 3 4 5 6 7 3. Tests in the Bernoulli Model Preliminaries Suppose that X = (X 1, X 2,..., X n ) is a random sample from the Bernoulli
Sampling, Frequency Distributions, and Graphs (12.1)
") 1 Sampling, Frequency Distributions, and Graphs (1.1) Design: Plan how to obtain the data. What are typical Statistical Methods? Collect the data, which is then subjected to statistical analysis, which
1 Sampling, Frequency Distributions, and Graphs (1.1) Design: Plan how to obtain the data. What are typical Statistical Methods? Collect the data, which is then subjected to statistical analysis, which
Topic 6 Continuous Random Variables
 Topic 6 page Topic 6 Continuous Random Variables Reference: Chapter 5.-5.3 Probability Density Function The Uniform Distribution The Normal Distribution Standardizing a Normal Distribution Using the Standard
Intro to probability concepts
 October 31, 2017 Serge Lang lecture This year s Serge Lang Undergraduate Lecture will be given by Keith Devlin of our main athletic rival. The title is When the precision of mathematics meets the messiness
IC 102: Data Analysis and Interpretation
 IC 102: Data Analysis and Interpretation Instructor: Guruprasad PJ Dept. Aerospace Engineering Indian Institute of Technology Bombay Powai, Mumbai 400076 Email: pjguru@aero.iitb.ac.in Phone no.: 2576 7142
Lecture 30. DATA 8 Summer Regression Inference
 DATA 8 Summer 2018 Lecture 30 Regression Inference Slides created by John DeNero (denero@berkeley.edu) and Ani Adhikari (adhikari@berkeley.edu) Contributions by Fahad Kamran (fhdkmrn@berkeley.edu) and
SAMPLING DISTRIBUTIONS
 SAPLING DISTRIBUTIONS Average U.S. Height in Inches (ales; 20-29yr) Individual Values 61 62 63 64 64 65 65 66 66 66 61 64 67 69 68 69 68 69 67 68 69 67 68 69 67 68 69 67 68 69 x 71 71 71 71 71 71 71 72
Calculus with Algebra and Trigonometry II Lecture 21 Probability applications
 Calculus with Algebra and Trigonometry II Lecture 21 Probability applications Apr 16, 215 Calculus with Algebra and Trigonometry II Lecture 21Probability Apr applications 16, 215 1 / 1 Histograms The distribution
EXAM. Exam #1. Math 3342 Summer II, July 21, 2000 ANSWERS
 EXAM Exam # Math 3342 Summer II, 2 July 2, 2 ANSWERS i pts. Problem. Consider the following data: 7, 8, 9, 2,, 7, 2, 3. Find the first quartile, the median, and the third quartile. Make a box and whisker
a table or a graph or an equation.
 Topic (8) POPULATION DISTRIBUTIONS 8-1 So far: Topic (8) POPULATION DISTRIBUTIONS We ve seen some ways to summarize a set of data, including numerical summaries. We ve heard a little about how to sample
the probability of getting either heads or tails must be 1 (excluding the remote possibility of getting it to land on its edge).
.") Probability One of the most useful and intriguing aspects of quantum mechanics is the Heisenberg Uncertainty Principle. Before I get to it however, we need some initial comments on probability. Let s first
Probability One of the most useful and intriguing aspects of quantum mechanics is the Heisenberg Uncertainty Principle. Before I get to it however, we need some initial comments on probability. Let s first
additionalmathematicsstatisticsadditi onalmathematicsstatisticsadditionalm athematicsstatisticsadditionalmathem aticsstatisticsadditionalmathematicsst
 additionalmathematicsstatisticsadditi onalmathematicsstatisticsadditionalm athematicsstatisticsadditionalmathem aticsstatisticsadditionalmathematicsst STATISTICS atisticsadditionalmathematicsstatistic
Chapter 3. Measuring data
 Chapter 3 Measuring data 1 Measuring data versus presenting data We present data to help us draw meaning from it But pictures of data are subjective They re also not susceptible to rigorous inference Measuring
Numerical Methods Lecture 7 - Statistics, Probability and Reliability
 Topics Numerical Methods Lecture 7 - Statistics, Probability and Reliability A summary of statistical analysis A summary of probability methods A summary of reliability analysis concepts Statistical Analysis
Management Programme. MS-08: Quantitative Analysis for Managerial Applications
 MS-08 Management Programme ASSIGNMENT SECOND SEMESTER 2013 MS-08: Quantitative Analysis for Managerial Applications School of Management Studies INDIRA GANDHI NATIONAL OPEN UNIVERSITY MAIDAN GARHI, NEW
Statistical Concepts. Distributions of Data
 Module : Review of Basic Statistical Concepts. Understanding Probability Distributions, Parameters and Statistics A variable that can take on any value in a range is called a continuous variable. Example:
TOPIC: Descriptive Statistics Single Variable
 TOPIC: Descriptive Statistics Single Variable I. Numerical data summary measurements A. Measures of Location. Measures of central tendency Mean; Median; Mode. Quantiles - measures of noncentral tendency
1.0 Continuous Distributions. 5.0 Shapes of Distributions. 6.0 The Normal Curve. 7.0 Discrete Distributions. 8.0 Tolerances. 11.
 Chapter 4 Statistics 45 CHAPTER 4 BASIC QUALITY CONCEPTS 1.0 Continuous Distributions.0 Measures of Central Tendency 3.0 Measures of Spread or Dispersion 4.0 Histograms and Frequency Distributions 5.0
Confidence Intervals. Confidence interval for sample mean. Confidence interval for sample mean. Confidence interval for sample mean
 Confidence Intervals Confidence interval for sample mean The CLT tells us: as the sample size n increases, the sample mean is approximately Normal with mean and standard deviation Thus, we have a standard
Contents. Acknowledgments. xix
 Table of Preface Acknowledgments page xv xix 1 Introduction 1 The Role of the Computer in Data Analysis 1 Statistics: Descriptive and Inferential 2 Variables and Constants 3 The Measurement of Variables
Statistics and Quantitative Analysis U4320. Segment 5: Sampling and inference Prof. Sharyn O Halloran
 Statistics and Quantitative Analysis U4320 Segment 5: Sampling and inference Prof. Sharyn O Halloran Sampling A. Basics 1. Ways to Describe Data Histograms Frequency Tables, etc. 2. Ways to Characterize
Ø Set of mutually exclusive categories. Ø Classify or categorize subject. Ø No meaningful order to categorization.
 Statistical Tools in Evaluation HPS 41 Dr. Joe G. Schmalfeldt Types of Scores Continuous Scores scores with a potentially infinite number of values. Discrete Scores scores limited to a specific number
4.2 The Normal Distribution. that is, a graph of the measurement looks like the familiar symmetrical, bell-shaped
 4.2 The Normal Distribution Many physiological and psychological measurements are normality distributed; that is, a graph of the measurement looks like the familiar symmetrical, bell-shaped distribution
Chapter 2: Tools for Exploring Univariate Data
 Stats 11 (Fall 2004) Lecture Note Introduction to Statistical Methods for Business and Economics Instructor: Hongquan Xu Chapter 2: Tools for Exploring Univariate Data Section 2.1: Introduction What is
Chapter 18. Sampling Distribution Models. Copyright 2010, 2007, 2004 Pearson Education, Inc.
 Chapter 18 Sampling Distribution Models Copyright 2010, 2007, 2004 Pearson Education, Inc. Normal Model When we talk about one data value and the Normal model we used the notation: N(μ, σ) Copyright 2010,
Evaluating Classifiers. Lecture 2 Instructor: Max Welling
 Evaluating Classifiers Lecture 2 Instructor: Max Welling Evaluation of Results How do you report classification error? How certain are you about the error you claim? How do you compare two algorithms?
Data Analysis and Statistical Methods Statistics 651
 Data Analysis and Statistical Methods Statistics 651 http://www.stat.tamu.edu/~suhasini/teaching.html Suhasini Subba Rao Review of previous lecture We showed if S n were a binomial random variable, where
University of Jordan Fall 2009/2010 Department of Mathematics
 handouts Part 1 (Chapter 1 - Chapter 5) University of Jordan Fall 009/010 Department of Mathematics Chapter 1 Introduction to Introduction; Some Basic Concepts Statistics is a science related to making
STAT 200 Chapter 1 Looking at Data - Distributions
 STAT 200 Chapter 1 Looking at Data - Distributions What is Statistics? Statistics is a science that involves the design of studies, data collection, summarizing and analyzing the data, interpreting the
Part 3: Parametric Models
 Part 3: Parametric Models Matthew Sperrin and Juhyun Park August 19, 2008 1 Introduction There are three main objectives to this section: 1. To introduce the concepts of probability and random variables.
Final Exam STAT On a Pareto chart, the frequency should be represented on the A) X-axis B) regression C) Y-axis D) none of the above
 X-axis B) regression C) Y-axis D) none of the above") King Abdul Aziz University Faculty of Sciences Statistics Department Final Exam STAT 0 First Term 49-430 A 40 Name No ID: Section: You have 40 questions in 9 pages. You have 90 minutes to solve the exam.
King Abdul Aziz University Faculty of Sciences Statistics Department Final Exam STAT 0 First Term 49-430 A 40 Name No ID: Section: You have 40 questions in 9 pages. You have 90 minutes to solve the exam.
2007 Winton. Empirical Distributions
 1 Empirical Distributions 2 Distributions In the discrete case, a probability distribution is just a set of values, each with some probability of occurrence Probabilities don t change as values occur Example,
appstats8.notebook October 11, 2016
 Chapter 8 Linear Regression Objective: Students will construct and analyze a linear model for a given set of data. Fat Versus Protein: An Example pg 168 The following is a scatterplot of total fat versus
STA Why Sampling? Module 6 The Sampling Distributions. Module Objectives
 STA 2023 Module 6 The Sampling Distributions Module Objectives In this module, we will learn the following: 1. Define sampling error and explain the need for sampling distributions. 2. Recognize that sampling
I [Xi t] n ˆFn (t) Binom(n, F (t))
![I [Xi t] n ˆFn (t) Binom(n, F (t))](/thumbs/83/88931328.jpg "I [Xi t] n ˆFn (t) Binom(n, F (t))") Histograms & Densities We have seen in class various pictures of theoretical distribution functions and also some pictures of empirical distribution functions based on data. The definition of this concept
Histograms & Densities We have seen in class various pictures of theoretical distribution functions and also some pictures of empirical distribution functions based on data. The definition of this concept
Chapter 6. The Standard Deviation as a Ruler and the Normal Model 1 /67
 Chapter 6 The Standard Deviation as a Ruler and the Normal Model 1 /67 Homework Read Chpt 6 Complete Reading Notes Do P129 1, 3, 5, 7, 15, 17, 23, 27, 29, 31, 37, 39, 43 2 /67 Objective Students calculate
CENTRAL LIMIT THEOREM VISUALIZED IN EXCEL
 Scientific Issues Jan Długosz University in Częstochowa Mathematics XIX (2014) 51 55 CENTRAL LIMIT THEOREM VISUALIZED IN EXCEL JITKA HODAŇOVÁ, TOMÁŠ ZDRÁHAL Abstract The Central Limit Theorem states that
Lecture 03 Positive Semidefinite (PSD) and Positive Definite (PD) Matrices and their Properties
 and Positive Definite (PD) Matrices and their Properties") Applied Optimization for Wireless, Machine Learning, Big Data Prof. Aditya K. Jagannatham Department of Electrical Engineering Indian Institute of Technology, Kanpur Lecture 03 Positive Semidefinite (PSD)
Applied Optimization for Wireless, Machine Learning, Big Data Prof. Aditya K. Jagannatham Department of Electrical Engineering Indian Institute of Technology, Kanpur Lecture 03 Positive Semidefinite (PSD)
Probability Method in Civil Engineering Prof. Dr. Rajib Maity Department of Civil Engineering Indian Institute of Technology, Kharagpur
 Probability Method in Civil Engineering Prof. Dr. Rajib Maity Department of Civil Engineering Indian Institute of Technology, Kharagpur Lecture No. # 34 Probability Models using Discrete Probability Distributions
Descriptive Univariate Statistics and Bivariate Correlation
 ESC 100 Exploring Engineering Descriptive Univariate Statistics and Bivariate Correlation Instructor: Sudhir Khetan, Ph.D. Wednesday/Friday, October 17/19, 2012 The Central Dogma of Statistics used to
The Normal Distribution. The Gaussian Curve. Advantages of using Z-score. Importance of normal or Gaussian distribution (ND)
") Importance of normal or Gaussian distribution (ND) The Normal It is the most used distribution Most method are based on the assumption of ND Sum of many independent, random contributions variables (grain
Importance of normal or Gaussian distribution (ND) The Normal It is the most used distribution Most method are based on the assumption of ND Sum of many independent, random contributions variables (grain
Class 15. Daniel B. Rowe, Ph.D. Department of Mathematics, Statistics, and Computer Science. Marquette University MATH 1700
 Class 15 Daniel B. Rowe, Ph.D. Department of Mathematics, Statistics, and Computer Science Copyright 17 by D.B. Rowe 1 Agenda: Recap Chapter 7.1 7. Lecture Chapter 7. Discussion of Chapters Problem Solving
Chapter 18. Sampling Distribution Models /51
 Chapter 18 Sampling Distribution Models 1 /51 Homework p432 2, 4, 6, 8, 10, 16, 17, 20, 30, 36, 41 2 /51 3 /51 Objective Students calculate values of central 4 /51 The Central Limit Theorem for Sample
STT 315 This lecture is based on Chapter 2 of the textbook.
 STT 315 This lecture is based on Chapter 2 of the textbook. Acknowledgement: Author is thankful to Dr. Ashok Sinha, Dr. Jennifer Kaplan and Dr. Parthanil Roy for allowing him to use/edit some of their
(It's not always good, but we can always make it.) (4) Convert the normal distribution N to the standard normal distribution Z. Specically.
 (4) Convert the normal distribution N to the standard normal distribution Z. Specically.") . Introduction The quick summary, going forwards: Start with random variable X. 2 Compute the mean EX and variance 2 = varx. 3 Approximate X by the normal distribution N with mean µ = EX and standard deviation.
. Introduction The quick summary, going forwards: Start with random variable X. 2 Compute the mean EX and variance 2 = varx. 3 Approximate X by the normal distribution N with mean µ = EX and standard deviation.
Background to Statistics
 FACT SHEET Background to Statistics Introduction Statistics include a broad range of methods for manipulating, presenting and interpreting data. Professional scientists of all kinds need to be proficient
Probability Distributions for Continuous Variables. Probability Distributions for Continuous Variables
 Probability Distributions for Continuous Variables Probability Distributions for Continuous Variables Let X = lake depth at a randomly chosen point on lake surface If we draw the histogram so that the
Sampling distributions:
 Sampling distributions: In Psychology we generally make inferences about populations on the basis of limited samples. We therefore need to know what relationship exists between samples and populations.
MALLOY PSYCH 3000 MEAN & VARIANCE PAGE 1 STATISTICS MEASURES OF CENTRAL TENDENCY. In an experiment, these are applied to the dependent variable (DV)
") MALLOY PSYCH 3000 MEAN & VARIANCE PAGE 1 STATISTICS Descriptive statistics Inferential statistics MEASURES OF CENTRAL TENDENCY In an experiment, these are applied to the dependent variable (DV) E.g., MEASURES
MALLOY PSYCH 3000 MEAN & VARIANCE PAGE 1 STATISTICS Descriptive statistics Inferential statistics MEASURES OF CENTRAL TENDENCY In an experiment, these are applied to the dependent variable (DV) E.g., MEASURES
DETAILED CONTENTS PART I INTRODUCTION AND DESCRIPTIVE STATISTICS. 1. Introduction to Statistics
 DETAILED CONTENTS About the Author Preface to the Instructor To the Student How to Use SPSS With This Book PART I INTRODUCTION AND DESCRIPTIVE STATISTICS 1. Introduction to Statistics 1.1 Descriptive and
Introducing the Normal Distribution
 Department of Mathematics Ma 3/103 KC Border Introduction to Probability and Statistics Winter 2017 Lecture 10: Introducing the Normal Distribution Relevant textbook passages: Pitman [5]: Sections 1.2,
Lab 5 for Math 17: Sampling Distributions and Applications
 Lab 5 for Math 17: Sampling Distributions and Applications Recall: The distribution formed by considering the value of a statistic for every possible sample of a given size n from the population is called
1. Exploratory Data Analysis
 1. Exploratory Data Analysis 1.1 Methods of Displaying Data A visual display aids understanding and can highlight features which may be worth exploring more formally. Displays should have impact and be
Chapter 8. Linear Regression. Copyright 2010 Pearson Education, Inc.
 Chapter 8 Linear Regression Copyright 2010 Pearson Education, Inc. Fat Versus Protein: An Example The following is a scatterplot of total fat versus protein for 30 items on the Burger King menu: Copyright
hp calculators HP 50g Probability distributions The MTH (MATH) menu Probability distributions
 menu Probability distributions") The MTH (MATH) menu Probability distributions Practice solving problems involving probability distributions The MTH (MATH) menu The Math menu is accessed from the WHITE shifted function of the Pkey by
The MTH (MATH) menu Probability distributions Practice solving problems involving probability distributions The MTH (MATH) menu The Math menu is accessed from the WHITE shifted function of the Pkey by
Definition (The carefully thought-out calculus version based on limits).
.") 4.1. Continuity and Graphs Definition 4.1.1 (Intuitive idea used in algebra based on graphing). A function, f, is continuous on the interval (a, b) if the graph of y = f(x) can be drawn over the interval
4.1. Continuity and Graphs Definition 4.1.1 (Intuitive idea used in algebra based on graphing). A function, f, is continuous on the interval (a, b) if the graph of y = f(x) can be drawn over the interval
Chapter 8: An Introduction to Probability and Statistics
 Course S3, 200 07 Chapter 8: An Introduction to Probability and Statistics This material is covered in the book: Erwin Kreyszig, Advanced Engineering Mathematics (9th edition) Chapter 24 (not including
ACMS Statistics for Life Sciences. Chapter 13: Sampling Distributions
 ACMS 20340 Statistics for Life Sciences Chapter 13: Sampling Distributions Sampling We use information from a sample to infer something about a population. When using random samples and randomized experiments,
EC212: Introduction to Econometrics Review Materials (Wooldridge, Appendix)
") 1 EC212: Introduction to Econometrics Review Materials (Wooldridge, Appendix) Taisuke Otsu London School of Economics Summer 2018 A.1. Summation operator (Wooldridge, App. A.1) 2 3 Summation operator For
1 EC212: Introduction to Econometrics Review Materials (Wooldridge, Appendix) Taisuke Otsu London School of Economics Summer 2018 A.1. Summation operator (Wooldridge, App. A.1) 2 3 Summation operator For
The Central Limit Theorem
 The Central Limit Theorem Suppose n tickets are drawn at random with replacement from a box of numbered tickets. The central limit theorem says that when the probability histogram for the sum of the draws
4.12 Sampling Distributions 183
 4.12 Sampling Distributions 183 FIGURE 4.19 Sampling distribution for y Example 4.22 illustrates for a very small population that we could in fact enumerate every possible sample of size 2 selected from
OPIM 303, Managerial Statistics H Guy Williams, 2006
 OPIM 303 Lecture 6 Page 1 The height of the uniform distribution is given by 1 b a Being a Continuous distribution the probability of an exact event is zero: 2 0 There is an infinite number of points in