SAMPLING DISTRIBUTIONS
|
|
|
- Rosalyn Arnold
- 5 years ago
- Views:
Transcription

1 SAPLING DISTRIBUTIONS
2 Average U.S. Height in Inches (ales; 20-29yr) Individual Values x X 3 X
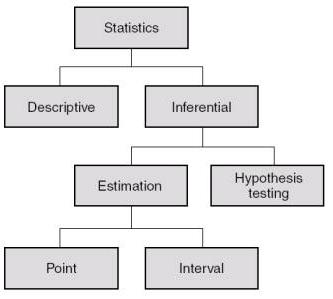
3 Dilemma: I want to collect sample data from a population and I want to identify the extent to which the sample outcome is consistent with the underlying population. I have a few major concerns: 1) Will a sample outcome resemble the original population? 2) To what extent will different sample outcomes vary from each other on average? 3) How can I use information about the population to make predictions of future sample outcomes?
4 Population (μ x )
5 Average U.S. Height in Inches (ales; 20-29yr) Individual Values x X 3 X
6 Point estimation The process of using a sample statistic to estimate the corresponding population parameter x Sampling error The difference between the value of a sample statistic and its corresponding population parameter x
7 Average U.S. Height in Inches (ales; 20-29yr) Sample eans X
 were drawn from a")
8 Sampling distribution of the mean A probability distribution of sample means that would occur if all possible samples of a fixed sample size (with replacement) were drawn from a population
 1 N = 5 3 4 N = 50 2 N = 20 N =")
9 Sampling distribution of the mean A probability distribution of sample means that would occur if all possible samples of a fixed sample size with replacement were drawn from a population Population (μ x ) 1 N = N = 50 2 N = 20 N = 30
10 μ ean of the sampling distribution of the mean The mean of all sample means for a given sampling distribution σ Standard error of the mean (S.E. or S.E..) The mean deviation of a given sample mean () from the population mean (μ X ) Standard deviation of the sampling distribution of the mean
 is not available, this is an impossible process.")
11 A sampling distribution of the mean is formed by creating all possible random samples from a population and determining all of the sample mean values. If access to the entire population (i.e. all possible samples) is not available, this is an impossible process. What can we do?
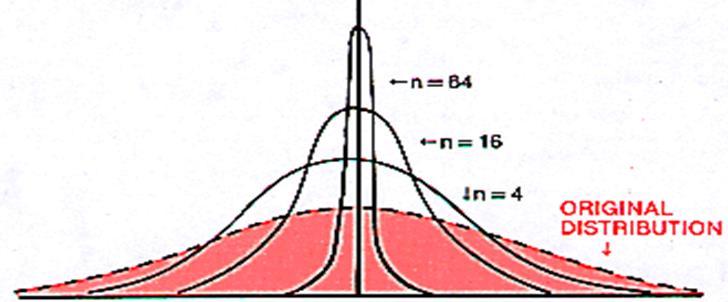
12 Central Limit Theorem A statistical theory that describes the numerical characteristics and shape of a sampling distribution as a function of the chosen sample size For a given population with a mean ( x ) and variance ( 2 x ), the resulting sampling distribution of the mean will possess the following: 1 μ μ 2 X N 2 X X N 3 With a sufficiently large sample size (N 30) the sampling distribution of the mean will take the shape of a normal distribution regardless of the shape of the population from which the sample was drawn
13
14 How does variability differ between individual and sample outcomes? Individual Values X 3 X Sample eans N = μ
15
16 Individual Values X 3 X Sample eans N = μ Sample eans N = μ
17 Central Limit Theorem A statistical theory that describes the characteristics and distribution shape of a sampling distribution as a function of the chosen sample size For a given population with a mean ( x ) and standard deviation ( x ), the resulting sampling distribution of the mean will possess the following: 1 μ μ 2 X 2 X X N N 3 With a sufficiently large sample size (N 30) the sampling distribution of the mean will resemble the shape of a normal distribution regardless of the shape of the population from which the sample was drawn

18 Interactive Demonstration of Central Limit Theorem
19 Changes in Population ean Determine the expected mean and standard error if creating samples (N = 25) from a population that has a mean of x = 65 and a standard deviation of x = Determine the expected mean and standard error if creating samples (N = 25) from a population that has a mean of x = 45 and a standard deviation of x =
20 Changes in Population Variability Determine the expected mean and standard error if creating samples (N = 25) from a population that has a mean of x = 48 and a standard deviation of x = Determine the expected mean and standard error if creating samples (N = 25) from a population that has a mean of x = 48 and a standard deviation of x =
21 Changes in Sample Size Determine the expected mean and standard error if creating samples (N = 25) from a population that has a mean of x = 78 and a standard deviation of x = Determine the expected mean and standard error if creating samples (N = 75) from a population that has a mean of x = 78 and a standard deviation of x =
22 Sampling Distributions & Expected Outcomes Raw Scores z X X X X Sample eans z μ σ
23 Assume a normally distributed population of values with x = 60 and x = 9. What is the probability of an individual obtaining a score of 62 or higher? 1. Determine z score 2. Locate area of curve 3. Identify proportion z 0.22 X 9 p X 62 p =.4129 z =
24 Assume a normally distributed population of values with x = 60 and x = 9. What is the probability of obtaining a sample mean of 62 or higher based on a sample size of 36 individuals? 1. Determine z score 2. Locate area of curve 3. Identify proportion p z / 36 p =.0918 z =
25 Assume a normally distributed population of values with x = 84 and x = 14. What is the probability of obtaining a sample mean of 77 or higher based on a sample size of 45 individuals? 1. Determine z score 2. Locate area of curve 3. Identify proportion p z / 45 p =.9996 p =.4996 p = z = 0.00
26 Assume a normally distributed population of values with x = 754 and x = 241. What is the probability of obtaining a sample mean equal or higher to 847 or equal or lower than 661 based on a sample size of 31 individuals? p 1. Determine z score 2. Locate area of curve 3. Identify proportion 661, z / z / 31 p =.0316 p =.0158 p = z =
27 Dilemma: I want to collect sample data from a population and I want to identify the extent to which the sample outcome is consistent with the underlying population. I have a few major concerns: 1) Will a sample outcome resemble the original population? Sample means will vary as a function of sampling error. 2) To what extent will different sample outcomes vary from each other on average? The standard error of the mean provides expected sample variability. 3) How can I use information about the population to make predictions of future sample outcomes? By using z-scores, the shape of the sampling distribution of means (via CLT) provides expectations for future mean outcomes.
28 Terminology Sampling error Sampling distribution of the mean ean of the sampling distribution of the mean and standard error Concepts and Skills Understand the nature of the sampling process and sampling error Be aware of the purpose of sampling distributions Be able to determine the characteristics of sampling distributions via central limit theorem Be able to evaluate the probability of obtaining specific sample outcomes from a population using z scores
Week 11 Sample Means, CLT, Correlation
 Week 11 Sample Means, CLT, Correlation Slides by Suraj Rampure Fall 2017 Administrative Notes Complete the mid semester survey on Piazza by Nov. 8! If 85% of the class fills it out, everyone will get a
Theoretical Foundations
 Theoretical Foundations Sampling Distribution and Central Limit Theorem Monia Ranalli monia.ranalli@uniroma3.it Ranalli M. Theoretical Foundations - Sampling Distribution and Central Limit Theorem Lesson
CHAPTER 5 Probabilistic Features of the Distributions of Certain Sample Statistics
 CHAPTER 5 Probabilistic Features of the Distributions of Certain Sample Statistics Key Words Sampling Distributions Distribution of the Sample Mean Distribution of the difference between Two Sample Means
Sampling Distributions
 Sampling Error As you may remember from the first lecture, samples provide incomplete information about the population In particular, a statistic (e.g., M, s) computed on any particular sample drawn from
CHAPTER 7 THE SAMPLING DISTRIBUTION OF THE MEAN. 7.1 Sampling Error; The need for Sampling Distributions
 CHAPTER 7 THE SAMPLING DISTRIBUTION OF THE MEAN 7.1 Sampling Error; The need for Sampling Distributions Sampling Error the error resulting from using a sample characteristic (statistic) to estimate a population
T.I.H.E. IT 233 Statistics and Probability: Sem. 1: 2013 ESTIMATION AND HYPOTHESIS TESTING OF TWO POPULATIONS
 ESTIMATION AND HYPOTHESIS TESTING OF TWO POPULATIONS In our work on hypothesis testing, we used the value of a sample statistic to challenge an accepted value of a population parameter. We focused only
The Central Limit Theorem
 The Central Limit Theorem Business Statistics Plan for Today Sampling distribution of sample means The standard error of the mean The Central Limit Theorem The Law of Large Numbers z-scores for samples
Chapter 8 Sampling Distributions Defn Defn
 1 Chapter 8 Sampling Distributions Defn: Sampling error is the error resulting from using a sample to infer a population characteristic. Example: We want to estimate the mean amount of Pepsi-Cola in 12-oz.
FRANKLIN UNIVERSITY PROFICIENCY EXAM (FUPE) STUDY GUIDE
 STUDY GUIDE") FRANKLIN UNIVERSITY PROFICIENCY EXAM (FUPE) STUDY GUIDE Course Title: Probability and Statistics (MATH 80) Recommended Textbook(s): Number & Type of Questions: Probability and Statistics for Engineers
FRANKLIN UNIVERSITY PROFICIENCY EXAM (FUPE) STUDY GUIDE Course Title: Probability and Statistics (MATH 80) Recommended Textbook(s): Number & Type of Questions: Probability and Statistics for Engineers
Chapter 18. Sampling Distribution Models. Bin Zou STAT 141 University of Alberta Winter / 10
 Chapter 18 Sampling Distribution Models Bin Zou (bzou@ualberta.ca) STAT 141 University of Alberta Winter 2015 1 / 10 Population VS Sample Example 18.1 Suppose a total of 10,000 patients in a hospital and
Statistics and Data Analysis in Geology
 Statistics and Data Analysis in Geology 6. Normal Distribution probability plots central limits theorem Dr. Franz J Meyer Earth and Planetary Remote Sensing, University of Alaska Fairbanks 1 2 An Enormously
Examine characteristics of a sample and make inferences about the population
 Chapter 11 Introduction to Inferential Analysis Learning Objectives Understand inferential statistics Explain the difference between a population and a sample Explain the difference between parameter and
Lecture 15. DATA 8 Spring Sampling. Slides created by John DeNero and Ani Adhikari
 DATA 8 Spring 2018 Lecture 15 Sampling Slides created by John DeNero (denero@berkeley.edu) and Ani Adhikari (adhikari@berkeley.edu) Announcements Probability Basics Lowest value: 0 Chance of event that
AP Physics B Math Competancy Test
 AP Physics B Math Competancy Test The following test is designed to allow you, the student, to determine if your math skills are adequate for the AP Physics B course offered by PHC Prep Academy. Be aware
1/18/2011. Chapter 6: Probability. Introduction to Probability. Probability Definition
 Chapter 6: Probability Introduction to Probability The role of inferential statistics is to use the sample data as the basis for answering questions about the population. To accomplish this goal, inferential
Lecture 8 Sampling Theory
 Lecture 8 Sampling Theory Thais Paiva STA 111 - Summer 2013 Term II July 11, 2013 1 / 25 Thais Paiva STA 111 - Summer 2013 Term II Lecture 8, 07/11/2013 Lecture Plan 1 Sampling Distributions 2 Law of Large
Sampling Distribution Models. Chapter 17
 Sampling Distribution Models Chapter 17 Objectives: 1. Sampling Distribution Model 2. Sampling Variability (sampling error) 3. Sampling Distribution Model for a Proportion 4. Central Limit Theorem 5. Sampling
" M A #M B. Standard deviation of the population (Greek lowercase letter sigma) σ 2
 σ 2") Notation and Equations for Final Exam Symbol Definition X The variable we measure in a scientific study n The size of the sample N The size of the population M The mean of the sample µ The mean of the
Notation and Equations for Final Exam Symbol Definition X The variable we measure in a scientific study n The size of the sample N The size of the population M The mean of the sample µ The mean of the
Review of Multiple Regression
 Ronald H. Heck 1 Let s begin with a little review of multiple regression this week. Linear models [e.g., correlation, t-tests, analysis of variance (ANOVA), multiple regression, path analysis, multivariate
Practice Questions for Final
 Math 39 Practice Questions for Final June. 8th 4 Name : 8. Continuous Probability Models You should know Continuous Random Variables Discrete Probability Distributions Expected Value of Discrete Random
Class 15. Daniel B. Rowe, Ph.D. Department of Mathematics, Statistics, and Computer Science. Marquette University MATH 1700
 Class 15 Daniel B. Rowe, Ph.D. Department of Mathematics, Statistics, and Computer Science Copyright 17 by D.B. Rowe 1 Agenda: Recap Chapter 7.1 7. Lecture Chapter 7. Discussion of Chapters Problem Solving
TEST 1 M3070 Fall 2003
 TEST 1 M3070 Fall 2003 Show all work. Name: Problem 1. (10 points Below are the daily high temperatures, in degrees Fahrenheit, for Salt Lake City during July 2003 (31 days. The decimal point is 1 digit(s
CENTRAL LIMIT THEOREM VISUALIZED IN EXCEL
 Scientific Issues Jan Długosz University in Częstochowa Mathematics XIX (2014) 51 55 CENTRAL LIMIT THEOREM VISUALIZED IN EXCEL JITKA HODAŇOVÁ, TOMÁŠ ZDRÁHAL Abstract The Central Limit Theorem states that
Management Programme. MS-08: Quantitative Analysis for Managerial Applications
 MS-08 Management Programme ASSIGNMENT SECOND SEMESTER 2013 MS-08: Quantitative Analysis for Managerial Applications School of Management Studies INDIRA GANDHI NATIONAL OPEN UNIVERSITY MAIDAN GARHI, NEW
Performance Evaluation and Hypothesis Testing
 Performance Evaluation and Hypothesis Testing 1 Motivation Evaluating the performance of learning systems is important because: Learning systems are usually designed to predict the class of future unlabeled
Least complex Most complex
 Grade 8 Mathematics Grade 8: Mathematics: The Number System (NS) MGSE8.NS.1 Know that numbers that are not rational are called irrational. Understand informally that every number has a decimal expansion;
Distribution of sample means
 Two types of statistics: and Distribution of sample means Mean Standard deviation Population Sample The relationship between Population and Samples is described in terms of Probability A jar with 100 marbles,
UCLA STAT 233 Statistical Methods in Biomedical Imaging
 UCLA STAT 233 Statistical Methods in Biomedical Imaging Instructor: Ivo Dinov, Asst. Prof. In Statistics and Neurology University of California, Los Angeles, Spring 2004 http://www.stat.ucla.edu/~dinov/
Topic 3: Sampling Distributions, Confidence Intervals & Hypothesis Testing. Road Map Sampling Distributions, Confidence Intervals & Hypothesis Testing
 Topic 3: Sampling Distributions, Confidence Intervals & Hypothesis Testing ECO22Y5Y: Quantitative Methods in Economics Dr. Nick Zammit University of Toronto Department of Economics Room KN3272 n.zammit
3 Lecture 3 Notes: Measures of Variation. The Boxplot. Definition of Probability
 3 Lecture 3 Notes: Measures of Variation. The Boxplot. Definition of Probability 3.1 Week 1 Review Creativity is more than just being different. Anybody can plan weird; that s easy. What s hard is to be
Statistic: a that can be from a sample without making use of any unknown. In practice we will use to establish unknown parameters.
 Chapter 9: Sampling Distributions 9.1: Sampling Distributions IDEA: How often would a given method of sampling give a correct answer if it was repeated many times? That is, if you took repeated samples
Economics 250 Midterm 1 17 October 2013 three
 Economics 250 Midterm 1 17 October 2013 Instructions: You may use a hand calculator. Do not hand in the question and formula sheets. Answer all three questions in the answer booklet provided. Show your
THE SAMPLING DISTRIBUTION OF THE MEAN
 THE SAMPLING DISTRIBUTION OF THE MEAN COGS 14B JANUARY 26, 2017 TODAY Sampling Distributions Sampling Distribution of the Mean Central Limit Theorem INFERENTIAL STATISTICS Inferential statistics: allows
Lecture 8 Continuous Random Variables
 Lecture 8 Continuous Random Variables Example: The random number generator will spread its output uniformly across the entire interval from 0 to 1 as we allow it to generate a long sequence of numbers.
CHAPTER TOPICS. Sampling Distribution of the Mean The Central Limit Theorem Sampling Distribution of the Proportion Sampling from Finite Population
 Distribusi Sampel CHAPTER TOPICS Sampling Distribution of the Mean The Central Limit Theorem Sampling Distribution of the Proportion Sampling from Finite Population 2 3 WHY STUDY SAMPLING DISTRIBUTIONS
Single Sample Means. SOCY601 Alan Neustadtl
 Single Sample Means SOCY601 Alan Neustadtl The Central Limit Theorem If we have a population measured by a variable with a mean µ and a standard deviation σ, and if all possible random samples of size
Main Points. Note: Tutorial #1, help session, and due date have all been pushed back 1 class period. Will send Tutorial #1 by end of day.
 1) Demographic PVA -- age- and stage-structured matrices Main Points Pre-reading: Thursday 21 September: Marris Tuesday 26 September: NA Note: Tutorial #1, help session, and due date have all been pushed
Probability and Inference. POLI 205 Doing Research in Politics. Populations and Samples. Probability. Fall 2015
 Fall 2015 Population versus Sample Population: data for every possible relevant case Sample: a subset of cases that is drawn from an underlying population Inference Parameters and Statistics A parameter
Producing data Toward statistical inference. Section 3.3
 Producing data Toward statistical inference Section 3.3 Toward statistical inference Idea: Use sampling to understand statistical inference Statistical inference is when a conclusion about a population
Grade Math (HL) Curriculum
 Curriculum") Grade 11-12 Math (HL) Curriculum Unit of Study (Core Topic 1 of 7): Algebra Sequences and Series Exponents and Logarithms Counting Principles Binomial Theorem Mathematical Induction Complex Numbers Uses
Grade 11-12 Math (HL) Curriculum Unit of Study (Core Topic 1 of 7): Algebra Sequences and Series Exponents and Logarithms Counting Principles Binomial Theorem Mathematical Induction Complex Numbers Uses
There are three units of study within the Pure Mathematics Specialisation. ATPPMA001 - Unit 1:
 The Pure Mathematics Specialisation applies to those who require foundation General Mathematic knowledge and skills for entrance to tertiary study in a relevant discipline or field. There are three units
Business Statistics: Lecture 8: Introduction to Estimation & Hypothesis Testing
 Business Statistics: Lecture 8: Introduction to Estimation & Hypothesis Testing Agenda Introduction to Estimation Point estimation Interval estimation Introduction to Hypothesis Testing Concepts en terminology
Lecture # 31. Questions of Marks 3. Question: Solution:
 Lecture # 31 Given XY = 400, X = 5, Y = 4, S = 4, S = 3, n = 15. Compute the coefficient of correlation between XX and YY. r =0.55 X Y Determine whether two variables XX and YY are correlated or uncorrelated
6.2A Linear Transformations
 6.2 Transforming and Combining Random Variables 6.2A Linear Transformations El Dorado Community College considers a student to be full time if he or she is taking between 12 and 18 credits. The number
Sampling. What is the purpose of sampling: Sampling Terms. Sampling and Sampling Distributions
 Sampling and Sampling Distributions Normal Distribution Aims of Sampling Basic Principles of Probability Types of Random Samples Sampling Distributions Sampling Distribution of the Mean Standard Error
Inferential Statistics
 Inferential Statistics Part 1 Sampling Distributions, Point Estimates & Confidence Intervals Inferential statistics are used to draw inferences (make conclusions/judgements) about a population from a sample.
Parameter Estimation, Sampling Distributions & Hypothesis Testing
 Parameter Estimation, Sampling Distributions & Hypothesis Testing Parameter Estimation & Hypothesis Testing In doing research, we are usually interested in some feature of a population distribution (which
Chapter 7. Sample Variability
 Chapter 7 Sample Variability 1 Chapter 7 Overview 7-1 Sampling Distributions 7-2 The Sampling Distribution of Sample Means 7-3 Application of The Sampling Distribution of Sample Means 2 7-1 Sampling Distributions
Learning Objectives. IQ Scores of Students. Correlation. Correlation and Simple Linear Regression
 NURS56 INTRODUCTION TO STATISTICS Learning Objectives Correlation and Simple Linear Regression Patsy P.H. Chau (Email: phpchau@hku.hk). To examine how two continuous variables are related Adapted from
7 Estimation. 7.1 Population and Sample (P.91-92)
") 7 Estimation MATH1015 Biostatistics Week 7 7.1 Population and Sample (P.91-92) Suppose that we wish to study a particular health problem in Australia, for example, the average serum cholesterol level for
7 Estimation MATH1015 Biostatistics Week 7 7.1 Population and Sample (P.91-92) Suppose that we wish to study a particular health problem in Australia, for example, the average serum cholesterol level for
I used college textbooks because they were the only resource available to evaluate measurement uncertainty calculations.
 Introduction to Statistics By Rick Hogan Estimating uncertainty in measurement requires a good understanding of Statistics and statistical analysis. While there are many free statistics resources online,
A multi-model multi-analysis limited area ensemble: calibration issues
 - European Centre for Mediu-Range Weather Forecasts - Third International Workshop on Verification Methods Reading 31 Jan 2 Feb. 2007 A ulti-odel ulti-analysis liited area enseble: calibration issues M.
2017 SACE/NTCET university aggregate to ATAR conversion
 Fact Sheet 2017 SACE/NTCET university aggregate to conversion to conversion Each year SATAC publishes tables showing the relationship between the SACE/NTCET university aggregate and the. This provides
Monte Carlo Integration. Computer Graphics CMU /15-662, Fall 2016
 Monte Carlo Integration Computer Graphics CMU 15-462/15-662, Fall 2016 Talk Announcement Jovan Popovic, Senior Principal Scientist at Adobe Research will be giving a seminar on Character Animator -- Monday
ADMS2320.com. We Make Stats Easy. Chapter 4. ADMS2320.com Tutorials Past Tests. Tutorial Length 1 Hour 45 Minutes
 We Make Stats Easy. Chapter 4 Tutorial Length 1 Hour 45 Minutes Tutorials Past Tests Chapter 4 Page 1 Chapter 4 Note The following topics will be covered in this chapter: Measures of central location Measures
8/28/2017. Both examine linear (straight line) relationships Correlation works with a pair of scores One score on each of two variables (X and Y)
 relationships Correlation works with a pair of scores One score on each of two variables (X and Y)") PS 5101: Advanced Statistics for Psychological and Behavioral Research 1 Both examine linear (straight line) relationships Correlation works with a pair of scores One score on each of two variables ( and
PS 5101: Advanced Statistics for Psychological and Behavioral Research 1 Both examine linear (straight line) relationships Correlation works with a pair of scores One score on each of two variables ( and
2012 Assessment Report. Mathematics with Calculus Level 3 Statistics and Modelling Level 3
 National Certificate of Educational Achievement 2012 Assessment Report Mathematics with Calculus Level 3 Statistics and Modelling Level 3 90635 Differentiate functions and use derivatives to solve problems
Notice that these facts about the mean and standard deviation of X are true no matter what shape the population distribution has
 7.3.1 The Sampling Distribution of x- bar: Mean and Standard Deviation The figure above suggests that when we choose many SRSs from a population, the sampling distribution of the sample mean is centered
Probability Year 9. Terminology
 Probability Year 9 Terminology Probability measures the chance something happens. Formally, we say it measures how likely is the outcome of an event. We write P(result) as a shorthand. An event is some
Probability. Hosung Sohn
 Probability Hosung Sohn Department of Public Administration and International Affairs Maxwell School of Citizenship and Public Affairs Syracuse University Lecture Slide 4-3 (October 8, 2015) 1/ 43 Table
STAT Lecture Slides Variability in Estimates & Central Limit Theorem. Yibi Huang Department of Statistics University of Chicago
 STAT 22000 Lecture Slides Variability in Estimates & Central Limit Theorem Yibi Huang Department of Statistics University of Chicago Outline This set of slides covers section 4.1 and 4.4 in the text, which
Inference for Distributions Inference for the Mean of a Population. Section 7.1
 Inference for Distributions Inference for the Mean of a Population Section 7.1 Statistical inference in practice Emphasis turns from statistical reasoning to statistical practice: Population standard deviation,
Aim, Underlying chemistry and Experimental Approach. Candidate A. National 5 Chemistry Assignment 2017 Workshop 1 - evidence
 National 5 Chemistry Assignment 207 Workshop - evidence Aim, Underlying chemistry and Experimental Approach Candidate A SQA www.understandingstandards.org.uk of 9 National 5 Chemistry Assignment 207 Workshop
Statistics for Engineers Lecture 5 Statistical Inference
 Statistics for Engineers Lecture 5 Statistical Inference Chong Ma Department of Statistics University of South Carolina chongm@email.sc.edu March 13, 2017 Chong Ma (Statistics, USC) STAT 509 Spring 2017
Performance Task: Concentration vs. Time
 NAME DATE : Concentration vs. Time Goal of task Target concept: Understand reaction rates in both qualitative and quantitative terms For this task you will be evaluated on your ability to: Construct an
Probability Year 10. Terminology
 Probability Year 10 Terminology Probability measures the chance something happens. Formally, we say it measures how likely is the outcome of an event. We write P(result) as a shorthand. An event is some
Sampling (Statistics)
") Systems & Biomedical Engineering Department SBE 304: Bio-Statistics Random Sampling and Sampling Distributions Dr. Ayman Eldeib Fall 2018 Sampling (Statistics) Sampling is that part of statistical practice
Systems & Biomedical Engineering Department SBE 304: Bio-Statistics Random Sampling and Sampling Distributions Dr. Ayman Eldeib Fall 2018 Sampling (Statistics) Sampling is that part of statistical practice
GRAPHICAL REPRESENTATION OF CORRELATION ANALYSIS OF ORDERED DATA BY LINKED VECTOR PATTERN
 Journ. Japan Statist. Soc. 6. 2. 1976. 17 `25 GRAPHICAL REPRESENTATION OF CORRELATION ANALYSIS OF ORDERED DATA BY LINKED VECTOR PATTERN Masaaki Taguri*, Makoto Hiramatsu**, Tomoyoshi Kittaka** and Kazumasa
Section 6-5 THE CENTRAL LIMIT THEOREM AND THE SAMPLING DISTRIBUTION OF. The Central Limit Theorem. Central Limit Theorem: For all samples of
 Section 6-5 The Central Limit Theorem THE CENTRAL LIMIT THEOREM Central Limit Theorem: For all samples of the same size with 30, the sampling distribution of can be approximated by a normal distribution
Probably About Probability p <.05. Probability. What Is Probability?
 Probably About p
Econ 3790: Business and Economics Statistics. Instructor: Yogesh Uppal
 Econ 3790: Business and Economics Statistics Instructor: Yogesh Uppal Email: yuppal@ysu.edu Chapter 7, Part A Sampling and Sampling Distributions Simple Random Sampling Point Estimation Introduction to
Chapter 18 Resampling and Nonparametric Approaches To Data
 Chapter 18 Resampling and Nonparametric Approaches To Data 18.1 Inferences in children s story summaries (McConaughy, 1980): a. Analysis using Wilcoxon s rank-sum test: Younger Children Older Children
Hypothesis Testing in Action: t-tests
 Hypothesis Testing in Action: t-tests Mark Muldoon School of Mathematics, University of Manchester Mark Muldoon, January 30, 2007 t-testing - p. 1/31 Overview large Computing t for two : reprise Today
Lecture 27. DATA 8 Spring Sample Averages. Slides created by John DeNero and Ani Adhikari
 DATA 8 Spring 2018 Lecture 27 Sample Averages Slides created by John DeNero (denero@berkeley.edu) and Ani Adhikari (adhikari@berkeley.edu) Announcements Questions for This Week How can we quantify natural
Differential Privacy
 CS 380S Differential Privacy Vitaly Shmatikov most slides from Adam Smith (Penn State) slide 1 Reading Assignment Dwork. Differential Privacy (invited talk at ICALP 2006). slide 2 Basic Setting DB= x 1
15.0 Linear Regression
 15.0 Linear Regression 1 Answer Questions Lines Correlation Regression 15.1 Lines The algebraic equation for a line is Y = β 0 + β 1 X 2 The use of coordinate axes to show functional relationships was
Empirical Evaluation (Ch 5)
") Empirical Evaluation (Ch 5) how accurate is a hypothesis/model/dec.tree? given 2 hypotheses, which is better? accuracy on training set is biased error: error train (h) = #misclassifications/ S train error
Empirical Evaluation (Ch 5) how accurate is a hypothesis/model/dec.tree? given 2 hypotheses, which is better? accuracy on training set is biased error: error train (h) = #misclassifications/ S train error
High-dimensional regression
 High-dimensional regression Advanced Methods for Data Analysis 36-402/36-608) Spring 2014 1 Back to linear regression 1.1 Shortcomings Suppose that we are given outcome measurements y 1,... y n R, and
Difference in two or more average scores in different groups
 ANOVAs Analysis of Variance (ANOVA) Difference in two or more average scores in different groups Each participant tested once Same outcome tested in each group Simplest is one-way ANOVA (one variable as
Math 3338: Probability (Fall 2006)
") Math 3338: Probability (Fall 2006) Jiwen He Section Number: 10853 http://math.uh.edu/ jiwenhe/math3338fall06.html Probability p.1/8 Chapter Two: Probability (I) Probability p.2/8 2.1 Sample Spaces and
Math 3338: Probability (Fall 2006) Jiwen He Section Number: 10853 http://math.uh.edu/ jiwenhe/math3338fall06.html Probability p.1/8 Chapter Two: Probability (I) Probability p.2/8 2.1 Sample Spaces and
Fundamentals of Measurement and Error Analysis
 Lab 1 Fundamentals of Measurement and Error Analysis 1.1 Overview This first laboratory exercise introduces key concepts and statistical and plotting tools that are used throughout the entire sequence
Statistical inference
 Statistical inference Contents 1. Main definitions 2. Estimation 3. Testing L. Trapani MSc Induction - Statistical inference 1 1 Introduction: definition and preliminary theory In this chapter, we shall
ESTIMATION BY CONFIDENCE INTERVALS
 ESTIMATION BY CONFIDENCE INTERVALS Introduction We are now in the knowledge that a population parameter can be estimated from sample data by calculating the corresponding point estimate. This chapter is
Basic Concepts of Probability
 Probability Probability theory is the branch of math that deals with random events Probability is used to describe how likely a particular outcome is in a random event the probability of obtaining heads
STA Why Sampling? Module 6 The Sampling Distributions. Module Objectives
 STA 2023 Module 6 The Sampling Distributions Module Objectives In this module, we will learn the following: 1. Define sampling error and explain the need for sampling distributions. 2. Recognize that sampling
One-sample categorical data: approximate inference
 One-sample categorical data: approximate inference Patrick Breheny October 6 Patrick Breheny Biostatistical Methods I (BIOS 5710) 1/25 Introduction It is relatively easy to think about the distribution
Semiparametric Regression
 Semiparametric Regression Patrick Breheny October 22 Patrick Breheny Survival Data Analysis (BIOS 7210) 1/23 Introduction Over the past few weeks, we ve introduced a variety of regression models under
Test One Mathematics Fall 2009
 Test One Mathematics 35.2 Fall 29 TO GET FULL CREDIT YOU MUST SHOW ALL WORK! I have neither given nor received aid in the completion of this test. Signature: pts. 2 pts. 3 5 pts. 2 pts. 5 pts. 6(i) pts.
Measures of Central Tendency and their dispersion and applications. Acknowledgement: Dr Muslima Ejaz
 Measures of Central Tendency and their dispersion and applications Acknowledgement: Dr Muslima Ejaz LEARNING OBJECTIVES: Compute and distinguish between the uses of measures of central tendency: mean,
Probability and Statistics
 Probability and Statistics Kristel Van Steen, PhD 2 Montefiore Institute - Systems and Modeling GIGA - Bioinformatics ULg kristel.vansteen@ulg.ac.be CHAPTER 4: IT IS ALL ABOUT DATA 4a - 1 CHAPTER 4: IT
HYPOTHESIS TESTING. Hypothesis Testing
 MBA 605 Business Analytics Don Conant, PhD. HYPOTHESIS TESTING Hypothesis testing involves making inferences about the nature of the population on the basis of observations of a sample drawn from the population.
Periodic Table Project Element Card Sketches
 Kensington Woods High School Name: Chemistry/Art Periodic Table Project Element Card Sketches In this project, we will use graphic design skills to redesign the periodic table. You are challenged with
6 Central Limit Theorem. (Chs 6.4, 6.5)
") 6 Central Limit Theorem (Chs 6.4, 6.5) Motivating Example In the next few weeks, we will be focusing on making statistical inference about the true mean of a population by using sample datasets. Examples?
6 Central Limit Theorem (Chs 6.4, 6.5) Motivating Example In the next few weeks, we will be focusing on making statistical inference about the true mean of a population by using sample datasets. Examples?
+ Check for Understanding
 n Measuring Position: Percentiles n One way to describe the location of a value in a distribution is to tell what percent of observations are less than it. Definition: The p th percentile of a distribution
Unit 2. Describing Data: Numerical
 Unit 2 Describing Data: Numerical Describing Data Numerically Describing Data Numerically Central Tendency Arithmetic Mean Median Mode Variation Range Interquartile Range Variance Standard Deviation Coefficient
MA 320 Introductory Probability, Section 1 Spring 2017 Final Exam Practice May. 1, Exam Scores. Question Score Total. Name:
 MA 320 Introductory Probability, Section 1 Spring 2017 Final Exam Practice May. 1, 2017 Exam Scores Question Score Total 1 10 Name: Last 4 digits of student ID #: No books or notes may be used. Turn off
equal to the of the. Sample variance: Population variance: **The sample variance is an unbiased estimator of the
 DEFINITION The variance (aka dispersion aka spread) of a set of values is a measure of equal to the of the. Sample variance: s Population variance: **The sample variance is an unbiased estimator of the
44.2. Two-Way Analysis of Variance. Introduction. Prerequisites. Learning Outcomes
 Two-Way Analysis of Variance 44 Introduction In the one-way analysis of variance (Section 441) we consider the effect of one factor on the values taken by a variable Very often, in engineering investigations,
Changes to assessment in Higher Chemistry. 1 Revised National Qualification course assessment
 Questions & Answers Changes to assessment in Higher Chemistry 1 Revised National Qualification course assessment The hydrogenation of oils isn t mentioned in the new Higher Chemistry Course Specification,
Interval estimation. October 3, Basic ideas CLT and CI CI for a population mean CI for a population proportion CI for a Normal mean
 Interval estimation October 3, 2018 STAT 151 Class 7 Slide 1 Pandemic data Treatment outcome, X, from n = 100 patients in a pandemic: 1 = recovered and 0 = not recovered 1 1 1 0 0 0 1 1 1 0 0 1 0 1 0 0