THE SAMPLING DISTRIBUTION OF THE MEAN
|
|
|
- Meghan Stevenson
- 6 years ago
- Views:
Transcription
1 THE SAMPLING DISTRIBUTION OF THE MEAN COGS 14B JANUARY 26, 2017
2 TODAY Sampling Distributions Sampling Distribution of the Mean Central Limit Theorem
3 INFERENTIAL STATISTICS Inferential statistics: allows us to generalize beyond collections of actual observations and allows us to determine how confident we can be that our conclusions are correct


4 PROBABILITY AND STATISTICS Probability plays an important role in inferential statistics. There is always variability that comes along with any particular result, and so each result is viewed within the context of many possible results that could have occurred by chance. Rare Outcomes Common Outcomes Rare Outcomes
5 PROBABILITY AND STATISTICS Statisticians interpret different proportions of area under theoretical curves as probabilities of random outcomes. If I took all of your midterm scores and computed a z-score for each one: What is the probability that one quiz score taken at random will be less than -1.5? 6.7% What is the probability that one quiz score taken at random will be greater than 1? 15.9% What is the probability that one quiz score taken at random will be less than -1.5 OR greater than 1? ADDITION RULE! (they are mutually exclusive) 6.7% % = 22.6%
6 REVIEW: NORMAL DISTRIBUTIONS Many distributions found in nature have some common properties: Symmetric, with mean, median and modes of equal value Distributions are bell-shaped Examples: heights and weights of people, physical characteristics of plants/ animals, errors in measurement Sampling error (as an error in measurement) is normally distributed.
7 PROBABILITY AND STATISTICS In inferential statistics, we are making an inferential leap from interpreting probability as providing an estimated relative frequency of an event in a future random sampling from the population. When is an event (sample) common vs rare?
8 PROBABILITY AND STATISTICS Common outcomes: nothing special has occurred Rare outcomes: something special has occurred
9 UCSD = 67 COGS 14B = 68
10 UCSD = 67 COGS 14B = 75
11 Imagine you measured the temperature (in F) each day in a week and got the following measurements: 70, 72, 68, 50, 90, 80, 72 The average of these temperatures is 70 degrees. If the standard deviation for temperature for that week is typically 25 degrees, is a temperature of 90 unusually warm? What if the standard deviation is typically 5 degrees?
12 SAMPLING DISTRIBUTIONS A sampling distribution acts as a frame of reference for statistical decision making. It is a theoretical probability distribution of the possible values of some sample statistic that would occur if we were to draw all possible samples of a fixed size from a given population. The sampling distribution allows us to determine whether, given the variability among all possible sample means, the one we observed is a common out come or a rare outcome.
13 SAMPLING DISTRIBUTIONS Imagine that each one of you asks a random sample of 10 people in this class what their height is. (assume the population is all COGS 14B students this quarter). You each calculate the average height of your sample to get the sample mean. When you report back, would you expect all of your sample means to be the same? How much would you expect them to differ?
14 SAMPLING DISTRIBUTION OF THE MEAN Random samples rarely exactly represent the underlying population. We rely on sampling distributions to give us a better idea whether the sample we ve observed represents a common or rare outcome. Sampling distribution of the mean: probability distribution of means for ALL possible random samples OF A GIVEN SIZE from some population ALL possible samples is a lot! Example: All possible samples of size 10 from a class of 90 = 5.72*10 12
15 EXAMPLE: SAT MATH SCORES Take a sample of 10 random students from a population of 100. You might get a mean of 502 for that sample. Then, you do it again with a new sample of 10 students. You might get a mean of 480 this time. Then, you do it again. And again. And again and get the following means for each of those three new samples of 10 people: 550, 517, 472
16

17
18
19 SAMPLING DISTRIBUTION OF THE MEAN Sampling distribution of the mean: probability distribution of means for ALL possible random samples OF A GIVEN SIZE from some population By taking a sample from a population, we don t know whether the sample mean reflects the population mean. From the sampling distribution, we can calculate the possibility of a particular sample mean: chances are that our observed sample mean originates from the middle of the true sampling distribution. The sampling distribution of the mean has a mean, standard deviation, etc. just like other distributions you ve encountered!
20 REVIEW: A particular observed sample mean: A) equals the population mean B) equals the mean of the sampling distribution C) most likely has a value in the vicinity of the population mean D) is equally likely to have a value either near to, or far from, the population mean.
21 SAMPLING DISTRIBUTION OF THE MEAN Keeping notation straight: Type of Distribution Sample Population Sampling Distribution of the mean Mean (mean of all sample means) Standard Deviation (standard error of the mean)
22 SAMPLING DISTRIBUTION OF THE MEAN The mean of the sampling distribution ALWAYS equals the mean of the population.
23 SAMPLING DISTRIBUTION OF THE MEAN Standard error of the mean: measures the variability in the sampling distribution (roughly represents the average amount the sample means deviate from the mean of the sampling distribution) Sample size: n Remember, there s a different distribution for each different sample size!
24 REVIEW: Assuming the standard deviation remains constant, which of the following sample sizes would result in the largest value of standard error? A) 100 B) 16 C) 25 D) 49

25 INTUITION BUILDER
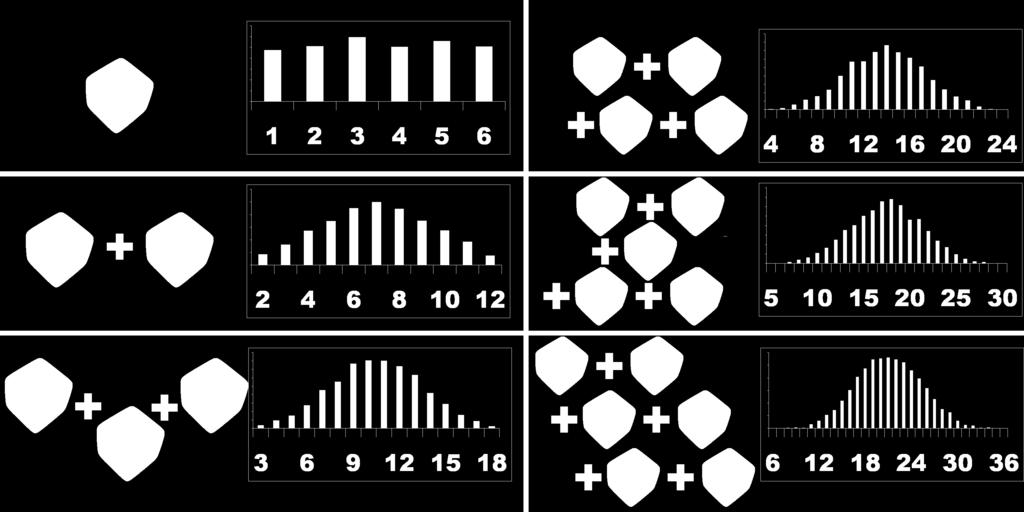
26 CENTRAL LIMIT THEOREM When the sample size is sufficiently large, the shape of the sampling distribution approximates a normal curve (regardless of the shape of the parent population)! The distribution of sample means is a more normal distribution than a distribution of scores, even if the underlying population is not normal.

 Sampling Distribution of the Mean")
")
27 CENTRAL LIMIT THEOREM Parent Populations (can be of any shape, size, etc.) Sampling Distribution of the Mean (approximates a normal curve, no matter the parent population)
28 DEMO: PUTTING IT ALL TOGETHER In a bag of M&Ms, there are 6 colors: brown, yellow, red, orange, green and blue. In a single bag, which color do you think there is the most of? Guess the proportion of orange M&Ms. If each student took a random sample of the number of orange M&Ms in 10 M&Ms bags to get an average number of orange M&Ms, would you expect each sample to have the same average number of orange M&Ms? Why or why not?
29 DEMO: PUTTING IT ALL TOGETHER 1. Get into groups of 3-4 (20 groups total) 2. Each group will receive one bag of M&Ms. 3. Open your bag of M&Ms and sort them by color. 4. Count the number of orange M&Ms and the total number of M&Ms in your bag. 5. Send a member of each group to randomly sample 10 groups, asking how many orange M&Ms they have (you ll receive a piece of paper saying which specific groups to sample it s been randomly generated for you). 6. Calculate the average number of orange M&Ms in your sample of 10 groups. 7. Create a histogram of the number of orange M&Ms in your 10 samples. 8. The mean of your data represent a single sample mean (where n = 10). It is this one mean that will get added to the overall distribution of sample means, which represents the distribution of ALL possible sample means.
30 DEMO: PUTTING IT ALL TOGETHER Create a histogram of all of our sample MEANS
31 DEMO: PUTTING IT ALL TOGETHER What is a sample in this context? What is the parent population? What is the sampling distribution of means? How does the histogram of your particular sample differ from the sampling distribution of the mean? What is the population parameter? What is the statistic? Do we know the value(s) of the parameter(s)? Do we know the value(s) of the statistic(s)? Did each sample have the same average number of orange M&Ms? Describe the variability of the distribution of sample proportions (shape, central tendency, spread).
32 DEMO: PUTTING IT ALL TOGETHER Imagine that the proportions of different colors in a bag of M&Ms are based on consumer preference tests.* 24% blue, 20% orange, 16% green, 14% yellow, 13% red, 13% brown We ll base our simulation on these proportions. candy=2
33 DEMO: REVIEW 1. As sample size increases, does how well the sample statistic resemble the population parameter change? 2. What value does the sampling distribution tend to center around? 3. Does this observation depend on sample size? 4. If M&M colors were uniformly distributed (~16.67% of each color in each bag), would the shape of the sampling distribution change? Why or why not? 5. How does this relate to the Central Limit Theorem?
34 DEMO: NEXT STEPS PREVIEW FOR WHAT S NEXT: Inferential statistical tests! Based on the claim that 20% of M&Ms in a bag are supposed to be orange, do we have evidence that our bags of M&Ms differ from that proportion?
35 SUMMARY A sampling distribution acts as a frame of reference for statistical decision making. Sampling distribution of the mean: Probability distribution of means for ALL possible random samples OF A GIVEN SIZE from some population The mean of sampling distribution of the mean is always equal to the mean of the population The standard error of the mean measures the variability in the sampling distribution Central limit theorem: regardless of the shape of the population, the shape of the sampling distribution approximates a normal curve IF THE SAMPLE SIZE IS SUFFICIENTLY LARGE
36 ONLINE DEMO 2 action=mininav&bcsid=8500&itemid= &assetid=353506&r esourceid=34768&newwindow=true

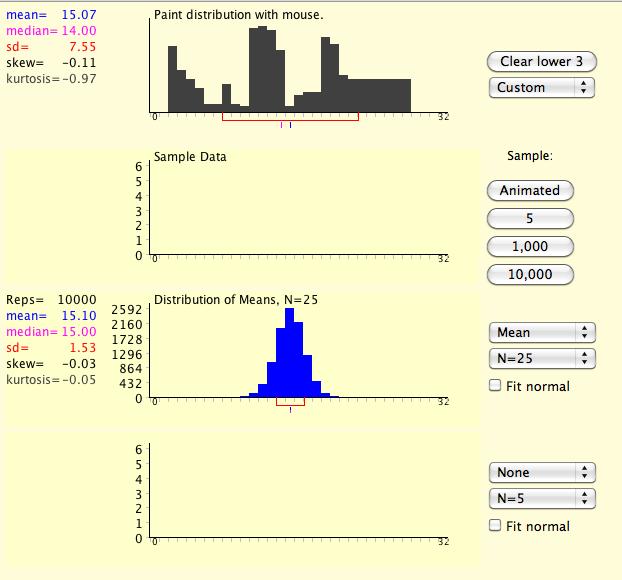


37 SAME PARENT DISTRIBUTION, DIFFERENT SAMPLE SIZES N=5 N=25
38 FOR NEXT TIME Play around with the sampling distribution demo online!
Statistic: a that can be from a sample without making use of any unknown. In practice we will use to establish unknown parameters.
 Chapter 9: Sampling Distributions 9.1: Sampling Distributions IDEA: How often would a given method of sampling give a correct answer if it was repeated many times? That is, if you took repeated samples
Probability Distributions
 Probability Distributions Probability This is not a math class, or an applied math class, or a statistics class; but it is a computer science course! Still, probability, which is a math-y concept underlies
Additional practice with these ideas can be found in the problems for Tintle Section P.1.1
 Psych 10 / Stats 60, Practice Problem Set 3 (Week 3 Material) Part 1: Decide if each variable below is quantitative, ordinal, or categorical. If the variable is categorical, also decide whether or not
Inferential Statistics
 Inferential Statistics Part 1 Sampling Distributions, Point Estimates & Confidence Intervals Inferential statistics are used to draw inferences (make conclusions/judgements) about a population from a sample.
Chapter 26: Comparing Counts (Chi Square)
") Chapter 6: Comparing Counts (Chi Square) We ve seen that you can turn a qualitative variable into a quantitative one (by counting the number of successes and failures), but that s a compromise it forces
Chapter 6: Comparing Counts (Chi Square) We ve seen that you can turn a qualitative variable into a quantitative one (by counting the number of successes and failures), but that s a compromise it forces
Chapter 18. Sampling Distribution Models. Copyright 2010, 2007, 2004 Pearson Education, Inc.
 Chapter 18 Sampling Distribution Models Copyright 2010, 2007, 2004 Pearson Education, Inc. Normal Model When we talk about one data value and the Normal model we used the notation: N(μ, σ) Copyright 2010,
Lecture 27. DATA 8 Spring Sample Averages. Slides created by John DeNero and Ani Adhikari
 DATA 8 Spring 2018 Lecture 27 Sample Averages Slides created by John DeNero (denero@berkeley.edu) and Ani Adhikari (adhikari@berkeley.edu) Announcements Questions for This Week How can we quantify natural
MIT BLOSSOMS INITIATIVE
 MIT BLOSSOMS INITIATIVE The Broken Stick Problem Taught by Professor Richard C. Larson Mitsui Professor of Engineering Systems and of Civil and Environmental Engineering Segment 1 Hi! My name is Dick Larson
Lesson 19: Understanding Variability When Estimating a Population Proportion
 Lesson 19: Understanding Variability When Estimating a Population Proportion Student Outcomes Students understand the term sampling variability in the context of estimating a population proportion. Students
Unit 4 Probability. Dr Mahmoud Alhussami
 Unit 4 Probability Dr Mahmoud Alhussami Probability Probability theory developed from the study of games of chance like dice and cards. A process like flipping a coin, rolling a die or drawing a card from
Unit 22: Sampling Distributions
 Unit 22: Sampling Distributions Summary of Video If we know an entire population, then we can compute population parameters such as the population mean or standard deviation. However, we generally don
CHAPTER 10 Comparing Two Populations or Groups
 CHAPTER 10 Comparing Two Populations or Groups 10.1 Comparing Two Proportions The Practice of Statistics, 5th Edition Starnes, Tabor, Yates, Moore Bedford Freeman Worth Publishers Comparing Two Proportions
3/30/2009. Probability Distributions. Binomial distribution. TI-83 Binomial Probability
 Random variable The outcome of each procedure is determined by chance. Probability Distributions Normal Probability Distribution N Chapter 6 Discrete Random variables takes on a countable number of values
Last week: Sample, population and sampling distributions finished with estimation & confidence intervals
 Past weeks: Measures of central tendency (mean, mode, median) Measures of dispersion (standard deviation, variance, range, etc). Working with the normal curve Last week: Sample, population and sampling
green green green/green green green yellow green/yellow green yellow green yellow/green green yellow yellow yellow/yellow yellow
 CHAPTER PROBLEM Did Mendel s results from plant hybridization experiments contradict his theory? Gregor Mendel conducted original experiments to study the genetic traits of pea plants. In 1865 he wrote
Sampling Distribution Models. Chapter 17
 Sampling Distribution Models Chapter 17 Objectives: 1. Sampling Distribution Model 2. Sampling Variability (sampling error) 3. Sampling Distribution Model for a Proportion 4. Central Limit Theorem 5. Sampling
AIM HIGH SCHOOL. Curriculum Map W. 12 Mile Road Farmington Hills, MI (248)
") AIM HIGH SCHOOL Curriculum Map 2923 W. 12 Mile Road Farmington Hills, MI 48334 (248) 702-6922 www.aimhighschool.com COURSE TITLE: Statistics DESCRIPTION OF COURSE: PREREQUISITES: Algebra 2 Students will
AIM HIGH SCHOOL Curriculum Map 2923 W. 12 Mile Road Farmington Hills, MI 48334 (248) 702-6922 www.aimhighschool.com COURSE TITLE: Statistics DESCRIPTION OF COURSE: PREREQUISITES: Algebra 2 Students will
where Female = 0 for males, = 1 for females Age is measured in years (22, 23, ) GPA is measured in units on a four-point scale (0, 1.22, 3.45, etc.
 GPA is measured in units on a four-point scale (0, 1.22, 3.45, etc.") Notes on regression analysis 1. Basics in regression analysis key concepts (actual implementation is more complicated) A. Collect data B. Plot data on graph, draw a line through the middle of the scatter
Notes on regression analysis 1. Basics in regression analysis key concepts (actual implementation is more complicated) A. Collect data B. Plot data on graph, draw a line through the middle of the scatter
STAT/SOC/CSSS 221 Statistical Concepts and Methods for the Social Sciences. Random Variables
 STAT/SOC/CSSS 221 Statistical Concepts and Methods for the Social Sciences Random Variables Christopher Adolph Department of Political Science and Center for Statistics and the Social Sciences University
Concepts in Statistics
 Concepts in Statistics -- A Theoretical and Hands-on Approach Statistics The Art of Distinguishing Luck from Chance Statistics originally meant the collection of population and economic information vital
MATH 1150 Chapter 2 Notation and Terminology
 MATH 1150 Chapter 2 Notation and Terminology Categorical Data The following is a dataset for 30 randomly selected adults in the U.S., showing the values of two categorical variables: whether or not the
Last two weeks: Sample, population and sampling distributions finished with estimation & confidence intervals
 Past weeks: Measures of central tendency (mean, mode, median) Measures of dispersion (standard deviation, variance, range, etc). Working with the normal curve Last two weeks: Sample, population and sampling
COSC 341 Human Computer Interaction. Dr. Bowen Hui University of British Columbia Okanagan
 COSC 341 Human Computer Interaction Dr. Bowen Hui University of British Columbia Okanagan 1 Last Class Introduced hypothesis testing Core logic behind it Determining results significance in scenario when:
Probability and Statistics
 Probability and Statistics Kristel Van Steen, PhD 2 Montefiore Institute - Systems and Modeling GIGA - Bioinformatics ULg kristel.vansteen@ulg.ac.be CHAPTER 4: IT IS ALL ABOUT DATA 4a - 1 CHAPTER 4: IT
Chapter 9 Inferences from Two Samples
 Chapter 9 Inferences from Two Samples 9-1 Review and Preview 9-2 Two Proportions 9-3 Two Means: Independent Samples 9-4 Two Dependent Samples (Matched Pairs) 9-5 Two Variances or Standard Deviations Review
Supporting Australian Mathematics Project. A guide for teachers Years 11 and 12. Probability and statistics: Module 25. Inference for means
 1 Supporting Australian Mathematics Project 2 3 4 6 7 8 9 1 11 12 A guide for teachers Years 11 and 12 Probability and statistics: Module 2 Inference for means Inference for means A guide for teachers
Examine characteristics of a sample and make inferences about the population
 Chapter 11 Introduction to Inferential Analysis Learning Objectives Understand inferential statistics Explain the difference between a population and a sample Explain the difference between parameter and
Probability deals with modeling of random phenomena (phenomena or experiments whose outcomes may vary)
") Chapter 14 From Randomness to Probability How to measure a likelihood of an event? How likely is it to answer correctly one out of two true-false questions on a quiz? Is it more, less, or equally likely
Chapter 14 From Randomness to Probability How to measure a likelihood of an event? How likely is it to answer correctly one out of two true-false questions on a quiz? Is it more, less, or equally likely
MA 1125 Lecture 15 - The Standard Normal Distribution. Friday, October 6, Objectives: Introduce the standard normal distribution and table.
 MA 1125 Lecture 15 - The Standard Normal Distribution Friday, October 6, 2017. Objectives: Introduce the standard normal distribution and table. 1. The Standard Normal Distribution We ve been looking at
MALLOY PSYCH 3000 MEAN & VARIANCE PAGE 1 STATISTICS MEASURES OF CENTRAL TENDENCY. In an experiment, these are applied to the dependent variable (DV)
") MALLOY PSYCH 3000 MEAN & VARIANCE PAGE 1 STATISTICS Descriptive statistics Inferential statistics MEASURES OF CENTRAL TENDENCY In an experiment, these are applied to the dependent variable (DV) E.g., MEASURES
MALLOY PSYCH 3000 MEAN & VARIANCE PAGE 1 STATISTICS Descriptive statistics Inferential statistics MEASURES OF CENTRAL TENDENCY In an experiment, these are applied to the dependent variable (DV) E.g., MEASURES
Probability and Samples. Sampling. Point Estimates
 Probability and Samples Sampling We want the results from our sample to be true for the population and not just the sample But our sample may or may not be representative of the population Sampling error
20 Hypothesis Testing, Part I
 20 Hypothesis Testing, Part I Bob has told Alice that the average hourly rate for a lawyer in Virginia is $200 with a standard deviation of $50, but Alice wants to test this claim. If Bob is right, she
Chapter 18. Sampling Distribution Models /51
 Chapter 18 Sampling Distribution Models 1 /51 Homework p432 2, 4, 6, 8, 10, 16, 17, 20, 30, 36, 41 2 /51 3 /51 Objective Students calculate values of central 4 /51 The Central Limit Theorem for Sample
MAT Mathematics in Today's World
 MAT 1000 Mathematics in Today's World Last Time We discussed the four rules that govern probabilities: 1. Probabilities are numbers between 0 and 1 2. The probability an event does not occur is 1 minus
Do students sleep the recommended 8 hours a night on average?
 BIEB100. Professor Rifkin. Notes on Section 2.2, lecture of 27 January 2014. Do students sleep the recommended 8 hours a night on average? We first set up our null and alternative hypotheses: H0: μ= 8
How to write maths (well)
") How to write maths (well) Dr Euan Spence 29 September 2017 These are the slides from a talk I gave to the new first-year students at Bath, annotated with some of the things I said (which appear in boxes
How to write maths (well) Dr Euan Spence 29 September 2017 These are the slides from a talk I gave to the new first-year students at Bath, annotated with some of the things I said (which appear in boxes
Statistics Boot Camp. Dr. Stephanie Lane Institute for Defense Analyses DATAWorks 2018
 Statistics Boot Camp Dr. Stephanie Lane Institute for Defense Analyses DATAWorks 2018 March 21, 2018 Outline of boot camp Summarizing and simplifying data Point and interval estimation Foundations of statistical
Correlation. January 11, 2018
 Correlation January 11, 2018 Contents Correlations The Scattterplot The Pearson correlation The computational raw-score formula Survey data Fun facts about r Sensitivity to outliers Spearman rank-order
Chapter 8: Sampling Distributions. A survey conducted by the U.S. Census Bureau on a continual basis. Sample
 Chapter 8: Sampling Distributions Section 8.1 Distribution of the Sample Mean Frequently, samples are taken from a large population. Example: American Community Survey (ACS) A survey conducted by the U.S.
appstats27.notebook April 06, 2017
 Chapter 27 Objective Students will conduct inference on regression and analyze data to write a conclusion. Inferences for Regression An Example: Body Fat and Waist Size pg 634 Our chapter example revolves
Objectives. 2.1 Scatterplots. Scatterplots Explanatory and response variables Interpreting scatterplots Outliers
 Objectives 2.1 Scatterplots Scatterplots Explanatory and response variables Interpreting scatterplots Outliers Adapted from authors slides 2012 W.H. Freeman and Company Relationship of two numerical variables
Chi Square Analysis M&M Statistics. Name Period Date
 Chi Square Analysis M&M Statistics Name Period Date Have you ever wondered why the package of M&Ms you just bought never seems to have enough of your favorite color? Or, why is it that you always seem
Two-sample Categorical data: Testing
 Two-sample Categorical data: Testing Patrick Breheny April 1 Patrick Breheny Introduction to Biostatistics (171:161) 1/28 Separate vs. paired samples Despite the fact that paired samples usually offer
the yellow gene from each of the two parents he wrote Experiments in Plant
 CHAPTER PROBLEM Did Mendel s results from plant hybridization experiments contradict his theory? Gregor Mendel conducted original experiments offspring can have a yellow pod only if it inherits to study
THE SIMPLE PROOF OF GOLDBACH'S CONJECTURE. by Miles Mathis
 THE SIMPLE PROOF OF GOLDBACH'S CONJECTURE by Miles Mathis miles@mileswmathis.com Abstract Here I solve Goldbach's Conjecture by the simplest method possible. I do this by first calculating probabilites
M1-Lesson 8: Bell Curves and Standard Deviation
 M1-Lesson 8: Bell Curves and Standard Deviation 1. Read over the description of a bell curve and then mark the picture with the characteristics of the curve. Which characteristic was confusing for you?
Exam #2 Results (as percentages)
") Oct. 30 Assignment: Read Chapter 19 Try exercises 1, 2, and 4 on p. 424 Exam #2 Results (as percentages) Mean: 71.4 Median: 73.3 Soda attitudes 2015 In a Gallup poll conducted Jul. 8 12, 2015, 1009 adult
Oct. 30 Assignment: Read Chapter 19 Try exercises 1, 2, and 4 on p. 424 Exam #2 Results (as percentages) Mean: 71.4 Median: 73.3 Soda attitudes 2015 In a Gallup poll conducted Jul. 8 12, 2015, 1009 adult
Chapter 27 Summary Inferences for Regression
 Chapter 7 Summary Inferences for Regression What have we learned? We have now applied inference to regression models. Like in all inference situations, there are conditions that we must check. We can test
 Intro to Confidence Intervals: A estimate is a single statistic based on sample data to estimate a population parameter Simplest approach But not always very precise due to variation in the sampling distribution
Chapter 6 The Standard Deviation as a Ruler and the Normal Model
 Chapter 6 The Standard Deviation as a Ruler and the Normal Model Overview Key Concepts Understand how adding (subtracting) a constant or multiplying (dividing) by a constant changes the center and/or spread
ACMS Statistics for Life Sciences. Chapter 13: Sampling Distributions
 ACMS 20340 Statistics for Life Sciences Chapter 13: Sampling Distributions Sampling We use information from a sample to infer something about a population. When using random samples and randomized experiments,
Keppel, G. & Wickens, T.D. Design and Analysis Chapter 2: Sources of Variability and Sums of Squares
 Keppel, G. & Wickens, T.D. Design and Analysis Chapter 2: Sources of Variability and Sums of Squares K&W introduce the notion of a simple experiment with two conditions. Note that the raw data (p. 16)
COMP6053 lecture: Sampling and the central limit theorem. Jason Noble,
 COMP6053 lecture: Sampling and the central limit theorem Jason Noble, jn2@ecs.soton.ac.uk Populations: long-run distributions Two kinds of distributions: populations and samples. A population is the set
8.1 Frequency Distribution, Frequency Polygon, Histogram page 326
 page 35 8 Statistics are around us both seen and in ways that affect our lives without us knowing it. We have seen data organized into charts in magazines, books and newspapers. That s descriptive statistics!
Week 11 Sample Means, CLT, Correlation
 Week 11 Sample Means, CLT, Correlation Slides by Suraj Rampure Fall 2017 Administrative Notes Complete the mid semester survey on Piazza by Nov. 8! If 85% of the class fills it out, everyone will get a
Section 6.2 Hypothesis Testing
 Section 6.2 Hypothesis Testing GIVEN: an unknown parameter, and two mutually exclusive statements H 0 and H 1 about. The Statistician must decide either to accept H 0 or to accept H 1. This kind of problem
Chapter I, Introduction from Online Statistics Education: An Interactive Multimedia Course of Study comprises public domain material by David M.
 Chapter I, Introduction from Online Statistics Education: An Interactive Multimedia Course of Study comprises public domain material by David M. Lane, project leader, Rice University. Distributions by
STANDARDS OF LEARNING CONTENT REVIEW NOTES. ALGEBRA I Part II 1 st Nine Weeks,
 STANDARDS OF LEARNING CONTENT REVIEW NOTES ALGEBRA I Part II 1 st Nine Weeks, 2016-2017 OVERVIEW Algebra I Content Review Notes are designed by the High School Mathematics Steering Committee as a resource
MATH 3C: MIDTERM 1 REVIEW. 1. Counting
 MATH 3C: MIDTERM REVIEW JOE HUGHES. Counting. Imagine that a sports betting pool is run in the following way: there are 20 teams, 2 weeks, and each week you pick a team to win. However, you can t pick
Warm-up Using the given data Create a scatterplot Find the regression line
 Time at the lunch table Caloric intake 21.4 472 30.8 498 37.7 335 32.8 423 39.5 437 22.8 508 34.1 431 33.9 479 43.8 454 42.4 450 43.1 410 29.2 504 31.3 437 28.6 489 32.9 436 30.6 480 35.1 439 33.0 444
4/1/2012. Test 2 Covers Topics 12, 13, 16, 17, 18, 14, 19 and 20. Skipping Topics 11 and 15. Topic 12. Normal Distribution
 Test 2 Covers Topics 12, 13, 16, 17, 18, 14, 19 and 20 Skipping Topics 11 and 15 Topic 12 Normal Distribution 1 Normal Distribution If Density Curve is symmetric, single peaked, bell-shaped then it is
Chapter 6. The Standard Deviation as a Ruler and the Normal Model 1 /67
 Chapter 6 The Standard Deviation as a Ruler and the Normal Model 1 /67 Homework Read Chpt 6 Complete Reading Notes Do P129 1, 3, 5, 7, 15, 17, 23, 27, 29, 31, 37, 39, 43 2 /67 Objective Students calculate
Now, with all the definitions we ve made, we re ready see where all the math stuff we took for granted, like numbers, come from.
 The Natural Numbers Now, with all the definitions we ve made, we re ready see where all the math stuff we took for granted, like numbers, come from. Math 144 Summer 2012 (UCR) Pro-Notes July 6, 2012 1
Probability and Independence Terri Bittner, Ph.D.
 Probability and Independence Terri Bittner, Ph.D. The concept of independence is often confusing for students. This brief paper will cover the basics, and will explain the difference between independent
Data 1 Assessment Calculator allowed for all questions
 Foundation Higher Data Assessment Calculator allowed for all questions MATHSWATCH All questions Time for the test: 45 minutes Name: Grade Title of clip Marks Score Percentage Clip 84 D Data collection
Statistics 511 Additional Materials
 Sampling Distributions and Central Limit Theorem In previous topics we have discussed taking a single observation from a distribution. More accurately, we looked at the probability of a single variable
Data 1 Assessment Calculator allowed for all questions
 Foundation Higher Data Assessment Calculator allowed for all questions MATHSWATCH All questions Time for the test: 4 minutes Name: MATHSWATCH ANSWERS Grade Title of clip Marks Score Percentage Clip 84
Lab 5 for Math 17: Sampling Distributions and Applications
 Lab 5 for Math 17: Sampling Distributions and Applications Recall: The distribution formed by considering the value of a statistic for every possible sample of a given size n from the population is called
Two-sample inference: Continuous data
 Two-sample inference: Continuous data Patrick Breheny April 6 Patrick Breheny University of Iowa to Biostatistics (BIOS 4120) 1 / 36 Our next several lectures will deal with two-sample inference for continuous
M 225 Test 1 B Name SHOW YOUR WORK FOR FULL CREDIT! Problem Max. Points Your Points Total 75
 M 225 Test 1 B Name SHOW YOUR WORK FOR FULL CREDIT! Problem Max. Points Your Points 1-13 13 14 3 15 8 16 4 17 10 18 9 19 7 20 3 21 16 22 2 Total 75 1 Multiple choice questions (1 point each) 1. Look at
/633 Introduction to Algorithms Lecturer: Michael Dinitz Topic: Asymptotic Analysis, recurrences Date: 9/7/17
 601.433/633 Introduction to Algorithms Lecturer: Michael Dinitz Topic: Asymptotic Analysis, recurrences Date: 9/7/17 2.1 Notes Homework 1 will be released today, and is due a week from today by the beginning
Review Packet for Test 8 - Statistics. Statistical Measures of Center: and. Statistical Measures of Variability: and.
 Name: Teacher: Date: Section: Review Packet for Test 8 - Statistics Part I: Measures of CENTER vs. Measures of VARIABILITY Statistical Measures of Center: and. Statistical Measures of Variability: and.
Experimental Design, Data, and Data Summary
 Chapter Six Experimental Design, Data, and Data Summary Tests of Hypotheses Because science advances by tests of hypotheses, scientists spend much of their time devising ways to test hypotheses. There
Hypothesis testing. Data to decisions
 Hypothesis testing Data to decisions The idea Null hypothesis: H 0 : the DGP/population has property P Under the null, a sample statistic has a known distribution If, under that that distribution, the
Lesson 8: Graphs of Simple Non Linear Functions
 Student Outcomes Students examine the average rate of change for non linear functions and learn that, unlike linear functions, non linear functions do not have a constant rate of change. Students determine
Data Analysis and Statistical Methods Statistics 651
 Data Analysis and Statistical Methods Statistics 651 http://www.stat.tamu.edu/~suhasini/teaching.html Suhasini Subba Rao Review Our objective: to make confident statements about a parameter (aspect) in
Math 140 Introductory Statistics
 5. Models of Random Behavior Math 40 Introductory Statistics Professor Silvia Fernández Chapter 5 Based on the book Statistics in Action by A. Watkins, R. Scheaffer, and G. Cobb. Outcome: Result or answer
Toss 1. Fig.1. 2 Heads 2 Tails Heads/Tails (H, H) (T, T) (H, T) Fig.2
 (T, T) (H, T) Fig.2") 1 Basic Probabilities The probabilities that we ll be learning about build from the set theory that we learned last class, only this time, the sets are specifically sets of events. What are events? Roughly,
1 Basic Probabilities The probabilities that we ll be learning about build from the set theory that we learned last class, only this time, the sets are specifically sets of events. What are events? Roughly,
Math 140 Introductory Statistics
 Math 140 Introductory Statistics Professor Silvia Fernández Lecture 8 Based on the book Statistics in Action by A. Watkins, R. Scheaffer, and G. Cobb. 5.1 Models of Random Behavior Outcome: Result or answer
Section 7.1 How Likely are the Possible Values of a Statistic? The Sampling Distribution of the Proportion
 Section 7.1 How Likely are the Possible Values of a Statistic? The Sampling Distribution of the Proportion CNN / USA Today / Gallup Poll September 22-24, 2008 www.poll.gallup.com 12% of Americans describe
Business Statistics:
 Chapter 7 Student Lecture Notes 7-1 Department of Quantitative Methods & Information Systems Business Statistics: Chapter 7 Introduction to Sampling Distributions QMIS 220 Dr. Mohammad Zainal Chapter Goals
Announcements. Lecture 1 - Data and Data Summaries. Data. Numerical Data. all variables. continuous discrete. Homework 1 - Out 1/15, due 1/22
 Announcements Announcements Lecture 1 - Data and Data Summaries Statistics 102 Colin Rundel January 13, 2013 Homework 1 - Out 1/15, due 1/22 Lab 1 - Tomorrow RStudio accounts created this evening Try logging
2. Probability. Chris Piech and Mehran Sahami. Oct 2017
 2. Probability Chris Piech and Mehran Sahami Oct 2017 1 Introduction It is that time in the quarter (it is still week one) when we get to talk about probability. Again we are going to build up from first
Measures of Central Tendency. Mean, Median, and Mode
 Measures of Central Tendency Mean, Median, and Mode Population study The population under study is the 20 students in a class Imagine we ask the individuals in our population how many languages they speak.
Section 3.4 Normal Distribution MDM4U Jensen
 Section 3.4 Normal Distribution MDM4U Jensen Part 1: Dice Rolling Activity a) Roll two 6- sided number cubes 18 times. Record a tally mark next to the appropriate number after each roll. After rolling
Recap: Ø Distribution Shape Ø Mean, Median, Mode Ø Standard Deviations
 DAY 4 16 Jan 2014 Recap: Ø Distribution Shape Ø Mean, Median, Mode Ø Standard Deviations Two Important Three-Standard-Deviation Rules 1. Chebychev s Rule : Implies that at least 89% of the observations
Background to Statistics
 FACT SHEET Background to Statistics Introduction Statistics include a broad range of methods for manipulating, presenting and interpreting data. Professional scientists of all kinds need to be proficient
MATH 3012 N Solutions to Review for Midterm 2
 MATH 301 N Solutions to Review for Midterm March 7, 017 1. In how many ways can a n rectangular checkerboard be tiled using 1 and pieces? Find a closed formula. If t n is the number of ways to tile the
MATH 10 INTRODUCTORY STATISTICS
 MATH 10 INTRODUCTORY STATISTICS Tommy Khoo Your friendly neighbourhood graduate student. Week 1 Chapter 1 Introduction What is Statistics? Why do you need to know Statistics? Technical lingo and concepts:
Linear Regression. Linear Regression. Linear Regression. Did You Mean Association Or Correlation?
 Did You Mean Association Or Correlation? AP Statistics Chapter 8 Be careful not to use the word correlation when you really mean association. Often times people will incorrectly use the word correlation
Stat 20 Midterm 1 Review
 Stat 20 Midterm Review February 7, 2007 This handout is intended to be a comprehensive study guide for the first Stat 20 midterm exam. I have tried to cover all the course material in a way that targets
You have 3 hours to complete the exam. Some questions are harder than others, so don t spend too long on any one question.
 Data 8 Fall 2017 Foundations of Data Science Final INSTRUCTIONS You have 3 hours to complete the exam. Some questions are harder than others, so don t spend too long on any one question. The exam is closed
Math 243 Chapter 7 Supplement The Sampling Distribution of a Proportion
 Math 243 Chapter 7 Supplement The Sampling Distribution of a Proportion The number of tattoos was quantitative data so we found a sampling distribution for the mean of each sample. Now we are going to
L6: Regression II. JJ Chen. July 2, 2015
 L6: Regression II JJ Chen July 2, 2015 Today s Plan Review basic inference based on Sample average Difference in sample average Extrapolate the knowledge to sample regression coefficients Standard error,
= - = = 1 = -2 = 3. Jeremy can plant 10 trees in 4 hours. How many trees can he plant in 10 hours? A. 16
 7 th Grade Only 1. Four points are graphed on a line. Which point is located at the opposite of -2? A. Point J B. Point K C. Point L D. Point M OPPOSITE means the SAME DISTANCE from 0 on the opposite side
Math 7 /Unit 5 Practice Test: Statistics
 Math 7 /Unit 5 Practice Test: Statistics Name: Date: Define the terms below and give an example. 1. population 2. random sample 3. interquartile range (IQR) 4. Determine whether each sample is a random
Objective: Recognize halves within a circular clock face and tell time to the half hour.
 Lesson 13 1 5 Lesson 13 Objective: Recognize halves within a circular clock face and tell time to the half Suggested Lesson Structure Fluency Practice Application Problem Concept Development Student Debrief
Examples of frequentist probability include games of chance, sample surveys, and randomized experiments. We will focus on frequentist probability sinc
 FPPA-Chapters 13,14 and parts of 16,17, and 18 STATISTICS 50 Richard A. Berk Spring, 1997 May 30, 1997 1 Thinking about Chance People talk about \chance" and \probability" all the time. There are many
CENTRAL LIMIT THEOREM (CLT)
") CENTRAL LIMIT THEOREM (CLT) A sampling distribution is the probability distribution of the sample statistic that is formed when samples of size n are repeatedly taken from a population. If the sample statistic
CENTRAL LIMIT THEOREM (CLT) A sampling distribution is the probability distribution of the sample statistic that is formed when samples of size n are repeatedly taken from a population. If the sample statistic
MAT Mathematics in Today's World
 MAT 1000 Mathematics in Today's World Last Time 1. Three keys to summarize a collection of data: shape, center, spread. 2. Can measure spread with the fivenumber summary. 3. The five-number summary can