UPDATED 04 JUN 12. Memorandum
|
|
|
- Hillary Osborne
- 5 years ago
- Views:
Transcription
1 Memorandum To: From: Chris Behling Shung Chiu Kent Hokens Mike Navin Neil Schwanz Mike McGuire George Filz Date: December 26, 2010 Subject: Interim Guidance, Revised "LPILE Method" to Calculate Bending Moments in Batter Piles for T-Walls Subject to Downdrag, Contract No. W912P8-07-D-0062 The purpose of this memorandum is to provide interim guidance for the revised LPILE Method for calculating bending moments induced by downdrag acting on batter piles that support T-Walls. The principal reason for the revision is to incorporate project-specific nonlinear settlement profiles throughout the LPILE method, instead of the linear variation of settlement that was applied in the LPILE analysis component of the step-by-step simplified procedure described in our draft report, which is dated 5 May 2010 and titled LPILE Method for Evaluating Bending Moments in Batter Piles Due to Ground Settlement for Pile-Supported Floodwalls in New Orleans and Vicinity (Contract No. W912P8-07-D-0062). The linear variation employed in the procedure in our draft report was simple to apply, but it embodied only the specific nonlinear settlement variations that occurred in the FLAC analyses that formed the basis of the procedure. The revised LPILE method described in this memorandum allows for project-specific nonlinear variation of settlement profiles. In addition to allowing for project-specific nonlinear variation of settlement profiles, this interim guidance modifies and/or clarifies two other issues: The 5 May 2010 draft report allowed for a reduction in pile bending moment when T- walls supported by only two rows of batter piles are subject to asymmetric fill loads; whereas T-walls supported by three rows of piles and subject to asymmetric fill loads experienced an increase in pile bending moment. The apparent reduction occurred because the asymmetric fill loads were represented by pressures instead of soil zones in the FLAC analyses, and this allowed for displacement and "unbending" of the piles due to translation and rotation of the pile cap. Recent FLAC analyses with the T-wall embedded in levee fill indicate that the previously calculated reduction is unconservative, and that reduction has been removed from the procedure. Instead, the 1 F-1
2 recent FLAC analyses indicate that asymmetric fill loading produce similar increases in bending moment, whether the T-wall is embedded in levee fill or three rows of piles support the T-wall. For piles that do not extend to a sand bearing layer, the settlement profile should extend to the toe of the piles, not to the neutral plane, for purposes of calculating bending moment in the LPILE method. Although only two sets of FLAC analyses have been performed that compare piles with their toes in sand to piles with their toes in clay, both sets of analyses show a slight increase in bending moment for piles with their toes in clay. This outcome is better represented by extending the settlement profile to the toe of the piles than by decreasing the settlement profile to only the depth of the neutral plane. This interim guidance is for T-walls with their pile caps embedded in soft clay. The final revised LPILE method will contain guidance for T-walls with their pile caps embedded in levee fill, but the details have not yet been developed for that case. This memorandum describes the step-by-step procedure in the revised LPILE Method for T- walls embedded in soft clay. To apply the revised LPILE method, designers should have access to the 5 May 2010 draft report because some figures and tables from that document are referenced in this memorandum. Based on review comments, much of the notation used in the 5 May 2010 draft report has been revised to be easier to follow. Attachment A of this memorandum provides a table showing the correspondence between the previous and current sets of notation. Attachment B provides a sample calculation of soil movement to be applied in LPILE for Case 19 presented in Table 11 of the 5 May 2010 draft report. The procedures described in this memorandum will ultimately be incorporated in a revised report that presents the revised LPILE mehtod. The assumptions listed in Table 1, which are reproduced from Table 15 in the 5 May 2010 draft report except as amended herein, apply to the revised LPILE Method, as do the limitations of the method provided in Section 6 of the 5 May 2010 draft report. Revisions to the assumptions of the method are shown in italics in Table 1, while redactions are shown in strikethrough. It is worth reiterating that there are other sources contributing to the total bending moment in the batter piles, such as flood loading, and that the bending moments determined using the LPILE method described in this memorandum are only the moments due to downdrag. 2 F-2
3 Table 1: Assumptions used to develop a method for calculating downdrag-induced bending moments Assumptions 1 The foundation soils consist primarily of compressible clay overlying which may include a sand bearing layer, as shown in Figures 22 and 23 of the 5 May 2010 draft report. The model was developed considering a clay layer extending 84 ft below the ground surface at El -2, with batter piles extending from the bottom of the T-wall, which is at El -5, to El The piles are battered at 3H:1V, corresponding to a batter angle, β, of 18.4 o from vertical. 3 For symmetric embankment loading and for asymmetric loading resulting in more soil compression on the flood side of the T-Wall, the down-drag induced bending moment in the flood-side pile is considered to be critical. 4 For asymmetric loading resulting in more soil compression on the protected side, the bending moment in the protected-side pile is considered to be critical. Reductions of bending moment in the protected-side pile due to asymmetry of the T-Wall stem and middle batter pile are ignored. 5 For T-Walls located within an embankment, as shown to Figure 23 of the 5 May 2010 draft report, the compression of the embankment material is considered to be insignificant compared to the compression of the underlying soft clay. 6 The clay is slightly overconsolidated near the ground surface but is otherwise normally consolidated. 7 The connection of the piles to the T-Wall has little moment resistance and can be reasonably approximated by a pin support. 8 Axial loading in the pile does not significantly impact the downdrag-induced bending moments, i.e., the P- effect is not included in this method. 9 Soil movement normal to the pile axis is responsible for the downdrag-induced bending moments. 10 Soil compressions s FS and s PS (defined in Step 1) are less than inches Revised Step-by-Step Procedure (replaces Section 4.2 of the 5 May 2010 draft report) 1. Calculate the compression profile of the soil due to the embankment surcharge using ordinary geotechnical analysis procedures, without considering the stiffening effect of the batter piles. The compression profile should be evaluated over the vertical interval extending from the elevation of the base of the T-Wall to the elevation of the top of the bearing layer or to the pile tip elevation for profiles lacking a distinct bearing layer. Thus, the height of the vertical interval is equal to L c cos(β), where L c is the length of the batter pile from the base of the T-wall to the top of the bearing layer or the length of the batter pile from the base of the T-wall to the pile tip elevation for profiles lacking a 3 F-3
4 distinct bearing layer, and β is the batter angle from vertical. The soil compression calculations should be performed along two vertical profiles, which are located at the plan view positions on the flood side and protected side at distances equal to 0.25(L c )sin(β) from the location where the outer flood-side and protected-side battered piles intersect the T-Wall base. Note that these soil compressions are calculated along vertical profiles at the 0.25(L c )sin(β) locations, not along the alignment of the batter piles. The total compression calculated on the flood side, s FS, should be compared to the total compression on the protected side, s PS, and the maximum settlement and differential settlement determined according to s max = max{s FS, s PS } and Δs= s FS s PS. The weight of the T-wall and the fill directly overlying the T-wall base is not included in the settlement calculations. 2. For the plan view location that produces the maximum settlement, s max, develop a normalized compression profile over the vertical interval of height L c cos(β), extending from the elevation of the base of the T-Wall to the elevation of top of the bearing layer or to the pile tip elevation for profiles lacking a distinct bearing layer. The normalized compression profile is used to determine the distribution of the soil movements applied in LPILE. An example of a normalized compression profile is shown below in Figure Distribution of Compression Normalized Settlement, s/s max Simplified Fit Normalized Depth, z/lc Figure 1: Sample normalized compression profile 4 F-4
5 The normalized compression profile shown in Figure 1 was generated by dividing the settlement calculated in Step 1 for the critical side of the floodwall at a particular depth, s, by the maximum settlement, s max, calculated over the entire vertical interval defined by L c cos(β). The normalized settlement, s/s max, is plotted against the normalized depth within the compressible clay layer, z cos(β)/l c cos(β) = z/l c. A simplified fit can be applied to the normalized distribution of compression, as shown in Figure 1, to reduce the data entry required to specify soil movements in LPILE. 3. Calculate the vertical soil movement at the top of the pile, d V,0, to be applied at the top of the pile in LPILE using Figure 2 and the value of s max determined in Step 1 to account for the stiffening effect of the piles on soil compression. Not that the plot and equation in Figure 2 are only applicable over the s max range from 0 to 43 in. Vertical soil movement at pile top, d V,0 (in.) d V,0 = (s max, in.) (s max, in.) s max (in.) Figure 2: Vertical soil movement applied at the top of the pile versus the greater calculated soil compression 4. For asymmetric embankment loading, determine the horizontal soil movement, d H,0, to be considered at the top of the pile in the LPILE analysis using Figure 3 with the value of Δs determined in Step 1. Not that the plot and equation in Figure 3 are only applicable over the Δs range from 0 to 21 in. 5 F-5
6 Horizontal Soil Movement applied at pile top, d H,0 (in.) d H,0 = 0.295(Δs, in.) Δs(in.) Figure 3: Horizontal soil movement considered at the top of the pile in LPILE versus Δs 5. Determine the magnitude of soil movement to be used in LPILE as displacement of the spring supports at the top of the pile, d N,0, by summing the components of d V,0 and d H,0 that act normal to the pile. d N,0 = d V,0 *sinβ + d H,0 *cosβ (2) 6. Apply soil movement along the pile (0 z L c ) using the normalized soil compression profile developed in Step 2. The magnitude of soil movement, d N,z, to be used in LPILE at a location along the pile, z, is determined by multiplying the normalized soil compression at the location, s/s max, by the value of d N,0 determined in Step Determine the sign of the pile batter angle according to the convention shown in Figure 4 for soil moving against the pile, which is opposite of the convention given in the LPILE 5.0 Plus User s Manual for soils resisting lateral movement of the pile. 6 F-6
7 Pile batter Direction of Positive Displacement + Soil movement +β Depth along Pile Figure 4: Sign convention in LPILE for soil movement and pile batter 8. Transform the soil profile according to Figure 5 to match the coordinate system used in LPILE, which is parallel to the pile axis. Pile alignment Pile alignment in LPILE L 1 H 1 Soil Layer 1 L 1 = H 1 / cos(β) L 2 β H 2 Soil Layer 1 L 2 = H 2 / cos(β) (a) Figure 5: (a) Actual soil stratigraphy, (b) Soil stratigraphy modified for pile batter angle (b) 9. Determine the factored unit weight, γ z, for each soil layer considered in LPILE according to γ z = γ cosβ, where γ is the total unit weight of soils above the water table and γ is the buoyant unit weight of soils below the water table. 7 F-7
8 10. Determine the LPILE spring stiffness parameters using default values for strain at 50% of the maximum stress, ε 50, (initiated by leaving the field blank when entering soil properties in LPILE) for clay layers and the guidance provided in the LPILE User s Manual for the stiffness modulus, k, for sand layers. 11. Perform an LPILE analysis to determine the maximum moment, M max, using a pinned restraint (zero moment and zero displacement) at the top of the pile, the spring support displacements from Steps 5 and 6, and the spring stiffness parameters from Step 10. The number of pile increments can be specified using the standard guidance in the LPILE User's Manual. 8 F-8
9 Attachment A: Notation Notation used in May 2010 draft report Description L c length of pile in compressible clay layer L e length of pile within embankment z distance along the pile starting from an origin at the bottom of the T-Wall β pile batter angle P y vertical soil movement at the pile top, z=0 d V,0 P x horizontal soil movement at the pile top, z=0 d H,0 Δ component of soil displacement acting normal to pile axis at location z, this is also the spring support displacement applied in LPILE at position z d N,z Δ o spring support displacement at the top of the pile d N,0 γ β transformed soil unit weight = γ cosβ γ z M max maximum bending moment C hand-calculated vertical compression w/o the presence of piles C FLAC vertical compression calculated in FLAC with piles present according to Geometry (b) P y, FLAC the magnitude of vertical soil compression whose normal component when applied as Δ o in LPILE d V,0 produces the same maximum moment as FLAC X C FS C PS C FS, FLAC the horizontal distance from where the pile intersects the T-Wall base to the point where a vertical profile intersects the pile 25% of the vertical distance from the base of the T-Wall to the top of the bearing layer vertical compression determined by hand along a profile a distance X from where the flood-side pile intersects the T-Wall base vertical compression determined by hand along a profile a distance X from where the protected-side pile intersects the T-Wall base vertical compression determined using FLAC along a profile a distance X from where the flood-side pile intersects the T-Wall base Revised Notation (no change if blank) FLAC d FS x s FS s PS d FLAC FLAC V,0 C gr the greater compression between C FS and C PS s max = max{s FS, s PS } C ls the lesser compression between C FS and C PS Δs = s FS s PS 9 F-9
10 Attachment B: Sample calculation of LPILE soil movement for Case 19 (see 5 May 2010 draft report) Relevant details: L c β = 81 ft/cos(β) = 85.4 ft = 1024 in. = deg. Step 1: Calculate settlements s FS s PS = in. = 8.28 in. s max Δs = max{s FS, s PS } = in. = = in. Step 2: Develop normalized settlement profile 1.0 Normalized Settlement, s/s max Distribution of Compression Simplified Fit Normalized Depth, z/lc Figure 6: Normalized compression profile for Case 19 Step 3: Determine d V,0 d V,0 = (s max ) (s max ) = (28.86) (28.86) = in. Step 4: Determine d H,0 10 F-10
11 d H,0 = 0.295(Δs) = 0.295(20.58) = 6.07 in. Step 5: Determine d N,0 d N,0 d N,0 d N,0 = d V,0 sin(β) + d H,0 cos(β) = sin(18.43) cos(18.43) = 6.42 in in. = in. Step 6: Determine distribution of soil movement For example, the soil movement at z = 341 inches below the top of the pile is determined by entering the normalized compression profile shown in Figure 6 at z/l c equal to 341/1024 = 1/3, reading off the corresponding normalized compression which equals approximately 0.44, and scaling the compression by d N,0 to yield a compression, d N,324 = 5.36 in. This process is repeated at other locations as necessary to develop the total soil movement profile to be applied in LPILE. Figure 7 shows the resulting compression profile, which is similar to Figure 6, but with the vertical axis scaled by d N,0 = in. and the horizontal axis scaled by L c = 1024 in Distribution of Compression Simplified Fit d N,z (in.) z (in.) Figure 7: Compression profile for Case 19 Steps 7 through 11 of the revised procedure in the main body of this memorandum are the same as Steps 6 through 10 of the procedure in the 5 May 2010 draft report. 11 F-11
12 FINAL CONTRACT REPORT Contract No. W912P8 07 D 0062 LPILE METHOD FOR EVALUATING BENDING MOMENTS IN BATTER PILES DUE TO GROUND SETTLEMENT FOR PILE SUPPORTED FLOODWALLS IN NEW ORLEANS AND VICINTY for US Army Corps of Engineers by Michael P. McGuire, Virginia Tech George M. Filz, Virginia Tech Michael P. Navin, US Army Corps of Engineers Kent D. Hokens, US Army Corps of Engineers May 2010 F-12
13 TABLE OF CONTENTS 1.0 INTRODUCTION Objective Scope of Work Organization of Report LITERATURE REVIEW BACKGROUND AND DEVELOPMENT OF METHOD Background Basics of Method Application of Soil Movements in LPILE Soil Response Batter Angle Validation of Basic LPILE Method Refinement of Basic LPILE Method Effect of Piles on Soil Settlements Effect of T Wall Effect of Additional Piles Effect of Fill Asymmetry Effect of an All Clay Profile Comparison of LPILE Method with FLAC Results PROCEDURE Introduction to Procedure Step by Step Procedure EXAMPLE PROBLEM Introduction to Example Problem Step by Step Procedure for Example Problem LIMITATIONS CITED REFERENCES APPENDICES Appendix A: List of References Appendix B: Overview and Impressions of Existing Methods Appendix C: Summaries of Selected References Appendix D: Summary of Experimental Studies and Available Data Appendix E: Evaluation of Method by Shibata et al. (1982) F-13
14 1.0 INTRODUCTION This report describes development, validation, and use of a method to estimate bending moments in batter piles induced by downdrag settlements. This project was performed under US Army Corps of Engineers (USACE) Contract No. W912P8 07 D The method described herein was developed for the design of pile supported T Walls in the New Orleans area and vicinity. The method utilizes the program LPILE, developed by Ensoft, Inc., combined with conventional geotechnical procedures to calculate consolidation settlements and correlations generated for this project. The approach is intended for practical use by designers, and it was developed to be as straightforward as possible while retaining the capability to address complexities of the soil structure interactions that occur for pile supported T Walls. 1.1 Objective Batter piles used to support T Walls in the New Orleans area and vicinity may be subject to downdrag loads produced by consolidation of soft clay foundation soils under the weight of a levee embankment. When a pile is battered, a component of the total downdrag load on the pile acts normal to the pile axis and produces bending moments. The bending moments due to downdrag can be significant, and they can influence the design of the piling system used to support the T Wall. The objective of this report is to provide guidance for estimating the bending moments produced by downdrag for the relatively complex soil structure interaction characteristics of pile supported T Walls. 1.2 Scope of Work The scope of work, as outlined in the January 20, 2010 Statement of Work included in the project contract, was limited to: 1. Reviewing existing methods used by A/E firms and identified in published sources to estimate downdrag induced bending moments in batter piles. 2. Evaluate the existing methods 3. Recommend minor changes to an existing method for use on projects in the New Orleans area and vicinity. None of the existing methods used by A/E firms or identified during the literature review were sufficiently validated or detailed enough to address the characteristics of typical pile supported T walls used by the USACE in New Orleans and vicinity. Consequently, an extensive effort was undertaken to develop and validate a method that would satisfy USACE requirements. This included comparing LPILE analyses with published data from an instrumented field case history and laboratory experiments. LPILE analyses were also compared with an extensive series of numerical analyses that were performed by Mike Navin as part of this project. These comparisons resulted in two new components for the LPILE Method: (1) a chart that accounts for the stiffening effect of battered piles on ground settlements in the vicinity of the battered piles and (2) a chart that accounts for lateral movement of the soil when asymmetric fill loads 1 F-14
15 are applied around the T wall. The effect of lateral movements depends on whether the T wall is supported by two or three battered piles because the T wall and pile frame is freer to move laterally under asymmetric fill loads when it is supported by two piles than when it is supported by three piles. In addition, some of the numerical analyses addressed effects of lack of a distinct bearing layer and the presence of a sheet pile cutoff wall. 1.3 Organization of the Report Section 2 of the report presents an overview of the literature review, with comprehensive information about the published literature located in appendices. Section 3 presents a detailed discussion of the background and development of the LPILE Method for calculating downdraginduced bending moments in battered piles. Section 4 presents a concise step by step outline of the method. Section 5 presents a detailed example problem showing the complete execution of the method. Section 6 presents limitations of the method. A list of references cited in the main body of the report is in Section 7. Appendix A provides the entire list of references examined for the project, including some items discussed in the other appendices but not cited in the main body of the report. Appendix B provides descriptions and assessments of existing methods for calculating downdrag induced bending moments in battered piles. Appendix C provides summaries of selected references from the published literature. Appendix D provides descriptions and data summaries for an instrumented field case history and for two laboratory experiments. Appendix E provides a detailed evaluation of the method proposed by Shibata et al. (1982). Designers who are primarily interested in applying the LPILE Method can focus their reading on Sections 4, 5, and 6. 2 F-15
16 2.0 Literature Review The literature review for this project consisted of evaluating information from two primary source categories. The first source was unpublished documents, hand calculations, and electronic files pertaining to methods used by A/E firms working on USACE projects to estimate downdrag induced bending moments. In total, three such methods were identified. Two of the methods were used by Eustis Engineering, Inc., while the third was used by Burns Cooley Dennis, Inc. Published journal and conference papers were the other main source of information about downdrag induced bending moments in batter piles. Several databases were used for the literature review including: the ASCE Research Library, Virginia Tech s Newman Library, Compendex, and the Transportation Research Institute Search engine (TRIS). A complete list of references identified during the literature review is provided in Appendix A. The following papers describe specific methods to calculate downdrag induced bending moments in battered piles. Sato et al. (1970) Broms and Fredriksson (1976) Shibata et al. (1982) Takahashi (1985) Sato et al. (1987) Sawaguchi (1989) Rao et al. (1994) Appendix B provides a concise overview and our assessments and impressions of all the existing methods to estimate downdrag induced bending moments in batter piles. This appendix lists the strengths and limitations of each method, the assumptions used, and some additional commentary. Written summaries of selected references describing the existing methods are presented in Appendix C of this report. Of these methods, the procedure proposed by Shibata et al. (1982) and the use of LPILE proposed by Burns, Cooley, Dennis, Inc., both possessed a logical basis and were simple enough for practical use. However, they have not been validated for conditions of USACE pile supported T walls in New Orleans and vicinity. In order to evaluate published methods and to validate the LPILE Method proposed in this report, the results of laboratory and field scale studies found in published sources were compiled and digitized. Descriptions of the experimental studies are in Appendix D. In general, the model piles used in the experiments were installed in pairs and hinged at the top to form an A frame configuration. The method proposed in Shibata et al. (1982) uses a closed form solution that could be made to achieve good agreement with digitized bending moment data from the experimental studies indentified in the literature. However, agreement with the measured bending moments 3 F-16
17 required back calculating values of the input parameter relating the pile diameter and the average undrained shear strength of the foundation soil to the stiffness of the linear pile soil springs. This parameter ranged from a value of 0.7 to 90, making use of this method for forward analysis difficult without prior understanding of the pile soil response for a specific set of conditions. The results of this evaluation are included in Appendix E of this report. The method by Shibata et al. (1982) was eventually abandoned as a recommended procedure for three main reasons: 1) the difficulty of selecting the spring stiffness parameter, 2) the linear springs used in Shibata s method are less sophisticated than the non linear p y curves used in LPILE, 3) a procedure using LPILE requires about the same level of effort on the part of the designer, so there is no ease of use advantage to the closed form solution proposed by Shibata et al. (1982). The LPILE Method described in this report is an extension of the method used by Burns, Cooley, Dennis, Inc., with added procedures to account for the stiffening effect of the piles on soil settlements, asymmetric fill placement, and differences in T Wall support conditions for two or three batter piles. 4 F-17
18 3.0 DEVELOPMENT AND DESCRIPTION OF METHOD 3.1 Background A method utilizing the program LPILE Plus 5.0, produced by Ensoft, Inc., has been developed to estimate the bending moments generated in batter piles subjected to downdrag. The approach uses the soil movement option in LPILE 5.0 Plus to apply the component of downdrag that acts normal to the pile axis when the pile is battered. As shown in Figure 1, the soil movement is treated as displacement of the back side of the nonlinear p y springs that act on the pile. For embankment loading that is symmetrical on the flood side and protected side of the T Wall, the primary direction of soil displacement due to consolidation under the embankment loading is vertical. For embankment loading that is asymmetric, there may be a significant component of lateral soil movement. The most straightforward approach to estimating the component of soil displacement that acts normal to the pile axis,, is to multiply the vertical component of soil displacement by the sine of the batter angle taken from vertical and add the result to the product of the horizontal component of soil displacement and the cosine of the batter angle. Figure 1: Soil movement applied to soil pile Using the concept described above, the main issues to be addressed to apply this approach to T Walls in the New Orleans area are: 1. What p y soil response curves should be used in LPILE to represent the relationship between the soil pressure exerted on the pile and the soil movement due to consolidation? 2. How should pile batter be accounted for in LPILE? 3. What type of boundary conditions for moment and displacement should be applied to the top of the pile in LPILE? 4. What are the influences of the T Wall, a sheet pile cut off, and a second batter pile on the protected side on the downdrag induced bending moments? 5. How can vertical compression calculated using straightforward hand calculations be adjusted to factor in the support provided by the piles and the T Wall? 6. How can the impact of lateral soil displacement due to asymmetric fill be accounted for in the soil movements used as input to LPILE? The following steps and observations led to answers to the above questions: a) LPILE was applied to the experimental field scale study described by Takahashi (1985), Sato et al. (1987), and Sawaguchi (1989). LPILE was also applied to the laboratory studies conducted by Takahashi (1985) and Shibata et al. (1982). 5 F-18
19 b) Successful validation of the LPILE Method against the experimental results was achieved using a simple approach for determining soil movement due to vertical consolidation, the p y relationships built into LPILE to model the soil layers, and an appropriate sign convention for entering the batter angle. c) A parametric study was performed using the finite difference analysis program FLAC (Itasca 2002) for a pile supported T Wall on a simple foundation soil profile that was based on the profile used in the numerical model developed by GeoMatrix Consultants (2007) for analysis of T Walls in the New Orleans area. d) The results of the FLAC study were used as the basis for exploring the influence of the T Wall, the sheet pile cut off, and a second batter pile on the protected side on downdrag induced bending moments. These analyses permitted determining which of these influences are significant for USACE T Wall projects in the New Orleans area. e) Compression of the foundation soil profile determined from the FLAC analyses in Step (c) was compared to the result of hand calculations performed using conventional geotechnical calculations without the stiffening effect of the T Wall and piles. When the T Wall and piles were removed from the FLAC model, the compressions calculated by hand agreed with the values determined using FLAC. When the T Wall and piles were left in place in the FLAC model, the compressions in the vicinity of the piles were considerably smaller than those estimated by hand. The agreement between the experimental studies and the LPILE Method was based on using the reported settlements, which were influenced by the piles. Therefore, an approach had to be developed to adjust the hand calculated soil compressions to account for the settlement reducing influence of the piles and the T Wall. f) The form of the LPILE Method that was validated against the experimental results in Step (b), together with the method for adjusting hand calculated settlements described in Step (e), were successfully used to calculate bending moments in agreement with those from the FLAC analyses in Step (c) for the case where the embankment fill is symmetrical with respect to the T Wall. This result suggested that the LPILE Method was also applicable to pile supported T Walls that have a more complex soil structure interaction than the A frame pile configurations used in the experimental studies. g) The FLAC model was then used to investigate the impact of asymmetric fill on the flood and protected sides of the T Wall. A simple procedure was developed to relate soil compression determined by hand on the flood and protected sides of the T Wall to the magnitude of horizontal soil movement which, when applied normal to the pile in LPILE, yielded bending moments that agreed with those determined by FLAC analyses. 6 F-19
20 3.2 Basics of the Method Application of Soil Movements in LPILE As described previously, the most straightforward way to determine the magnitude of soil movement normal to the pile axis at a position along the pile is to multiply the vertical component of soil displacement by the sine of the batter angle from vertical and add the result to the product of the horizontal component of soil displacement and the cosine of the batter angle. Rigorous application of this approach would require determining the soil movements at many locations along the length of the pile. Because the pile is battered, such an operation would require calculating movements along many different vertical profiles and using the soil compression magnitude where the vertical profile intersects the pile. In the methods developed by Shibata et al. (1982) and Sawaguchi (1989) to estimate downdrag induced bending moments, soil movements due to vertical compression are determined based on settlement evaluated at a single location. These methods make the simplifying assumption that soil movements are distributed linearly along the length of the pile from the value at the top of the pile to a value of zero where the pile intersects the bearing layer. For piles that penetrate the embankment inducing the consolidation settlement, Takahashi (1985) assumed that the soil movements are constant over the length of the pile within the embankment. These simplifying assumptions are incorporated in the LPILE Method described in this report. Figures 2 and 3 show the relevant components and dimensions of the T Wall and embankment configurations considered in this project. In these figures, L c = the length of pile in the compressible clay layer, and L e = the length of pile within the embankment. For a T wall with its base below the embankment, as shown in Figure 2, L c = the length of the pile from the bottom of the T wall to the top of the bearing layer, and L e = 0. For a T wall with its base in the embankment, as shown in Figure 3, L c = the length of the pile from the top of the clay layer to the top of the bearing layer, and L e = the length of pile within the embankment. For both cases, z = the distance along the pile starting from an origin at the bottom of the T wall. The spring support displacements,, in LPILE are applied as shown in Equations (1) and (2), where o is the spring support displacement at the top of the pile and P y and P x are, respectively, the vertical and lateral soil movements at z = 0 o P y *sin+ P x *cos (1) = o for z < L e (2a) = o *[1 (z L e )/ L c ] for z L e (2b) 7 F-20
21 Flood-side embankment Protected-side embankment T-Wall footing and stem El. G.S. El. T-Wall Base L c z Clay batter angle Sand El. Sand El. Pile tip Figure 2: Layout of T Wall with base below embankment L e El. T-Wall Base L c Clay Sand El. Sand El. Pile tip Figure 3: Layout of T Wall with base in embankment 8 F-21
22 3.2.2 Soil Response The soil response for the soft clay is applied in LPILE using the built in p y relationships developed by Matlock (1970). Even though downdrag is a long term consolidation phenomenon, the standard p y curves for clays that are incorporated in LPILE provided a good fit to the results of the experimental studies, as shown in Section 3.3 of this report. The undrained strengths used in LPILE should be based on experience or available laboratory and field data. A sand bearing layer located beneath the clay can be applied in LPILE using the p y relationship proposed by Reese et al. (1974). The yield strength and stiffness parameters for the p y response curves are assigned using guidance in the LPILE 5.0 Plus User s Manual (Ensoft, 2008). In the absence of specific information regarding selection of the values of strain at 50% of maximum stress, ε 50, for the soft clay and the soil modulus parameter, k, for sand, the guidance provided in Tables 3.2 and 3.4 of the LPILE User s Manual are recommended for selecting input parameters for LPILE. As an example, the input values used for the soil profile in the LPILE analyses described in Section 3.5 are shown below in Table 1. Layer Table 1: Input parameters used in LPILE to determine p y relationships for the analyses in Section 3.5 Depth along pile (in.) Unit weight, (pci) Undrained strength, s u (psi) Strain at 50% maximum stress, ε 50 Effective stress friction angle, φ Soil modulus parameter, k (lb/in 3 ) Soft Clay 0 to Soft Clay 190 to to to Sand 1024 to Batter Angle The following three steps are taken to account for pile batter in the LPILE Method described here: The pile length is measured along the pile, and the soil layer thicknesses are transformed to match, as shown in Figure 4. The unit weights of the soils are adjusted to produce the same vertical effective stress in the transformed soil profile as in the real soil profile at corresponding positions along the pile length. This is done by multiplying the soil unit weight,, by the cosine of the pile batter angle to produce an adjusted unit weight, = * cos( ). Total unit weights should be multiplied by the cosine of the pile batter angle for soils above the water table, and buoyant unit weights should be multiplied by the cosine of the pile batter angle for soils below the water table. 9 F-22
23 LPILE provides for the possibility of a wedge type of failure mode near the ground surface for laterally loaded piles, and this failure mode depends on the batter angle of the pile. The sign convention for a pile that is subject to an applied load at the top and whose lateral movement is resisted by the soil is shown in Figure 3.9 in the LPILE User's Manual. When the soil is moving against a pile that is restrained at the top, the sign convention in Figure 3.9 of the LPILE User's Manual should be reversed, and the sign convention shown in Figure 5 should be applied. This means that a positive batter angle should be input to LPILE for calculating bending moments due to downdrag. Figure 4: (a) Actual soil stratigraphy, (b) Soil stratigraphy modified for pile batter angle 10 F-23
24 Figure 5: Sign convention in LPILE for soil movement and pile batter 3.3 Validation of Basic LPILE Method The LPILE Method described in the preceding sections was applied to the experimental results from the field tests reported by Takahashi (1985), Sato et al. (1987), and Sawaguchi (1989), as well as laboratory studies by Takahashi (1985) and Shibata et al. (1982). The details of these studies can be found in Appendices C and D of this report. For the field test, an embankment of unspecified material was constructed over a soft clay stratum to induce consolidation. A pair of hinged piles was then installed through the embankment and soft clay stratum to a bearing layer of stiff clay and sand. A portion of the hinged pair of piles extended above the ground surface. Bending moments were measured in the piles over the year long duration of the experiment. The input used in LPILE for the field experiment is shown below in Tables 2, 3, and 4. The value for the moment of inertia shown in Table 2 was determined according to π/4*(r o 4 r i 4 ), where r o and r i are the inner and outer radii of the pipe pile section determined from information given in the referenced papers. This value of moment of inertia is different from the value reported in Sato et al. (1987). Pile Length (m) Dist above ground (m) Table 2: Pile Properties for field experiment Batter angle (deg) Diameter (m) Moment of Inertia (m 4 ) Area (m) Youngs Modulus (kn/m 2 ) e8 11 F-24
25 Layer Elevation (m) Table 3: Soil layer input in LPILE for field experiment Distance along pile (m) Unit weight, (kn/m 3 ) Unit weight, (kn/m 3 ) Undrained strength, s u (kn/m 2 ) Strain at 50% maximum stress, ε 50 Stiff Clay 2.5 to to (assumed) Soft Clay 0 to to to to 0.01 Soft Clay 2.5 to to to to Stiff Clay 26 to to Depth along pile (m) Table 4: Soil movements in LPILE 364 day Soil Movement (m) 243 day Soil Movement (m) 119 day Soil Movement (m) day Soil Movement (m) The results of the LPILE analyses are shown in Figure 6, where it can be seen that the LPILE results are in good agreement with the field data. 12 F-25
26 Axial pile length (m) Axial pile length (m) Bending moment (kn-m) (364 days) Bending moment (kn-m) (119 days) Axial pile length (m) Axial pile length (m) Bending moment (kn-m) (243 days) Bending moment (kn-m) Predicted Measured (55 days) Figure 6: Comparison of LPILE predicted moments versus moments measured during field experiment In addition to the field study, the basic LPILE Method was compared to laboratory scale experiments performed by Takahashi (1985) and Shibata et al. (1982). The laboratory study performed by Takahashi (1985) included four pairs of hinged piles at different batter angles. A layer of sand and steel shot was used to load the clay around the piles. A portion of the piles extended above the surface of the sand and shot. Bending moments measured at various times during the year long experiment were reported in the paper for piles with two different batter angles. The input used in the LPILE analysis of the laboratory experiments conducted by Takahashi (1985) are shown in Tables 5, 6, and 7. Due to the very low effective stresses present at the model scale, it is unclear whether the guidance for k given in the LPILE User s Manual is directly applicable. Accordingly, a range of soil modulus values, k, was used to represent the sand and steel shot layer used in the experiment to apply the surcharge pressure. In this 13 F-26
27 instance, the LPILE analysis was not sensitive to values of k above 10,000 kn/m 3. The results of the LPILE analysis for k equal to 1,000 and 10,000 kn/m 3 are shown in Figure 7, where it can be seen that a k value of 1,000 kn/m 3 produced reasonably good agreement between the calculated and measured values of maximum bending moment. Pile Length (m) Batter angles (deg) Table 5: Pile Properties for lab experiment by Takahashi (1985) Dist. above ground 20 o (m) Dist. above ground 10 o (m) Diameter (m) Moment of Inertia (m 4 ) Area (m) Youngs Modulus (kn/m 2 ) , e e8 Table 6: Soil layer input in LPILE for lab experiment by Takahashi (1985) Layer Sand Soft Clay Soft Clay Depth along pile 20 o batter (m) to to to Depth along pile 10 0 batter (m) to to to Unit weight, (kn/m 3 ) to 5 5 to 5.4 Unit weight,, 20 o batter (kn/m 3 ) to to 5.1 Unit weight,, 10 o batter to to 5.3 (kn/m 3 ) Undrained strength, s u (kn/m 2 ) 5 5 to 10 Strain at 50% maximum stress, ε to Effective friction angle, φ 35 Soil modulus parameter, k (kn/m 3 ) 1,000 or 10,000 Depth along pile (m) Table 7: Soil movements in LPILE for lab experiment by Takahashi (1985) 14 week Soil Movement (m) 20 o batter angle 4 week Soil Movement (m) 20 o batter angle 1 week Soil Movement (m) 20 o batter angle 14 week Soil Movement (m) 10 o batter angle F-27
28 Axial pile length (m) Bending moment (N-m) (14 weeks, 20 0 batter) Axial pile length (m) Bending moment (N-m) (4 weeks, 20 0 batter) Axial pile length (m) Bending moment (N-m) (1 week, 20 0 batter) Axial pile length (m) Bending moment (N-m) (14 weeks, 10 0 batter) Predicted (k = 1,000) Predicted (k = 10,000) Measured Figure 7: Moments predicted in LPILE analysis of laboratory study by Takahashi (1985) The inputs used in the LPILE analysis of the laboratory study performed by Shibata et al. (1982) are shown in Tables 8, 9, and 10. Shibata s study involved measuring bending moments in model piles subjected to downdrag produced by applying three magnitudes of surcharge pressure: 20kPa, 40kPa, and 60kPa. Since the piles in this model were pinned at both the top and bottom, a pinned boundary connection was needed at the bottom of the pile in LPILE. This was accomplished by adding a length of pile with a very low flexural rigidity. The flexible portion of the pile was then anchored in a very strong rock layer. These modifications resulted in a pinned condition of essentially no moment or displacement at the tip of the pile. Figure 8 15 F-28
29 shows the results of the LPILE analysis performed for the laboratory study by Shibata et al. (1982), and it can be seen that the agreement is reasonably good. Pile Length (m) Table 8: Pile Properties for laboratory study by Shibata et al. (1982) Batter angles (deg) Diameter (m) Moment of Inertia (m 4 ) Area (m) Youngs Modulus (kn/m 2 ) 0 to e e8 0.6 to e Layer Table 9: Soil layer input in LPILE for laboratory study by Shibata et al. (1982) Depth along pile (m) Unit weight, (kn/m 3 ) Unit weight, (kn/m 3 ) Undrained strength, s u (kn/m 2 ) Strain at 50% maximum stress, ε 50 Unconfined compressive strength (kn/m 2 ) Soft Clay 0 to (6), 6 (12), 9 (18) 0.02 Rock 0.6 to ,000 The values of s u in parentheses are those provided in the paper by Shibata et al. (1982) for surcharge pressures of 20, 40, and 60 kpa. However, there is reason to believe that these values of su are too high, as discussed in the text below. The LPILE analysis results shown in Figure 8 are based on the values of s u equal to 3, 6, and 9 kpa for surcharge pressures of 20, 40, and 60 kpa. Table 10: Soil movements in LPILE for laboratory study by Shibata et al. (1982) Depth along pile (m) 20 kpa Soil Movement (m) 40 kpa Soil Movement (m) 60 kpa Soil Movement (m) F-29
30 Axial pile length (cm) Axial pile length (cm) Bending moment (N-m) Bending moment (N-m) Axial pile length (cm) (20 kpa) (40 kpa) 60 Bending moment (N-m) Predicted Measured (Pile 1) Measured (Pile 2) (60 kpa) Figure 8: LPILE analysis of laboratory study by Shibata et al. (1982) The soil movements used in LPILE for the laboratory studies by Takahashi (1985) and Shibata et al. (1982) are based on reported values of surface settlement of the samples. Since the apparatuses used in both laboratory studies were too small for the measured settlements to reflect a free field condition, it can be reasonably assumed that the reported settlements are influenced by the presence of the piles. The results of the field scale study include a vertical settlement profile obtained from six reference points embedded in the ground. None of the papers describing the field study explicitly indicate the location of the settlement profile relative to the piles; however, based on the width of the surcharge embankment provided by Sawaguchi (1989) and the horizontal projection of the piles from the center of the 17 F-30
31 embankment, it can again be assumed that the measured settlements must have been influenced by the presence of the piles. Reported values of undrained shear strength were used in LPILE for the field study and laboratory study by Takahashi (1985). For the laboratory study performed by Shibata et al. (1982) the clay was placed around the piles as a slurry and allowed to consolidate under self weight, therefore the undrained strength of the clay at the start of the test when the surcharge pressure was applied was likely very low, with an average value of about 0.5 kpa. The undrained strengths used in the paper are based on an assumed undrained strength ratio of 0.3 multiplied by the value of the surcharge pressure. It is likely that this approach significantly overpredicts the undrained strength of the clay for the majority of the consolidation induced soil movement. This is supported by the fact that LPILE significantly overpredicts bending moments when the assumed strength values listed in the paper are used. If strengths equal to half the reported values are used, to approximately represent the average strength during the consolidation process, the agreement with LPILE for the three surcharge pressures used is quite good, as shown in Figure Refinement of the Basic LPILE Method The validation of the LPILE Method described in Section 3.3 of this report left the following issues still to be addressed to develop a practical method that can be applied to the T walls typically used by the USACE in New Orleans and vicinity: A. The stiffening effect of the piles on soil settlements, as compared to conventional settlement calculations without piles. B. The shielding effect of the T wall, which may reduces stress changes in the compressible soil from the fill load. C. The effects of multiple batter piles on the protected side. D. The effects of asymmetry of embankment fill, which could cause an additional bending moment on the pile closest to the greater fill load. E. The effects of a sheet pile cutoff wall. F. the effects of an all clay profile without a sand bearing layer. These factors were investigated for the geometries shown in Figure 9 and the cases listed in Table 11 using an adaptation of the FLAC model developed by Geomatrix Consultants, Inc. Table 11 also includes the maximum bending moment values, M max, from the FLAC analyses. The clay used in the FLAC model was assigned the undrained shear strength profile shown in Figure 10. Other property values for the clay are listed in Table 12. The ground water level is assumed to be at the ground surface. The bottom of the model is at EL 140 ft, and no displacements are allowed below this level. For the purpose of settlement calculations, the preconsolidation pressure is assumed to be equal to the initial effective vertical stress below EL 20 ft and to be equal to the initial effective vertical stress at EL 20 ft for elevations above 20 ft. The sand was assigned an effective friction angle of 30 degrees and a buoyant unit weight of 60.5 pcf. 18 F-31
32 The embankment geometry for the surcharge pressure extended laterally such that the midpoint of the side slopes is 75 ft from the T Wall stem in either direction for cases where the fill is symmetric and only on the flood side for cases with asymmetric fill. Items (A) through (F) are addressed in the sections that follow. Section addresses Item (A), Section addresses Item (B), Item (C) is discussed in Section for symmetric fill and in Section for asymmetric fill, Item (D) is addressed in Section 3.4.4, Item (E) is discussed in Sections and 3.4.4, and Item (F) is addressed in Section Figure 9: (a) Pair of batter piles with roller supports, (b) Pair of batter piles pinned at base of T Wall footing, (c) Three batter piles pinned at base of T Wall footing, (d) Three batter piles plus sheet pile pinned at base of T Wall footing 19 F-32
33 Table 11: FLAC Runs in Parametric Study CASE Geometry Flood side, FS, Fill (psf) Protected side, PS, Fill (psf) FS pile M max (k ft) Middle pile M max (k ft) FS pile M max (k ft) 1 a a a b b b b b b c c d d a (all clay) d (all clay) c c b c b c b c b c b c b c c c b c b c b c b c F-33
34 Elevation (ft) Undrained shear strength (psf) Figure 10. Undrained shear strength of clay layer in the FLAC model Table 12. Property values for the clay used in the FLAC model Effect of Piles on Soil Settlements Property Value Total Unit Weight pcf Effective Cohesion 0 psf Effective Friction Angle 23 degrees Compression Ratio 0.20 Recompression Ratio 0.02 Poisson s Ratio 0.38 The stiffening effect of the piles was investigated in two ways: 1) by comparing hand calculations of soil compression, C, without piles present to FLAC calculations of soil compression, C FLAC, with piles present using geometry (b) in Figure 9 and 2) by comparing the value of C to the magnitude of vertical soil compression, P y,flac, whose normal component, when applied to the p y spring supports in LPILE, produces the same value of the maximum moment as predicted in FLAC. 21 F-34
35 Using the first approach, it is necessary to select a consistent location to compare the handcalculated compression to the FLAC compression for the comparison to be valid. A vertical profile that intersects the pile at 25 percent of the vertical distance from the base of the T Wall footing to the top of the bearing layer was selected because it is near the point along the pile that experiences the maximum bending moment. This location is a horizontal distance X measured from the location where the pile intersects the T Wall base. For the conditions shown in Figure 2, X = 0.25L c sin(), and for the conditions shown in Figure 3, X = 0.25(L e + L c )sin(). Soil compression along this profile can be computed using ordinary geotechnical procedures for estimating 1 D consolidation beneath a finite located area. The fill overlying the base of the T Wall is excluded from the soil compression since this material is primarily supported by the T Wall and piles, and it does not impose a significant surcharge to the foundation soil. When the hand calculation is performed for the profile a distance X from the flood side batter pile, the resulting compression is referred herein as C FS. When the corresponding calculation is performed a distance X from the outer protected side batter pile, the resulting compression is referred herein as C PS. For the development of the LPILE Method, the value of C FS was compared to the flood side compression determined using FLAC, C FS,FLAC, for geometry (b) with symmetric fill loading. For symmetric embankment loading, an equivalent comparison using compressions on the protected side would be essentially the same. The comparison of C FS to C FS,FLAC in Figure 11 shows that the stiffening effect of the piles significantly reduces the magnitude of compression relative to the case where no piles are present. This comparison is important because the basic LPILE Method was validated against the experimental results using reported values of settlement that were influenced by the stiffening effect of the piles. If compressions determined by hand were used instead of the reported values of settlement, it is likely that the LPILE Method would have predicted moments that were significantly higher than the measured values. Another way to observe the stiffening effect of the piles on soil compression is to compare the magnitude of vertical soil compression, P y,flac, whose normal component, when applied to the p y spring supports in LPILE, produces the same maximum moment as predicted in FLAC for the flood side batter pile. The moment in the flood side pile is used for this comparison because, as described in Section 3.4.2, it experiences higher bending moments than the protected side pile for symmetric loading. The approach of basing the stiffening effect of the piles on P y,flac is different from the C FS,FLAC approach described above in that P y,flac is a fixed value for a particular set of conditions whereas C and C FS,FLAC depend on the location of the vertical profile over which compression is evaluated. This feature makes P y,flac a benchmark that, unlike C FS,FLAC, is not sensitive to the choice of profile location. The dashed line in Figure 11 shows the relationship between C FS and P y,flac using the results from the FLAC parametric study. From Figure 11, it can be seen that the relationships comparing C FS with C FS,FLAC and P y,flac are quite similar, particularly at lower magnitudes of C FS. This suggests that selection of the location for calculating compressions, i.e., the location at a distance X from where the flood or protected side pile intersects the T Wall base, is fairly representative of the vertical soil movements applied in LPILE to generate moments that are in agreement with the FLAC results (i.e. C FS,FLAC P y,flac ). It would be reasonable to base the stiffening effect of the piles on C FS,FLAC 22 F-35
36 because this would be consistent with the way that the LPILE Method was validated against the field and laboratory data, although the selection of the location for calculating C FS is somewhat arbitrary. It would also be reasonable to base the stiffening effect of the piles on P y,flac because the USACE has developed confidence in using FLAC to calculate soil structure interactions for pile supported T walls. For these reasons, and because the values of C FS,FLAC and P y,flac are similar, a composite relationship, as shown in Figure 12, is used in the complete LPILE Method described in this report. As described in Section 3.4.4, when the embankment fill is asymmetric, the greater of the calculated compressions calculated on the flood and protected sides, C gr, is used in the LPILE analysis. For symmetric embankment loading, C gr = C FS = C PS. 40 C FS,FLAC based on comparing compressions C FS,FLAC and P Y, FLAC (in.) P y,flac based on equating moments C FS (in.) Figure 11: Solid line = relationship between C FS and C FS, FLAC, Dashed line = relationship between C FS and P y,flac 23 F-36
37 40 Based on comparing compressions 30 Based on equating moments Composite P Y (in.) P y = C gr C gr C gr (in.) Figure 12: Relationship between C gr and P y to account for stiffening effect of piles on compression Effect of T Wall The presence of the T Wall can influence downdrag induced bending moments by: 1) shielding foundation soils in the vicinity of the piles from the full surcharge pressure produced by the embankment and 2) moving the tops of the batter piles by the effect of frame action between the piles and the T Wall footing. The shielding effect of the T wall can be evaluated by comparing the results listed in Table 11 for Cases 2, 1, and 3 for fill pressures of 330, 660, and 990 psf, respectively, with the average absolute value of maximum moment for the flood side and protected side piles for Cases 4, 5, and 6. This comparison shows that the shielding effect of the T wall does not produce much change in the maximum bending moments. The lack of a shielding effect may be due, in part, to the fact that the maximum bending moments in the batter piles occur at about Elevation 20 ft, which is beyond the T wall limits for the batter piles. Also, while the addition of the fill load between the piles for Cases 1, 2, and 3 generates additional vertical settlement, which increases bending moments, the lack of shielding for these cases reduces the inward lateral component of soil movement produced by the fill beyond the T Wall, thus reducing bending moments. The LPILE Method for symmetric fill was calibrated using only vertical soil 24 F-37
38 movements, P y, and the fill overlying the T Wall base is not included in the compression calculations. This approach yields good agreement between the FLAC and LPILE moments, and it is conservative because the fill loads in the FLAC analyses were imposed by surcharge pressures instead of fill soil, which tends to reduce the shielding effect. The effect of frame action between the batter piles and the T Wall base can be evaluated by comparing the maximum bending moments in the flood side and protected side batter piles when the embankment fill is symmetrical. The frame action develops due to the effect of the eccentric location of the wall stem. Figure 13 shows the absolute value of the maximum bending moments in the flood side and protected side batter piles determined using FLAC for Geometry (b) versus the applied surcharge pressure. The figure shows that the maximum bending moments are higher, on average by about 15 percent, for the flood side batter pile than for the protected side pile. Therefore, for the conditions evaluated using symmetric loading, the critical pile for down drag induced bending moments is the flood side batter pile. 250 Absolute Value of M max predicted with FLAC (k ft) Flood Side Batter Pile Protected Side Batter Pile Symmetrically Applied Surcharge Pressure(psf) Figure 13: Absolute value of the maximum bending moment in the flood side and protected side batter piles determined using FLAC for Geometry (b) and symmetric fill versus surcharge pressure 25 F-38
39 3.4.3 Effect of Additional Piles The FLAC analyses performed using Geometries (c) and (d) permitted evaluating the effect of a middle batter pile and a sheet pile cut off on downdrag induced bending moments. Figure 14 shows that, for symmetric loading, the presence of the middle batter pile has very little influence on the bending moment in the flood side batter pile. It can be concluded that the middle batter does not need to be considered in the LPILE analysis when the fill is symmetric M max Predicted with FLAC (k ft) Symmetric Fill without Middle Batter Pile Symmetric Fill with Middle Batter Pile ,000 1,500 Symmetrically Applied Surcharge Pressure (psf) Figure 14: Influence of middle batter pile on maximum moment in the flood side batter pile Figure 15 shows the influence of the middle batter pile on moments produced in the protectedside pile when the fill is symmetric. The figure shows that the middle batter pile reduces moments in the protected side pile. Since the flood side pile was determined in Section to be the critical pile in the analysis for symmetric loading, the influence of the middle batter pile does not need to be considered in the LPILE Method. 26 F-39
40 Absolute Value of M max Predicted with FLAC (k ft) Symmetric Fill without Middle Batter Pile Symmetric Fill with Middle Batter Pile Symmetrically Applied Surcharge Pressure(psf) Figure 15: Influence of middle batter pile on maximum moment in the protected side batter pile The influence of the sheet pile cut off for cases with symmetric fill can be evaluated by comparing Case 10 with the results of Case 12. From these cases it is seen that the sheet pile cutoff wall reduces maximum bending moments. The magnitude of this reduction is expected to be sensitive to the depth and the lateral position of the sheet pile with respect to the battered piles, and its influence can be conservatively neglected from the LPILE Method Effect of Fill Asymmetry The FLAC analyses permit consideration of cases where the magnitude and/or lateral extend of the embankment fill on the flood and protected sides of the T Wall is asymmetric and results in C FS C PS. When the embankment loading is asymmetric, there can be horizontal soil displacement that acts on the piles and the T Wall. Figure 16 shows the combinations of symmetric and asymmetric fill for T Walls with and without a middle batter pile extending to the protected side. The FLAC analyses listed in Table 11 directly evaluated Cases (i),(ii), (iii), and (iv). If the influence of the asymmetric T Wall stem on moments in the protected side pile described in Section is conservatively ignored, the FLAC analyses also can be used to evaluate Case (v) by applying the findings from the FLAC runs applicable to Case (iii). Similarly, it is believed that the findings from the FLAC runs applicable to (iv) can be conservatively applied 27 F-40
41 to Case (vi). Table 13 summarizes the embankment loading cases and the applicability of the LPILE Method. Flood-side Fill Protected-side Fill (i) (ii) (iii) (iv) (v) (vi) Figure 16: Various embankment loading cases for T Walls with and without a middle batter pile 28 F-41
42 Table 13: Applicability of LPILE Method to loading cases shown in Figure 13 Case i ii iii iv v vi Loading and Piling Conditions Symmetric, middle batter pile not present Symmetric, middle batter pile present Fill produces more compression on flood side, middle batter pile not present Fill produces more compression on flood side, middle batter pile present Fill produces more compression on protected side, middle batter pile not present Fill produces more compression on protected side, middle batter pile present Greater Compression, C gr Lesser Compression, C ls LPILE Method Directly Applicable? Pile Considered in Analysis C FS = C PS C FS = C PS Yes FS batter pile C FS = C PS C FS = C PS Yes FS batter pile C FS C PS Yes FS batter pile C FS C PS Yes FS batter pile C PS C FS No, but approach for Case (iii) can be applied C PS C FS No, but approach for Case (iv) can be applied PS batter pile Outer PS batter pile The horizontal soil displacements resulting from asymmetric fill loading increase the bending moment in the outside batter pile on the side with the larger fill load. The horizontal soil displacements also push the T Wall away from the side with greater fill load, resulting in lateral displacement of the pile head that tends to unbend the batter pile on the side with more load, thereby reducing the bending moment compared to the bending moment that would occur without displacement of the T Wall away from the load. The net effect of the increased soil movement acting on the pile and translation of the pile head depends on the magnitude of unbalanced embankment load and the amount of resistance provided by the T Wall foundation against lateral movement. As part of the overall parametric study, FLAC analyses were performed to investigate these counter acting influences for cases with and without a middle batter pile across a range of unbalanced loads. Figure 17 shows the FLAC results for bending moment in the flood side batter pile for symmetric and asymmetric fill loading with and without a middle batter pile (Cases (i), (ii), (iii), and (iv)). 29 F-42
43 Symmetric Fill without Batter Pile M max Predicted with FLAC (k ft) ,000 1,500 Surcharge Pressure (psf) Symmetric Fill with Middle Batter Pile Asymmetric Fill without Middle Batter Pile Asymmetric Fill with Middle Batter Pile Figure 17: Maximum moments in flood side batter pile from FLAC analyses versus surcharge pressure applied symmetrically or asymmetrically (only on the flood side) Figure 17 shows that, when the fill is asymmetric, the presence of the middle batter pile can have a profound influence on bending moments. The two batter piles on the protected side create a pile couple which gives the T Wall far greater resistance to rotation and translation than when just one pile is present on the protected side. At low magnitudes of asymmetric loading, the increase in bending moment due to lateral soil movement dominates the moment reduction due to unbending of the flood side pile for cases with and without the middle pile. As the magnitude of the asymmetry increases, the T Wall begins to translate significantly for the case without the middle pile, and the moment reduction due to unbending the flood side pile counteracts the increased bending moment due to increased lateral displacement of the soil. For T Walls with middle piles, the restraint produced by the middle pile reduces the potential for unbending such that lateral soil movement continues to dominate at high asymmetric fill pressures, and the bending moment on the flood side pile continues to increase. The influence of the sheet pile cut off for cases with asymmetric fill can be evaluated by comparing Case 11 with the results of Case 13. From these cases it is seen that the sheet pile cutoff wall reduces maximum bending moments. The magnitude of this reduction is expected 30 F-43
44 to be sensitive to the depth and the lateral position of the sheet pile with respect to the battered piles, and its influence can be conservatively neglected from the LPILE Method. Table 14 summarizes the findings of the parametric study with respect to fill asymmetry and the presence of additional piles. Table 14: Significance of various influences on maximum bending moment in the flood side pile relative to the case with symmetric fill without a middle batter pile Factor Fill condition Influence Significant to LPILE Method analysis Fill asymmetry without middle batter Asymmetric Increase at low surcharge pressures and reduction at Yes pile high surcharge pressures Presence of middle Symmetric Small reduction at high No batter pile Presence of middle batter pile Presence of sheet pile cut off Presence of sheet pile cut off Asymmetric surcharge pressure Significant increase at high surcharge pressure Yes Symmetric Small reduction No Asymmetric Small reduction No To account for fill asymmetry, the magnitude of soil movement applied at the top of the pile, Δ o, was determined so that the maximum moment from the LPILE Method would agree with the maximum moment in the flood side batter pile from the FLAC analyses for cases with asymmetric fill with and without the middle batter pile. The total magnitude of soil movement normal to the pile that is necessary to achieve this agreement was compared to the component of soil movement normal to the pile due to vertical compression, P y (sinβ). The net influence of the fill asymmetry can be incorporated in the LPILE Method by determining the magnitude of lateral soil movement, P x, such that P x = [Δ o P y (sinβ)]/cosβ (3) where Δ o is the total soil movement applied at the top of the pile in LPILE so that M max,lpile = M max,flac The value of P x determined using the approach described above was compared to the difference between C gr and C ls. Figure 18 shows the result of this comparison for cases with and without a middle batter pile. As indicated by Equation 3, the contribution of P x to the normal soil movement used in LPILE is determined by multiplying the value of P x by the cosine of the batter angle. More lateral soil movement is needed in LPILE for T walls supported by three piles than for T walls supported by two piles, reflecting the ability of the pile couple on the protected side to resist T wall rotation, thereby reducing the potential for side sway of the pile and T wall 31 F-44
45 system. When only two piles support the T wall, the increased lateral movement of the T wall reduces the relative lateral movement between the soil and the piles, thereby reducing the effect of asymmetric load on pile bending moments compared to T walls supported by three piles With middle batter pile P x = (C gr C ls ) (C gr C ls ) (C gr C ls ) Horizontal Soil Movement, P x (in.) With middle batter pile Without middle batter pile Without middle batter pile P x = (C gr C ls ) (C gr C ls ) (C gr C ls ) C gr C ls (in.) Figure 18: Horizontal soil movement applied in LPILE analysis due to net effect of asymmetric fill Effect of an All Clay Profile The effect of an all clay profile without a sand bearing layer can be seen by comparing Cases 1 and 14 and by comparing Cases 12 and 15, which both show that the maximum moment is larger for an all clay profile. The average increase in maximum moment for these two comparisons is about 11 percent. 3.5 Comparison of LPILE Method with FLAC Results The complete LPILE Method was compared to the FLAC analyses described in Section 3.4. The cases considered were: Cases 4, 5, 6, (symmetric fill without a middle batter pile), Cases 7, 8, 9 (asymmetric fill without a middle batter pile), and Cases 11, 16, and 17 (asymmetric fill with a middle batter pile). Figure 19 shows the comparison of the moment diagrams using the LPILE Method to the moment diagrams from FLAC for Cases 4, 5, and 6, Figure 20 shows the comparison for Cases 7, 8, and 9, and Figure 21 shows the comparison for Cases 11, 16, and F-45
46 It can be seen that the agreement between the maximum moment values determined from the LPILE Method and FLAC is quite good. Elevation (ft) LPILE Method FLAC Moment (k ft) Elevation (ft) LPILE Method Moment (k ft) Figure 19: (left to right) Bending moment diagrams for Cases 4, 5, and 6 from the LPILE Method and FLAC FLAC Elevation (ft) LPILE Method FLAC Moment (k ft) Elevation (ft) Elevation (ft) LPILE Method 80 LPILE Method 80 LPILE Method 90 FLAC 90 FLAC 90 FLAC Moment (k ft) Moment (k ft) Moment (k ft) Figure 20: (left to right) Bending moment diagrams for Cases 7, 8, and 9 from the LPILE Method and FLAC Elevation (ft) F-46
47 Elevation (ft) Elevation (ft) LPILE Method 80 LPILE Method 80 LPILE Method 90 FLAC 90 FLAC 90 FLAC Moment (k ft) Moment (k ft) Moment (k ft) Elevation (ft) Figure 21: (left to right) Bending moment diagrams for Cases 7, 8, and 9 from the LPILE Method and FLAC 34 F-47
48 4.0 Procedure 4.1 Introduction This section outlines the LPILE Method for calculating bending moments induced in batter piles for T Walls subject to downdrag. The method was developed for practical use by designers of USACE T Walls in the New Orleans area, and it is based on the assumptions listed in Table 15. The bending moments determined using this approach are only the moments due to downdrag. Additional bending moments may be produced by other factors, such as flood loading. This section is arranged for designers familiar with the development and limitations of the LPILE Method to use this section as a standalone document. Accordingly, the some of the figures and tables that appear elsewhere in the report are repeated here. Table 15: Assumptions used to develop a method for calculating downdrag induced bending moments Assumptions 1 The foundation soils consist primarily of compressible clay overlying a sand bearing layer, as shown in Figures 22 and 23. The model was developed considering a clay layer extending 84 ft below the ground surface at El 2, with batter piles extending from the bottom of the T wall, which is at El 5, to El The piles are battered at 3H:1V, corresponding to a batter angle,, of 18.4 o from vertical. 3 For symmetric embankment loading and for asymmetric loading resulting in more soil compression on the flood side of the T Wall, the down drag induced bending moment in the flood side pile is considered to be critical. 4 For asymmetric loading resulting in more soil compression on the protected side, the bending moment in the protected side pile is considered to be critical. Reductions of bending moment in the protected side pile due to asymmetry of the T Wall stem and middle batter pile are ignored. 5 For T Walls located within an embankment, as shown to Figure 23, the compression of the embankment material is considered to be insignificant compared to the compression of the underlying soft clay. 6 The clay is slightly overconsolidated near the ground surface but is otherwise normally consolidated. 7 The connection of the piles to the T Wall has little moment resistance and can be reasonably approximated by a pin support. 8 Axial loading in the pile does not significantly impact the downdrag induced bending moments, i.e., the P effect is not included in this method. 9 Soil movement normal to the pile axis is responsible for the downdrag induced bending moments. 35 F-48
49 The terminology shown in Figures 22 and 23 is used to identify the relevant components and dimensions of the T Wall and embankment system. The LPILE Method can be used for the embankment loading conditions shown in Figure 24 and described in Table 16 for cases when the T Wall base is below the embankment as shown in Figure 22 or within the embankment as shown in Figure 23. Whether the embankment loading is symmetric or asymmetric is determined by comparing the magnitude of hand calculated compressions on the flood and protected sides without considering the fill overlying the T Wall base. The influence of fill asymmetry was evaluated during the development of the LPILE Method by examining the moments in the flood side batter pile resulting from fill applied to the flood side only. For conditions where fill asymmetry results in more compression on the protected side, as in Cases (v) and (vi), the LPILE Method is expected to produce conservative results due to the influences of the asymmetric T Wall stem and the middle batter pile on moments in the outer protectedside pile. Flood-side embankment Protected-side embankment T-Wall footing and stem El. G.S. El. T-Wall Base L c z Clay batter angle Sand El. Sand El. Pile tip Figure 22: Layout of T Wall with base below embankment 36 F-49
50 L e El. T-Wall Base L c Clay Sand El. Sand El. Pile tip Figure 23: Layout of T Wall with base in embankment 37 F-50
51 Flood-side Fill Protected-side Fill (i) (ii) (iii) (iv) (v) (vi) Figure 24: Various embankment loading cases for T Walls with and without a middle batter pile Table 16: Loading cases for LPILE Method shown in Figure 3 Case i ii iii iv v vi Loading and Piling Conditions Symmetric, middle batter pile not present Symmetric, middle batter pile present Fill produces more compression on flood side, middle batter pile not present Fill produces more compression on flood side, middle batter pile present Fill produces more compression on protected side, middle batter pile not present Fill produces more compression on protected side, middle batter pile present 38 F-51
52 4.2 Step by Step Procedure 1. Calculate the compression, C, of the soil from the bottom of the T wall to the top of the bearing layer due to the embankment surcharge using ordinary geotechnical analysis procedures, without considering the stiffening effect of the batter piles. The soil compression calculations should be performed at the plan view locations on the flood side and protected sides where the outer battered piles intersect the elevation corresponding to 25% of the depth from the bottom of the T wall to the top of the bearing layer. The compression calculated on the flood side, C FS, should be compared to the value on the protected side, C PS, according to Table 17 to determine whether the loading is symmetric or asymmetric. The weight of the T wall and the fill directly overlying the T wall base is not included in the settlement calculations. If compacted embankment fill exists underneath the T wall, as shown in Figure 23, the embankment fill can be considered relatively incompressible compared to the underlying soft clay. Table 17: Evaluation of embankment loading case using flood side and protected side compressions Case Greater Compression, C gr Lesser Compression, C ls i C FS = C PS C FS = C PS ii C FS = C PS C FS = C PS iii C FS C PS iv C FS C PS v C PS C FS vi C PS C FS 2. Determine the vertical soil movement, P y, to be applied in the LPILE Method using the greater value of the flood side and protected side compressions, C gr, determined in Step 1 and Figure 25 to account for the stiffening effect of the piles on soil compression. 39 F-52
53 40 30 P Y (in.) P y = C gr C gr C gr (in.) Figure 25: Vertical soil movement considered in LPILE analysis versus the greater calculated soil compression 3. For asymmetric embankment loading, determine the horizontal soil movement, P x, to be considered in the LPILE analysis using the difference between C gr and C ls and Figure F-53
54 With middle batter pile P x = (C gr C ls ) (C gr C ls ) (C gr C ls ) Horizontal Soil Movement, P x (in.) With Middle Batter Pile Without Middle Batter Pile Without middle batter pile P x = (C gr C ls ) (C gr C ls ) (C gr C ls ) C gr C ls (in.) Figure 26: Horizontal soil movement considered in LPILE versus (C gr C ls ) for cases with and without a middle batter pile 4. Determine the soil movement to be used in LPILE as displacement of the spring supports at the top of the pile, o, by summing the components of P y and P x that act normal to the pile. o P y *sin+ P x *cos (4) 5. Determine the distribution of the soil movements applied in LPILE. For a T wall with its base below the embankment, as shown in Figure 22, let L c = the length of the pile from the bottom of the T wall to the top of the bearing layer and let L e = 0. For a T wall with its base in the embankment, as shown in Figure 23, let L e = the length of pile within the embankment, and L c = the length of the pile from the top of the clay layer to the top of the bearing layer. For both cases, let z = the distance along the pile starting from an origin at the bottom of the T wall. The spring support displacements,, in LPILE are applied according to = o for z L e (5a) = o *[1 (z L e )/ L c ] for z > L e (5b) 41 F-54
55 6. Determine the pile batter angle according to the convention shown in Figure 27 for soil moving against the pile, which is opposite of the convention given in the LPILE 5.0 Plus User s Manual for soils resisting lateral movement of the pile. Y+ + Soil movement Figure 27: Sign convention in LPILE for soil movement and pile batter 7. Transform the soil profile according to Figure 28 to match the coordinate system used in LPILE, which is parallel to the pile axis. X+ Figure 28: (a) Actual soil stratigraphy, (b) Soil stratigraphy modified for pile batter angle 8. Determine the factored unit weight,, for each soil layer considered in LPILE according to = coswhere is the total unit weight of soils above the water table and is the buoyant unit weight of soils below the water table 9. Determine the LPILE spring stiffness parameters using the guidance provided in the LPILE User s Manual. 42 F-55
56 10. Perform an LPILE analysis to determine the maximum moment, M max, using a pinned restraint (zero moment and zero displacement) at the top of the pile, the spring support displacements from Steps 4 and 5, and the spring stiffness parameters from Step 9. The number of pile increments can be specified using the standard guidance in the LPILE User's Manual. 43 F-56
57 5.0 Example problem 5.1 Introduction to Example Problem This example problem illustrates the LPILE Method for calculating downdrag induced bending moments. The example problem is similar to the embankment and T Wall geometry described in the report Overview of FLAC Analysis for St. Bernard Parish (Navin, 2009) and the foundation soil profile considered in the numerical model developed by Geomatrix Consultants, Inc. (2007) for T Walls in the New Orleans area. Figure 29 shows the embankment, T Wall, piling, and foundation soil profile for the example. The embankment includes a wave run up berm on the flood side, which is not symmetric with the embankment fill of the protected side. Two batter piles are used on the protected side and a sheet pile cut off is also included. The tables included in Figure 29 provide the relevant information for the batter piles, as well as information about the soil properties. The goal of this analysis is to estimate the maximum bending moment in the critical flood side batter pile due to downdrag. Other influences such as flood loading and axial load in the piles may also contribute to the total bending moment experienced by the pile. 5.2 Step by Step Procedure for Example Problem 1. Calculate the compression, C, of the soil from the bottom of the T wall to the top of the bearing layer at the plan view locations where the outer flood side and protected side battered piles intersect the elevation corresponding to 25% of the depth from the bottom of the T wall to the top of the bearing layer. Figure 30 shows subdivision of the embankment load into uniform area loads. Alternatively, solutions for linear varying surcharge pressure could be applied. The fill overlying the base of the T Wall is not included in calculations of stress change in the clay. Two dimensional conditions are assumed for calculating stress change, and this can be approximated by assuming that the loaded areas extend a great length in the direction of the T Wall alignment. Based on the area loads shown in Figure 30, the change in vertical stress with depth is determined using Boussinesq elastic theory for the two locations where compression is to be determined. Using the results of the stress analysis, and the soil properties provided in Figure 29, the compressions on the flood side at the location of the left cross hair, C FS, and on the protected side at the location of the right cross hair, C PS, were calculated to be and 8.34 inches, respectively. Accordingly, the greater compression, C gr, is equal to inches and the lesser compression, C ls, is equal to 8.34 inches. 44 F-57
58 Relevant H Pile (HP 14x73) Details for LPILE Analysis Moment of Inertia (in. 4 ) Depth and Width of Section (in.) 13.6 x 14.6 X Sectional Area (in. 2 ) 21.4 Young s Modulus (psi) 29 x 10 6 Soil Properties for Analysis Soft Clay Sand Buoyant unit weight, (pci) Compression ratio, C εc Recompression ratio, C εr Preconsolidation pressure, P p (psi) 6.25 Max ' v Undrained strength, S u (psi) 1.4 Max ' 0.25( v ) Strain at 50% maximum stress, ε Effective friction angle, φ 30 Soil modulus parameter, k (pci) 60 Unit weight of embankment fill (pcf) 110 Figure 29: T Wall, piling, embankment geometry, and relevant information for example problem 6.75 ft 6.75 ft 30ft 10ft 10ft Figure 30: Plan view showing subdivision of fill into uniform area loads, excluding the fill overlying the T Wall base. The locations where compression will be determined on the flood side and protected side are indicated with cross hairs 6.5ft 2.5ft 3ft 6ft 45 F-58
59 2. Determine the vertical soil movement, P y, to be applied in the LPILE Method using the value of C gr determined in Step 1 and Figure 25 to account for the stiffening effect of the piles on soil compression. Using the equation for the best fit line, P y can be determined as: P y = (10.66) (10.66) P y = 5.02 inches 3. Determine the horizontal soil movement, P x, to be considered in the LPILE analysis using the difference between C gr and C ls and Figure 26. Since a middle batter pile is present in this problem, the upper curve should be used. Using the polynomial for the upper curve and the difference in the calculated compressions, which is equal to 2.32 inches, P x can be determined as: P x = (2.32) (2.32) (2.32) P x = 0.28 inches 4. The soil movement used in LPILE as displacement of the spring supports at the top of the pile, o, is equal to the components of P y and P x that act normal to the pile. In this case, the batter angle,, is equal degrees, which is obtained from the arctan of the slope of the pile given as 1H:3V. The value of o is calculated using Equation (4), as follows: o P y *sin+ P x *cos o 5.02)sin (0.28)cos18.43 o 1.85 inches 5. Determine the distribution of the soil movements applied in LPILE. In the current problem, the T wall has its base below the embankment and therefore L c = the length of the pile from the bottom of the T wall to the top of the bearing layer and L e = 0. Let z = the distance along the pile starting from an origin at the bottom of the T wall. The spring support displacements,, in LPILE are applied according to Equation (5b) with L e = 0, as follows: = o *[1 z/ L c ] = (1.85 inches)[1 z/1024 inches] In this problem, L c is the length of the pile from Elevation 5 to 86, which is a vertical distance of 81 ft. The length of the pile over this interval is 81 ft divided by the cosine of the batter angle, which is 85.4 ft or 1024 inches. If the magnitude of soil movement, o, is applied to the top of the pile in LPILE and a magnitude of zero is applied at L c, LPILE automatically applies soil movements to the pile over the interval 0 z L c according to 46 F-59
/cos(18.43)] = 1088 inches.")
60 the linear variation in the expression above. A screen shot of the detail for this aspect of LPILE input for the example problem in shown in Figure 31. Figure 31: Input of soil movement in LPILE 6. Enter the pile properties into LPILE. The length of the pile is the total pile length from Elevation 5 to 91 and is therefore equal to 12[(91 5)/cos(18.43)] = 1088 inches. Using guidance given in the LPILE 5.0 Plus User s Manual, the pile was divided into 180 increments, and the pile was assigned a batter angle of degrees based on the sign convention defined in this report. Next, the properties of the pile section are entered into LPILE. The cross sectional area, moment of inertia, and Young s modulus are provided in the problem statement. An equivalent pile diameter is input for the HP 14 x 73 piles using an equal area approach based on the section depth and width provided in the problem statement, such that the equivalent diameter equals the square root of 4*13.6*14.6/ = 15.9 inches. Screen shots of the LPILE input are provided in Figure F-60


61 Figure 32: Pile properties used in LPILE Use the static loading type under the Loading Type drop down menu and a zero displacement, zero moment boundary condition at the top of the pile. No axial load should be specified since the LPILE Method does not include an axial load contribution to downdrag induced bending moment. A screen shot of the boundary condition specified for this problem is shown in Figure F-61

62 Figure 33: Boundary condition at the top of the pile used in LPILE 7. Since the coordinate axes in LPILE are axial to the pile, a transformed soil profile needs to be developed from the information given in the example problem statement. The first step is to determine the transformed soil layer thicknesses according to Figure 28. For the example problem, the transformed thickness of the clay from Elevation 5 to 86 is 12[(86 5)/cos(18.43)] = 1024 inches, while the sand from Elevation 86 to the bottom of the pile has a thickness of 12[(91 86)/cos(18.43)] = 64 inches. 8. The transformed unit weight,, needs to be determined for each soil according to = coswhere is the total unit weight of soils above the water table and is the buoyant unit weight of soils below the water table This step is needed for LPILE to determine the correct overburden pressure for the transformed soil stratigraphy. For this problem, the transformed buoyant unit weight for the soft clay is equal to (0.029 pci)cos(18.43) = pci. For the sand, the transformed buoyant unit weight is equal to (0.035 pci)cos(18.43) = pci. 9. Enter the remaining soil properties, including the spring stiffness parameters, into LPILE. Due to overconolidation of the upper soft clay, a minimum undrained shear strength of 1.4 psi was given in the problem statement. For LPILE to properly assign undrained strengths to each pile soil increment, the clay layer will be divided into two sublayers. The upper layer will be assigned an undrained strength of 1.4 psi, while the lower layer will increase linearly with effective overburden pressure. The boundary between these two layers in the transformed profile can be determined according to z = 1.4/(0.25*0.028) (7a) z = 200 inches (7b) The undrained strength of the clay at the top of the sand bearing layer is equal to S u = 0.25(0.028 * 1024) S u = 7.2 psi (8a) (8b) 49 F-62

63 The last steps in defining the soil profile in LPILE are to determine the LPILE spring stiffness parameters ε 50 for the clay as well as φ and k for the sand using the guidance provided in the LPILE User s Manual. For the example problem, values for these parameters are given in Figure 29. Screen shots of the soil profile used in LPILE for the example problem are shown below in Figures 34 and 35. Figure 34: Soil profile used in LPILE for example problem 50 F-63

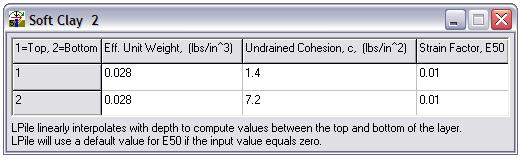
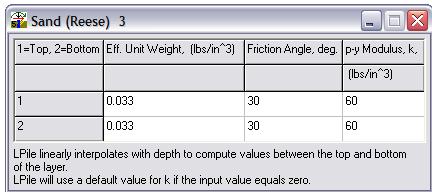
64 Figure 35: Soil properties assigned in LPILE 51 F-64
65 10. Perform an LPILE analysis to determine the maximum moment, M max, due to downdrag. For the example problem, the maximum moment was determined to be 90 k ft. Figure 36 shows the bending moment distribution predicted by the LPILE analysis. Bending Moment vs. Depth Bending Moment, kips-in. -1,200-1, Depth, feet LPILE Plus 5.0, (c) 2008 by Ensoft, Inc. Figure 36: Moment distribution estimated by LPILE analysis 52 F-65
66 6.0 Limitations The LPILE Method presented in this report was developed using the specific T Wall geometry, pile properties, and soil conditions shown in Figures 9 and 10 and Table 12. The assumptions listed in Table 15 were also made. The LPILE Method may not be accurate for conditions that are substantially different from those used to develop the method. The bending moment estimated using the LPILE Method is the component of the total bending moment in the batter pile due to downdrag. Other sources of bending moment, such as flood loading, can contribute to the total bending moment in the pile. 53 F-66
67 7.0 Cited References Broms, B., and Fredericksson, A. (1976). "Failure of pile supported structures caused by settlements." Proceedings of the 6th European Conference on Soil Mechanics and Foundation Engineering, Ensoft. (2008). LPILE 5.0 Plus User's Manual, Ensoft, Inc., Austin, TX. Geomatrix Consultants, I. (2007). "Soil structure interaction and load transfer mechanism of pile supported T Wall for New Orleans levees, Project " Prepared for U.S. Army Engineer Research & Development Center, Waterways Experiment Station, Vicksburg, Mississippi, Okland, California. ITASCA. (2002). "FLAC Fast Lagrangian Analysis of Continua." ITASCA Consulting Group, Minneapolis, Minnesota. Matlock, H. (1970). "Correlations for design of laterally loaded piles in sift clay." 2nd Annual Offshore Technology Conference, OTC1204 Vol 1, Houston, Texas, pp Rao, S. N., Murthy, T. V. B. S. S., and Veeresh, C. (1994). "Induced bending moments in batter piles in settling soils." Soils and Foundations, 34(1), Reese, L. C., Cox, W. R., and Koop, F. D. (1974). "Analysis of laterally loaded piles in sand." 5th Annual Offshore Technology Conference, OTC 2080, Houston, Texas. Sato, S., Akai, K., Funahashi, T. (1970). "Study on methods to calculate negative skin friction and bending in a batter pile." Laboratory Report of Japan Road Corporation, pp (in Japanese). Sato, S., Iwashita, F., and Ohmori, H. (1987). "The calculation method on the bending moment of a batter pile induced by ground settlement." Soils and Foundations, 27(2), (in Japanese). Sawaguchi, M. (1989). "Prediction of bending moment of a batter pile in subsiding ground." Soils and Foundations, 29(4), Shibata, T., Sekiguchi, H., and Yukitomo, H. (1982). "Model test and analysis of negative friction acting on piles." Soils and Foundations, 22(2), Takahashi, K. (1985). "Bending of a batter pile due to ground settlement." Soils and Foundations, 25(4), F-67
68 List of Appendices A. Compiled References identified during the literature review B. Overview and impressions of existing methods to estimate downdrag induced bending moments C. Summaries of selected sources evaluated during the literature review i. Broms and Fredericksson (1976) ii. Shibata et al. (1982) iii. Takahashi (1985) iv. Sawaguchi (1989) v. Rao et al. (1994) vi. Hance and Stremlau (2009) vii. Stremlau and Hance (2009) D. Summary of experimental studies and available data on downdrag induced bending moments E. Comparison of the method by Shibata et al. (1982) to the experimental studies. 55 F-68
69 Appendix A Compiled references identified during the literature review 56 F-69
70 Appendix A UPDATED 04 JUN 12 List of references Broms, B., and Fredericksson, A. (1976). "Failure of pile-supported structures caused by settlements." Proceedings of the 6th European Conference on Soil Mechanics and Foundation Engineering, Ensoft. (2008). LPILE 5.0 Plus User's Manual, Ensoft, Inc., Austin, TX. Geomatrix Consultants, I. (2007). "Soil-structure interaction and load transfer mechanism of pile-supported T-Wall for New Orleans levees, Project " Prepared for U.S. Army Engineer Research & Development Center, Waterways Experiment Station, Vicksburg, Mississippi, Okland, California. Ghaly, A. M. (1995). "Discussion of "Induced bending moments in batter piles in settling soils" by S. Narasimha Rao et al." Soils and Foundations, 35(1), Hance, J., and Stremlau, T. (2009). "Lateral load on piles subjected to downdrag." Internal document, Eustis Engineering, Metairie, Louisiana. ITASCA. (2002). "FLAC Fast Lagrangian Analysis of Continua." ITASCA Consulting Group, Minneapolis, Minnesota. Kelesoglu, M. K., and Cinicioglu, S. F. (2010). "Free-field measurements to disclose lateral reaction mechanism of piles subjected to soil movements." Journal of Geotechnical and Geoenvironmental Engineering, 136(2), Matlock, H. (1970). "Correlations for design of laterally loaded piles in sift clay." 2nd Annual Offshore Technology Conference, OTC1204 Vol 1, Houston, Texas, pp Navin, M. (2009). "FLAC analyses for T-Wall downdrag investigation." Internal document, USACE, St. Louis, Missouri, pp.24. Navin, M. (2009). "Overview of FLAC analysis for St. bernard Parish." Internal document, USACE, St. Louis, Missouri, pp17. Rajashree, S. S., and Sitharam, T. G. (2001). "Nonlinear finite-element modeling of bater piles under lateral load." Journal of Geotechnical and Geoenvironmental Engineering, 127(7), Rao, S. N., Murthy, T. V. B. S. S., and Veeresh, C. (1994). "Induced bending moments in batter piles in settling soils." Soils and Foundations, 34(1), Rao, S. N., Murthy, T. V. B. S. S., and Veeresh, C. (1995). "Closure to "Induced bending moments in batter piles in settling soils" " Soils and Foundations, 35(1), 175. Reese, L. C., Cox, W. R., and Koop, F. D. (1974). "Analysis of laterally loaded piles in sand." 5th Annual Offshore Technology Conference, OTC 2080, Houston, Texas. Reese, L. C., and Van Impe, W. F. (2001). Single piles and pile groups under lateral loading, Taylor and Francis, London, U.K. Sato, S., Akai, K., Funahashi, T. (1970). "Study on methods to calculate negative skin friction and bending in a batter pile." Laboratory Report of Japan Road Corporation, pp (in Japanese). Sato, S., Iwashita, F., and Ohmori, H. (1987). "The calculation method on the bending moment of a batter pile induced by ground settlement." Soils and Foundations, 27(2), (in Japanese). Sawaguchi, M. (1989). "Prediction of bending moment of a batter pile in subsiding ground." Soils and Foundations, 29(4), Shibata, T., Sekiguchi, H., and Yukitomo, H. (1982). "Model test and analysis of negative friction acting on piles." Soils and Foundations, 22(2), Stremlau, T., and Hance, J. (2009). "Lateral loads on piles." Internal document, Eustis 57 F-70
71 Appendix A UPDATED 04 JUN 12 List of references Engineering, Metairie, Louisiana. Takahashi, K. (1985). "Bending of a batter pile due to ground settlement." Soils and Foundations, 25(4), Templeton, A. E. (2009). "Settlement and settlement induced stress." Burns Cooley Dennis, Inc., Ridgeland, Mississippi, pp. 49. Tominaga, M., and Hashiimoto, M. (1987). "Discussion of "Bending of a batter pile due to ground settlement" by Kunio Takahashi." Soils and Foundations, 27(1), Wang, S. T., and Reese, L. C. (1993). "COM624P-Laterally loaded pile analysis program for the microcomputer, Version 2.0." FHWA-SA , Federal Highway Administration, Washington, D.C., pp.504. Wenz, K. P. "Large scale tests for determination of lateral loads on piles in soft cohesive soils." Proceedings of the 8th International Conference of Soil Mechanics and Foundation Engineering, F-71
72 Appendix B Overview and impressions of existing methods to estimate downdrag induced bending moments 59 F-72
73 Appendix B Overview and impressions of existing methods Method Pros/Cons Assumptions Remarks/ Other findings of study Sato et al. (1970) (in Japanese) Simple closed form solution Selection of loading zone dimensions is subjective and has significant impact on results Pile considered to be elastic beam Clay divided into loading zone and supporting zone. Loading zone carries weight of clay over effective length and effective width Supporting zone treats clay as Winkler soil, therefore ground reaction is linear. Pile considered to be pinned at base of clay layer, no tip settlement Moments and deflections are zero at either end of pile Sato s method is very sensitive to the choice of effective width and effective length for defining the loading zone. The recommendation is to use an effective width of three times the pile diameter, but there is no guidance on selecting an effective length. When calibrated, Takahashi (1985) showed that this model has good ability to predict bending moments. Broms and Fredriksson (1976) Assessment Since there is no English version of this paper, pursuing this method further would be difficult. This method appears to have no advantages to the method by Sawaguchi (1989). Usage of this method requires defining the dimensions of an upper loading zone. Although some guidance is provided in the paper regarding the selection of the width of the loading zone, the choice of the length of the zone is rather arbitrary and has significant effect of the predicted maximum bending moment. Therefore, it would be difficult to assess the reliability of the bending moments predicted using this method. Use of trigonometric Bending moments in piles are due to downdrag Broms and Fredriksson use the concept of series for solution of the forces virtual work to equate the internal work in the analytical model makes Axial loads in pile have insignificant impact on pile due to the induced moment and the this method impractical predicted bending moment external work due to displacement of the soil for general use Clay is considered as Winkler soil, therefore They use an empirical relationship between the ground reaction is linear coefficient of subgrade reaction, the undrained Settlement assumed to be uniform over the length strength of the clay, and the pile diameter. This of the pile relationship is also used by Shibata et al. (1982) Broms and Fredriksson perform a parametric study using their analytical model to investigate the influences of the following on pile bending moments: Pile modulus, pile length, settlement magnitude, undrained shear strength of clay, restraint conditions of the pile, variation of shear strength with depth, and the presence of a desiccated crust. 60 F-73
74 Appendix B Overview and impressions of existing methods Method Pros/Cons Assumptions Remarks/ Other findings of study Assessment Shibata et al. (1982) There is not a usable form of the expression for bending moment readily available. Insufficient guidance is provided in the paper to reproduce the trigonometric series used by Broms and Fredriksson to solve the differential expression for bending. This approach appears to have no advantages over the method by Shibata et al. (1982), except that Broms and Fredriksson show their approach applied to both hinged and fixed conditions at the head of the pile. Simple closed form Pile considered to be an elastic beam Experimental model findings solution Clay is considered as Winkler soil, therefore A linear relationship exists between bending Limited applicability to ground reaction is linear moment and applied consolidation pressure realistic field conditions Pile considered to be pinned at base of clay layer, A linear relationship exists between downdrag therefore there is no settlement or moment at the load and consolidation pressure pile tip A 20% reduction in max. bending moment was Linear variation of settlement through clay layer observed when bitumen was used for batter Moments and deflections are zero at either end of piles. pile For small batter angle, the bending moment at Contribution of axial pile loads to deflections and a particular location along the axis of the pile is moments are insignificant. proportional to batter angle (continued) Shibata et al. (1982) Assessment The simple closed form solution proposed by Shibata et al. can be used to predict the maximum bending moment measured in laboratory and field scale studies with good accuracy, provided that the right value is used for the horizontal subgrade reaction coefficient assumed over the pile length. The method is suited for batter piles with a pinned top connection which are embedded in uniform clay and bear on a stiff underlying stratum. The method loses accuracy for bending moment distribution of piles that pass through an embankment layer or extend above the ground surface. Reliable use of this method would require a way to confidently estimate the coefficient of horizontal subgrade reaction for local soils. It does not appear that the model by Shibata et al. can be extended to include other boundary conditions, variable ground conditions, or nonlinearity within the scope of this project. However, such extensions may be possible in the future by developing adjustment factors or adding an extra calculation step. 61 F-74
75 Appendix B Overview and impressions of existing methods Method Pros/Cons Assumptions Remarks/ Other findings of study Takahashi (1985) No closed form solution Insufficient details are provided to implement this approach More realistic treatment of settling clay Considers case where pile penetrates the embankment Boundary condition are not explicitly given Pile considered to be an elastic beam Clay is considered as Winkler soil, therefore ground reaction is linear Non linear distribution of clay settlement according to double drained assumed strain profile Bending moment induced by embankment through component of overburden pressure normal to the pile axis Pile considered to be pinned at base of clay layer, therefore there is no settlement or moment at the pile tip Takahashi s model incorporates four conditions: 1) bearing stratum, 2) consolidating clay, 3) embankment layer, 3) free portion The pile is loaded normal to the pile axis both through the embankment and the consolidating clay. Takahashi does not provide details on how to solve for unknown constants and implement his approach. Possible typo in Equation 6 of the paper. Takahashi compared the deflections and moments measured in experimental and fieldscale studies and found that his method, along with Sato s method (1970) outperformed the predictive ability of his 3D finite element model. Experimental model findings A proportional relationship exists between maximum bending moment and pile inclination angle A linear relationship exists between ground settlement magnitude and maximum bending moment. Takahashi observed a linear relationship between settlement of the pile top and the pile inclination angle Numerical study findings Takahashi found that a 3D FEM was necessary since his 2D model was unable to capture the pile behavior observed in the experimental model. 62 F-75
76 Appendix B Overview and impressions of existing methods Method Pros/Cons Assumptions Remarks/ Other findings of study (continued) Takahashi (1985) Field study findings The use of bitumen coating can significantly reduce downdrag loads on a batter pile, but can actually result in a slight increase in the measured maximum bending moment Sato et al. (1987) (Japanese) Assessment There is not a usable form of the expression for calculating bending moment readily available. The additional features incorporated into Takahashi s Method over the Shibata Method appear to provide little added benefit to addressing the evaluation of bending moments in batter piles supporting T Walls. It does not appear that Takahashi s Method can be extended to include other boundary conditions or nonlinearity within the scope of this project. A description of the Assumes linear subgrade reaction up to an It appears that this method is very similar to the method in English is not ultimate capacity and perfectly plastic response method by Sato et al. (1970) with the addition available thereafter of the consideration of the plastic yield of the soil. Based on his experimental study, Sawaguchi (1989) showed that this model does reasonably well at predicting maximum bending moment Assessment Since there is no English version of this paper, pursuing this method further would be difficult. From the figures in the reference paper, it appears that this method is similar to the method by Sato et al with the inclusion of a yield stress to the linear soil response. It is unclear whether sufficient details are provided in the paper to implement the approach. 63 F-76
77 Appendix B Overview and impressions of existing methods Method Pros/Cons Assumptions Remarks/ Other findings of study Sawaguchi (1989) Sawaguchi provides nondimensional design charts to calculate the maximum bending moment. The charts provided in the paper cannot be used to determine the distribution of bending moment. No closed form solution exists. Sawaguchi does not provide details for implementation of his method beyond the use of the design charts. Assessment Pile considered to be an elastic beam Pile is considered to be loaded as a positive projecting conduit according to Spangler s formula in upper Loading zone Below loading zone, clay is considered as Winkler soil, therefore ground reaction is linear. Linear variation of settlement through clay layer Moments and deflections are zero at either end of pile The portion of the pile that is considered within the Loading zone is determined in the solution using the boundary conditions of the problem. To estimate the coefficient of subgrade reaction, Sawaguchi used an empirical relationship with unconfined compressive strength proposed by Sawaguchi (1986). Using the field study data also reported by Sato et al. (1987) and Takahashi (1985), Sawaguchi compared the measured maximum bending moments to the values predicted using his method and the methods by Takahashi (1985), Sato et al. (1987) and found that all had good predictive ability. The method does not offer significant advancements over the Shibata Method except for the inclusion of a loading zone near the pile top. It does not appear that Sawaguchi s method can be extended to include other boundary conditions, variable ground conditions, or nonlinearity within the scope of this project. Evaluating the Sawaguchi Method would require digitizing the chart solutions provided in the paper to predict the maximum bending moment. 64 F-77
78 Appendix B Overview and impressions of existing methods Method Pros/Cons Assumptions Remarks/ Other findings of study Rao et al. (1994) Simple model, easy to implement Some assumptions are questionable Development includes incorrect consideration of pore pressures. Poor predictive quality relative to other methods Assessment The pile is treated as a free spanning beam with either pinned pinned or fixed fixed connections The pile is assumed to carry the foundation soil within a wedge shaped volume defined based on the pile length, width, and inclination. The load imposed on the pile due to the foundation soil is equal to the weight of the wedge of soil minus the shear resistance acting between the sides of the wedge and the surrounding soil. Fully mobilized shear forces act on the sides of the wedge of soil supported by the pile but not on the face of the wedge. The component of the supported weight of soil which acts normal to the pile axis is treated as a uniformly distributed load over the length of the pile. Experimental study findings Rao et al. compared their analytical model assuming pinned and fixed end supports to the experimental results for bending moment and found that the fixed support condition yielded better agreement. This does not appear to be a suitable method due to the errors and unreasonable assumptions made during the development of the model. 65 F-78
79 Appendix B Overview and impressions of existing methods Method Pros/Cons Assumptions Remarks/ Other findings of study Hance and Stemlau (2009) Procedure to determine the position of the neutral plane is incorrect. The pile length below the neutral plane is considered to have an insignificant impact on the predicted values of maximum bending moment Some assumptions used in the method are questionable Assessment and is disregarded. The pile length above the neutral plane considered to be a free spanning beam with pinned end supports, therefore no displacement or moment is allowed at the neutral plane. Pile tip resistance is incorrectly assumed to increases in linear proportion to shaft resistance. Above the neutral plane, the pile is assumed to not make contact with the underlying soil. The downdrag load on the pile is assumed to be equal to the integrated shaft resistance above the neutral plane. The downdrag load is assumed to have a triangular distribution over the pile length above the neutral plane. This procedure predicts the maximum bending moment by 1) estimating the position of the neutral plane for a particular set of ground conditions and axial service load, 2) determining the downdrag force as the maximum shaft resistance above the neutral plane, 3) treating the pile above the neutral plane as a freespanning beam with pinned end supports, 4)applying the component of the downdrag load which is perpendicular to the axis of the pile to the beam as a load with a triangular distribution. This approach has flaws in the way the position of the neutral plane is estimated, which is required for estimation of bending moment. This approach also makes some unreasonable assumptions in its development. 66 F-79
80 Appendix B Overview and impressions of existing methods Method Pros/Cons Assumptions Remarks/ Other findings of study Stremlau and Hance (2009) Templeton (2009) Procedure to determine the position of the neutral plane is incorrect. Some assumptions used in the method are questionable The pile length below the neutral plane is considered to have an insignificant impact on the predicted values of maximum bending moment and is disregarded. The pile length above the neutral plane considered to be a free spanning beam with pinned end supports, therefore no displacement or moment is allowed at the neutral plane. The pile length above the neutral plane considered to be a free spanning beam with pinned end supports, therefore no displacement or moment is allowed at the neutral plane. When determining the soil pressure acting on the piles using the p y curves from LPILE, the pile is assumed to be rigid. We have not been provided a complete example of the procedure for this method. The position of the neutral plane is required for use of this procedure. The information provided on this method does not show how the neutral plane was determined, however it appears that it was estimated using the same approach that was used for the method by Hance and Stremlau (2009). In this approach the maximum bending moment is predicted by 1) estimating vertical settlement through the clay profile, 2) obtaining p y curves for a vertical pile embedded in the clay, 3) treating the pile above the neutral plane as a free spanning beam with pinned supports, 4) determining the soil pressure distribution acting on the pile using the p y curves and the component of settlement which acts perpendicular to the pile axis as the deflection for various points along the pile, 5) determine to maximum bending moment due to the nonuniform pressure acting on the beam. Assessment Like Hance and Stremlau (2009), this approach makes some unreasonable assumptions in its development. This method or a This approach uses the component of the soil derivative appears to be displacement due to consolidation which acts promising normal to the batter pile axis as the magnitude of free field soil displacement in LPILE. Usage of this approach will require reviewing the usage of p y curves developed for vertical piles on battered piles. Assessment A derivative of this approach appears to be promising. 67 F-80
81 Appendix Summaries of selected sources evaluated during the literature review i. Broms and Fredericksson (1976) ii. Shibata et al. (1982) iii. Takahashi (1985) iv. Sawaguchi (1989) v. Rao et al. (1994) vi. Hance and Stremlau (2009) vii. Stremlau and Hance (2009) 68 F-81
82 Appendix C UPDATED 04 JUN 12 Summaries of selected references Reference: Broms, B., and Fredericksson, A. (1976). "Failure of pile-supported structures caused by settlements." Proceedings of the 6th European Conference on Soil Mechanics and Foundation Engineering, Overview: This study presents the development of an analytical model to estimate the deflection and bending moment induced in a batter pile due to downdrag. The model is then used to theoretically explore the influences of the following factors on bending moment and deflection: the modulus of the pile material, pile length, settlement magnitude, shear strength of the foundation soil, restraint conditions at the ends of the pile, the variation of shear strength with depth, and the presence of a dessicated upper crust. Also investigated was the magnitude of ground settlement that could be tolerated by a pile with a moment capacity of 41kNm installed at a certain inclination angle through a clay layer with a constant undrained strength. Development of analytical model: Ground surface Depth, x Incompressible base Figure 1: Analytical model proposed by Broms and Fredriksson Broms and Fredriksson assume that bending moments are induced in batter piles due to the component of settlement of the surrounding soil that is perpendicular to the pile axis. They acknowledge that the component of downdrag force that acts axial to the pile, in addition to the imposed load at the pile head, has the effect of increasing the moment capacity of the pile, but this influence has been neglected in the model. Their model assumes a linear soil response to pile deflection by the use of a coefficient of 69 F-82
83 Appendix C UPDATED 04 JUN 12 Summaries of selected references subgrade reaction, k h, which they assumed can be approximated from the undrained shear strength, S u, of the clay, and the pile diameter, D, according to Equation 1. S k 10 u h 1 D Similar to the methods by Shibata (1982) and Takahashi (1985), the reaction of the soil is proportional to the relative displacement of the pile and the soil by Equation 2, which is equal to the difference between the component of settlement normal to the pile axis, x cos and the lateral deflection of the pile, y x. As indicated in Figure 1, β is the inclination of the pile from horizontal and δ x is the vertical ground settlement. q k cos y 2 x h x x To relate the load displacement relationship of the soil the to the lateral loaddisplacement relationship of the pile, Broms and Fredriksson use the principal of virtual work. They use trigonometric series out to eighty terms to apply the virtual work concept based on solutions by Hetenyl (1946) where the coefficient of subgrade reaction varies along the length of the pile. The internal work, V 1, from the moment of the pile is given by Equation 3 in the paper. The work by the surrounding soil, V 2, is given by Equation 4 and the work imposed by the soil on the pile, V 3, is given by Equation 5. Using the principal of virtual work, the work done by the soil on the pile, V 3, must equal the change in internal work, V 1. This equality is given in Equation 6 in the paper. Since the work by the external soil load depends on the magnitude of settlement acting normal to the pile axis, the distribution of the settlement with depth has important impacts on the model response. Broms and Fredriksson are not clear as to how they assume settlement varies along the length of the pile. The impression from the text and from Figure 3 in the paper is that the settlement is assumed to be uniform over the pile length. This means that the soil displacement normal to the pile is equal to the component of settlement at the ground surface which acts normal to the pile. Results of parametric study using the analytical model: Below are the results of the investigation for each of the parameters evaluated. Modulus of elasticity of the pile Broms and Fredriksson observed that the bending moment increases in the pile with an increase in modulus. They also observed that the location of the maximum bending moment moves away from the pile head as the pile becomes stiffer. Pile length The results of the theoretical investigation indicate that the maximum bending moment predicted in the pile is independent of pile length for lengths greater than 10m. 70 F-83
84 Appendix C UPDATED 04 JUN 12 Summaries of selected references Settlement magnitude and shear strength of clay foundation soil Broms and Fredriksson found that the predicted maximum bending moment increased linearly with the magnitude of surface settlement acting normal to the pile axis. Figure 3 in the paper shows that increasing the shear strength of the foundation soil increases the predicted maximum bending moment for a given magnitude of settlement. This conclusion is due to the increase in virtual work by the soil pressure acting on the pile since more work is required to displace the soil a given magnitude when the coefficient of subgrade reaction is higher. End restraint The model developed by Broms and Fredriksson predicts that the maximum bending moment is nearly three times higher when the pile head is fixed rather than pinned. Variation of shear strength with depth Broms and Fredriksson investigated the response of their model to an undrained shear strength profile that increases linearly with depth. Since the value of shear strength is used to estimate the coefficient of subgrade reaction, the variation affects the virtual work done by the soil on the pile. Based on Figures 4 and 5 in the paper, they concluded that there was not a significant difference in the magnitude or distribution of bending moments between the case where shear strength is constant and the case where shear strength increases with depth. Presence of dessicated crust Broms and Fredriksson studies the case where the upper 2 meters of foundation soil was assigned a shear strength that was 10 times higher than the underlying soil. This scenario was used to investigate the influence of a stronger, dessicated, layer of soil at the ground surface. Their model predicts that the maximum bending moment for a pile will be 4 times higher when a desiccated crust is present compared to a profile without such a crust. Settlement at pile failure Assuming a pile with a moment capacity of 41kN, Broms and Fredriksson varied the pile inclination angle from horizontal and determined the magnitude of settlement needed to produce failure. They found that piles with increasing batter failed at lower magnitudes of settlement. They also observed that piles become less tolerant of settlement (more prone to failure) when the undrained shear strength of the soil was high. 71 F-84
85 Appendix C UPDATED 04 JUN 12 Summaries of selected references Reference: Shibata, T., Sekiguchi, H., and Yukitomo, H. (1982). "Model test and analysis of negative friction acting on piles." Soils and Foundations, 22(2), Overview: The study by Shibata et al focuses on answering three question regarding the influence of negative friction of groups of piles: 1) What is the net effect of negative skin friction acting on a group of vertical piles?, 2) What bending moments and deflections are produced in batter piles due to negative skin friction?, and 3) What percent reduction in downdrag induced loads and bending moments can be achieved through the use of bitumen as a friction reducer. The questions are addressed using a laboratory scale model which can simulate the downdrag forces acting on piles due to an applied uniform pressure and by using a theoretical approach developed by Broms and Fredriksson (1976). Additional details of the investigation related to batter piles is given below. Description of the experimental apparatus: The apparatus developed by the authors consists of a cylindrical steel tank with an outside diameter of 1485mm and a height of 1000mm. The tank is used to contain the model piles and the clay which consolidates around the piles. The tank has a lid that, when secured, makes the tank air tight. The bottom of the tank includes a base layer of sand and drainage ports to allow for water expelled from the clay during consolidation to exit the apparatus. The tips of the model piles react against load cells fixed to the bottom steel plate of the tank. In this arrangement, the neutral plane will be at the pile tips. The clay sample consists of kaolin and is formed around the model piles from slurry and allowed to consolidate under self weight. During a test, a vinyl membrane is placed over the top of the model piles and clay sample. With the tank lid in place, air pressure is applied through a port in the lid which exerts a vertical pressure on the piles and clay. As the clay consolidates, the load acting on the pile is monitored using the load cells. Piezometers are also included in the tank to measures pore pressures in the clay and track the progress of primary consolidation. Three series of tests were performed at different consolidation pressures using two rows of three piles set at a batter of 15 degrees from vertical. Each steel pile had an outer diameter of 60mm, a wall thickness of 1.2mm, and a length of 600mm. A series of strain gauges were installed on the inner surface of the battered model piles to measure bending moment. One of the three tests series used bitumen to determine its effectiveness at reducing downdrag loads and bending moments. 72 F-85
86 Appendix C UPDATED 04 JUN 12 Summaries of selected references Experimental results for batter piles: Downdrag load The unit downdrag load acting on a single vertical pile is expressed by the authors according to Equation 3. In this expression, z is the mobilized unit shaft friction at a ' depth z below the ground surface, m is the mobilized effective interface friction angle between the pile and the surrounding clay, K is the lateral earth pressure coefficient, ' ' and v and h are the magnitudes of effective vertical and horizontal stress, respectively. The value of z at a given depth increases with relative displacement of the soil relative to the pile to reach a limiting value. tan K tan 3 ' ' ' ' z h m v m The contribution of group effects results in different magnitudes of downdrag force exerted on the piles depending of their position within the group. As shown in Figure 8 in the paper, piles with exposure to the perimeter of the pile group are subjected to higher downdrag loads than piles found in the interior of the group. This figure also shows that there exists an approximately linear relationship between the unit downdrag stress and the magnitude of applied consolidation pressure. This observation suggests that the lateral earth pressure coefficient and interface friction angle are not significantly affected by the magnitude of effective vertical stress for the modeling conditions used in the study. The ratio between the unit downdrag stress and the consolidation pressure for batter piles was determined by the authors to be only slightly smaller than the value of 0.18 observed using vertical piles. The authors contend that the relationship given in Equation 3 for vertical piles can be applied to batter piles and yield conservative results. In the test using bitumen as friction reducer, the authors observed a 50 percent reduction in measured downdrag load compared to the uncoated cases. Flexural behavior Shibata et al. use the layout given in Figure 1 to present their discussion of the flexural behavior of batter piles. Here, x represents the distance measured from along the length of the batter pile, with length, L, penetrating the clay stratum. The authors chose to average the bending moment measured in the piles at the different positions in the group. They observed that for a position along the x axis, the measured bending moment increased more or less linearly with consolidation pressure. This linear relationship contrasts to the nonlinear relationship between applied consolidation 73 F-86
87 Appendix C UPDATED 04 JUN 12 Summaries of selected references pressure and settlement. They also found that the used of bitumen resulted in a 20% reduction in the maximum bending moment compared to the uncoated case. Figure 2: Local axes and orientation for batter pile Theoretical consideration of the flexural behavior of batter piles In an effort to theoretically model the flexural behavior of a batter pile subjected to downdrag forces, the authors decided to model the pile as a horizontal elastic beam supported by a Winkler spring foundation. Using these representations, the force relationship given in Equation 4 holds. 4 EI d y k 4 y ys 0 Ddx 4 In this expression E is the Youngs modulus of the pile, I is the moment of inertia, D is the pile diameter, k is the coefficient of subgrade reaction, y is the pile deflection, and y s is the ground displacement normal to the x axis. The authors assume that the ground displacement, y s, can be related to the vertical surface settlement according to Equation 5 where o is the magnitude of surface settlement, and is the inclination of the pile from vertical. This approach assumes that settlement varies linearly along the length of the pile. x ysx o1 sin L Substituting Equation 5 into Equation 4 yields the differential equation given by Equation d y 4 2 x 4 y sin dx L 6 74 F-87
88 Appendix C UPDATED 04 JUN 12 Summaries of selected references where β is defined by kd 4EI 14 The authors chose to establish boundary conditions by assuming no pile deflection or moment, M, occurs at either end of the pile. y 0 at x 0 and x L 7 M 0 at x 0 and x L Using the boundary conditions given in (7), the differential equations can be solved to yield solutions for deflection and moment along the pile according to Equations 8 and 9, respectively. coshxcos x2l cosh x2l cosx x y o sin 1 cosh2l cos 2L L 2 2o sinei M sinhxsinx2lsinhx2lsinx cosh2l2cosl 8 9 To assign a value for the modulus of subgrade reaction, Shibata et al. chose to use the recommendation by Broms and Fredriksson (1976) and assume that k 10S u D, where S u, is the undrained strength of the clay. Using the relationships given in Equations 8 and 9, the authors obtained good agreement between the predicted and measured value sof bending moment. They also found that when the batter angle is small, that the bending moment at any value of x is proportional to the batter angle. 75 F-88
89 Appendix C UPDATED 04 JUN 12 Summaries of selected references Reference: Takahashi, K. (1985). "Bending of a batter pile due to ground settlement." Soils and Foundations, 25(4), Overview: The study by Takahashi applies theoretical modeling, laboratory and field scale experimental modeling, and numerical modeling to the problem of predicting bending moments generated in batter piles due to downdrag forces. Background on theoretical models: The author presents a general overview of the existing theoretical methods which treat the pile as an elastic beam which rests on a Winkler spring foundation. The existing approaches include the method develop by Broms and Fredriksson (1976), the method by Sato et al. (1970) which is presented in Japanese, and the method by Shibata et al. (1982). These methods are all fairly similar in their assumptions and treatment of the pile and consolidating clay. The author asserts that the method by Shibata et al. was developed primarily for comparison to their experimental model which was for the case of an end bearing pile. The model by Shibata et al. also assumed that the settlement of the clay varied linearly along the axis of the batter pile. The method by Broms and Fredriksson solves the differential expressions for stress and deflection using trigonometric series, which Takahashi claims make the approach impractical for general use. The method by Sato et al. (1970) treats the batter pile as an elastic beam which supports the weight on the consolidating clay over an effective width and effective length which are chosen using judgement. The weight of the soils is thought to act over the area defined by the effective width and length. Below the zone where the pile is considered to carry the weight of the soil, the pile is considered to supported elastically by the bearing stratum. This arrangement is shown in Figure 1, where L is the effective length of the pile. 76 F-89
90 Appendix C UPDATED 04 JUN 12 Summaries of selected references L Figure 3: Treatment of pile and foundation soil interaction in method by Sato et al. (1970) Development of theoretical model by Takahashi: The theoretical model developed in the current study treats the pile soil model according to Figure 2. Similar to the other models mentioned above, the current model considers the pile to be an elastic beam resting on a Winkler spring foundation. The enhancements of this model compared to the preceding models in the inclusion of four distinct foundation characteristics and consideration of the non linear strain profile within the consolidating clay layer. The model also does not assume that displacement and moment is zero at the base of the clay layer, but rather uses the reaction of the pile in the bearing stratum (Layer 1). Figure 4: Takahashi's model for soil pile interaction Using Winkler springs, the pile is loaded proportionally to the product of the coefficient of subgrade reaction and the relative displacement between the pile and the component of ground settlement normal to the pile axis. 77 F-90
91 Appendix C UPDATED 04 JUN 12 Summaries of selected references Takahashi provides the assumption of Winkler subsoil according to Equation 1, where E represents Youngs modulus of the pile, I is the moment of interia of the pile, W is the pile width, θ is the pile inclination form vertical, k is the coefficient of subgrade reaction, x is the distance along the pile axis, and y is the deflection normal to the pile axis. The function S(x) represents the vertical ground settlement as a function of the position, x, along the pile axis. 4 EI d y k S( x)sin y 4 Wdx 1 For Layer 1, which represents the bearing stratum, the ground settlement is assumed to be zero and Equation 1 reduces to an elastic subgrade reaction for pile deflection. For Layer 2, which represents the consolidating clay, the function S(x) developed based on the strain profile for one dimensional consolidation that is occurring with drainage layers at both the top and bottom of the clay layer. The author uses a third order polynomial to model the settlement profile developed by integrating a second order (parabolic) strain profile given by Mikasa (1963). This profile is shown in Figure 3 of the paper. Takahashi provides the expression for S(x) according to Equation 2. 2 x 1 x S x S U 3 2 x d cos d cos d cos 2 In this expression S is the settlement of the ground surface at the end of primary consolidation, U is the degree of consolidation, and d is the original thickness of the clay layer. Takahashi warns that the assumed strain profile given in Figure 3 of the paper is only valid when at least a third of the primary consolidation has completed. Solving Equation 1 for Layer 2 yields the expression for pile deflection normal to the pile axis given by Equation 3 where A 1 through A 4 are constants and z 1 through z 4 are defined below. y Az 1 1A2z2 A3z3 A4z4 S( x)sin 3 78 F-91
92 Appendix C UPDATED 04 JUN 12 Summaries of selected references z cosxcoshx 1 1 z2 sin x cosh x cos x sinh x 2 1 z3 sin x sinh x 2 1 z4 sin x cosh x cos x sinh x Wk 4EI Layer 3 is defined as the load layer and is used to represent the embankment load. Takahashi does not provide a clear explanation of how this layer contributed to the deflection and bending moment produced in the pile, however the adapted form of Equation 1 for the Layer is given by Equation 5. In this expression, γ is the unit weight of the embankment material and x o is the distance along the pile axis from the pile tip to the top of Layer 3. 4 EI d y 2 4 xo xsin cos Wdx 5 Inspection of Equation 5 allows for an explanation of the contribution of Layer 4 to the deflection and bending moment to be developed. The vertical stress at a depth, z, measured from the top of Layer 4 is equal to xo xcosand the component of the vertical stress which acts normal to the pile axis is equal to x xcossin. The sine in Equation 5 is squared and at this time is it not understood why this is. Using Takahashi s expression given by Equation 5, the deflection of the pile can be determined according to Equation 6, where, A 1 through A 4 are constants and A 5 and A 6 and given below. o y AAxAx Ax Ax Ax A A W x 24 EI sin cos 2 o 1 W sin 120 EI cos 2 7 Layer 4 is the free layer which corresponds to the portion of the pile that extends above the ground surface. Since the free layer has a coefficient of subgrade reaction equal to zero the solution to Equation 1 for Layer 4 is equal to Equation F-92
93 Appendix C UPDATED 04 JUN 12 Summaries of selected references y A A xa x A x Takahashi applies linear algebra to set up the expressions relating the pile behavior to the soil deflections for each of the four layers. These expressions are given by Equations 9 through 14 in the paper. The process to solve the systems of equations is left unclear. Takahashi mentions limiting the number of rows in the matrices to four, which in the case of Layer 2 requires eliminating a row, to make solving the expressions possible. He also does not provide details on how the unknown constants should be determined other than that the sixteen constants could be solved by the use of twelve continuity conditions at three boundaries between the layers and of four boundary conditions at pile top and pile tip. Experimental Model Tests: The test apparatus used in this study consists of a cylindrical steel tank with an inside diameter of 2520mm and a height of 1700mm. A 1130mm sample of clay was prepared saturated in a remolded state and was sandwiched between upper and lower sand drainage layers (50 100mm thick each). The piles used consist of thin rectangular steel plates with a length of 1780mm, a width of 75mm, and a thickness of 9mm. A group of eight piles was installed into the remolded clay sample at a batter angles of 5, 10, 15, or 20 degrees. The piles in opposing pairs were installed at the same batter angle and all four angles of batter were present in the group simultaneously. Takahashi doesn t describe installation process or how much smearing occurs, but mentions that a special device was used. Each pile was instrumented with seventeen strain gauges spaced every 10 cm along its length to measure the bending moment. Consolidation of the clay was induced by placing a 220mm layer of steel shot over the upper sand layer corresponding to a consolidation pressure of 10kN/m 2. The ground settlement, pile deflection, and bending moments were monitored for 100 days after placement of the steel shot. The distribution of bending moment if the pair of piles inclined at 20 degrees is shown in Figure 7 of the paper. Takahashi observed a proportional relationship between the maximum bending moment and the pile inclination angle. This is similar to the result observed by Sabata et al. (1982). Takahashi also found that the relationship between the magnitude of surface settlement and maximum bending moment to be near linear. Shibata et al. (1982) observed a near linear relationship between the bending moment at a given position along the pile and the consolidation pressure. Finite element analysis of model tests: Takahashi does not provide much detail on the methods or software used to generate a finite element model of the experimental conditions. He used elastic constitutive 80 F-93
94 Appendix C UPDATED 04 JUN 12 Summaries of selected references relations for both the pile and soil and modeled the experimental tests in two dimensions. He was not able to obtain reasonable agreement between the numerical and experimental results and determined it was necessary to model the problem in 3D. Using the 3D model he was able to obtain reasonable agreement for the magnitude of maximum bending moment for inclination angles of 10 and 20 degrees. Evaluation of experimental results using Sato s Method: Takahashi was able to obtain good agreement between the measured and predicted values of deflection, deflection angle, bending moment, shear force, and soil pressure acting on the pile for an inclination angle of 20 degrees. It seems like a trial and error approach is necessary to adjust the effective width and length values to get the predicted values to agree with the experimental results. Sato et al. recommend an effective width that is three times the pile width. The data fit obtained using Sato s method, once calibrated, was better than the fit obtained using the 3D FE model. Evaluation of experimental results using Takahashi s method: Takahashi achieved good agreement between the measured and predicted values of deflection, deflection angle, bending moment, shear force, and soil pressure acting on the pile for an inclination angle of 20 degrees. He found the best fit was obtained when he assumed an elastic soil reaction for both the clay and sand layers and treated the steel shot as a load layer. Field tests: An instrumented field test consisting of a 2x2 group of steel pipe piles with a batter angle of 15 degrees was reported by Takahashi (1985), Sato et al. (1987) and Sawaguchi (1989). An 2.5m embankment with plan dimensions of approximately 40m x 25m was placed to initiate consolidation of the roughly 30m thick soft clay deposit. The piles were installed through the embankment and the clay to bear on a stratum of stiff clay stratum with gravel. The piles extended above the ground surface and were hinged in pairs. The spacing between the piles is not provided in the paper. Two of the piles were coated with bitumen to observe the effects on deflection and moment. Extensive instrumentation was used in this study to monitor settlement, pile deflection, and pile moment. A summary of the instrumentation is given in Table 1 of the paper. The instrumentation was monitored for a year while consolidation proceeded. The distributions of axial force and bending moment for the coated and uncoated piles is shown in Figures 22 and 23 of the paper. Takahashi found that while the bitumen coating significantly reduced down drag loads, the coating actually resulted in slightly higher bending moments in the upper portion of the pile. Takahashi s laboratory finding that the maximum bending moment increased linearly with the ground settlement was again observed at the field scale. 81 F-94
95 Appendix C UPDATED 04 JUN 12 Summaries of selected references Finite element analysis of model tests: In an attempt to model the field results, Takahashi again found that 2D finite element modeling did not adequately capture the interaction between the pile and the soil. He did not pursue modeling the field tests in 3D. Evaluation of experimental results using Sato s Method: Takahashi again applied a trial and error approach to selecting appropriate values for the effective width and length. In the paper, he notes the strong influence of the choice of effective width on the results. He was able to obtain reasonable prediction of bending moment along the length of the pile, although the predicted location of maximum moment did not correspond to the measured location. Evaluation of experimental results using Takahashi s method: Takahashi provides some detail on how he decided to divide the soil profile at the field test site into the Layers used in his theoretical model. He ultimately decided break the pile into four sections. He included a free layer, a load layer to capture the influence of the embankment, and two clay layers to simulate the soft clayey soil. He found some sensitivity of the model to the location where he divided the clay layer in to upper (compressible) and lower (less compressible) regions. His model did not show much sensitivity to the choice of soil unit weight, which is equivalent to changing the width adjustment factor. Takahashi also found that the selection of the thickness for the embankment layer made little difference on the results. Again, he found that his model was able to capture the interaction between the pile and soil better than either Sato s method or finite element analysis. 82 F-95
96 Appendix C UPDATED 04 JUN 12 Summaries of selected references Reference: Sawaguchi, M. (1989). "Prediction of bending moment of a batter pile in subsiding ground." Soils and Foundations, 29(4), Overview: The technical note by Sawaguchi briefly discussions existing methods by Sato et al. (1970), Shibata et al. (1982), Takahashi (1985), and Sabato et al. (1987) for estimating the bending moment induced in a batter pile due to settling ground. Sawaguchi draws from elements from each of the aforementioned methods and presents his analytical model of the problem. He provides chart solutions developed from computer solutions of his model. Development of analytical model: Sawaguchi s approach introduces a different way to consider the vertical loading of the batter pile near the ground surface. Rather than use a loading layer like Takahashi, Sawaguchi assumes that the upper portion of the pile is loaded in a way similar to a positive projecting conduit. For the remainder of the pile, Sawaguchi adopts the assumption of Winkler ground common to the other methods. The justification for the treatment of the upper pile as a positive projecting conduit is based on numerous field observations of ground deformation around the batter pile. This deformation can be generalized as having a zone directly over the surface projection of the pile where significantly less surface settlement occurs compared to other areas. Sawaguchi s analytical model is shown in Figure 1. Ground surface Consolidating clay y Incompressible base x Figure 5: Analytical model developed by Sawaguchi (1989) 83 F-96
97 Appendix C UPDATED 04 JUN 12 Summaries of selected references Using the assumption of a positive projecting conduit for loading within the upper portion of the pile, the earth pressure acting on the pile can be estimated using Spangler s formula. For a pile top flush with the ground surface, the relationship between pile deflection and soil pressure in the loading zone (0 x X 1 ) is given by Equation d y1 B sin 2Kcos EI exp X 1 4 dx 2K B 1 In the expression above, Young s Modulus of the pile is represented by E, the moment of inertia of the pile by I, B is the pile width, y 1 is the deflection of the pile within the loading zone, γ is the unit weight of the surrounding soil, K is the coefficient of lateral earth pressure, µ is the coefficient of friction between the soil supported by the pile and the surrounding soil, θ is the inclination f the pile from vertical, and y 1 is the pile deflection within the loading zone. Below the loading zone (X 1 x l), Sawaguchi considers the pile to be supported by Winkler soil according to Equation 2. 4 d y2 EI Bk ( )sin 4 h S x y2 2 dx Here, y 2, is the deflection of the pile below the loading zone, k h is the horizontal coefficient of subgrade reaction, and S(x) expresses the variation of vertical settlement along the pile axis. Sawaguchi applies the same assumption as Shibata et al. (1982) and assumes linear variation of the vertical settlement with depth according to Equation 3, where S o is the settlement at the ground surface. x Sx S o 1 3 After substituting Equation 3 into Equation 2, Sawaguchi solves Equations 1 and 2 assuming no moment exists at either end of the pile and that the deflection, deflection angle, moment, shear force, and pressure in the pile at the interface of the loading layer with the Winkler soil layer are equal. Since no closed solution for the equations exists, Sawaguchi developed normalized design charts. The charts relate normalized moment, M / EI, to non dimensional parameters listed below. 84 F-97
98 Appendix C UPDATED 04 JUN 12 Summaries of selected references Field Scale Tests: 3 4 kb h 4EI 2K cos B S B sin 2KEI o sin 4 An instrumented field test consisting of a 2x2 group of steel pipe piles with a batter angle of 15 degrees was reported by Takahashi (1985), Sato et al. (1987) and Sawaguchi (1989). An 2.5m embankment with plan dimensions of approximately 40m x 25m was placed to initiate consolidation of the roughly 30m thick soft clay deposit. The piles were installed through the embankment and the clay to bear on a stratum of stiff clay stratum with gravel. The piles extended above the ground surface and were hinged in pairs. The spacing between the piles is not provided in the paper. Two of the piles were coated with bitumen to observe the effects on deflection and moment. Extensive instrumentation was used in this study to monitor settlement, pile deflection, and pile moment. A summary of the instrumentation is given in Table 1 of the paper. The instrumentation was monitored for a year while consolidation proceeded. The distributions of axial force and bending moment for the coated and uncoated piles is shown in Figures 22 and 23 of the paper. Takahashi found that while the bitumen coating significantly reduced down drag loads, the coating actually resulted in slightly higher bending moments in the upper portion of the pile. Takahashi s laboratory finding that the maximum bending moment increased linearly with the ground settlement was again observed at the field scale. The measured bending moments induced by the settlement were compared to values predicted using Sawaguchi s analytical model. Sawaguchi applied an empirical correlation using the unconfined strength of the clay to estimate the coefficient of horizontal subgrade reaction. Using the input parameter values given in Table 1 of the paper, Sawaguchi was able to obtain good agreement between the measured and predicted values of bending moment. He concludes the discussion of the field scale study by comparing the measured value of maximum bending moment to the values predicted using the methods by Sato et al. (1987) and Takahashi (1985). For the case at hand, the two existing methods and the Sawaguch s method all predicted values close to the measured maximum bending moment. 85 F-98
99 Appendix C UPDATED 04 JUN 12 Summaries of selected references Reference: Rao, S. N., Murthy, T. V. B. S. S., and Veeresh, C. (1994). "Induced bending moments in batter piles in settling soils." Soils and Foundations, 34(1), Overview: The study by Rao et al. (1994) includes the development of an analytical model for estimating the pressure acting on a single batter pile due to settlement of the surrounding soil. The model divides the consolidating soil surrounding the pile into three zones: 1) a wedge shaped zone overlying the pile that is completely supported by the pile, 2) a transitional 3D zone of arching that sheds vertical stress to the pile, 3) the soil beyond the zone of arching that is unaffected by the presence of the pile. The principal deviation of the proposed method to the methods by Sata, Takahashi, and Shibata, is the consideration of separation developing between the pile and the underlying soil. The authors contend that soil settlement can leave the pile unsupported and it is more appropriate to model the pile as a clear spanning beam with either free or fixed end supports. The pressure acting on the free spanning beam representing the batter pile is determined using the combined pressures produced by the fully supported and arching zones. The study also includes a description of a laboratory scale study carried out to support the provide support for the proposed theoretical model. This paper contains several errors in the presentation of the mathematical development of the model. These errors include typographical mistakes, unreasonable assumptions, and improper application of soil mechanics. These problems are pervasive enough to essentially discredit the authors assertions. Development of analytical model: Estimation of pressure acting on the batter pile The authors introduce the concept for their analytical model by describing the probably shape of the volume of soil that is either directly supported by the pile or supported by arching. The end result of this discussion is the treatment of the soil mass supported by the pile as a three dimensional wedge that is defined by a vertical plane extending from the tip of the pile and a width equal to two pile diameters. This defined soil volume is provided in Figure 1 of the paper, however the figure and supporting text suggest that the width of the wedge is three pile diameters instead of two. It is not until the mathematical development is presented that is becomes apparent that the soil wedge has a thickness of two pile diameters. The concept behind the use of a wedge, is that 86 F-99
100 Appendix C UPDATED 04 JUN 12 Summaries of selected references the soil mass within the wedge is considered to be completely supported by the pile and that shear resistance between the sides of the wedge and the surrounding soil reduces the load carried by the pile. No shear force is considered to develop between the face of the wedge and the surrounding soil. This concept is illustrated in Figure 1. Ground surface No shear force develops on face of wedge Shear forces develop on sides of wedge y dz bz Consolidating clay Incompressible base x Figure 6: Wedge of soil supported by pile used in the analytical model developed by Rao et al. Using the wedge defined in Figure 1 and assuming that shear strength is fully mobilized between the sides of the wedge and the surrounding consolidating soil, vertical equilibrium is satisfied by Equation 1. dvz vz 2Rbz 2Rbzdzvz dz 2Rbz 2zbzdz 0 dz 1 In this expression 2R, is the width of the soil wedge and R is assumed to be equal to the diameter of the pile, b z and dz are the dimensions of a unit of soil within the wedge, τ z is the peak shear strength along the side of the wedge, σ vz is the total vertical stress, and γ is the total unit weight of the soil. The authors then mistakenly define the peak shear strength at the sides of the wedge at a particular elevation according to Equation 2 where k is the at rest earth pressure k 1sin. coefficient estimated using Jaky s formula, ' c' k u tan ' 2 z vz 87 F-100
101 Appendix C UPDATED 04 JUN 12 Summaries of selected references The error of multiplying the total vertical stress by the earth pressure coefficient is incorporated into subsequent development of the analytical model. Later in the development, Rao et al. decide to set pore pressure to zero using an rationale that is incorrect on the basis of soil mechanics and the model development. This adjustment does however remedy the improper calculation of horizontal stress acting on the face of the wedge. Any potential user of this method should know to use effective unit weights and drained strength parameters as input. The end result of the expression used to estimate the pressure acting on the pile is given by Equation 3, where x is the distance along the pile axis from the head of the pile, d is the pile diameter and, q s is the applied surcharge due to the embankment. Q Pvx qsd d R x Rqs Px P 2 cos 2 1 exp cos ktan c P Q R R 3 Rao et al. use Equation 4 to resolve the vertical pressure P vx determined using Equation 3 into components acting normal and coincident to the pile axis. Here, f nx is the component of vertical stress acting along the pile axis and q tx is the component which acts normal to the pile. f nx q tx P vx P vx cos sin 4 As shown in Equation 5, the next step in the procedure by Rao et al. is to integrate the pressure acting normal to pile over its length to get the total lateral force. They then divide this force by the pile length to yield a uniformly distributed pressure which induced bending moment. This approach completely disregards the impact of nonuniformly distributed lateral soil pressure on the induced bending moment. Rao et al. also make the assumption that the axial force in the pile has no influence on measured bending moment. w 1 L tx q dx L 5 0 Using the uniform pressure, w, Rao et al. estimate bending moment in the pile by considering two typical support conditions for a free spanning beam. The first condition 88 F-101
102 Appendix C UPDATED 04 JUN 12 Summaries of selected references is for pinned pinned end supports, for which the bending moment along the pile is given by Equation 6, and the second is for fixed fixed end supports given by Equation 7. wx Mx L x 2 6 w 2 2 Mx 6Lx L 6x 12 7 Verification of proposed analytical model using experimental model: An experimental model consisting of a square steel tank with dimensions of 1200mm x 1200mm x 1200mm was constructed to house a square grouping of batter piles with a batter angle of 10 degrees. The model piles consisted of aluminum pipes with a length of 725mm, an outer diameter of 38.1mm, and a wall thickness of 1.5mm. The four piles were fixed to a square top plate and arranged so that a pile extend from each face of the plate. This arrangement is shown in Figure 4 of the paper. To conduct a test, the piles were placed in the empty tank and a 50mm layer of sand was placed to provide drainage. Next, 570mm of clay was placed and tamped moist in 50mm lifts. Above the compacted clay layer, another 100mm of sand was provided for a upper drainage layer. A surcharge was applied to the steel plate fixed to the piles to induce settlement of the compacted clay. At this point, the text and figures are confusing as to whether the steep plate covered the entire sample surface or just the 200mm x 200mm plate shown in Figure 4. The model piles were instrumented using strain gauges to measure bending moment. The results on tests performed using different surcharge loads are shown in Figures 6 and 7 of the paper. The authors use this information to assess their proposed model. First they calculated the pressure acting normal to the pile axis using Equation 3. After integrating the soil pressures over the length of the pile and determining an equivalent uniform distributed pressure, the authors estimated bending moments using the beam support conditions given in Equations 6 and 7. They concluded that the bending moment distribution estimated assuming the fixed fixed end supports more closely matched the experimental results. 89 F-102
103 Appendix C UPDATED 04 JUN 12 Summaries of selected references Reference Hance, J., and Stremlau, T. (2009). "Lateral load on piles subjected to downdrag." Internal document, Eustis Engineering, Metairie, Louisiana. Summary of Method: This approach considers that the pile is loaded by downdrag above the neutral plane and that the distribution of the force acting normal to the pile axis can be approximated by a triangular distribution. The magnitude of downdrag force is determined by treating the batter pile as a vertical pile and estimating the static capacity of the pile shaft and tip. The neutral plane is estimated using an approach which will be described below. The portion of the ultimate shaft capacity that is above the neutral plane is taken to be the downdrag load. The method estimates bending moment induced in the batter pile by treating the length of pile above the neutral plane as a free spanning elastic beam supported at both ends by pinned connections. The portion of the pile below the neutral plane is neglected in the analysis. Development and implementation of the Method: This method is described below following the example provided in the reference. Calculation errors or questionable assumptions will be pointed out, however for the purposes of maintaining continuity with the reference document, the original values and assumptions will be carried through the procedural steps. 1. Assign the structural loads, pile elevations, and amount of pile batter. For the example: Butt elevation = El 0 Tip elevation = El 110 Pile batter (θ) = 2V:1H or o from vertical For the elevations provided the required length of the batter pile, L, would be EL EL L cos ft The length used in the calculation is L = 110 ft, which does not account for the pile batter. The structural loads considered in the example problem range from 53 to 103 kips. 90 F-103
104 Appendix C UPDATED 04 JUN 12 Summaries of selected references 2. Determine the static capacity and ratio of the structural load to the ultimate static capacity The authors consider this ratio to be the factor of safety, but it does not account for the downdrag load. The ultimate static capacity of the 14 H pile was calculated by the authors using a software program. They do not indicate what software was used or the method of estimation. The breakdown of the ultimate pile capacity is given below: Ultimate shaft capacity (L = 110ft) = 279 kips Ultimate tip capacity = 14 kips Combined ultimate capacity = 293 kips The ratio of the structural load to the ultimate load, R L, for the range of structural loads is given below. 293kips RL kips R L 293kips 103kips Determine the neutral plane of the pile. For this step the authors develop their own technique for estimating the location of the neutral plane. The primary assumptions of this approach are given below. i. The neutral plane can be determined relative to the pile axis and does not depend on batter angle ii. The downdrag pressure increases linearly with depth. iii. The pile cross section is assumed to be constant with depth iv. The ultimate tip resistance is assumed to increase as a fraction of the shaft resistance Figure 1 shows the forces acting on a vertical pile subjected to downdrag where P i is the applied load, F D is the total down drag load, F R is the ultimate resisting skin friction, and Q T is the ultimate tip resistance. The unit skin friction between the pile and soil, k, is defined, but the author s do not explain how it is determined. One approach for estimate the unit skin friction given by Equation 1, ' is the effective unit weight of the surrounding soil, USR is the Undrained Strength Ratio of the clay, and α is a coefficient relating undrained strength to shaft resistance. For an increment of length along the pile, dx, the shaft friction, f s, is given by Equation 2, where s is the surface area of the pile over the length increment. 91 F-104
105 Appendix C UPDATED 04 JUN 12 Summaries of selected references X Figure 7: Forces acting on vertical pile subjected to downdrag 'USR k 1 s f x kxsdx 2 For a pile with a constant cross sectional area, the ultimate shaft friction over the entire length of the pile is given by Equation 3. 2 ksl FS 3 2 The authors assume that the ultimate tip resistance can be expressed as a fraction, n, of the ultimate shaft capacity calculated in Equation 3. Such a relationship is given in Equation 4. 2 nksl QT 4 2 Typically, static capacity analyses determine ultimate tip resistance as QT qtat, where q t in the unit tip resistance and A T is the area enclosed by the outer edges of the pile tip. For piles in cohesive soils, the unit tip resistance depends on the ultimate 92 F-105
106 Appendix C UPDATED 04 JUN 12 Summaries of selected references bearing capacity of the clay and can be estimated by Equation 5, where S u is the undrained strength of the clay. Q 9S A 5 T u T For clays with a constant USR, Equation 5 can be modified to Equation 6. QT 9 USR L ' AT 6 The assumption that the ultimate tip resistance can be expressed as a fixed ratio of the shaft resistance is unreasonable. Combining Equations 1, 3, 4, and 6 into Equation 7 shows that the ratio between tip capacity and shaft capacity cannot be expressed independently of pile length. Q F T s sl n 7 18A T Using the proposed method, the ultimate capacity of the pile, F U, is equal to the sum of the shaft resistance and the tip resistance. The combination of Equations 3 and 4 yields the ultimate pile capacity given by Equation 8. F U 2 ksl 1 n 8 2 The applied structural load, P i, can be expressed using the ratio R L according to Equation 9. The authors do not point out that the ratio, R L, is determined for a specific pile length if the applied load is known. P i 2 1 nksl 9 2R L The down drag force, F d, and the ultimate shaft resistance below the neutral plane is given by Equations 10 and 11. In Equation 10, the authors chose to divide the negative shaft resistance by a constant,c. They do not provide guidance on the values to use for the constant and they use a value of unity in the example problem. F D 2 ks X 10 2c ks FR L X F-106
107 Appendix C UPDATED 04 JUN 12 Summaries of selected references The determination of the neutral plane is accomplished by summing the forces acting along the axis of the vertical pile according to Equation 12. Pi FD FR QT 12 Using their assumptions, the authors express the ratio of the distance along the pile to the neutral plane to the pile length by Equation 13. X RL 1 c 1n L R L c 1 13 The authors assert that Equation expresses the neutral plane as a non dimensional fraction of pile length, however the ratio is only valid for the pile length at which n and R L were evaluated. 4. Set up free spanning elastic beam problem Using the software evaluation performed in Step 2, the authors determine the ultimate shaft capacity at the elevation of the neutral plane estimated in Step 3. They consider this value of shaft resistance to be the downdrag load, F. Different notation is used since this value of downdrag force is evaluated differently than the down drag force used in Step 3 to estimate the neutral plane. The authors then take the value of downdrag force determined using the software and subtract it from the shaft capacity over the entire length of the pile to determine the shaft resistance, F. Next, they evaluate downdrag force again by taking the combined resistances of the shaft and tip and subtract the applied load. This process is expressed below. * D * R F F F 14 * * R S D F F Q P 15 ** * D R T i After the down drag force is determined according to Equation 15, the authors find the component that would act perpendicular to the axis of a batter pile. This force has a value of 102 kips in the example problem. There are mathematical errors in the use of trigonometry to find the perpendicular component of down drag load. First, they divide the value of down drag force by the pile batter expressed as a ratio of vertical run to horizontal run. In the example problem, this batter ratio is 1H:2V, so the downdrag force is divided by 2. This gives the downdrag force acting in the horizontal direction. Next the authors find how much of the horizontal downdrag force acts perpendicular to the pile, F D,orth. To do this they multiply the value by the cosine of the batter angle. For the 94 F-107
108 Appendix C UPDATED 04 JUN 12 Summaries of selected references example problem, this translates to multiplying the vertical downdrag force by 0.5 and then again by 0.89 to yield a force of 55 kips, which is equivalent to multiplying the vertical force by the sine of the batter angle. The final step to this process is to convert the force into a triangular distributed pressure according to Equation 16. w 2F Dorth, 16 X For the example problem triangular distributed load is found as shown below. w 255kips 1.5kips ft 72.6ft 5. Solve free spanning elastic beam problem The authors determine the maximum bending moment in the pile by treating the portion of the pile above the neutral plane as a free spanning beam with pinned end connections. The soil pressure, W, acting perpendicular to the pile axis is considered to act as a triangular pressure distribution according to Equation 16. The maximum bending moment of a beam subjected to the loading and support scenario shown in Figure 2 can be determined according to Equation. X 2 wl Mmax This equation was checked against published sources and found to be correct. For the example problem the maximum bending moment was determined to be 508 kip ft/ft as shown below. 95 F-108
109 Appendix C UPDATED 04 JUN 12 Summaries of selected references M max ft 2 1.5kips ft kip-ft 9 3 ft Determining the maximum bending moment in this way assumes the following: i. There is no contact between the pile and the underlying soil above the neutral plane ii. The bending moment at the top of the pile and at the neutral plane is zero. iii. The distribution of downdrag force can be approximated by a triangular distribution 96 F-109
110 Appendix C UPDATED 04 JUN 12 Summaries of selected references Reference: Stremlau, T., and Hance, J. (2009). "Lateral loads on piles." Internal document, Eustis Engineering, Metairie, Louisiana. Overview: This approach uses the commercial software LPILE (Ensoft) to estimate the bending moments induced above the neutral plane in batter piles subject to downdrag force. The procedure requires determination of the vertical settlement resulting from fill placement. The authors used Settle 3D (RocScience) for their calculations which are for the Sellars Canal (WBV 74). The relative vertical settlement between the soil and the pile is determined by subtracting a magnitude of vertical pile displacement. In the example problem, the value of vertical pile displacement is 1.9 inches. It is not clear how this value was determined but the method assumes that the entire length of the pile displaces vertically by the same amount. The component of relative vertical settlement which acts perpendicular to the pile axis is determined by multiplying the relative settlement magnitude by the sine of the batter inclination from vertical. The component of relative settlement normal to the pile axis is used as the displacement magnitude, y, on p y curves developed in LPILE for several positions along the length of the pile. The soil pressures corresponding to the displacements are determined for the portion of the pile above the neutral plane and plotted as shown in Figure 1. From the available information, it appears that the neutral plane is determined using the approach proposed by Hance and Stremlau (2009). 97 F-110
111 Appendix C UPDATED 04 JUN 12 Summaries of selected references Soil Pressure, P kips/ft Batter Pile 1 Figure 8: Distribution of soil pressure above the neutral plane A plot like the one shown in Figure 1 is used to express the distribution of soil pressures acting normal to the axis of the batter pile. The reference explaining this approach does not carry the procedure through to the point of calculating bending moment. From the available information, it appears that the pile length above the neutral plane is treated as an elastic beam with pinned end supports. The bending moments are calculated by applying the pressure distribution determined using the p y curves from LPILE to the elastic beam representing the pile. 98 F-111
112 Appendix Overview and impressions of existing methods to estimate downdrag induced bending moments 99 F-112
113 Appendix Summary of experimental studies and available data Reference Shibata et al. (1982) Takahashi (1985) Type of study Laboratory model Laboratory model Description of Piles A 3x2 group of piles composed of steel pipe having an outer diameter of 6.0cm, wall thickness of 1.2mm, and a length of 60cm were installed in the apparatus at a batter angle of 15 degree from vertical. Vertical sections were welded on the tops of the battered portion of the piles. Three series of tests were performed, one of which used a bitumen coating on the piles. Test series were also performed on single vertical piles and vertical pile groups. Piles consisted of rectangular plates measuring 1780mm long, 75mm wide, and 9mm thick. Four pairs of pile were installed with Description of Foundation soil A slurry of kaolin was poured around the pile group. The kaolin had a LL = 52, a PL = 39, a clay fraction of 39%, and a specific gravity of A 10cm thick sand drainage layer was provided at the base of the sample tank. The kaolin slurry was allowed to consolidate under its own weight prior to application of a surcharge pressure. A remolded fully saturated clay sample was formed in the apparatus prior to pile installation. The clay had a LL=89.8, a PL=35.2, and a specific gravity of Description of embankment / foundation loading A vinyl plastic sheet placed over the top of the clay slurry and pile tops was used to create a seal that allowed a surcharge pressure to be applied using air pressure. Tests were performed at surcharge pressures of 20, 40, and 60 kpa. The clay was subjected to a consolidation pressure of 10kN/m 2 using 220mm of steel shot placed over an upper drainage layer of sand. Results Results for the battered pile groups include plots of downdrag pressure versus time for the various surcharge pressures used. Also plots of bending moment versus depth along the pile are provided in Figure 14 of the paper. Plots of bending moment at various positions along the pile versus consolidation pressure are provided in Figure 15 of the paper. Results include six plots of max bending moment for all batter angles, the distribution of 100 F-113
114 Appendix Summary of experimental studies and available data Reference Takahashi (1985) Takahashi (1985), Sato et. al (1987), and Sawaguchi (1989) Type of study Numerical model (3D) represents the laboratory tests Field study Description of Piles hinged tops at batter angles of 5, 10, 15, and 20 degrees from vertical. Piles are pinned at the base of the clay using hinges. Piles treated as 3D elastic beam elements, likely with steel properties. Batter angles of 10 and 20 degrees were considered. Springs, presumably linear, are considered between the pile and the surrounding soil. A 2x2 group of steel pile piles (φ508xt9xl38700mm) were installed through the test embankment at a batter angle of 15 degrees. The arrangement of the pile is not provided. Two of the piles were coated with Description of Foundation soil Figure 6 in the paper shows a profile of the saturated unit weight and unconfined compressive strength measured after the test. Coefficient of compressibility, m v, is stated as 15m 2 /MN Clay is modeled as an elastic material with a Young s modulus of 44kN/m 2 and a Poisson's ratio of The foundation soil consisted of a 30m deposit of clayey soil containing shell fragments. Piles were terminated in a stiff clay containing gravel and having an N value of 20. A profile of moisture content, total unit weight, and unconfined compressive Description of embankment / foundation loading Steel and upper sand layer applied as pressures in the model. No additional details are provided about loading. A 2.5m high embankment with plan dimensions of 40m x 25m. Consolidation of the clay soil was monitored for one year Results bending moment for two pile inclinations, and a plot of maximum bending moment versus ground settlement magnitude. Figure 15 of the paper shows the predicted distribution of bending moment for a batter angle of 20 degrees. Figures 20 through 24 in Takahashi (1985) detail ground settlements and the distribution of axial force, bending moment, and elastic compression 101 F-114
115 Appendix Summary of experimental studies and available data Reference Rao et al. (1994) Veeresh (1996) as reported in Rajashree and Sitharam (2001) Type of study Laboratory model Laboratory model Description of Piles bitumen. The tops of the piles were hinged and extended above the ground surface. Pile settlements are provided in Table 2 in the paper. The model consisted of a square grouping of piles set at a batter angle of 10 degrees and fixed at the top using steel plate. The piles were made from aluminum tubing having a diameter of 38.1mm, a thickness of 1.5mm, and measuring 725mm in length. Isolated steel piles with a diameter of 19mm, a wall thickness of 2.1mm, and a length of 620mm were installed in soft clay. The top of the piles were left free. The following batter angles were considered: 0, +10, +30, 10, and 30 Description of Foundation soil strength is provided in Figure 19 of the paper by Takahashi (1985). The piles were installed in an empty tank and 570mm of saturated clay was placed and tamped around the pile group. The clay had a LL=53, a PL=19, G s =2.66, w=49%, unit weight of 17.2kN/m 3, and a vane shear strength of 60kN/m 2. Sand drainage layers 50 and 100mm thick were placed above and below the clay layer, respectively. The soft clay used in the model was stated to have a liquid limit of 82% and a plastic limit of 2% which falls outside the limits of known soils. The clay was also has a water content of 50%, a unit weight of 17.2 kn/m 3, an undrained Description of embankment / foundation loading Loading of the clay was performed by placing weights on top of a steel plate at the top of the sand surface. It is not clear in the paper whether this is the same plate the piles are tied to. Two surcharge pressures were used in the study. Lateral loads were applied to the free ends of the piles at the ground surface elevation in 24N increments up to 120N. A cyclic load analysis was also included in this study. Results observed in the piles. The results include plots of settlement versus time and distribution of bending moment for the two surcharge loads. The paper includes plots of lateral deflection against applied load and against depth at a load of 120N. Plots of the distribution of bending moment are also 102 F-115
116 Appendix Summary of experimental studies and available data Reference Navin (2009) Baseline T Wall model for St. Bernard Parish Type of study Numerical model Description of Piles degrees. A 2D FLAC model considers three battered H piles (two on protected side) and a sheet pile. Battered piles are HP14x89 and the sheet pile is PZ 22. The tip elevation for the H piles is El 130 and EL 45 for the sheet pile. The spacing between H piles perpendicular to the centerline of the wall is 6 ft. The batter angle of the H piles is 3V:1H. The tops of the piles are pinned and are embedded 0.75ft into the T Wall concrete to provide some moment capacity. 3D soil pile interaction is represented using springslider elements between the piles and the soil in both normal and shear directions. Description of Foundation soil strength of 7.5kPa, and a modulus of 415 kpa. Soil properties for drained and undrained stages of the analysis are given in Tables 1 through 4 of the reference document. Description of embankment / foundation loading The existing foundation soils are brought into equilibrium with gravity under drained conditions. The water table is established and the model is analyzed again. The piling is installed and the model is analyzed again. The embankment is placed (H=20 ft max, El +20) and the model is analyzed again. Soil properties are changed to reflect undrained conditions and the model is analyzed at increments of flooding ranging from 1.5 to 9 ft. provided. Results Profiles of shear load, axial load, moment, lateral displacement, and strain along the batter piles are provided. 103 F-116
117 Appendix Summary of experimental studies and available data Reference Navin (2009) T Wall model to assess settlement Type of study Numerical model Description of Piles The model considers one batter pile on the protected side and one on the flood side with a sheet pile separating the two. Battered piles are HP14x89 and the sheet pile is PZ 22. The spacing between H piles perpendicular to the centerline of the wall is not provided in the reference document. The batter angle of the H piles was scaled from Figure 3 in the report to be 1H:3V. Description of Foundation soil The same soil properties used in the baseline analysis for St. Bernard Parish are presumably used in this analysis. Description of embankment / foundation loading The loading conditions modeled in the baseline analysis for St. Bernard Parish was followed up to the point of flood load, where instead of incremental flood loads, a vertical line load of 13.3 kpf was applied to the wall under drained conditions Results Horizontal profiles of vertical changes in stress are provided at various elevations over the length of the piles. 104 F-117
118 Appendix Summary of experimental studies and available data Digitized Bending Moment Distributions Shibata et al. (1982) Surcharge Pressure = 20kPa Bitumen coated piles (RED) Y X Axial Length Bending Moment m N m Surcharge Pressure = 40kPa Bitumen coated piles (RED) Y X Axial Length Bending Moment m N m Uncoated piles (1) (GREEN) Y X Axial Length Bending Moment m N m Uncoated piles (1) (GREEN) Y X Axial Length Bending Moment m N m Uncoated piles (2) (BLUE) Y X Axial Length Bending Moment m N m Uncoated piles (2) (BLUE) Y X Axial Length Bending Moment m N m F-118
119 Appendix Summary of experimental studies and available data Surcharge Pressure= 60kPa Bitumen coated piles (RED) Y X Axial Length Bending Moment m N m Uncoated piles (1) (GREEN) Y X Axial Length Bending Moment m N m Plots of Moment Distribution F-119
120 Appendix Summary of experimental studies and available data Takahashi (1985) Experimental bending moment distributions after 1, 4, and 14 weeks of consolidation for batter angle of 20 degrees 1 Week Y X Axial Length Bending Moment cm N m Weeks Y X Axial Length Bending Moment cm N m Weeks Y X Axial Length Bending Moment cm N m F-120


121 Appendix Summary of experimental studies and available data Plots of moment distribution F-121
122 Appendix Summary of experimental studies and available data Experimental bending moment distributions after 14 weeks of consolidation for batter angle of 10 degrees 14 Weeks Y X Axial Length Bending Moment cm N m F-122
123 Appendix Summary of experimental studies and available data Field scale study bending moment distributions after 55, 119,264, and 364 days of consolidation for batter angle of 15 degrees Y Axial Length 55 days X Bending Moment m kn m days Y X Axial Length Bending Moment m kn m days Y X Axial Length Bending Moment m kn m days Y X Axial Length Bending Moment m kn m F-123


124 Appendix Summary of experimental studies and available data Plots of moment distribution F-124
CHAPTER 8 CALCULATION THEORY
 CHAPTER 8 CALCULATION THEORY. Volume 2 CHAPTER 8 CALCULATION THEORY Detailed in this chapter: the theories behind the program the equations and methods that are use to perform the analyses. CONTENTS CHAPTER
INTRODUCTION TO STATIC ANALYSIS PDPI 2013
 INTRODUCTION TO STATIC ANALYSIS PDPI 2013 What is Pile Capacity? When we load a pile until IT Fails what is IT Strength Considerations Two Failure Modes 1. Pile structural failure controlled by allowable
CHAPTER 8 ANALYSES OF THE LATERAL LOAD TESTS AT THE ROUTE 351 BRIDGE
 CHAPTER ANALYSES OF THE LATERAL LOAD TESTS AT THE ROUTE 351 BRIDGE.1 INTRODUCTION An important objective of this research is to determine whether accurate analyses of the lateral load-deflection behavior
WIND TUNNEL TESTING GEOTECHNICAL STUDY
 WIND TUNNEL TESTING Wind tunnel testing was conducted by the Boundary Layer Wind Tunnel Laboratory (BLWTL) at the University of Western Ontario (UWO) to develop wind load time histories for the chimney.
EVALUATION OF BENDING LOAD IN BATTER PILES SET IN SOFT CLAY
 EVALUATION OF BENDING LOAD IN BATTER PILES SET IN SOFT CLAY Tetsuya KOHNO 1, Hiroyuki TANAKA 2, Masahiro SHIRATO 3 and Shoichi NAKATANI 4 Abstract In this study, we conducted centrifuge tests to evaluate
Chapter (11) Pile Foundations
 Pile Foundations") Chapter (11) Introduction Piles are structural members that are made of steel, concrete, or timber. They are used to build pile foundations (classified as deep foundations) which cost more than shallow
Chapter (11) Introduction Piles are structural members that are made of steel, concrete, or timber. They are used to build pile foundations (classified as deep foundations) which cost more than shallow
Evaluation of dynamic behavior of culverts and embankments through centrifuge model tests and a numerical analysis
 Computer Methods and Recent Advances in Geomechanics Oka, Murakami, Uzuoka & Kimoto (Eds.) 2015 Taylor & Francis Group, London, ISBN 978-1-138-00148-0 Evaluation of dynamic behavior of culverts and embankments
Engineeringmanuals. Part2
 Engineeringmanuals Part2 Engineering manuals for GEO5 programs Part 2 Chapter 1-12, refer to Engineering Manual Part 1 Chapter 13. Pile Foundations Introduction... 2 Chapter 14. Analysis of vertical load-bearing
Analysis of Pile Foundation Subjected to Lateral and Vertical Loads
 Analysis of Pile Foundation Subjected to Lateral and Vertical Loads Thadapaneni Kanakeswararao 1, B.Ganesh 2 1,2 Department of soil mechanics and foundation engg, Lenora college of Engineering and technology,
Guidelines on Foundation Loading and Deformation Due to Liquefaction Induced Lateral Spreading
 Guidelines on Foundation Loading and Deformation Due to Liquefaction Induced Lateral Spreading February, 2011 1 INTRODUCTION Past earthquakes offer many examples of bridges that either collapsed or incurred
FINITE ELEMENT ANALYSIS OF ARKANSAS TEST SERIES PILE #2 USING OPENSEES (WITH LPILE COMPARISON)
") FINITE ELEMENT ANALYSIS OF ARKANSAS TEST SERIES PILE #2 USING OPENSEES (WITH LPILE COMPARISON) Ahmed Elgamal and Jinchi Lu October 07 Introduction In this study, we conduct a finite element simulation
FINITE ELEMENT ANALYSIS OF ARKANSAS TEST SERIES PILE #2 USING OPENSEES (WITH LPILE COMPARISON) Ahmed Elgamal and Jinchi Lu October 07 Introduction In this study, we conduct a finite element simulation
STUDY OF THE BEHAVIOR OF PILE GROUPS IN LIQUEFIED SOILS
 STUDY OF THE BEHAVIOR OF PILE GROUPS IN LIQUEFIED SOILS Shin-Tower Wang 1, Luis Vasquez 2, and Lymon C. Reese 3, Honorary Member,, ASCE ABSTRACT : 1&2 President & Project Manager, Ensoft, Inc. Email: ensoft@ensoftinc.com
Lesson 25. Static Pile Load Testing, O-cell, and Statnamic. Reference Manual Chapter 18
 Lesson 25 Static Pile Load Testing, O-cell, and Statnamic Reference Manual Chapter 18 STATIC LOAD TESTING Most accurate method to determine static pile capacity Perform at design or construction stage
A COMPARISON OF PREDICTED BRACE LOADS IN TEMPORARY RETAINING STRUCTURES AND OBSERVED BRACE LOADS IN TWO FULL SCALE TEST SECTIONS.
 A COMPARISON OF PREDICTED BRACE LOADS IN TEMPORARY RETAINING STRUCTURES AND OBSERVED BRACE LOADS IN TWO FULL SCALE TEST SECTIONS A Thesis Submitted to the Graduate Faculty of the University of New Orleans
Chapter (5) Allowable Bearing Capacity and Settlement
 Allowable Bearing Capacity and Settlement") Chapter (5) Allowable Bearing Capacity and Settlement Introduction As we discussed previously in Chapter 3, foundations should be designed for both shear failure and allowable settlement. So the allowable
Chapter (5) Allowable Bearing Capacity and Settlement Introduction As we discussed previously in Chapter 3, foundations should be designed for both shear failure and allowable settlement. So the allowable
MODULE C: COMPRESSION MEMBERS
 MODULE C: COMPRESSION MEMBERS This module of CIE 428 covers the following subjects Column theory Column design per AISC Effective length Torsional and flexural-torsional buckling Built-up members READING:
Report No. K-TRAN: KU-10-2 FINAL REPORT November 2013
 Report No. K-TRAN: KU-10-2 FINAL REPORT November 2013 Capacity of Scour-Damaged Bridges, Part 2: Integrated Analysis Program (IAP) A Program for the Analysis of Lateral Performance of Pile-Supported Structures
EN Eurocode 7. Section 3 Geotechnical Data Section 6 Spread Foundations. Trevor L.L. Orr Trinity College Dublin Ireland.
 EN 1997 1: Sections 3 and 6 Your logo Brussels, 18-20 February 2008 Dissemination of information workshop 1 EN 1997-1 Eurocode 7 Section 3 Geotechnical Data Section 6 Spread Foundations Trevor L.L. Orr
DRAFT ONONDAGA LAKE CAPPING AND DREDGE AREA AND DEPTH INITIAL DESIGN SUBMITTAL H.4 SEISMIC SLOPE STABILITY ANALYSES
 DRAFT ONONDAGA LAKE CAPPING AND DREDGE AREA AND DEPTH INITIAL DESIGN SUBMITTAL H.4 SEISMIC SLOPE STABILITY ANALYSES Parsons P:\Honeywell -SYR\444576 2008 Capping\09 Reports\9.3 December 2009_Capping and
HURRICANE SANDY LIMITED REEVALUATION REPORT UNION BEACH, NEW JERSEY DRAFT ENGINEERING APPENDIX SUB APPENDIX A PRELIMINARY FLOODWALL DESIGN
 HURRICANE SANDY LIMITED REEVALUATION REPORT UNION BEACH, NEW JERSEY DRAFT ENGINEERING APPENDIX SUB APPENDIX A PRELIMINARY FLOODWALL DESIGN March 2014Revised March 2015 UNITED STATES ARMY CORPS OF ENGINEERS
Nonlinear pushover analysis for pile foundations
 Proc. 18 th NZGS Geotechnical Symposium on Soil-Structure Interaction. Ed. CY Chin, Auckland Michael Pender Department of Civil and Environmental Engineering, University of Auckland Keywords: piles, lateral
Deep Foundations 2. Load Capacity of a Single Pile
 Deep Foundations 2 Load Capacity of a Single Pile All calculations of pile capacity are approximate because it is almost impossible to account for the variability of soil types and the differences in the
Landslide FE Stability Analysis
 Landslide FE Stability Analysis L. Kellezi Dept. of Geotechnical Engineering, GEO-Danish Geotechnical Institute, Denmark S. Allkja Altea & Geostudio 2000, Albania P. B. Hansen Dept. of Geotechnical Engineering,
OP-13. PROCEDURES FOR DESIGN OF EMBANKMENT
 Page 1 of 8 WORK INSTRUCTIONS FOR ENGINEERS TYC Compiled by : LSS Checked by : GSS Approved by : OP-13. PROCEDURES FOR DESIGN OF EMBANKMENT Page of 8 13.0 13.1. OVERALL PROCEDURES This section will briefly
COEFFICIENT OF DYNAMIC HORIZONTAL SUBGRADE REACTION OF PILE FOUNDATIONS ON PROBLEMATIC GROUND IN HOKKAIDO Hirofumi Fukushima 1
 COEFFICIENT OF DYNAMIC HORIZONTAL SUBGRADE REACTION OF PILE FOUNDATIONS ON PROBLEMATIC GROUND IN HOKKAIDO Hirofumi Fukushima 1 Abstract In this study, static loading tests and dynamic shaking tests of
Analysis of the horizontal bearing capacity of a single pile
 Engineering manual No. 16 Updated: 07/2018 Analysis of the horizontal bearing capacity of a single pile Program: Soubor: Pile Demo_manual_16.gpi The objective of this engineering manual is to explain how
APPENDIX F CORRELATION EQUATIONS. F 1 In-Situ Tests
 APPENDIX F 1 APPENDIX F CORRELATION EQUATIONS F 1 In-Situ Tests 1. SPT (1) Sand (Hatanaka and Uchida, 1996), = effective vertical stress = effective friction angle = atmosphere pressure (Shmertmann, 1975)
Lecture 7. Pile Analysis
 Lecture 7 14.5 Release Pile Analysis 2012 ANSYS, Inc. February 9, 2013 1 Release 14.5 Pile definition in Mechanical - There are a number of methods that can be used to analyze piled foundations in ANSYS
D1. A normally consolidated clay has the following void ratio e versus effective stress σ relationship obtained in an oedometer test.
 (d) COMPRESSIBILITY AND CONSOLIDATION D1. A normally consolidated clay has the following void ratio e versus effective stress σ relationship obtained in an oedometer test. (a) Plot the e - σ curve. (b)
Dynamic Response of EPS Blocks /soil Sandwiched Wall/embankment
 Proc. of Second China-Japan Joint Symposium on Recent Development of Theory and Practice in Geotechnology, Hong Kong, China Dynamic Response of EPS Blocks /soil Sandwiched Wall/embankment J. C. Chai 1
S Wang Beca Consultants, Wellington, NZ (formerly University of Auckland, NZ)
") Wang, S. & Orense, R.P. (2013) Proc. 19 th NZGS Geotechnical Symposium. Ed. CY Chin, Queenstown S Wang Beca Consultants, Wellington, NZ (formerly University of Auckland, NZ) Jackson.wang@beca.com R P Orense
Wang, S. & Orense, R.P. (2013) Proc. 19 th NZGS Geotechnical Symposium. Ed. CY Chin, Queenstown S Wang Beca Consultants, Wellington, NZ (formerly University of Auckland, NZ) Jackson.wang@beca.com R P Orense
INTI COLLEGE MALAYSIA
 EGC373 (F) / Page 1 of 5 INTI COLLEGE MALAYSIA UK DEGREE TRANSFER PROGRAMME INTI ADELAIDE TRANSFER PROGRAMME EGC 373: FOUNDATION ENGINEERING FINAL EXAMINATION : AUGUST 00 SESSION This paper consists of
Multi Linear Elastic and Plastic Link in SAP2000
 26/01/2016 Marco Donà Multi Linear Elastic and Plastic Link in SAP2000 1 General principles Link object connects two joints, i and j, separated by length L, such that specialized structural behaviour may
A design Model for Pile Walls Used to Stabilize Landslides
 WV DOH RP #121 Experimental and Analytical Behavior of Slide Suppressors Embedded in Bedrock A design Model for Pile Walls Used to Stabilize Landslides By: Tia Maria Richardson, P.E. Principal Investigator
EXAMPLE OF PILED FOUNDATIONS
 EXAMPLE OF PILED FOUNDATIONS The example developed below is intended to illustrate the various steps involved in the determination of the seismic forces developed in piles during earthquake shaking. The
Evaluation of short piles bearing capacity subjected to lateral loading in sandy soil
 Evaluation of short piles bearing capacity subjected to lateral loading in sandy soil [Jafar Bolouri Bazaz, Javad Keshavarz] Abstract Almost all types of piles are subjected to lateral loads. In many cases,
Finite Element analysis of Laterally Loaded Piles on Sloping Ground
 Indian Geotechnical Journal, 41(3), 2011, 155-161 Technical Note Finite Element analysis of Laterally Loaded Piles on Sloping Ground K. Muthukkumaran 1 and N. Almas Begum 2 Key words Lateral load, finite
Analysis of Load-Settlement Relationship for Unpaved Road Reinforced with Geogrid
 ISGSR7 First International Symposium on Geotechnical Safety & Risk Oct. 8~9, 7 Shanghai Tongji University, China Analysis of Load-Settlement Relationship for Unpaved Road Reinforced with Geogrid Y. C.
H.1 SUMMARY OF SUBSURFACE STRATIGRAPHY AND MATERIAL PROPERTIES (DATA PACKAGE)
") DRAFT ONONDAGA LAKE CAPPING AND DREDGE AREA AND DEPTH INITIAL DESIGN SUBMITTAL H.1 SUMMARY OF SUBSURFACE STRATIGRAPHY AND MATERIAL PROPERTIES (DATA PACKAGE) Parsons P:\Honeywell -SYR\444576 2008 Capping\09
DRAFT ONONDAGA LAKE CAPPING AND DREDGE AREA AND DEPTH INITIAL DESIGN SUBMITTAL H.1 SUMMARY OF SUBSURFACE STRATIGRAPHY AND MATERIAL PROPERTIES (DATA PACKAGE) Parsons P:\Honeywell -SYR\444576 2008 Capping\09
Hyperbolic Soil Bearing Capacity
 1 Introduction Hyperbolic Soil Bearing Capacity This example involves analyzing the bearing capacity of a round footing. The example is useful for illustrating several SIGMA/W features and procedures,
ANALYSIS OF LATERALLY LOADED FIXED HEADED SINGLE FLOATING PILE IN MULTILAYERED SOIL USING BEF APPROACH
 INDIAN GEOTECHNICAL SOCIETY, KOLKATA CHAPTER GEOTECHNICS FOR INFRASTRUCTURE DEVELOPMENT KOLKATA 11 th 12 th March 2016, Kolkata, West Bengal, India ANALYSIS OF LATERALLY LOADED FIXED HEADED SINGLE FLOATING
Gapping effects on the lateral stiffness of piles in cohesive soil
 Gapping effects on the lateral stiffness of piles in cohesive soil Satyawan Pranjoto Engineering Geology, Auckland, New Zealand. M. J. Pender Department of Civil and Environmental Engineering, University
Earth Pressure Theory
 Lateral Earth Pressure Page 1 Earth Pressure Theory Examples of Retaining Walls Lateral Earth Pressure Page 2 At-Rest, Active and Passive Earth Pressure Wednesday, August 17, 2011 12:45 PM At-rest condition
Chapter 12: Lateral Earth Pressure
 Part 4: Lateral Earth Pressure and Earth-Retaining Structures Chapter 12: Lateral Earth Pressure Introduction Vertical or near-vertical slopes of soil are supported by retaining walls, cantilever sheetpile
Fil Failure Analysis of fthe Breached Levee System at the 17th Street Canal, New Orleans
 Fil Failure Analysis of fthe Breached hd Levee System at the 17th Street Canal, New Orleans Jay Wang, Ph.D., P.E. Department of Civil Engineering and Construction Engineering Technology Louisiana Tech
Simplified Base Isolation Design Procedure. Gordon Wray, P.E.
 Simplified Base Isolation Design Procedure Gordon Wray, P.E. SEAONC Protective Systems Subcommittee Objectives > Current Unique Code Requirements More sophisticated engineering analysis Geotechnical need
FLAC3D analysis on soil moving through piles
 University of Wollongong Research Online Faculty of Engineering - Papers (Archive) Faculty of Engineering and Information Sciences 211 FLAC3D analysis on soil moving through piles E H. Ghee Griffith University
Lateral Strength and Stiffness of Post and Pier Foundations
 An ASABE Meeting Presentation Paper Number: 152190408 Lateral Strength and Stiffness of Post and Pier Foundations David Roy Bohnhoff Professor, Biological Systems Engineering Department University of Wisconsin-Madison,
TIME-DEPENDENT BEHAVIOR OF PILE UNDER LATERAL LOAD USING THE BOUNDING SURFACE MODEL
 TIME-DEPENDENT BEHAVIOR OF PILE UNDER LATERAL LOAD USING THE BOUNDING SURFACE MODEL Qassun S. Mohammed Shafiqu and Maarib M. Ahmed Al-Sammaraey Department of Civil Engineering, Nahrain University, Iraq
Reciprocal of the initial shear stiffness of the interface K si under initial loading; reciprocal of the initial tangent modulus E i of the soil
 Appendix F Notation a b B C c C k C N C s C u C wt C θ D r D 1 D 2 D 10 D 30 Reciprocal of the initial shear stiffness of the interface K si under initial loading; reciprocal of the initial tangent modulus
NEW DOWN-HOLE PENETROMETER (DHP-CIGMAT) FOR CONSTRUCTION APPLICATIONS
 FOR CONSTRUCTION APPLICATIONS") NEW DOWN-HOLE PENETROMETER (DHP-CIGMAT) FOR CONSTRUCTION APPLICATIONS 1 2 C. Vipulanandan 1, Ph.D., M. ASCE and Omer F. Usluogullari 2 Chairman, Professor, Director of Center for Innovative Grouting Materials
NEW DOWN-HOLE PENETROMETER (DHP-CIGMAT) FOR CONSTRUCTION APPLICATIONS 1 2 C. Vipulanandan 1, Ph.D., M. ASCE and Omer F. Usluogullari 2 Chairman, Professor, Director of Center for Innovative Grouting Materials
Theory of Shear Strength
 SKAA 1713 SOIL MECHANICS Theory of Shear Strength Prepared by, Dr. Hetty 1 SOIL STRENGTH DEFINITION Shear strength of a soil is the maximum internal resistance to applied shearing forces The maximum or
S E C T I O N 1 2 P R O D U C T S E L E C T I O N G U I D E - H E L I C A L S C R E W P I L E F O U N D A T I O N S
 1. P R O D U C T S E L E C T I O N G U I D E - H E L I C A L S C R E W P I L E F O U N D A T I O N S Helical foundation pile includes a lead and extension(s). The lead section is made of a central steel
SHEET PILE WALLS. Mehdi Mokhberi Islamic Azad University
 SHEET PILE WALLS Mehdi Mokhberi Islamic Azad University Lateral Support In geotechnical engineering, it is often necessary to prevent lateral soil movements. Tie rod Anchor Sheet pile Cantilever retaining
2D Liquefaction Analysis for Bridge Abutment
 D Liquefaction Analysis for Bridge Abutment Tutorial by Angel Francisco Martinez Integrated Solver Optimized for the next generation 64-bit platform Finite Element Solutions for Geotechnical Engineering
Chapter (3) Ultimate Bearing Capacity of Shallow Foundations
 Ultimate Bearing Capacity of Shallow Foundations") Chapter (3) Ultimate Bearing Capacity of Shallow Foundations Introduction To perform satisfactorily, shallow foundations must have two main characteristics: 1. They have to be safe against overall shear
Chapter (3) Ultimate Bearing Capacity of Shallow Foundations Introduction To perform satisfactorily, shallow foundations must have two main characteristics: 1. They have to be safe against overall shear
Entrance exam Master Course
 - 1 - Guidelines for completion of test: On each page, fill in your name and your application code Each question has four answers while only one answer is correct. o Marked correct answer means 4 points
Attachment D-7: Rebound and Uplift of the Stilling Basin, Deep Soil Mixing Design
 Attachment D-7: Rebound and Uplift of the Stilling Basin, Deep Soil Mixing Design Attachment D-7: Rebound and Uplift of the Stilling Basin, Deep Soil Mixing Design Fargo Moorhead Metropolitan Area Flood
Reinforced Soil Structures Reinforced Soil Walls. Prof K. Rajagopal Department of Civil Engineering IIT Madras, Chennai
 Geosynthetics and Reinforced Soil Structures Reinforced Soil Walls continued Prof K. Rajagopal Department of Civil Engineering IIT Madras, Chennai e-mail: gopalkr@iitm.ac.inac in Outline of the Lecture
Experimental Investigation of Steel Pipe Pile to Concrete Cap Connections
 Brigham Young University BYU ScholarsArchive All Theses and Dissertations 211-4-19 Experimental Investigation of Steel Pipe Pile to Concrete Cap Connections Ryan S. Eastman Brigham Young University - Provo
Numerical model comparison on deformation behavior of a TSF embankment subjected to earthquake loading
 Numerical model comparison on deformation behavior of a TSF embankment subjected to earthquake loading Jorge Castillo, Yong-Beom Lee Ausenco, USA Aurelian C. Trandafir Fugro GeoConsulting Inc., USA ABSTRACT
Class Principles of Foundation Engineering CEE430/530
 Class Principles of Foundation Engineering CEE430/530 1-1 General Information Lecturer: Scott A. Barnhill, P.E. Lecture Time: Thursday, 7:10 pm to 9:50 pm Classroom: Kaufmann, Room 224 Office Hour: I have
9.13 Fixed Earth-Support Method for Penetration into Sandy Soil
 476 Chapter 9: Sheet Pile Walls 9.13 Fixed Earth-Support Method for Penetration into y Soil When using the fixed earth support method, we assume that the toe of the pile is restrained from rotating, as
On the Dynamics of Inclined Piles
 On the Dynamics of Inclined Piles Amalia Giannakou, National Technical University of Athens, Greece Nikos Gerolymos, National Technical University of Athens, Greece George Gazetas, National Technical University
Ch 4a Stress, Strain and Shearing
 Ch. 4a - Stress, Strain, Shearing Page 1 Ch 4a Stress, Strain and Shearing Reading Assignment Ch. 4a Lecture Notes Sections 4.1-4.3 (Salgado) Other Materials Handout 4 Homework Assignment 3 Problems 4-13,
Piles in Lateral Spreading due to Liquefaction: A Physically Simplified Method Versus Centrifuge Experiments
 "Pile-Group Response to Large Soil Displacements and Liquefaction: Centrifuge Experiments Versus A Physically Simplified Analysis", Journal of Geotechnical and Geoenvironmental Engineering, ASCE, Vol.
OP-023. INTERPRETATION OF INSTRUMENTED TEST PILE RESULT
 INTERPRETATION OF INSTRUMENTED TEST PILE RESULT Page 1 of 9 WORK INSTRUCTIONS FOR ENGINEERS GSJ Compiled by : Checked by KYW : LSS Approved by : OP-23. INTERPRETATION OF INSTRUMENTED TEST PILE RESULT INTERPRETATION
DESIGNING FOR DOWNDRAG ON UNCOATED AND BITUMEN COATED PILES
 DESIGNING FOR DOWNDRAG ON UNCOATED AND BITUMEN COATED PILES Jean-Louis BRIAUD, PhD, PE President of ISSMGE Professor and Holder of the Buchanan Chair Texas A&M University Piling and Deep Foundations Middle
LATERAL STABILITY OF BEAMS WITH ELASTIC END RESTRAINTS
 LATERAL STABILITY OF BEAMS WITH ELASTIC END RESTRAINTS By John J. Zahn, 1 M. ASCE ABSTRACT: In the analysis of the lateral buckling of simply supported beams, the ends are assumed to be rigidly restrained
The Preliminary Study of the Impact of Liquefaction on Water Pipes
 The Preliminary Study of the Impact of Liquefaction on Water Pipes Jerry J. Chen and Y.C. Chou ABSTRACT Damages to the existing tap-water pipes have been found after earthquake. Some of these damages are
TABLE OF CONTENTS CHAPTER TITLE PAGE TITLE PAGE DECLARATION DEDIDATION ACKNOWLEDGEMENTS ABSTRACT ABSTRAK
 TABLE OF CONTENTS CHAPTER TITLE PAGE TITLE PAGE DECLARATION DEDIDATION ACKNOWLEDGEMENTS ABSTRACT ABSTRAK TABLE OF CONTENTS LIST OF TABLE LIST OF FIGURES LIST OF SYMBOLS LIST OF APENDICES i ii iii iv v
BENCHMARK LINEAR FINITE ELEMENT ANALYSIS OF LATERALLY LOADED SINGLE PILE USING OPENSEES & COMPARISON WITH ANALYTICAL SOLUTION
 BENCHMARK LINEAR FINITE ELEMENT ANALYSIS OF LATERALLY LOADED SINGLE PILE USING OPENSEES & COMPARISON WITH ANALYTICAL SOLUTION Ahmed Elgamal and Jinchi Lu October 07 Introduction In this study: I) The response
Project: Cantilever Steel SheetPile Retaining Wall Analysis & Design, Free Earth Support In accordance Eurocode 7.
 App'd by Construction Stages Name Term Objects present in this stage Stage 1 Long Wall 1 (Generated) (Generated) On retained side: Ground 1 (Generated), Borehole 1 (Generated), On excavated side: Excavation
Following are the results of four drained direct shear tests on an overconsolidated clay: Diameter of specimen 50 mm Height of specimen 25 mm
 444 Chapter : Shear Strength of Soil Example. Following are the results of four drained direct shear tests on an overconsolidated clay: Diameter of specimen 50 mm Height of specimen 5 mm Normal Shear force
Verification of the Hyperbolic Soil Model by Triaxial Test Simulations
 1 Introduction Verification of the Hyperbolic Soil Model by Triaxial Test Simulations This example simulates a series of triaxial tests that can be used to verify that the Hyperbolic constitutive model
file:///d /suhasini/suha/office/html2pdf/ _editable/slides/module%202/lecture%206/6.1/1.html[3/9/2012 4:09:25 PM]
![file:///d /suhasini/suha/office/html2pdf/ _editable/slides/module%202/lecture%206/6.1/1.html[3/9/2012 4:09:25 PM]](/thumbs/96/126781421.jpg "file:///d /suhasini/suha/office/html2pdf/ _editable/slides/module%202/lecture%206/6.1/1.html[3/9/2012 4:09:25 PM]") Objectives_template Objectives In this section you will learn the following Introduction Different Theories of Earth Pressure Lateral Earth Pressure For At Rest Condition Movement of the Wall Different
Objectives_template Objectives In this section you will learn the following Introduction Different Theories of Earth Pressure Lateral Earth Pressure For At Rest Condition Movement of the Wall Different
Erratum. Chapter 4 - Earth and water pressure 26. Chapter Area loads. q a. c+d ϕ'/2. Piling Handbook, 9th edition (2016)
") Chapter 4 - Earth and water pressure 26 Chapter 4.9.15. Area loads z x q ϕ' a c+d 45 + ϕ'/2 Fig. 4.3. Force distribution area lords. Chapter 5 - Design of steel sheetpile structures 22 Chapter 5.8.3. Surcharge
Chapter 4 - Earth and water pressure 26 Chapter 4.9.15. Area loads z x q ϕ' a c+d 45 + ϕ'/2 Fig. 4.3. Force distribution area lords. Chapter 5 - Design of steel sheetpile structures 22 Chapter 5.8.3. Surcharge
3-D Numerical simulation of shake-table tests on piles subjected to lateral spreading
 3-D Numerical simulation of shake-table tests on piles subjected to lateral spreading M. Cubrinovski 1, H. Sugita 2, K. Tokimatsu 3, M. Sato 4, K. Ishihara 5, Y. Tsukamoto 5, T. Kamata 5 1 Department of
Cubzac-les-Ponts Experimental Embankments on Soft Clay
 Cubzac-les-Ponts Experimental Embankments on Soft Clay 1 Introduction In the 197 s, a series of test embankments were constructed on soft clay at Cubzac-les-Ponts in France. These full-scale field tests
Liquefaction Potential Variations Influenced by Building Constructions
 Earth Science Research; Vol. 1, No. 2; 2012 ISSN 1927-0542 E-ISSN 1927-0550 Published by Canadian Center of Science and Education Liquefaction Potential Variations Influenced by Building Constructions
Verification of a Micropile Foundation
 Engineering manual No. 36 Update 02/2018 Verification of a Micropile Foundation Program: File: Pile Group Demo_manual_en_36.gsp The objective of this engineering manual is to explain the application of
SOIL MODELS: SAFETY FACTORS AND SETTLEMENTS
 PERIODICA POLYTECHNICA SER. CIV. ENG. VOL. 48, NO. 1 2, PP. 53 63 (2004) SOIL MODELS: SAFETY FACTORS AND SETTLEMENTS Gabriella VARGA and Zoltán CZAP Geotechnical Department Budapest University of Technology
Chapter 4 Seismic Design Requirements for Building Structures
 Chapter 4 Seismic Design Requirements for Building Structures where: F a = 1.0 for rock sites which may be assumed if there is 10 feet of soil between the rock surface and the bottom of spread footings
External Pressure... Thermal Expansion in un-restrained pipeline... The critical (buckling) pressure is calculated as follows:
 pressure is calculated as follows:") External Pressure... The critical (buckling) pressure is calculated as follows: P C = E. t s ³ / 4 (1 - ν ha.ν ah ) R E ³ P C = Critical buckling pressure, kn/m² E = Hoop modulus in flexure, kn/m² t s
External Pressure... The critical (buckling) pressure is calculated as follows: P C = E. t s ³ / 4 (1 - ν ha.ν ah ) R E ³ P C = Critical buckling pressure, kn/m² E = Hoop modulus in flexure, kn/m² t s
June 9, R. D. Cook, P.Eng. Soils Engineer Special Services Western Region PUBLIC WORKS CANADA WESTERN REGION REPORT ON
 PUBLIC WORKS CANADA WESTERN REGION REPORT ON GEOTECHNICAL INVESTIGATION PROPOSED MARTIN RIVER BRIDGE MILE 306.7 MACKENZIE HIGHWAY Submitted by : R. D. Cook, P.Eng. Soils Engineer Special Services Western
Rock Berm Restraint of an Untrenched Pipeline on Soft Clay
 Rock Berm Restraint of an Untrenched Pipeline on Soft Clay J.-C. Ballard, P.H. Yonatan and M.J. Rattley, Fugro GeoConsulting A. Griffiths, Shell UK Limited ABSTRACT This paper discusses soil structure
8.1. What is meant by the shear strength of soils? Solution 8.1 Shear strength of a soil is its internal resistance to shearing stresses.
 8.1. What is meant by the shear strength of soils? Solution 8.1 Shear strength of a soil is its internal resistance to shearing stresses. 8.2. Some soils show a peak shear strength. Why and what type(s)
Where and are the factored end moments of the column and >.
 11 LIMITATION OF THE SLENDERNESS RATIO----( ) 1-Nonsway (braced) frames: The ACI Code, Section 6.2.5 recommends the following limitations between short and long columns in braced (nonsway) frames: 1. The
Nonlinear static (pushover) analysis will be performed on a railroad bridge bent using wframe to determine its ultimate lateral deflection capability.
 analysis will be performed on a railroad bridge bent using wframe to determine its ultimate lateral deflection capability.") DESCRIPTION Nonlinear static (pushover) analysis will be performed on a railroad bridge bent using wframe to determine its ultimate lateral deflection capability. Moment hinges are based on Caltrans material
DESCRIPTION Nonlinear static (pushover) analysis will be performed on a railroad bridge bent using wframe to determine its ultimate lateral deflection capability. Moment hinges are based on Caltrans material
Numerical Investigation of the Effect of Recent Load History on the Behaviour of Steel Piles under Horizontal Loading
 Numerical Investigation of the Effect of Recent Load History on the Behaviour of Steel Piles under Horizontal Loading K. Abdel-Rahman Dr.-Ing., Institute of Soil Mechanics, Foundation Engineering and Waterpower
Effects of Slope Stability Evaluation on Highway Bridge Design
 Effects of Slope Stability Evaluation on Highway Bridge Design Shanzhi Shu, PhD PE KCI Technologies INC Les C. Banas, PE Kiewit Infrastructure Engineers Samuel D. Palmer, PE Terracon Consultants Inc. Introduction
A Pile Pull Out Test
 1 Introduction A Pile Pull Out Test This example simulates pulling a pile out of the ground. It is not a realistic field case, but numerically the simulation makes it possible to verify the behavior of
PILE-SUPPORTED RAFT FOUNDATION SYSTEM
 PILE-SUPPORTED RAFT FOUNDATION SYSTEM Emre Biringen, Bechtel Power Corporation, Frederick, Maryland, USA Mohab Sabry, Bechtel Power Corporation, Frederick, Maryland, USA Over the past decades, there has
Numerical simulation of inclined piles in liquefiable soils
 Proc. 20 th NZGS Geotechnical Symposium. Eds. GJ Alexander & CY Chin, Napier Y Wang & R P Orense Department of Civil and Environmental Engineering, University of Auckland, NZ. ywan833@aucklanduni.ac.nz
ABSTRACT. SUAREZ, VINICIO. Implementation of Direct Displacement Based Design for Pile and
 ABSTRACT SUAREZ, VINICIO. Implementation of Direct Displacement Based Design for Pile and Drilled Shaft Bents. (Under the direction of Dr. Mervyn Kowalsky) The work in this thesis attempts to implement
Chapter 5 Shear Strength of Soil
 Page 5 Chapter 5 Shear Strength of Soil. The internal resistance per unit area that the soil mass can offer to resist failure and sliding along any plane inside it is called (a) strength (b) shear strength
KINEMATIC RESPONSE OF GROUPS WITH INCLINED PILES
 th International Conference on Earthquake Geotechnical Engineering June 5-8, 7 Paper No. 5 KINEMATIC RESPONSE OF GROUPS WITH INCLINED PILES Amalia GIANNAKOU, Nikos GEROLYMOS, and George GAZETAS 3 ABSTRACT
PILE SOIL INTERACTION MOMENT AREA METHOD
 Pile IGC Soil 2009, Interaction Moment Guntur, INDIA Area Method PILE SOIL INTERACTION MOMENT AREA METHOD D.M. Dewaikar Professor, Department of Civil Engineering, IIT Bombay, Mumbai 400 076, India. E-mail:
PERFORMANCE OF BITUMINOUS COATS IN REDUCING NEGATIVE SKIN
 PERFORMANCE OF BITUMINOUS COATS IN REDUCING NEGATIVE SKIN FRICTION Makarand G. Khare, PhD Research Scholar, Indian Institute of Technology Madras, Chennai, India Shailesh R. Gandhi, Professor, Indian Institute
AERO 214. Lab II. Measurement of elastic moduli using bending of beams and torsion of bars
 AERO 214 Lab II. Measurement of elastic moduli using bending of beams and torsion of bars BENDING EXPERIMENT Introduction Flexural properties of materials are of interest to engineers in many different