Summer School on Multidimensional Poverty Analysis
|
|
|
- Brandon Allen
- 5 years ago
- Views:
Transcription
1 Summer School on Multidimensional Poverty Analysis 1 12 August 2016 Beijing, China

2 Interpreting the MPI Results Adriana Conconi (OPHI)
3 Motivation
4 Policy Interest Why? 1. Intuitive easy to understand 2. Birds-eye view can be unpacked a. by region, ethnicity, rural/urban, etc. b. by indicator, to show composition c. by intensity to show inequality among poor 3. Adds Value: a. focuses on the multiply deprived b. shows joint distribution of deprivation. 4. Incentives to reach the poorest of the poor 5. Flexible: you choose indicators/cutoffs/values 6. Robust: to wide range of weights and cutoffs 7. Academically Rigorous
5 Choose the purpose Choose the unit Last week
6 then Choose the purpose Choose the unit Choose the dimensions Choose the indicators Choose the deprivation cut-off of each indicator Choose the weights Choose the poverty cut-off (poverty line) And finally...

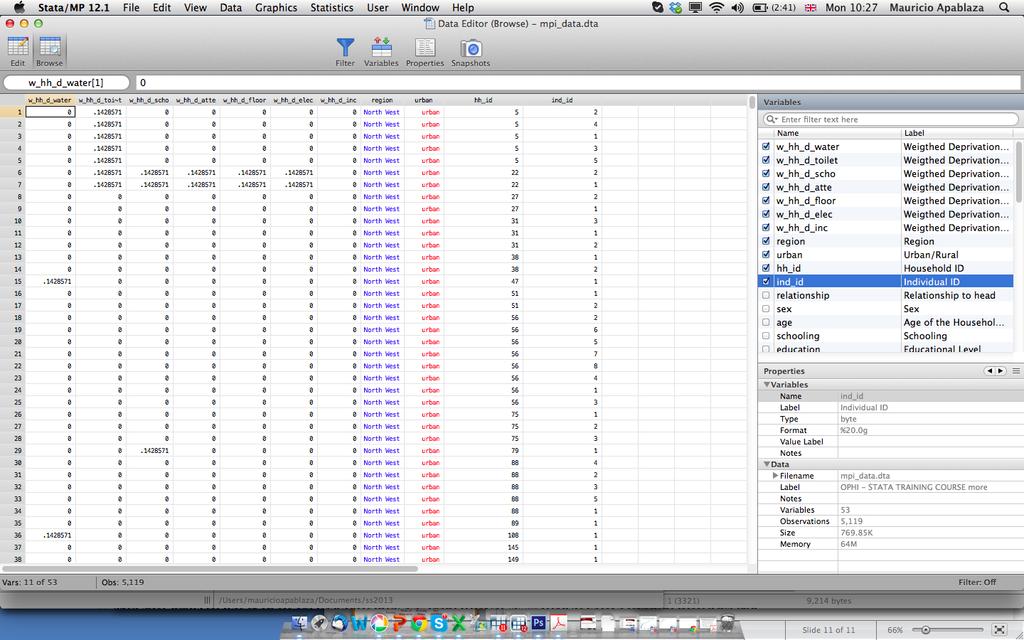
7 STATA
8 Understanding
9 MD Poverty Statistics: What do you need to understand? k : poverty cutoff M 0 (sometimes called MPI) H : Headcount Ratio A : Intensity h j : Censored Headcount (each indicator) j : Percent Contribution (each indicator) Vulnerability and Severe MPI (All of the above, by subgroup)
10 Multidimensional Data Matrix of well-being scores for 4 persons in 4 dimensions Who is deprived in what? Income Years of Education Health Index Water No Ana X = Yes Chris Yes Adriana No John z = No
11 . tab water [aw=weight], miss Drinking Water Freq. Percent Cum piped into dwelling piped to yard/plot public tap/standpipe 1, tube well or borehole 1, dug well/protected well dug well/unprotected well protected spring unprotected spring rainwater tanker truck cart with small tank surface water (river/dam/lake/pond/stre bottled water other Total 5,
12 Achievement Matrix Matrix of well-being scores for 4 persons in 4 dimensions Who is deprived in what? Income Years of Education Health Index Water No Ana X = Yes Chris Yes Adriana No John z = No
13 Deprivation Matrix Replace entries: 1 if deprived, 0 if not deprived Income Years of Education Health Index Water Ana g 0 = Chris Adriana John z = No
14 . tab water hh_d_water [aw=weight], miss RECODE of water (Drinking Water) Drinking Water 0 1 Total piped into dwelling piped to yard/plot public tap/standpipe 1, , tube well or borehole 1, , dug well/protected we dug well/unprotected protected spring unprotected spring rainwater tanker truck cart with small tank surface water (river/ bottled water other Total 4, , ,119

15
16 Deprivation Matrix Replace entries: 1 if deprived, 0 if not deprived Income Years of Education Health Index Water Ana g 0 = Chris Adriana John z = No

17
18 Weighted Deprivation Matrix Replace entries: 1 if deprived, 0 if not deprived Income Years of Education Health Index Water g 0 = Ana Chris Adriana John z = No
19
20 Counting Vector Income Years of Education Health Index Water C_vector Ana W_g 0 = Chris Adriana John
21
22 Identification (Headcount ratio) W_g 0 = Income Years of Education Health Index Water c k_30 k_60 k_ H = 50% 25% 25%
23
24 Intensity (censored c_vector among the Poor) W_g 0 = Incom e Years of Education Health Index Water c a_30 a_60 a_ A = 75% 100% 100%

25
26 Adjusted Headcount Ratio (Censored C_Vector ) W_g 0 = Income Years of Education Health Index Water c m0_30 m0_60 m0_ M0 =
27
28 Censored Headcount Ratios (k = 30%) W_g 0 = Income Years of Education Health Index Water c m0_
29 Censored Headcount Ratios k = 30% W_g 0 (k)= Income Years of Education Health Index Water c m0_
30 Censored Headcount Ratios k = 30% W_g 0 (k)= Income Years of Education Health Index Water c m0_ CH: 2/4 1/4 1/4 2/4 CH*w: 2/4*0.25 1/4*0.25 1/4*0.25 2/4* M0 = 0.375
31 Contribution each Indicator k = 30% Income Years of Education Health Index Water m0_30 CH: 2/4 1/4 1/4 2/4 2/4*0.25 1/4*0.25 1/4*0.25 2/4* M0 = Contrib. 2/4*0.25 1/4*0.25 1/4*0.25 2/4* Σ 100%
32 Interpretation


33 Global Multidimensional Poverty Index Identify someone as poor if he or she is deprived in 33% or more of the weighted indicators. Poverty cutoff k = 33% Grace s Deprivation Score 33%
34 MPI is Alkire & Foster s M 0 The M 0 is the product of two components: Formula: M 0 = H A Interpretation of M 0 (Example: 0.350): the percentage of deprivations poor people experience, as a share of the possible deprivations that would be experienced if all people were deprived in all dimensions.
 Incidence ~ the percentage of people who are poor, or the")
 Intensity ~ the average deprivation score, or percentage of dimensions in")
35 Partial Indices H and A- The M 0 is the product of two components: Formula: M 0 = H A 1) Incidence ~ the percentage of people who are poor, or the headcount ratio H. 2) Intensity ~ the average deprivation score, or percentage of dimensions in which poor people are deprived A. Grace s Deprivation Score: 39%
36 MPI Censored Deprivation Matrix g 0 (k) g 0 (k) = MPI = H*A = k = 33% Indicators c(k) c(k)/d H = headcount ratio = 3/4 = 75% A = intensity = ( )/3 = 0.59 = 59% MPI = HxA =
37 Nepal s MPI MPI H 64.7% A 54.0% 37


38 Average Intensity of Poverty (A) 75% 70% 65% 60% 55% 50% 45% 40% 35% What MPI shows National level Nepal 2006 Nepal 2006, 64.7, % 0% 10% 20% 30% 40% 50% 60% 70% 80% 90% 100% Incidence - Percentage of MPI Poor People (H)

39 75% MPI in Nepal % 65% Average Intensity of Poverty (A) 60% 55% Nepal % Nepal % 40% 35% 30% 0% 10% 20% 30% 40% 50% 60% 70% 80% 90% 100% Incidence - Percentage of MPI Poor People (H)
40 Nepal s MPI MPI H 64.7% 44.2% A 54% 49% 40
41 2013 MPI in South Asia MPI H A Maldives DHS Sri Lanka WHS Bhutan MICS Nepal DHS Pakistan DHS 2006/ India DHS 2005/ BangladeshDHS
42 Censored Headcount Ratios % of people who are poor and deprived in each indicator Nepal Censored Headcounts Ratios, Schooling 8.1 School attendance Child mortality 8.8 Nutrition Electricity Sanitation Water Flooring Fuel Assets
43 MPI Censored Deprivation Matrix g 0 (k) Censored Headcount Ratios: Go Vertical! No Weights! c(k) c(k)/d g 0 (k) = = h j Hint: The Censored Headcount can never exceed the Uncensored Headcount Ratios. Why?
44 MPI Censored Deprivation Matrix g 0 (k) % Contribution: Go Horizontal! Use Weights (as %)! % Contr = (h j * w j )/M 0 M 0 = g 0 (k) = (0.25 x 0.167)/0.442 = 9.4% Hint: The % Contribution of all 10 indicators add up to 100%
 shows")
45 Decomposition by region (or social group) shows inequalities Regional MPI values

46 Changes in Censored Headcount Ratios to understand trends in poverty reduction
47 Changes in Censored H by region (Nepal) Annualized Absolute Change in proportion who is poor and deprived in Nutrition Child Mortality Years of Schooling Attendance Cooking Fuel Sanitation Water Electricity Floor Assets

48 Comparing countries Ethiopia 2000 Nigeria 2003 Ghana 2003

49 Comparing countries Multidimensional poverty Country MPI H A Range 0 to 1 % Population Average % of weighted deprivations Lao People's Democratic Republic Yemen India
50 Comparing countries Country Range 0 to 1 Multidimensional poverty MPI H A % Population Average % of weighted deprivations Number Population of vulnerable MPI poor to poverty (who people experience % intensity of Year deprivations) of the survey b Populatio severe po (with intensit than 50 Thousands % Population % Populat Lao People's Democratic Republic , Yemen , India , Different number of people
 Population in severe poverty (with intensity higher than 50%) Range 0 to 1 % Population Average % of weighted deprivations % Population % Population Lao People's")
51 Comparing countries Country Multidimensional poverty MPI H A Population vulnerable to poverty (who experience % intensity of deprivations) Population in severe poverty (with intensity higher than 50%) Range 0 to 1 % Population Average % of weighted deprivations % Population % Population Lao People's Democratic Republic Yemen India TOTAL POOR Lao %
52 Policy Interest Why? 1. Intuitive easy to understand 2. Birds-eye view - can be unpacked a. by region, ethnicity, rural/urban, etc. b. by indicator, to show composition c. by intensity to show inequality among poor 3. Adds Value: a. focuses on the multiply deprived b. shows joint distribution of deprivation. 4. Incentives to reach the poorest of the poor 5. Flexible: you choose indicators/cutoffs/values 6. Robust to wide range of weights and cutoffs 7. Academically Rigorous
53 The input of researchers Figure out what issues are timely and relevant. Follow policy dialogues & get to know people. Keep asking why my measurement matters to a poor person. See your work from a users perspective Craft factoids Design metaphors Experiment: not everything works
Multidimensional Data
 A&F in STATA Multidimensional Data Matrix of achievement scores for 4 households in 6 dimensions Water Toilet Scho Atte Floor Elec piped flush 8 yes cement no y = protect no 3 no earth yes surface bucket
Poverty statistics in Mongolia
 HIGH-LEVEL SEMINAR ON HARMONISATION OF POVERTY STATISTICS IN CIS COUNTRIES SOCHI (RUSSIAN FEDERATION) Poverty statistics in Mongolia Oyunchimeg Dandar Director Population and Social Statistics Department,
The Role of Inequality in Poverty Measurement
 The Role of Inequality in Poverty Measurement Sabina Alkire Director, OPHI, Oxford James E. Foster Carr Professor, George Washington Research Associate, OPHI, Oxford WIDER Development Conference Helsinki,
Growth in India: An Analysis Using Elasticities
 Multidimensional Poverty and Inclusive Growth in India: An Analysis Using Elasticities Sabina Alkire and Suman Seth University of Oxford November 10, 2014 Motivation India maintained higher economic growth
Evaluating Dimensional and Distributional Contributions to Multidimensional Poverty
 Evaluating Dimensional and Distributional Contributions to Multidimensional Poverty Social Choice and Welfare Conference 2014, Boston College Sabina Alkire James E. Foster OPHI, Oxford George Washington
Multidimensional Poverty Measurement and Analysis
 Multidimensional Poverty Measurement and Analysis Sabina Alkire, James Foster, Suman Seth, Maria Emma Santos, José Manuel Roche and Paola Ballon 22 June 25 University of Oxford Multidimensional Measurement
Food Price Shocks and Poverty: The Left Hand Side
 Food Price Shocks and Poverty: The Left Hand Side James E. Foster The George Washington University and OPHI Oxford Washington, DC, September 30 2011 Motivation Why Policy Concern? Indeed: prices change
Data Requirements in Multidimensional Poverty Measurement
 Data Requirements in Multidimensional Poverty Measurement Oxford Poverty & Human Development Initiative (OPHI) University of Oxford Rabat, 4 June 2014 Limits of the current global MPI surveys: DHS, MICS
Counting and Multidimensional Poverty Measurement
 Counting and Multidimensional Poverty Measurement by Sabina Alkire and James Foster QEH 31 May 2007 Why Multidimensional Poverty? Appealing conceptual framework Capabilities Data availability Tools Poverty
OPHI WORKING PAPER NO. 90
 Oxford Poverty & Human Development Initiative (OPHI) Oxford Department of International Development Queen Elizabeth House (QEH), University of Oxford OPHI WORKING PAPER NO. 90 Multidimensional Poverty
Where are the Poor? Mapping Out A GIS-Multidimensional Non- Monetary Poverty Index Approach for Ghana*
 Where are the Poor? Mapping Out A GIS-Multidimensional Non- Monetary Poverty Index Approach for Ghana* B. Kumi-Boateng, D. Mireku-Gyimah and E. Stemn Kumi-Boateng, B., Mireku-Gyimah, D. and Stemn, E. (2015),
Decomposing changes in multidimensional poverty in 10 countries.
 Decomposing changes in multidimensional poverty in 10 countries. Mauricio Apablaza y University of Nottingham Gaston Yalonetzky z Oxford Poverty and Human Development Initiative, University of Oxford Juan
MPI and Multidimensional Poverty Analysis What we knew before joining West Bank and Gaza Poverty Assessment team. Nobuo Yoshida April 21, 2011
 MPI and Multidimensional Poverty Analysis What we knew before joining West Bank and Gaza Poverty Assessment team Nobuo Yoshida April 21, 2011 Multidimensional poverty analysis and Oxford-UNDP MPI In July,
Sensitivity of Multidimensional Poverty Index in Pakistan Farzana Naheed Khan a and Shaista Akram b
 98 THE PAKISTAN JOURNAL OF SOCIAL ISSUES Special Issue (June 2018) Sensitivity of Multidimensional Poverty Index in Pakistan Farzana Naheed Khan a and Shaista Akram b Abstract The study estimates multidimentional
Downloaded from
 GIST OF THE LESSON: General patternsof population distribution in the world, density of population, factors influencing the distribution of population, population growth, trends in population growth, doubling
Exemplar for Internal Assessment Resource Geography Level 3. Resource title: Water, water, everywhere?
 Exemplar for internal assessment resource Geography 3.7A for Achievement Standard 91432 Exemplar for Internal Assessment Resource Geography Level 3 Resource title: Water, water, everywhere? This exemplar
Comparison of Multidimensional Measurements of Poverty Analysis: Cross Sectional Data Evidence from Tigray
 Comparison of Multidimensional Measurements of Poverty Analysis: Cross Sectional Data Evidence from Tigray Gebretsadik Hishe Gebreslassie Lecturer in Economics, Adigrat University, Ethiopia Abstract This
OPHI WORKING PAPER NO. 77
 Oxford Poverty & Human Development Initiative (OPHI) Oxford Department of International Development Queen Elizabeth House (QEH), University of Oxford OPHI WORKING PAPER NO. 77 Did Poverty Reduction Reach
Poverty, Inequality and Growth: Empirical Issues
 Poverty, Inequality and Growth: Empirical Issues Start with a SWF V (x 1,x 2,...,x N ). Axiomatic approaches are commen, and axioms often include 1. V is non-decreasing 2. V is symmetric (anonymous) 3.
Module 1b: Inequalities and inequities in health and health care utilization
 Module 1b: Inequalities and inequities in health and health care utilization Decomposition, standardization, and inequity This presentation was prepared by Adam Wagstaff and Caryn Bredenkamp 1 The basic
C/W Qu: How is development measured? 13/6/12 Aim: To understand how development is typically measured/classified and the pros/cons of these
 C/W Qu: How is development measured? 13/6/12 Aim: To understand how development is typically measured/classified and the pros/cons of these Starter: Comment on this image Did you spot these? Rubbish truck
Poverty Maps: Uses and Caveats. Tara Vishwanath Lead Economist World Bank
 Poverty Maps: Uses and Caveats Tara Vishwanath Lead Economist World Bank Uses of Poverty Maps A visual illustration of estimated poverty indices at DS division level or below (currently excluding N-E E
Distribution-sensitive multidimensional poverty measures with an application to India
 DEPARTMENT OF ECONOMICS ISSN 1441-5429 DISCUSSION PAPER 06/17 Distribution-sensitive multidimensional poverty measures with an application to India Gaurav Datt* Abstract: This paper presents axiomatic
Robust Multidimensional Poverty Comparisons
 Robust Multidimensional Poverty Comparisons by Jean-Yves Duclos Department of Economics and CIRPÉE, Université Laval, Canada, David Sahn Food and Nutrition Policy Program, Cornell University and Stephen
OPHI WORKING PAPER NO. 100
 Oxford Poverty & Human Development Initiative (OPHI) Oxford Department of International Development Queen Elizabeth House (QEH), University of Oxford OPHI WORKING PAPER NO. 100 to Multidimensional Poverty
EVALUATING THE TOURIST SATISFACTION IN FIVE FAMOUS ITALIAN CITIES
 Rivista Italiana di Economia Demografia e Statistica Volume LXXIII n. 1 Gennaio-Marzo 219 EVALUATING THE TOURIST SATISFACTION IN FIVE FAMOUS ITALIAN CITIES Mariateresa Ciommi, Gennaro Punzo, Gaetano Musella
GCSE 4231/01 GEOGRAPHY
 Surname Centre Number Candidate Number Other Names 0 GCSE 4231/01 GEOGRAPHY (Specification A) FOUNDATION TIER UNIT 1 Core Geography A.M. THURSDAY, 14 June 2012 1 3 4 hours For s use Question 1 Question
Summary Article: Poverty from Encyclopedia of Geography
 Topic Page: Poverty Definition: poverty from Dictionary of Energy Social Issues. the fact of being poor; the absence of wealth. A term with a wide range of interpretations depending on which markers of
Section III: Poverty Mapping Results
 Section III: Poverty Mapping Results Figure 5: Gewog level rural poverty map 58. The most prominent result from the poverty mapping exercise of Bhutan is the production of a disaggregated poverty headcount
Multidimensional Poverty in Colombia: Identifying Regional Disparities using GIS and Population Census Data (2005)
") Multidimensional Poverty in Colombia: Identifying Regional Disparities using GIS and Population Census Data (2005) Laura Estrada Sandra Liliana Moreno December 2013 Aguascalientes, Mexico Content 1. Spatial
Multidimensional Poverty in Colombia: Identifying Regional Disparities using GIS and Population Census Data (2005) Laura Estrada Sandra Liliana Moreno December 2013 Aguascalientes, Mexico Content 1. Spatial
Assisting Countries in the Collection and Analysis of National Statistics
 Assisting Countries in the Collection and Analysis of National Statistics Peter O. Way, Ph.D., Chief International Programs Center U.S. Census Bureau Censuses in the 21 st Century: Improving Data Utilization
Consistent multidimensional poverty comparisons
 Preliminary version - Please do not distribute Consistent multidimensional poverty comparisons Kristof Bosmans a Luc Lauwers b Erwin Ooghe b a Department of Economics, Maastricht University, Tongersestraat
Natural Resource Management Indicators for the Least Developed Countries
 Natural Resource Management Indicators for the Least Developed Countries Alex de Sherbinin CIESIN, Columbia University 24 June 2005 Millennium Challenge Corporation workshop Brookings Institution Washington,
Measuring Poverty. Introduction
 Measuring Poverty Introduction To measure something, we need to provide answers to the following basic questions: 1. What are we going to measure? Poverty? So, what is poverty? 2. Who wants to measure
Poverty and Inclusion in the West Bank and Gaza. Tara Vishwanath and Roy Van der Weide
 Poverty and Inclusion in the West Bank and Gaza Tara Vishwanath and Roy Van der Weide Oslo accord created a fragmented territory, with no Palestinian control over Area C Overlaid by a regime of internal
Summary prepared by Amie Gaye: UNDP Human Development Report Office
 Contribution to Beyond Gross Domestic Product (GDP) Name of the indicator/method: The Human Development Index (HDI) Summary prepared by Amie Gaye: UNDP Human Development Report Office Date: August, 2011
THIS DRAFT IS NOT TO BE CITED, QUOTED OR ATTRIBUTED WITHOUT PERMISSION FROM AUTHOR(S).
.") DRAFT This paper is a draft submission to Inequality Measurement, trends, impacts, policies 5 6 September 2014 Helsinki, Finl This is a draft version of a conference paper submitted for presentation at
DRAFT This paper is a draft submission to Inequality Measurement, trends, impacts, policies 5 6 September 2014 Helsinki, Finl This is a draft version of a conference paper submitted for presentation at
Unit Two: Development & Globalization
 Unit Objectives Unit Two: Development & Globalization Students gain an understanding of the definitions of and differences in less economically developed countries and more economically developed countries
Assessing deprivation with ordinal variables: Depth sensitivity and poverty aversion
 Assessing deprivation with ordinal variables: Depth sensitivity and poverty aversion Suman Seth and Gaston Yalonetzky March 7, 2018 Preliminary draft. Please do not cite or share without authors permission.
Asia. JigsawGeo. Free Printable Maps for Geography Education. Try our geography games for the ipod Touch or iphone.
 Free Printable Maps for Geography Education Map with region names shown Map without names, for coloring or quizzes Map with coordinate system, for location practice Answer key for coordinate system quiz
GIS Final Project: Stage of Development Index. country s stage of development and how this relates to their impact on nature and the
 Group 4 Bridget Blair Mikhail Cunill Quinn Magevney Jordan Repollo GIS Final Project: Stage of Development Index Main Goal: Our goal is to take variables that are not inherently geospatial to better understand
(a) The density histogram above right represents a particular sample of n = 40 practice shots. Answer each of the following. Show all work.
 The density histogram above right represents a particular sample of n = 40 practice shots. Answer each of the following. Show all work.") . Target Practice. An archer is practicing hitting the bull s-eye of the target shown below left. For any point on the target, define the continuous random variable D = (signed) radial distance to the
. Target Practice. An archer is practicing hitting the bull s-eye of the target shown below left. For any point on the target, define the continuous random variable D = (signed) radial distance to the
The World Bank CG Rep. LISUNGI Safety Nets System Project (P145263)
") Public Disclosure Authorized AFRICA Congo, Republic of Social Protection & Labor Global Practice IBRD/IDA Investment Project Financing FY 2014 Seq No: 7 ARCHIVED on 04-Dec-2017 ISR30246 Implementing Agencies:
Public Disclosure Authorized AFRICA Congo, Republic of Social Protection & Labor Global Practice IBRD/IDA Investment Project Financing FY 2014 Seq No: 7 ARCHIVED on 04-Dec-2017 ISR30246 Implementing Agencies:
What s new (or not so new) in Population and Poverty Data Initiatives
 in Population and Poverty Data Initiatives") What s new (or not so new) in Population and Poverty Data Initiatives Deborah Balk Global Spatial Data and Information User Workshop 21 September 2004 Evolution in global collection of population and poverty
What s new (or not so new) in Population and Poverty Data Initiatives Deborah Balk Global Spatial Data and Information User Workshop 21 September 2004 Evolution in global collection of population and poverty
Geospatial Technologies for Resources Planning & Management
 Geospatial Technologies for Resources Planning & Management Lal Samarakoon, PhD Director, Geoinformatics Center Asian Institute of Technology, Thailand Content Geoinformatics for SDG Information Integration
OPHI WORKING PAPER NO. 47
 Oxford Poverty & Human Development Initiative (OPHI) Oxford Department of International Development Queen Elizabeth House (QEH), University of Oxford OPHI WORKING PAPER NO. 47 Multidimensional Poverty:
Income elasticity of human development in ASEAN countries
 The Empirical Econometrics and Quantitative Economics Letters ISSN 2286 7147 EEQEL all rights reserved Volume 2, Number 4 (December 2013), pp. 13-20. Income elasticity of human development in ASEAN countries
Exploring Hidden Dimensions: Environmental and Natural Resource Aspects of Poverty
 Exploring Hidden Dimensions: Environmental and Natural Resource Aspects of Poverty Harun Dogo, Carter Brandon, Martin Heger, Shun Chonabayashi, Joanne Gaskell, Mook Bangalore, Therese Norman, Jia Jun Lee,
PRELIMINARY DESIGN OF A SPATIAL DECISION SUPPORT SYSTEM FOR POVERTY MANAGEMENT
 PRELIMINARY DESIGN OF A SPATIAL DECISION SUPPORT SYSTEM FOR POVERTY MANAGEMENT F. O. Akinyemi Department of Geography, Obafemi Awolowo University, Ile-Ife, 220001, Nigeria bakin_yem@yahoo.com Commission
Urbanization and Maternal Health
 Urbanization and Maternal Health Perspectives from USAID Anthony Kolb Urban Health Advisor USAID/Washington Global Health Initiative Seminar Woodrow Wilson International Center 19 April 2011 Do I look
Assessing Social Vulnerability to Biophysical Hazards. Dr. Jasmine Waddell
 Assessing Social Vulnerability to Biophysical Hazards Dr. Jasmine Waddell About the Project Built on a need to understand: The pre-disposition of the populations in the SE to adverse impacts from disaster
Motorization in Asia: 14 countries and three metropolitan areas. Metin Senbil COE Researcher COE Seminar
 Motorization in Asia: 14 countries and three metropolitan areas Metin Senbil COE Researcher COE Seminar - 2006.10.20 1 Outline Background Motorization in Asia: 14 countries Kuala Lumpur, Manila, Jabotabek
Pro-poorest Poverty Reduction with Counting Measures. José V. Gallegos (Peruvian Ministry of Development and Social Inclusion)
") Pro-poorest Poverty Reduction with Counting Measures José V. Gallegos (Peruvian Ministry of Development and Social Inclusion) Gaston Yalonetzky (University of Leeds, UK) Paper Prepared for the IARIW 33
Pro-poorest Poverty Reduction with Counting Measures José V. Gallegos (Peruvian Ministry of Development and Social Inclusion) Gaston Yalonetzky (University of Leeds, UK) Paper Prepared for the IARIW 33
MOCK EXAMINATION 1. Name Class Date INSTRUCTIONS
 Name Class Date PRIMARY 2 mathematics MOCK EXAMINATION 1 INSTRUCTIONS Total time for Section A, Section B and Section C: 1 hour 45 minutes The use of calculators is not allowed. SECTION A : Multiple Choice
Cornelia F.A. van Wesenbeeck Amsterdam Centre for World Food Studies, VU University, Amsterdam. Study for SWAC/OECD
 Cornelia F.A. van Wesenbeeck Amsterdam Centre for World Food Studies, VU University, Amsterdam Study for SWAC/OECD Policies to improve FNS require solid empirical base At least headcounts of people below/above
Disaster Prevention and Management in Asia: The Context of Human Security and Its Relevance to Infrastructure Planning and Management
 Disaster Prevention and Management in Asia: The Context of Human Security and Its Relevance to Infrastructure Planning and Management Rajib Shaw http://www.iedm.ges.kyoto-u.ac.jp/ Contents Background and
Chapter 9: Looking Beyond Poverty: The Development Continuum
 Chapter 9: Looking Beyond Poverty: The Development Continuum Using measures such as Gross Domestic Product (GDP), Gross National Income (GNI), and more recently the Human Development Index (HDI), various
Capacity Building in Applications of Remote Sensing and GIS for Disaster Management
 Capacity Building in Applications of Remote Sensing and GIS for Disaster Management M.K. Hazarika, L. Samarakoon, N. Senevirathne, J.S.M. Fowze and R. de Silva Project Researcher GeoInformatics Center
Marriage Institutions and Sibling Competition: Online Theory Appendix
 Marriage Institutions and Sibling Competition: Online Theory Appendix The One-Daughter Problem Let V 1 (a) be the expected value of the daughter at age a. Let υ1 A (q, a) be the expected value after a
OPHI WORKING PAPER NO. 123
 Oxford Poverty & Human Development Initiative (OPHI) Oxford Department of International Development Queen Elizabeth House (QEH), University of Oxford OPHI WORKING PAPER NO. 123 : Depth Sensitivity and
The Regional Integrated Multi-Hazard Early Warning System for Africa and Asia CAP in RIMES
 The Regional Integrated Multi-Hazard Early Warning System for Africa and Asia CAP in RIMES 2018 CAP Implementation Workshop OUTLINE 1. RIMES Overview 2. DSS tools developed in RIMES 3. CAP Integration
New Indicators and Models for Inequality and Poverty with Attention to Social Exclusion, Vulnerability and Deprivation 1
 New Indicators and Models for Inequality and Poverty with Attention to Social Exclusion, Vulnerability and Deprivation 1 Achille Lemmi CRIDIRE, University of Siena, e-mail: lemmi@unisi.it Abstract The
The Impact of Geography in South and East Asia
 The Impact of Geography in South and East Asia Gobi desert, Mongolia Essential Question: How does the geography of SE Asia impact trade and the distribution of population throughout the region? (AKS #52a)
South and South-West Asia LLDCs
 International support measures to South and South-West Asia LLDCs Nagesh Kumar Director, ESCAP South and South West Asia Office And ESCAP Chief Economist ESCAP/OHRLLS/ECE/Government / / of Lao PDR Final
Inequality, poverty and redistribution
 Inequality, poverty and redistribution EC426 http://darp.lse.ac.uk/ec426 17 February 2014 Issues Key questions about distributional tools Inequality measures what can they tell us about recent within-country
The Impact of Geography in South and East Asia
 The Impact of Geography in South and East Asia Gobi desert, Mongolia Essential Question: How does geography impact the distribution of population throughout South and East Asia? I CAN Explain how geography
OPHI WORKING PAPER NO. 89
 Oxford Poverty & Human Development Initiative (OPHI) Oxford Department of International Development Queen Elizabeth House (QEH), University of Oxford OPHI WORKING PAPER NO. 89 Multidimensional Poverty
National Spatial Development Perspective (NSDP) Policy Coordination and Advisory Service
 Policy Coordination and Advisory Service") National Spatial Development Perspective (NSDP) Policy Coordination and Advisory Service 1 BACKGROUND The advances made in the First Decade by far supersede the weaknesses. Yet, if all indicators were
National Spatial Development Perspective (NSDP) Policy Coordination and Advisory Service 1 BACKGROUND The advances made in the First Decade by far supersede the weaknesses. Yet, if all indicators were
(quantitative or categorical variables) Numerical descriptions of center, variability, position (quantitative variables)
 Numerical descriptions of center, variability, position (quantitative variables)") 3. Descriptive Statistics Describing data with tables and graphs (quantitative or categorical variables) Numerical descriptions of center, variability, position (quantitative variables) Bivariate descriptions
3. Descriptive Statistics Describing data with tables and graphs (quantitative or categorical variables) Numerical descriptions of center, variability, position (quantitative variables) Bivariate descriptions
The Impact of Geography in South and East Asia
 The Impact of Geography in South and East Asia Gobi desert, Mongolia Essential Question: How does the geography of SE Asia impact trade and the distribution of population throughout the region? (AKS #52a)
TRAINING MATERIAL FOR PRODUCING NATIONAL HUMAN DEVELOPMENT REPORTS. Inequality-adjusted Human Development Index (IHDI) 1
 1") TRAINING MATERIAL FOR PRODUCING NATIONAL HUMAN DEVELOPMENT REPORTS Inequality-adjusted Human Development Index (IHDI) 1 Purpose: To adjust the HDI for inequality, such that it better reflects the actual
TRAINING MATERIAL FOR PRODUCING NATIONAL HUMAN DEVELOPMENT REPORTS Inequality-adjusted Human Development Index (IHDI) 1 Purpose: To adjust the HDI for inequality, such that it better reflects the actual
DEPARTMENT OF GLOBAL STUDIES AND GEOGRAPHY COURSES OFFERED - SPRING 17 SEMESTER GEOGRAPHY
 DEPARTMENT OF GLOBAL STUDIES AND GEOGRAPHY COURSES OFFERED - SPRING 17 SEMESTER What Should You Take First? GEOGRAPHY Besides our Senior Seminars (and Geog 160), our classes can be taken at any time, whether
Fertility Transitions and Wealth in Comparative Perspective. Sarah Staveteig. Demographic and Health Surveys, Futures Institute PRELIMINARY DRAFT
 Fertility Transitions and Wealth in Comparative Perspective Sarah Staveteig Demographic and Health Surveys, Futures Institute PRELIMINARY DRAFT April 2014 PAA 2014 Session 23: Fertility Transitions Sarah
Essential Academic Skills Subtest III: Mathematics (003)
") Essential Academic Skills Subtest III: Mathematics (003) NES, the NES logo, Pearson, the Pearson logo, and National Evaluation Series are trademarks in the U.S. and/or other countries of Pearson Education,
Essential Academic Skills Subtest III: Mathematics (003) NES, the NES logo, Pearson, the Pearson logo, and National Evaluation Series are trademarks in the U.S. and/or other countries of Pearson Education,
ESCAP Promotes Geo-referenced Information System for Disaster Risk Management in Asia and the Pacific
 Third High Level Forum on UNGGIM 22-24 October 2014 Beijing, China ESCAP Promotes Geo-referenced Information System for Disaster Risk Management in Asia and the Pacific Keran Wang Space Applications Section,
UN-OHRLLS. Opening Statement for. Ms. Fekitamoeloa Katoa Utoikamanu. High Representative and Under-Secretary-General
 Please check against delivery UN-OHRLLS Opening Statement for Ms. Fekitamoeloa Katoa Utoikamanu High Representative and Under-Secretary-General Least Developed Countries, Landlocked Developing Countries
January 2018 Special Preview Edition
 January 2018 Special Preview Edition What s inside this booklet? The contents you ll explore 2 Americas 4 Europe 6 Far East & Oceania 8 Central & South Asia 10 Africa & Middle East 12 International 14
ADePT Software platform for Automated Economic Analysis
 ADePT Software platform for Automated Economic Analysis Michael Lokshin, Zurab Sajaia and Sergiy Radyakin DECRG-PO The World Bank Step 1: Data and Output Step 2: Household variables Step 3: Individual
COMPOUND INEQUALITIES
 13 (3 1) Chapter 3 Inequalities in One Variable 95. Designer jeans. A pair of ordinary jeans at A-Mart costs $50 less than a pair of designer jeans at Enrico s. In fact, you can buy four pairs of A-Mart
Impact Evaluation of Mindspark Centres
 Impact Evaluation of Mindspark Centres March 27th, 2014 Executive Summary About Educational Initiatives and Mindspark Educational Initiatives (EI) is a prominent education organization in India with the
JOINT STRATEGIC NEEDS ASSESSMENT (JSNA) Key findings from the Leicestershire JSNA and Charnwood summary
 Key findings from the Leicestershire JSNA and Charnwood summary") JOINT STRATEGIC NEEDS ASSESSMENT (JSNA) Key findings from the Leicestershire JSNA and Charnwood summary 1 What is a JSNA? Joint Strategic Needs Assessment (JSNA) identifies the big picture in terms of
JOINT STRATEGIC NEEDS ASSESSMENT (JSNA) Key findings from the Leicestershire JSNA and Charnwood summary 1 What is a JSNA? Joint Strategic Needs Assessment (JSNA) identifies the big picture in terms of
Index. Bogota, Colombia, 91 Burundi, 31 Business enterprises, impact of access to infrastructure on, 62
 Index A Afghanistan, 31, 40, 43, 50 Africa, 2, 33, 40, 53, 91, 124 Sub-Saharan, 3, 23, 24, 86 African Development Bank, 47, 69, 112 115 Anna Karenina ( Leo Tolstoy), 52 Arab Spring, 54 Armed conflict,
TOPICS IN MEASUREMENT: MULTIDIMENSIONAL POVERTY AND POLARIZATION. Shabana Mitra. Dissertation. Submitted to the Faculty of the
 TOPICS IN MEASUREMENT: MULTIDIMENSIONAL POVERTY AND POLARIZATION By Shabana Mitra Dissertation Submitted to the Faculty of the Graduate School of Vanderbilt University in partial fulfillment of the requirements
CHAPTER ONE INTRODUCTION TO POVERTY
 1 CHAPTER ONE INTRODUCTION TO POVERTY 2 1.1 INTRODUCTION The 2006 Nobel Peace laureate Muhammad Yunus argues that poverty should not be part of any civilized society. In a speech delivered on the occasion
Differences in Differences (Dif-in and Panel Data. Technical Session III. Manila, December Manila, December Christel Vermeersch
 Technical Session III Differences in Differences (Dif-in in-dif) and Panel Data Christel Vermeersch Manila, December 2008 Manila, December 2008 Human Development Network East Asia and the Pacific Region
Market access and rural poverty in Tanzania
 Market access and rural poverty in Tanzania Nicholas Minot International Food Policy Research Institute 2033 K St. NW Washington, D.C., U.S.A. Phone: +1 202 862-8199 Email: n.minot@cgiar.org Contributed
Identify the scale of measurement most appropriate for each of the following variables. (Use A = nominal, B = ordinal, C = interval, D = ratio.
 Answers to Items from Problem Set 1 Item 1 Identify the scale of measurement most appropriate for each of the following variables. (Use A = nominal, B = ordinal, C = interval, D = ratio.) a. response latency
Natural Disasters in Member Countries (2002 Summary)
") 4.2 Member Countries and their Disaster Characteristics: Table 5: Natural Disasters in Member Countries (2002 Summary) (Country/Disaster Type/Disaster Characteristics) Data Country DisType Count of TotAff
4.2 Member Countries and their Disaster Characteristics: Table 5: Natural Disasters in Member Countries (2002 Summary) (Country/Disaster Type/Disaster Characteristics) Data Country DisType Count of TotAff
Scaling Seed Kits Through Household Gardens
 Scaling Seed Kits Through Household Gardens SENEGAL WESTERN SAHARA LIBERIA PORTUGAL REPULIC OF IRELAND COTE D IVOIRE UNITED KINGDOM GHANA NETHERLANDS BELGIUM DENMARK SWITZ. TUNISIA CAMEROON CZECH REPUBLIC
A Multidimensional Poverty Measure for the Hindu Kush Himalayas, Applied to Selected Districts in Nepal
 A Multidimensional Poverty Measure for the Hindu Kush Himalayas, Applied to Selected Districts in Nepal Author(s): Jean-Yves Gerlitz, Mauricio Apablaza, Brigitte Hoermann, Kiran Hunzai, and Lynn Bennett
What is the association of between the two variables? In what direction does the association go?
 Common Core Standard: 8.SP.4 What is the association of between the two variables? In what direction does the association go? How strong is the association between the two variables? CPM Materials modified
Marketing Research Session 10 Hypothesis Testing with Simple Random samples (Chapter 12)
") Marketing Research Session 10 Hypothesis Testing with Simple Random samples (Chapter 12) Remember: Z.05 = 1.645, Z.01 = 2.33 We will only cover one-sided hypothesis testing (cases 12.3, 12.4.2, 12.5.2,
Marketing Research Session 10 Hypothesis Testing with Simple Random samples (Chapter 12) Remember: Z.05 = 1.645, Z.01 = 2.33 We will only cover one-sided hypothesis testing (cases 12.3, 12.4.2, 12.5.2,
Global Urbanization Today: Low- and Middle-Income Countries
 Global Urbanization Today: Low- and Middle-Income Countries Mark R. Montgomery Stony Brook University and Population Council, NY May 25, 2015 Montgomery (Stony Brook UniversityandPopulation Council, NY)Urban
Central Valley School District Social Studies Curriculum Map Grade 7. August - September
 August - September Geographical/Historical Skills Identify and analyze timelines. Construct and use cause and effect charts. Differentiate between fact and opinion. Use of word webs, flip charts, outlines
Secondary Towns and Poverty Reduction: Refocusing the Urbanization Agenda
 Secondary Towns and Poverty Reduction: Refocusing the Urbanization Agenda Luc Christiaensen and Ravi Kanbur World Bank Cornell Conference Washington, DC 18 19May, 2016 losure Authorized Public Disclosure
United Nations, UNGEGN, and support for national geographical names standardization programmes
 Philippines, 2018 United Nations, UNGEGN, and support for national geographical names standardization programmes Helen Kerfoot, UNGEGN Cecille Blake, UNGEGN Secretariat What is important to know? Background
WORLD COUNCIL ON CITY DATA
 WORLD COUNCIL ON CITY DATA WCCD ISO 37120 STANDARDIZED CITY DATA TO MEET UN SDG TARGETS UN WORLD DATA FORUM Presented by: James Patava www.dataforcities.org @wccitydata PUBLICATION OF THE FIRST ISO STANDARD
ECON 361 Assignment 1 Solutions
 ECON 361 Assignment 1 Solutions Instructor: David Rosé Queen s University, Department of Economics Due: February 9th, 2017 1. [22] Poverty Measures: (a) [3] Consider a distribution of income over a sample
November 29, World Urban Forum 6. Prosperity of Cities: Balancing Ecology, Economy and Equity. Concept Note
 November 29, 2010 World Urban Forum 6 Prosperity of Cities: Balancing Ecology, Economy and Equity Concept Note 1 CONTENT Thematic Continuity Conceptualizing the Theme The 6 Domains of Prosperity The WUF
Data Presentation. Naureen Ghani. May 4, 2018
 Data Presentation Naureen Ghani May 4, 2018 Data is only as good as how it is presented. How do you take hundreds or thousands of data points and create something a human can understand? This is a problem