Food Price Shocks and Poverty: The Left Hand Side
|
|
|
- Oswald Carson
- 6 years ago
- Views:
Transcription
1 Food Price Shocks and Poverty: The Left Hand Side James E. Foster The George Washington University and OPHI Oxford Washington, DC, September
2 Motivation Why Policy Concern? Indeed: prices change all the time People substitute when they can, and experience changes in real income when they can t Where is the policy issue?
3 Motivation Large Changes in Food Prices Can have large absolute effect on real incomes and poverty Poor and near poor are vulnerable since budget share on food is high Compounding deprivation with more deprivation Mitigating factors: Supplier of food or employed in sector Traditional poverty measures
4 Motivation Large Changes in Food Prices Can also have direct effects on food consumption and nutrition (and on capability of avoiding malnutrition) Irreversible effects, especially on children In extreme cases, irreversible effects on all A multidimensional proposal
5 Motivation Large Changes in Food Prices Can also affect other consumption/investment and key development indicators Enrollment and education of children Assets Recovery possible but difficult MPI?
6 Outline Income Poverty Food Poverty Multiple Dimensions Discussion
7 Price Shocks and Income Poverty Measuring the impacts In terms of real incomes and poverty Convert price change into income change via CV Adjust nominal income Determine poverty status Aggregate via, say, FGT Examples Chico, Ivanic et al (2011)
8 Review: Income Poverty Framework Goal Sen 1976 identification and aggregation Poverty measure P(.) Variable income Identification poverty line Aggregation Foster-Greer-Thorbecke 1984 see also Foster, Greer, and Thorbecke 2010
9 Review: Income Poverty Example Incomes y = (7,3,4,8) Poverty line z = 5 Deprivation vector g 0 = (0,1,1,0) Headcount ratio P 0 = µ (g 0 ) = 2/4 prevalence Normalized gap vector g 1 = (0, 2/5, 1/5, 0) Poverty gap = P 1 = µ (g 1 ) = 3/20 Squared gap vector g 2 = (0, 4/25, 1/25, 0) FGT Measure = P 2 = µ (g 2 ) = 5/100 depth severity Decomposable across population groups Region Ultrapoor
10 Price Shocks and Income Poverty Pros Income poverty is salient concept Powerful technology for prediction and evaluation Micro theory based Respects preferences
11 Price Shocks and Income Poverty Cons Base price matters Utility/price indices not data, yet crucial especially when relative prices are very different (not as important if relative prices only change a little) Surely utility function varies across persons. adjusted income distribution not known uncertain poverty levels Resource poverty what could be not what is decomposition by expenditure type
12 Price Shocks and Food Poverty Measuring the impacts In terms of food consumption and food poverty Quantity index, caloric content, or anthropomorphic measures Aggregate via FGT Examples our original paper used calories not income to evaluate food poverty in Kenya other unidimensional variables possible Gundersen (2008)
13 Price Shocks and Food Poverty Pros Focus on key policy variable Particularly useful for surveillance Measures what is
14 Price Shocks and Food Poverty Cons Nutrition is multidimensional (Joachim von Braun) Ex: Calories, protein, iron, vitamin A, etc Incommensurate and limited substitutability aggregating achievements may make no sense however, monitoring aggregate deprivations could make sense
15 Question Can the FGT food poverty index be generalized to obtain a multidimensional index of food poverty? Idea: Apply methods based on Alkire Foster J Pub E 2011 Counting and Multidimensional Poverty Measurement
16 Overview of this Approach Identification Dual cutoffs Deprivation cutoffs each deprivation counts Poverty cutoff in terms of breadth of deprivation Aggregation Adjusted FGT Reduces to FGT in single variable case Background papers Alkire and Foster Counting and Multidimensional Poverty Measurement forthcoming Journal of Public Economics Alkire and Santos Acute Multidimensional Poverty: A new Index for Developing Countries OPHI WP 38, background for HDR 2010 Alkire and Foster Understandings and Misunderstandings of Multidimensional Poverty Measurement Journal of Economic Inequality
17 Multidimensional Data Matrix of achievements for n persons in d domains
18 Multidimensional Data Matrix of achievements for n persons in d domains y = Domains Persons
19 Multidimensional Data Matrix of achievements for n persons in d domains y = Domains Persons z ( ) Cutoffs
20 Multidimensional Data Matrix of achievements for n persons in d domains y = Domains Persons These entries fall below cutoffs z ( ) Cutoffs
21 Deprivation Matrix Replace entries: 1 if deprived, 0 if not deprived y = Domains Persons
22 Deprivation Matrix Replace entries: 1 if deprived, 0 if not deprived g 0 = Domains Persons
23 Normalized Gap Matrix Matrix of achievements for n persons in d domains y = Domains Persons These entries fall below cutoffs z ( ) Cutoffs
24 Normalized Gap Matrix Normalized gap = (z j - y ji )/z j if deprived, 0 if not deprived y = Domains Persons These entries fall below cutoffs z ( ) Cutoffs
25 Normalized Gap Matrix Normalized gap = (z j - y ji )/z j if deprived, 0 if not deprived g 1 = Domains Persons
26 Squared Gap Matrix Squared gap = [(z j - y ji )/z j ] 2 if deprived, 0 if not deprived g 1 = Domains Persons
27 Squared Gap Matrix Squared gap = [(z j - y ji )/z j ] 2 if deprived, 0 if not deprived g 2 = Domains Persons
28 Identification g 0 = Domains Persons Matrix of deprivations
29 Identification Counting Deprivations g 0 = Domains c Persons
30 Identification Counting Deprivations Q/ Who is poor? g 0 = Domains c Persons
31 Identification Union Approach Q/ Who is poor? A1/ Poor if deprived in any dimension c i 1 g 0 = Domains c Persons
32 Identification Union Approach Q/ Who is poor? A1/ Poor if deprived in any dimension c i 1 g 0 = Domains c Persons
33 Identification Intersection Approach Q/ Who is poor? A2/ Poor if deprived in all dimensions c i = d g 0 = Domains c Persons
34 Identification Dual Cutoff Approach Q/ Who is poor? A/ Fix cutoff k, identify as poor if c i > k g 0 = Domains c Persons
35 Identification Dual Cutoff Approach Q/ Who is poor? A/ Fix cutoff k, identify as poor if c i > k (Ex: k = 2) g 0 = Domains c Persons
36 Identification Dual Cutoff Approach Q/ Who is poor? A/ Fix cutoff k, identify as poor if c i > k (Ex: k = 2) Domains g = Note Includes both union and intersection c Persons
37 Identification Dual Cutoff Approach Q/ Who is poor? A/ Fix cutoff k, identify as poor if c i > k (Ex: k = 2) Domains c g = Persons Note Includes both union and intersection Especially useful when number of dimensions is large Union becomes too large, intersection too small
38 Identification Dual Cutoff Approach Q/ Who is poor? A/ Fix cutoff k, identify as poor if c i > k (Ex: k = 2) Domains c g = Persons Note Includes both union and intersection Especially useful when number of dimensions is large Union becomes too large, intersection too small Next step - aggregate into an overall measure of poverty
39 Aggregation g 0 = Domains c Persons
40 Aggregation Censor data of nonpoor g 0 = Domains c Persons
41 Aggregation Censor data of nonpoor g 0 (k) = Domains c(k) Persons
42 Aggregation Censor data of nonpoor g 0 (k) = Domains c(k) Persons Similarly for g 1 (k), etc
43 Aggregation Headcount Ratio g 0 (k) = Domains c(k) Persons
44 Aggregation Headcount Ratio g 0 (k) = Domains c(k) Persons Two poor persons out of four: H = ½ incidence
45 Critique Suppose the number of deprivations rises for person 2 g 0 (k) = Domains c(k) Persons Two poor persons out of four: H = ½ incidence
46 Critique Suppose the number of deprivations rises for person 2 g 0 (k) = Domains c(k) Persons Two poor persons out of four: H = ½ incidence
47 Critique Suppose the number of deprivations rises for person 2 g 0 (k) = Domains c(k) Persons Two poor persons out of four: H = ½ incidence No change!
48 Critique Suppose the number of deprivations rises for person 2 g 0 (k) = Domains c(k) Persons Two poor persons out of four: H = ½ incidence No change! Violates dimensional monotonicity
49 Aggregation Return to the original matrix g 0 (k) = Domains c(k) Persons
50 Aggregation Return to the original matrix g 0 (k) = Domains c(k) Persons
51 Aggregation Need to augment information g 0 (k) = Domains c(k) Persons
52 Aggregation Need to augment information deprivation share g 0 (k) = Domains c(k) c(k)/d 2/ 4 Persons 4/ 4
53 Aggregation Need to augment information Domains g 0 (k) = deprivation share intensity c(k) c(k)/d 0 2 2/ 4 Persons 4 4/ 4 0 A = average intensity among poor = 3/4
54 Aggregation Adjusted Headcount Ratio Adjusted Headcount Ratio = M 0 = HA g 0 (k) = Domains c(k) c(k)/d 2/ 4 Persons 4/ 4 A = average intensity among poor = 3/4
55 Aggregation Adjusted Headcount Ratio Adjusted Headcount Ratio = M 0 = HA = µ (g 0 (k)) g 0 (k) = Domains c(k) c(k)/d 2/ 4 Persons 4/ 4 A = average intensity among poor = 3/4
56 Aggregation Adjusted Headcount Ratio Adjusted Headcount Ratio = M 0 = HA = µ (g 0 (k)) = 6/16 =.375 g 0 (k) = Domains c(k) c(k)/d 2/ 4 Persons 4/ 4 A = average intensity among poor = 3/4
57 Aggregation Adjusted Headcount Ratio Adjusted Headcount Ratio = M 0 = HA = µ (g 0 (k)) = 6/16 =.375 g 0 (k) = Domains c(k) c(k)/d 2/ 4 Persons 4/ 4 A = average intensity among poor = 3/4 Note: if person 2 has an additional deprivation, M 0 rises
58 Aggregation Adjusted Headcount Ratio Adjusted Headcount Ratio = M 0 = HA = µ (g 0 (k)) = 6/16 =.375 g 0 (k) = Domains c(k) c(k)/d 2/ 4 Persons 4/ 4 A = average intensity among poor = 3/4 Note: if person 2 has an additional deprivation, M 0 rises Satisfies dimensional monotonicity
59 Adjusted Headcount Ratio Note M 0 requires only ordinal information. Q/ What if data are cardinal? How to incorporate information on depth of deprivation?
60 Aggregation: Adjusted Poverty Gap Augment information of M 0 using normalized gaps g 1 (k) = Domains Persons
61 Aggregation: Adjusted Poverty Gap Augment information of M 0 using normalized gaps g 1 (k) = Domains Persons Average gap across all deprived dimensions of the poor: G = ( ) / 6
62 Aggregation: Adjusted Poverty Gap Adjusted Poverty Gap = M 1 = M 0 G = HAG g 1 (k) = Domains Persons Average gap across all deprived dimensions of the poor: G = ( ) / 6
63 Aggregation: Adjusted Poverty Gap Adjusted Poverty Gap = M 1 = M 0 G = HAG = µ (g 1 (k)) g 1 (k) = Domains Persons Average gap across all deprived dimensions of the poor: G = ( ) / 6
64 Aggregation: Adjusted Poverty Gap Adjusted Poverty Gap = M 1 = M 0 G = HAG = µ (g 1 (k)) g 1 (k) = Domains Persons Obviously, if in a deprived dimension, a poor person becomes even more deprived, then M 1 will rise.
65 Aggregation: Adjusted Poverty Gap Adjusted Poverty Gap = M 1 = M 0 G = HAG = µ (g 1 (k)) g 1 (k) = Domains Persons Obviously, if in a deprived dimension, a poor person becomes even more deprived, then M 1 will rise. Satisfies monotonicity reflects incidence, intensity, depth
66 Aggregation: Adjusted FGT Consider the matrix of squared gaps g 1 (k) = Domains Persons
67 Aggregation: Adjusted FGT Consider the matrix of squared gaps Domains g 2 (k)= Persons
68 Aggregation: Adjusted FGT Adjusted FGT is M 2 = µ (g 2 (k)) Domains g 2 (k)= Persons
69 Aggregation: Adjusted FGT Adjusted FGT is M 2 = µ (g 2 (k)) Domains g 2 (k)= Persons Satisfies transfer axiom reflects incidence, intensity, depth, severity focuses on most deprived
70 Overview Concept - Poverty as multiple deprivation Mirrors identification used by NGOs BRAC Depends on joint distribution Transparent Can be implemented at any level Cross country MPI in the 2010 HDR Includes: Nutrition, enrollment, assets Within country Mexico*, Colombia, Bhutan, etc. Local village level Participatory methods India, Bhutan, etc Evaluation Impacts on poverty
71 Proposal Multidimensional measure of food poverty Pros Cons Dimensions and indicators Deprivation cutoffs Weights Poverty cutoff All pieces on the table Robust to cutoffs Readily linked to existing poverty methods Limited substitution natural in this context
72 Food Price Shocks and the MPI? Prices Shocks and MPI Poverty?
73 Other Issues Chronic and Transient Effects Substitution Quantity, quality, time Ultrapoor Intra-Household Impacts Just in Time Data and Forecasting Endogenous Policies Parameter Insurance?
74 Thank you
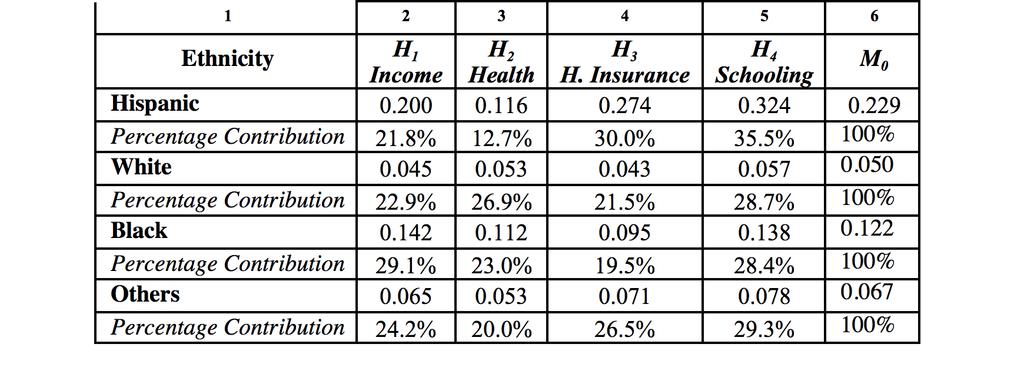
75 Illustration: USA Data Source: National Health Interview Survey, 2004, United States Department of Health and Human Services. National Center for Health Statistics - ICPSR Tables Generated By: Suman Seth. Unit of Analysis: Individual. Number of Observations: Variables: (1) income measured in poverty line increments and grouped into 15 categories (2) self-reported health (3) health insurance (4) years of schooling.
76 Illustration: USA Profile of US Poverty by Ethnic/Racial Group
77 Illustration: USA Profile of US Poverty by Ethnic/Racial Group
78 Illustration: USA Profile of US Poverty by Ethnic/Racial Group
79 Illustration: USA Profile of US Poverty by Ethnic/Racial Group
80 Illustration: USA Profile of US Poverty by Ethnic/Racial Group
81 Illustration: USA Profile of US Poverty by Ethnic/Racial Group
82 Illustration: USA

83 Illustration: MPI

84 MPI and Traditional Headcount Ratios
85 Weights Weighted identification Weight on first dimension (say income): 2 Weight on other three dimensions: 2/3 Cutoff k = 2 Poor if income poor, or suffer three or more deprivations Cutoff k = 2.5 (or make inequality strict) Poor if income poor and suffer one or more other deprivations Nolan, Brian and Christopher T. Whelan, Resources, Deprivation and Poverty, 1996 Weighted aggregation Weighted intensity otherwise same
86 Caveats and Observations Identification No tradeoffs across dimensions Can t eat a house Measuring what is rather than what could be Fundamentally multidimensional each deprivation matters Need to set deprivation cutoffs Need to set weights select dimensions Need to set poverty cutoff across dimension Lots of parts: Robustness?

 or every dimension (assets, health, education, and empowerment, in")
87 Sub-Sahara Africa: Robustness Across k Burkina is always poorer than Guinea, regardless of whether we count as poor persons who are deprived in only one kind of assets (0.25) or every dimension (assets, health, education, and empowerment, in this example). (DHS Data used) Batana, OPHI WP 13
88 Caveats and Observations Aggregation Neutral Ignores coupling of disadvantages Not substitutes, not complements Discontinuities More frequent, less abrupt
89 Advantages Intuitive Transparent Flexible MPI Acute poverty Country Specific Measures Policy impact and good governance Targeting Accounting structure for evaluating policies Participatory tool
90 Understandings and Misunderstandings Data Requirements: Single survey sourcing Depends on joint distribution, need information on joint dist. Q: What if best available data are in different datasets? A: Not best available data Ex: Elasticity exercise with best available price data from one source and best available quantity data from another Ex: Unlinked expenditure surveys
91 Understandings and Misunderstandings Adjusted Headcount Ratio vs. MPI vs. HDI Adjusted headcount ratio M 0 general methodology MPI a specific implementation for cross-country comparisons HDI not a poverty measure
92 Understandings and Misunderstandings Underpinnings: Poverty and Welfare Firmly rooted in axiomatic poverty analysis Evaluate methods via axioms satisfied and violated MPI a specific implementation Adjusted headcount ratio crude (like unidimensional headcount ratio) not directly linked to welfare (ditto) conveys tangible information transparent parameters
93 Understandings and Misunderstandings Calibration: Who chooses the parameters? See country studies Context dependent
94 Revisit Objectives Desiderata It must understandable and easy to describe It must conform to a common sense notion of poverty It must fit the purpose for which it is being developed It must be technically solid It must be operationally viable It must be easily replicable What do you think?
95 Thank you
96 Poverty Measurement Framework Goals Sen 1976 identification and aggregation Who is poor? targeting How much poverty? in any population
97 Poverty Measurement Suppose Single variable calories, income or aggregate expend. Unidimensional methods Identification poverty line Aggregation Foster-Greer-Thorbecke 1984, 2010 Note Decomposability Robustness
98 Poverty Measurement Suppose Many variables How to measure poverty? Answer If variables can be meaningfully aggregated into some overall resource or achievement variable can use unidimensional methods
99 Poverty Measurement Examples Welfare aggregation Construct each person s welfare function Set cutoff and apply unidimensional poverty index Many assumptions needed Alkire and Foster (2010) Designing the Inequality- Adjusted Human Development Index Ordinal variables problematic
100 Poverty Measurement Examples Price aggregation Construct each person s expenditure level Set cutoff and apply unidimensional poverty index Many assumptions needed Ordinal and nonmarket variables problematic Link to welfare tenuous (local and unidirectional)
101 Poverty Measurement Suppose Many variables that cannot be meaningfully aggregated into some overall resource or achievement variable. How to measure poverty? Answers? Blinders Limit consideration to a subset that can be aggregated, and use unidimensional methods. Key dimensions ignored Marginal methods Apply unidimensional methods separately to one or more variables in turn. Inadequate identification. Ignores joint distribution.
102 Hypothetical Challenge A government would like to create an official multidimensional poverty indicator Desiderata It must understandable and easy to describe It must conform to a common sense notion of poverty It must fit the purpose for which it is being developed It must be technically solid It must be operationally viable It must be easily replicable What would you advise?
103 Not So Hypothetical 2006 Mexico Law: must alter official poverty methods Include six other dimensions education, dwelling space, dwelling services, access to food, access to health services, access to social security 2007 Oxford Alkire and Foster Counting and Multidimensional Poverty Measurement 2009 Mexico Announces official methodology; Ricardo Aparicio will discuss
104 Continued Interest 2008 Bhutan Gross National Happiness Index 2010 Chile Conference (May) 2010 London Release of MPI by UNDP and OPHI (July) Colombia Conference; Roberto Angulo will discuss OPHI and GW Workshops: Missing dimensions; Weights; Country applications; Other measures; Targeting; Robustness; Rights/poverty; Ultrapoverty Training: 40 officials from 28 countries Washington DC World Bank (several), IDB (several), USAID, CGD, OECD
105 Price Shocks and Income Poverty Pros Income poverty is salient concept Powerful technology for prediction and evaluation Micro theory based Respects preferences
Evaluating Dimensional and Distributional Contributions to Multidimensional Poverty
 Evaluating Dimensional and Distributional Contributions to Multidimensional Poverty Social Choice and Welfare Conference 2014, Boston College Sabina Alkire James E. Foster OPHI, Oxford George Washington
Counting and Multidimensional Poverty Measurement
 Counting and Multidimensional Poverty Measurement by Sabina Alkire and James Foster QEH 31 May 2007 Why Multidimensional Poverty? Appealing conceptual framework Capabilities Data availability Tools Poverty
The Role of Inequality in Poverty Measurement
 The Role of Inequality in Poverty Measurement Sabina Alkire Director, OPHI, Oxford James E. Foster Carr Professor, George Washington Research Associate, OPHI, Oxford WIDER Development Conference Helsinki,
Multidimensional Poverty Measurement and Analysis
 Multidimensional Poverty Measurement and Analysis Sabina Alkire, James Foster, Suman Seth, Maria Emma Santos, José Manuel Roche and Paola Ballon 22 June 25 University of Oxford Multidimensional Measurement
OPHI WORKING PAPER NO. 100
 Oxford Poverty & Human Development Initiative (OPHI) Oxford Department of International Development Queen Elizabeth House (QEH), University of Oxford OPHI WORKING PAPER NO. 100 to Multidimensional Poverty
Summer School on Multidimensional Poverty Analysis
 Summer School on Multidimensional Poverty Analysis 1 12 August 2016 Beijing, China Interpreting the MPI Results Adriana Conconi (OPHI) Motivation Policy Interest Why? 1. Intuitive easy to understand 2.
Decomposing changes in multidimensional poverty in 10 countries.
 Decomposing changes in multidimensional poverty in 10 countries. Mauricio Apablaza y University of Nottingham Gaston Yalonetzky z Oxford Poverty and Human Development Initiative, University of Oxford Juan
MPI and Multidimensional Poverty Analysis What we knew before joining West Bank and Gaza Poverty Assessment team. Nobuo Yoshida April 21, 2011
 MPI and Multidimensional Poverty Analysis What we knew before joining West Bank and Gaza Poverty Assessment team Nobuo Yoshida April 21, 2011 Multidimensional poverty analysis and Oxford-UNDP MPI In July,
Data Requirements in Multidimensional Poverty Measurement
 Data Requirements in Multidimensional Poverty Measurement Oxford Poverty & Human Development Initiative (OPHI) University of Oxford Rabat, 4 June 2014 Limits of the current global MPI surveys: DHS, MICS
Robust Multidimensional Poverty Comparisons
 Robust Multidimensional Poverty Comparisons by Jean-Yves Duclos Department of Economics and CIRPÉE, Université Laval, Canada, David Sahn Food and Nutrition Policy Program, Cornell University and Stephen
On Measuring Growth and Inequality. Components of Changes in Poverty. with Application to Thailand
 On Measuring Growth and Inequality Components of Changes in Poverty with Application to Thailand decomp 5/10/97 ON MEASURING GROWTH AND INEQUALITY COMPONENTS OF POVERTY WITH APPLICATION TO THAILAND by
Poverty statistics in Mongolia
 HIGH-LEVEL SEMINAR ON HARMONISATION OF POVERTY STATISTICS IN CIS COUNTRIES SOCHI (RUSSIAN FEDERATION) Poverty statistics in Mongolia Oyunchimeg Dandar Director Population and Social Statistics Department,
Growth in India: An Analysis Using Elasticities
 Multidimensional Poverty and Inclusive Growth in India: An Analysis Using Elasticities Sabina Alkire and Suman Seth University of Oxford November 10, 2014 Motivation India maintained higher economic growth
Consistent multidimensional poverty comparisons
 Preliminary version - Please do not distribute Consistent multidimensional poverty comparisons Kristof Bosmans a Luc Lauwers b Erwin Ooghe b a Department of Economics, Maastricht University, Tongersestraat
Selection of small area estimation method for Poverty Mapping: A Conceptual Framework
 Selection of small area estimation method for Poverty Mapping: A Conceptual Framework Sumonkanti Das National Institute for Applied Statistics Research Australia University of Wollongong The First Asian
OPHI WORKING PAPER NO. 77
 Oxford Poverty & Human Development Initiative (OPHI) Oxford Department of International Development Queen Elizabeth House (QEH), University of Oxford OPHI WORKING PAPER NO. 77 Did Poverty Reduction Reach
Poverty comparisons with endogenous absolute poverty lines
 Poverty comparisons with endogenous absolute poverty lines Kenneth R. Simler Research Fellow Food Consumption and Nutrition Division International Food Policy Research Institute 2033 K Street, NW Washington,
Comparison of Multidimensional Measurements of Poverty Analysis: Cross Sectional Data Evidence from Tigray
 Comparison of Multidimensional Measurements of Poverty Analysis: Cross Sectional Data Evidence from Tigray Gebretsadik Hishe Gebreslassie Lecturer in Economics, Adigrat University, Ethiopia Abstract This
Distribution-sensitive multidimensional poverty measures with an application to India
 DEPARTMENT OF ECONOMICS ISSN 1441-5429 DISCUSSION PAPER 06/17 Distribution-sensitive multidimensional poverty measures with an application to India Gaurav Datt* Abstract: This paper presents axiomatic
Poverty, Inequality and Growth: Empirical Issues
 Poverty, Inequality and Growth: Empirical Issues Start with a SWF V (x 1,x 2,...,x N ). Axiomatic approaches are commen, and axioms often include 1. V is non-decreasing 2. V is symmetric (anonymous) 3.
OPHI WORKING PAPER NO. 90
 Oxford Poverty & Human Development Initiative (OPHI) Oxford Department of International Development Queen Elizabeth House (QEH), University of Oxford OPHI WORKING PAPER NO. 90 Multidimensional Poverty
Summary prepared by Amie Gaye: UNDP Human Development Report Office
 Contribution to Beyond Gross Domestic Product (GDP) Name of the indicator/method: The Human Development Index (HDI) Summary prepared by Amie Gaye: UNDP Human Development Report Office Date: August, 2011
Adjusting the HDI for Inequality: An Overview of Different Approaches, Data Issues, and Interpretations
 Adjusting the HDI for Inequality: An Overview of Different Approaches, Data Issues, and Interpretations Milorad Kovacevic Statistical Unit, HDRO HDRO Brown bag Seminar, September 28, 2009 1/33 OBJECTIVES:
Index. Bogota, Colombia, 91 Burundi, 31 Business enterprises, impact of access to infrastructure on, 62
 Index A Afghanistan, 31, 40, 43, 50 Africa, 2, 33, 40, 53, 91, 124 Sub-Saharan, 3, 23, 24, 86 African Development Bank, 47, 69, 112 115 Anna Karenina ( Leo Tolstoy), 52 Arab Spring, 54 Armed conflict,
Sensitivity of Multidimensional Poverty Index in Pakistan Farzana Naheed Khan a and Shaista Akram b
 98 THE PAKISTAN JOURNAL OF SOCIAL ISSUES Special Issue (June 2018) Sensitivity of Multidimensional Poverty Index in Pakistan Farzana Naheed Khan a and Shaista Akram b Abstract The study estimates multidimentional
COMPUTATIONAL TOOLS FOR POVERTY MEASUREMENT AND ANALYSIS
 FCND DISCUSSION PAPER NO. 50 COMPUTATIONAL TOOLS FOR POVERTY MEASUREMENT AND ANALYSIS Gaurav Datt Food Consumption and Nutrition Division International Food Policy Research Institute 2033 K Street, N.W.
On the Mean of Squared Deprivation Gaps
 On the Mean of Squared Deprivation Gaps Achin Chakraborty Institute of Development Studies Kolkata,1, Reformatory Street Calcutta University Alipore Campus, 5th Floor, Kolkata - 700027, India E-mail: achin@idsk.org
EVALUATING THE TOURIST SATISFACTION IN FIVE FAMOUS ITALIAN CITIES
 Rivista Italiana di Economia Demografia e Statistica Volume LXXIII n. 1 Gennaio-Marzo 219 EVALUATING THE TOURIST SATISFACTION IN FIVE FAMOUS ITALIAN CITIES Mariateresa Ciommi, Gennaro Punzo, Gaetano Musella
Inequality, poverty and redistribution
 Inequality, poverty and redistribution EC426 http://darp.lse.ac.uk/ec426 17 February 2014 Issues Key questions about distributional tools Inequality measures what can they tell us about recent within-country
Measuring Poverty. Introduction
 Measuring Poverty Introduction To measure something, we need to provide answers to the following basic questions: 1. What are we going to measure? Poverty? So, what is poverty? 2. Who wants to measure
Multi-dimensional Human Development Measures : Trade-offs and Inequality
 Multi-dimensional Human Development Measures : Trade-offs and Inequality presented by Jaya Krishnakumar University of Geneva UNDP Workshop on Measuring Human Development June 14, 2013 GIZ, Eschborn, Frankfurt
Multidimensional inequality comparisons
 Multidimensional inequality comparisons Jean-Yves Duclos, David E. Sahn and Stephen D. Younger February 5, 29 Abstract Keywords:. JEL Classification:. Institut d Anàlisi Econòmica (CSIC), Barcelona, Spain,
Measuring the Standard of Living: Uncertainty about Its Development
 Measuring the Standard of Living: Uncertainty about Its Development Wulf Gaertner Department of Economics, University of Osnabrück D 49069 Osnabrück, Germany E-mail: WGaertner@oec.uni-osnabrueck.de Yongsheng
REVIEWER S APPENDIX for: Why Isn t the Doha Development Agenda More Poverty Friendly? *
 Revised, March 21, 2008 REVIEWER S APPENDIX for: Why Isn t the Doha Development Agenda More Poverty Friendly? * by Thomas W. Hertel** and Roman Keeney Purdue University, Maros Ivanic, GOIC, Doha and L.
Poverty Maps: Uses and Caveats. Tara Vishwanath Lead Economist World Bank
 Poverty Maps: Uses and Caveats Tara Vishwanath Lead Economist World Bank Uses of Poverty Maps A visual illustration of estimated poverty indices at DS division level or below (currently excluding N-E E
OPHI WORKING PAPER NO. 47
 Oxford Poverty & Human Development Initiative (OPHI) Oxford Department of International Development Queen Elizabeth House (QEH), University of Oxford OPHI WORKING PAPER NO. 47 Multidimensional Poverty:
Poverty and Distributional Outcomes of Shocks and Policies
 Poverty and Distributional Outcomes of Shocks and Policies B. Essama-Nssah Poverty Reduction Group (PRMPR) The World Bank May, 006 Foreword The effect of ignoring the interpersonal variations can, in fact,
OPHI Research in Progress series 2008
 Oxford Poverty & Human Development Initiative (OPHI) Oxford Department of International Development Queen Elizabeth House (QEH), University of Oxford OPHI Research in Progress series 2008 This paper is
Social Vulnerability Index. Susan L. Cutter Department of Geography, University of South Carolina
 Social Vulnerability Index Susan L. Cutter Department of Geography, University of South Carolina scutter@sc.edu Great Lakes and St. Lawrence Cities Initiative Webinar December 3, 2014 Vulnerability The
PRELIMINARY DESIGN OF A SPATIAL DECISION SUPPORT SYSTEM FOR POVERTY MANAGEMENT
 PRELIMINARY DESIGN OF A SPATIAL DECISION SUPPORT SYSTEM FOR POVERTY MANAGEMENT F. O. Akinyemi Department of Geography, Obafemi Awolowo University, Ile-Ife, 220001, Nigeria bakin_yem@yahoo.com Commission
Progress for People through People: A Human Development Perspective
 Progress for People through People: A Human Development Perspective Jeni Klugman, Director, HDRO United Nations Development Programme Presentation to 3rd OECD World Forum Statistics, Knowledge and Policy
OPHI WORKING PAPER NO. 123
 Oxford Poverty & Human Development Initiative (OPHI) Oxford Department of International Development Queen Elizabeth House (QEH), University of Oxford OPHI WORKING PAPER NO. 123 : Depth Sensitivity and
System of collecting social statistics
 PHILIPPINES Inception Meeting System of collecting social statistics The Philippines has a decentralized system. It is composed of a policy-making body data producers data users research and training institutions
Measurement of Chronic and Transient Poverty: Theory and Application to Pakistan
 Measurement of Chronic and Transient Poverty: Theory and Application to Pakistan Takashi Kurosaki February 2003 Abstract This paper investigates how to characterie each person s poverty status when his/her
New Indicators and Models for Inequality and Poverty with Attention to Social Exclusion, Vulnerability and Deprivation 1
 New Indicators and Models for Inequality and Poverty with Attention to Social Exclusion, Vulnerability and Deprivation 1 Achille Lemmi CRIDIRE, University of Siena, e-mail: lemmi@unisi.it Abstract The
International Guidelines on Access to Basic Services for All
 International Guidelines on Access to Basic Services for All Presentation and initials lessons from implementation Accessibility to services in regions and cities : measures and policies, OECD 18 June
Where are the Poor? Mapping Out A GIS-Multidimensional Non- Monetary Poverty Index Approach for Ghana*
 Where are the Poor? Mapping Out A GIS-Multidimensional Non- Monetary Poverty Index Approach for Ghana* B. Kumi-Boateng, D. Mireku-Gyimah and E. Stemn Kumi-Boateng, B., Mireku-Gyimah, D. and Stemn, E. (2015),
Human Development Index: Introduction. Sabina Alkire (OPHI), 29 Feb 2011
, 29 Feb 2011") Human Development Index: Introduction Sabina Alkire (OPHI), 29 Feb 2011 Sen: Decade of Human Development Public acclaim is not always a sound way of judging the success of an intellectual enterprise. Sen:
Human Development Index: Introduction Sabina Alkire (OPHI), 29 Feb 2011 Sen: Decade of Human Development Public acclaim is not always a sound way of judging the success of an intellectual enterprise. Sen:
Mid-term exam Practice problems
 Mid-term exam Practice problems Most problems are short answer problems. You receive points for the answer and the explanation. Full points require both, unless otherwise specified. Explaining your answer
CIRPÉE Centre interuniversitaire sur le risque, les politiques économiques et l emploi
 CIRPÉE Centre interuniversitaire sur le risque, les politiques économiques et l emploi Cahier de recherche/working Paper 06-34 Poverty, Inequality and Stochastic Dominance, Theory and Practice: Illustration
Summary Article: Poverty from Encyclopedia of Geography
 Topic Page: Poverty Definition: poverty from Dictionary of Energy Social Issues. the fact of being poor; the absence of wealth. A term with a wide range of interpretations depending on which markers of
Integrating Quantitative and Qualitative Approaches to Poverty Measurement
 Integrating Quantitative and Qualitative Approaches to Poverty Measurement Michael Woolcock Development Research Group World Bank January 22, 2002 Overview Starting Points Types of Methods and Data Integrating
INCOME POVERTY AND UNSATISFIED BASIC NEEDS
 E C L H C S UBR EG IO N A L H EA D Q U A R TERS IN M EXICO Distr. LIMITED LC/MEX/L.949 15 December 2009 ORIGINAL: ENGLISH INCOME POVERTY AND UNSATISFIED BASIC NEEDS This document was prepared by Matthew
Assessing deprivation with ordinal variables: Depth sensitivity and poverty aversion
 Assessing deprivation with ordinal variables: Depth sensitivity and poverty aversion Suman Seth and Gaston Yalonetzky March 7, 2018 Preliminary draft. Please do not cite or share without authors permission.
TRAINING MATERIAL FOR PRODUCING NATIONAL HUMAN DEVELOPMENT REPORTS. Inequality-adjusted Human Development Index (IHDI) 1
 1") TRAINING MATERIAL FOR PRODUCING NATIONAL HUMAN DEVELOPMENT REPORTS Inequality-adjusted Human Development Index (IHDI) 1 Purpose: To adjust the HDI for inequality, such that it better reflects the actual
TRAINING MATERIAL FOR PRODUCING NATIONAL HUMAN DEVELOPMENT REPORTS Inequality-adjusted Human Development Index (IHDI) 1 Purpose: To adjust the HDI for inequality, such that it better reflects the actual
Global Value Chain Participation and Current Account Imbalances
 Global Value Chain Participation and Current Account Imbalances Johannes Brumm University of Zurich Georgios Georgiadis European Central Bank Johannes Gräb European Central Bank Fabian Trottner Princeton
International Development
 International Development Discipline/Multi-discipline or trans-disciplinary field Tahmina Rashid Associate Professor, International Studies What is Development? a. Development as a state or condition-static
Economic Theory of Spatial Costs. of Living Indices with. Application to Thailand
 Economic Theory of Spatial Costs of Living Indices with Application to Thailand spatial 5/10/97 ECONOMIC THEORY OF SPATIAL COSTS OF LIVING INDICES WITH APPLICATION TO THAILAND by N.Kakwani* School of Economics
OPHI WORKING PAPER NO. 26b
 Oxford Poverty & Human Development Initiative (OPHI) Oxford Department of International Development Queen Elizabeth House (QEH), University of Oxford OPHI WORKING PAPER NO. 26b : Dominance and Ambiguity*
Module 1b: Inequalities and inequities in health and health care utilization
 Module 1b: Inequalities and inequities in health and health care utilization Decomposition, standardization, and inequity This presentation was prepared by Adam Wagstaff and Caryn Bredenkamp 1 The basic
Opportunities and challenges of HCMC in the process of development
 Opportunities and challenges of HCMC in the process of development Lê Văn Thành HIDS HCMC, Sept. 16-17, 2009 Contents The city starting point Achievement and difficulties Development perspective and goals
COMPARISON OF THE HUMAN DEVELOPMENT BETWEEN OIC COUNTRIES AND THE OTHER COUNTRIES OF THE WORLD
 COMPARISON OF THE HUMAN DEVELOPMENT BETWEEN OIC COUNTRIES AND THE OTHER COUNTRIES OF THE WORLD Ali Changi Ashtiani (M. A.) achashtian i@ya hoo.com Hadi Ghaffari (PhD) COMPARISON OF THE HUMAN DEVELOPMENT
THE DATA REVOLUTION HAS BEGUN On the front lines with geospatial data and tools
 THE DATA REVOLUTION HAS BEGUN On the front lines with geospatial data and tools Slidedoc of presentation for MEASURE Evaluation End of Project Meeting Washington DC May 22, 2014 John Spencer Geospatial
TOPICS IN MEASUREMENT: MULTIDIMENSIONAL POVERTY AND POLARIZATION. Shabana Mitra. Dissertation. Submitted to the Faculty of the
 TOPICS IN MEASUREMENT: MULTIDIMENSIONAL POVERTY AND POLARIZATION By Shabana Mitra Dissertation Submitted to the Faculty of the Graduate School of Vanderbilt University in partial fulfillment of the requirements
Incentives and Nutrition for Rotten Kids: Intrahousehold Food Allocation in the Philippines
 Incentives and Nutrition for Rotten Kids: Intrahousehold Food Allocation in the Philippines Pierre Dubois and Ethan Ligon presented by Rachel Heath November 3, 2006 Introduction Outline Introduction Modification
Section III: Poverty Mapping Results
 Section III: Poverty Mapping Results Figure 5: Gewog level rural poverty map 58. The most prominent result from the poverty mapping exercise of Bhutan is the production of a disaggregated poverty headcount
Multidimensional Poverty with Missing Attributes
 Multidimensional Poverty with Missing Attributes Avidit Acharya and John E. Roemer May 2010 Abstract We show how to minimize the probability of misclassifying individuals as being poor or not poor when
MAPPING WHERE THE POOR LIVE
 2020 FOCUS BRIEF on the World s Poor and Hungry People October 2007 MAPPING WHERE THE POOR LIVE Todd Benson, Michael Epprecht, and Nicholas Minot A key consideration in planning action to assist poor and
Annex III Terms of Reference RFP: Regional Human Development Report Social exclusion survey
 Context: Annex III Terms of Reference RFP: Regional Human Development Report Social exclusion survey There is currently no standard set of definitions and indicators for social inclusion that is easily
Measuring poverty. Araar Abdelkrim and Duclos Jean-Yves. PEP-PMMA training workshop Addis Ababa, June overty and. olitiques.
 E Measuring poverty Araar Abdelkrim and Duclos Jean-Yves E-MMA training workshop Addis Ababa, June 2006 E-MMA training workshop Addis Ababa, June 2006 Distributive Analysis and overty - p. 1/43 roperties
Analysing Multidimensional Poverty in Guinea:
 Analysing Multidimensional Poverty in Guinea: A Fuzzy Set Approach By Fatoumata Lamarana Diallo, Cheikh Anta Diop University of Dakar (UCAD), Senegal Consortium for Social and Economic Research (CRES),
Inequality and Envy. Frank Cowell and Udo Ebert. London School of Economics and Universität Oldenburg
 Inequality and Envy Frank Cowell and Udo Ebert London School of Economics and Universität Oldenburg DARP 88 December 2006 The Toyota Centre Suntory and Toyota International Centres for Economics and Related
Measuring Social Polarization with Ordinal and Categorical data: an application to the missing dimensions of poverty in Chile
 Measuring Social Polarization with Ordinal and Categorical data: an application to the missing dimensions of poverty in Chile Conchita D Ambrosio conchita.dambrosio@unibocconi.it Iñaki Permanyer inaki.permanyer@uab.es
Conditions for the most robust multidimensional poverty comparisons using counting measures and ordinal variables
 Working Paper Series Conditions for the most robust multidimensional poverty comparisons using counting measures and ordinal variables Gaston Yalonetzky ECINEQ WP 2012 257 ECINEQ 2012 257 June 2012 www.ecineq.org
Household Heterogeneity and Inequality Measurement
 Household Heterogeneity and Inequality Measurement Alain Trannoy EHESS, Greqam-Idep, Marseille 4 th Canazei Winter School 1 Three allocation problems To cope with the problems raised by the fact that the
A STUDY OF HUMAN DEVELOPMENT APPROACH TO THE DEVELOPMENT OF NORTH EASTERN REGION OF INDIA
 ABSTRACT A STUDY OF HUMAN DEVELOPMENT APPROACH TO THE DEVELOPMENT OF NORTH EASTERN REGION OF INDIA Human development by emphasizing on capability approach differs crucially from the traditional approaches
UNIT 11 INTER STATE AND INTER DISTRICT IMBALANCES
 UNIT 11 INTER STATE AND INTER DISTRICT IMBALANCES Inter State and Inter District Imbalances Structure 11.0 Objectives 11.1 Introduction 11.2 Conceptual Bases to Understand the Issues of Regional Imbalances
Trade, Inequality and Costly Redistribution
 Trade, Inequality and Costly Redistribution Pol Antràs Alonso de Gortari Oleg Itskhoki Harvard Harvard Princeton ILO Symposium September 2015 1 / 30 Introduction International trade raises real income
Volume 31, Issue 1. A gender-adjusted measure of literacy. Sreenivasan Subramanian Madras Institute of Development Studies
 Volume 31, Issue 1 A gender-adjusted measure of literacy Sreenivasan Subramanian Madras Institute of Development Studies Abstract This is a very brief note which considers how to incorporate directly into
Socio-Economic Atlas of Tajikistan. The World Bank THE STATE STATISTICAL COMMITTEE OF THE REPUBLIC OF TAJIKISTAN
 Socio-Economic Atlas of Tajikistan The World Bank THE STATE STATISTICAL COMMITTEE OF THE REPUBLIC OF TAJIKISTAN 1) Background Why there is a need for socio economic atlas? Need for a better understanding
Dimensions of Rural Poverty in Sri Lanka: An attempt to identify the crucial aspects of well-being of rural poor
 228 Dimensions of Rural Poverty in Sri Lanka: An attempt to identify the crucial aspects of well-being of rural poor Semasinghe, W. M. Abstract Though, identification of the dimensions of poverty of a
ACCESSIBILITY TO SERVICES IN REGIONS AND CITIES: MEASURES AND POLICIES NOTE FOR THE WPTI WORKSHOP, 18 JUNE 2013
 ACCESSIBILITY TO SERVICES IN REGIONS AND CITIES: MEASURES AND POLICIES NOTE FOR THE WPTI WORKSHOP, 18 JUNE 2013 1. Significant differences in the access to basic and advanced services, such as transport,
Taxing capital along the transition - Not a bad idea after all?
 Taxing capital along the transition - Not a bad idea after all? Online appendix Hans Fehr University of Würzburg CESifo and Netspar Fabian Kindermann University of Bonn and Netspar September 2014 In Appendix
Poverty and Hazard Linkages
 Poverty and Hazard Linkages Global Risk Identification Programme Proposal Development Coordination Meeting Friday, 19 May 2006 CIESIN Earth Institute Columbia University www.ciesin.columbia.edu Data Improvements
One Economist s Perspective on Some Important Estimation Issues
 One Economist s Perspective on Some Important Estimation Issues Jere R. Behrman W.R. Kenan Jr. Professor of Economics & Sociology University of Pennsylvania SRCD Seattle Preconference on Interventions
Poverty Measurement by Fuzzy MADM Approach
 Poverty Measurement by Fuzzy MADM Approach Supratim Mukherjee 1, Banamali Ghosh 2 Assistant Professor, Department of Mathematics, Nutangram High School, Murshidabad, West Bengal, India 1 Associate Professor,
1 Bewley Economies with Aggregate Uncertainty
 1 Bewley Economies with Aggregate Uncertainty Sofarwehaveassumedawayaggregatefluctuations (i.e., business cycles) in our description of the incomplete-markets economies with uninsurable idiosyncratic risk
Economic poverty and inequality at regional level in malta: focus on the situation of children 1
 114 Социально-демографический потенциал регионального развития Для цитирования: Экономика региона. 2015. 3. С. 114-122 For citation: Ekonomika regiona [Economy of Region], 2015. 3. pp. 114-122 doi 10.17059/2015-3-10
Freedom, Opportunity and Wellbeing
 Institute for International Economic Policy Working Paper Series Elliott School of International Affairs The George Washington University Freedom, Opportunity and Wellbeing IIEP WP 2010 15 James E. Foster
Pro-poorest Poverty Reduction with Counting Measures. José V. Gallegos (Peruvian Ministry of Development and Social Inclusion)
") Pro-poorest Poverty Reduction with Counting Measures José V. Gallegos (Peruvian Ministry of Development and Social Inclusion) Gaston Yalonetzky (University of Leeds, UK) Paper Prepared for the IARIW 33
Pro-poorest Poverty Reduction with Counting Measures José V. Gallegos (Peruvian Ministry of Development and Social Inclusion) Gaston Yalonetzky (University of Leeds, UK) Paper Prepared for the IARIW 33
Stability, Ability and Equity
 Stability, Ability and Equity Mobility and Protection in the Urban Context Arup Banerji Senior Director and Head of Global Practice, Social Protection and Labor The World Bank Group 1 ECONOMIC MOBILITY
Chronic and Transient Poverty in Rural Ethiopia: A New Decomposition. Natalie Quinn (University of Oxford, UK)
") Chronic and Transient Poverty in Rural Ethiopia: A New Decomposition Natalie Quinn (University of Oxford, UK) Paper Prepared for the IARIW 33 rd General Conference Rotterdam, the Netherlands, August 24-30,
Chronic and Transient Poverty in Rural Ethiopia: A New Decomposition Natalie Quinn (University of Oxford, UK) Paper Prepared for the IARIW 33 rd General Conference Rotterdam, the Netherlands, August 24-30,
Determining Changes in Welfare Distributions at the Micro-level: Updating Poverty Maps By Chris Elbers, Jean O. Lanjouw, and Peter Lanjouw 1
 Determining Changes in Welfare Distributions at the Micro-level: Updating Poverty Maps By Chris Elbers, Jean O. Lanjouw, and Peter Lanjouw 1 Income and wealth distributions have a prominent position in
ROBUST MULTIDIMENSIONAL POVERTY COMPARISONS*
 The Economic Journal, 116 (October), 943 968. Ó The Author(s). Journal compilation Ó Royal Economic Society 26. Published by Blackwell Publishing, 96 Garsington Road, Oxford OX4 2DQ, UK and 35 Main Street,
Geography and Usability of the American Community Survey. Seth Spielman Assistant Professor of Geography University of Colorado
 Geography and Usability of the American Community Survey Seth Spielman Assistant Professor of Geography University of Colorado Goals 1. To convince you that the margins of error from the American Community
Social Vulnerability in Metro Manila: Implications for Preparedness and Response "
 Social Vulnerability in Metro Manila: Implications for Preparedness and Response " Earthquake Resilience Conference: Collaboration and Coordination in Preparedness and Response" 20-21 May 2015" Antonia
DECOMPOSITION OF NORMALIZATION AXIOM IN THE MEASUREMENT OF POVERTY: A COMMENT. Nanak Kakwani. Nanak Kakwani is a Senior Fellow at WIDER.
 DECOMPOSITION OF NORMALIZATION AXIOM IN THE MEASUREMENT OF POVERTY: A COMMENT Nanak Kakwani Nanak Kakwani is a Senior Fellow at WIDER. - 2 - DECOMPOSITION OF NORMALIZATION AXIOM IN THE MEASUREMENT OF POVERTY:
PMMA Working Paper
 P O V E R T Y & E C O N O M I C P O L I C Y R E S E A R C H N E T W O R K PMMA Working Paper 2006-03 Identification of the Poor in Sri Lanka: Development of Composite Indicator and Regional Poverty Lines
Multidimensional poverty and inequality
 Multidimensional poverty and inequality Rolf Aaberge Statistics Norway, Research Department, and University of Oslo, ESOP Andrea Brandolini Bank of Italy, DG Economics, Statistics and Research Chapter
Income elasticity of human development in ASEAN countries
 The Empirical Econometrics and Quantitative Economics Letters ISSN 2286 7147 EEQEL all rights reserved Volume 2, Number 4 (December 2013), pp. 13-20. Income elasticity of human development in ASEAN countries