Investigating the structure of high dimensional pattern recognition problems
|
|
|
- Gladys Hensley
- 6 years ago
- Views:
Transcription
1 Investigating the structure of high dimensional pattern recognition problems Carey E. Priebe Department of Mathematical Sciences Whiting School of Engineering Johns Hopkins University altimore, MD Inaugural Professorial Lecture November 29, 2001 The wealth of your practical experience with sane and interesting problems will give to mathematics a new direction and a new impetus. Leopold Kronecker to Hermann von Helmholtz 1
2 Investigating the structure of high dimensional pattern recognition problems Statistical pattern recognition (classification, clustering, etc.) in high dimensions is notoriously difficult the curse of dimensionality implies that enough data will never be available. Nevertheless, high dimensional pattern recognition applications such as hyperspectral target recognition and gene expression monitoring require methodologies for uncovering structure, generating hypotheses, and making decisions. This talk will discuss some of the challenges presented by high dimensional pattern recognition problems, and will introduce a statistical data mining methodology for investigating the structure of these problems. Applications from artificial olfactory analysis (the Tufts University artificial nose ) and gene expression monitoring by DNA microarrays will be used to frame the discussion. 2
3 Investigating the structure of high dimensional pattern recognition problems Statistical pattern recognition (classification, clustering, etc.) in high dimensions is notoriously difficult the curse of dimensionality implies that enough data will never be available. Nevertheless, high dimensional pattern recognition applications such as hyperspectral target recognition and gene expression monitoring require methodologies for uncovering structure, generating hypotheses, and making decisions. This talk will discuss some of the challenges presented by high dimensional pattern recognition problems, and will introduce a statistical data mining methodology for investigating the structure of these problems. Applications from artificial olfactory analysis (the Tufts University artificial nose ) and gene expression monitoring by DNA microarrays will be used to frame the discussion. 3
4 Investigating the structure of high dimensional pattern recognition problems Statistical pattern recognition (classification, clustering, etc.) in high dimensions is notoriously difficult the curse of dimensionality implies that enough data will never be available. Nevertheless, high dimensional pattern recognition applications such as hyperspectral target recognition and gene expression monitoring require methodologies for uncovering structure, generating hypotheses, and making decisions. This talk will discuss some of the challenges presented by high dimensional pattern recognition problems, and will introduce a statistical data mining methodology for investigating the structure of these problems. Applications from artificial olfactory analysis (the Tufts University artificial nose ) and gene expression monitoring by DNA microarrays will be used to frame the discussion. 4
5 Investigating the structure of high dimensional pattern recognition problems Statistical pattern recognition (classification, clustering, etc.) in high dimensions is notoriously difficult the curse of dimensionality implies that enough data will never be available. Nevertheless, high dimensional pattern recognition applications such as hyperspectral target recognition and gene expression monitoring require methodologies for uncovering structure, generating hypotheses, and making decisions. This talk will discuss some of the challenges presented by high dimensional pattern recognition problems, and will introduce a statistical data mining methodology for investigating the structure of these problems. Applications from artificial olfactory analysis (the Tufts University artificial nose ) and gene expression monitoring by DNA microarrays will be used to frame the discussion. 5
6 Investigating the structure of high dimensional pattern recognition problems Statistical pattern recognition (classification, clustering, etc.) in high dimensions is notoriously difficult the curse of dimensionality implies that enough data will never be available. Nevertheless, high dimensional pattern recognition applications such as hyperspectral target recognition and gene expression monitoring require methodologies for uncovering structure, generating hypotheses, and making decisions. This talk will discuss some of the challenges presented by high dimensional pattern recognition problems, and will introduce a statistical data mining methodology for investigating the structure of these problems. Applications from artificial olfactory analysis (the Tufts University artificial nose ) and gene expression monitoring by DNA microarrays will be used to frame the discussion. 6
7 High dimensional pattern recognition problems olfactory classification gene expression analysis multispecral imagery: mines & minefields hyperspectral imagery (e.g., HyMap) functional brain imagery (e.g., NV vs SZ) astronomy (e.g., Sloan Digital Sky Survey) face detection financial data analysis knowledge discovery from text 7
8 Gene expression monitoring by DNA microarrays 8
 produced by the gene concerned.")
9 DNA microarrays consist of a library of genes immobilized in a grid, usually on a glass slide. Each individual spot in the grid contains DNA from a single gene that will bind to the messenger RNA (mrna) produced by the gene concerned. So by liquidizing a sample from a given tissue type, tagging its mrnas with fluorescent dyes and then exposing the sample to the slide, it is possible to obtain an instant visual read-out revealing which genes were active. Jonathan Knight, Nature, Vol. 410, 19 April
10 ALL 1 The WI/MIT CGR 1999 data set, produced by Affymetrix DNA microarrays, involves two general classes of leukemia, ALL (acute lymphoblastic leukemia) and AML (acute myeloid leukemia). Each observation is a patient, with n ALL = 47, n AML = 25; n = n ALL + n AML = 72. Each observation is a point in 7129-dimensional Euclidean space; there are 6817 unique human genes monitored, augmented with some redundant probes and control elements. Golub, Slonim, et al., Science,
11 ? ALL 1? 11
12 ALL 2 ALL 1 AML 1 12
13 ALL 1 Goals: Problem: classify ALL v. AML cluster latent class discovery dimension reduction 72 observations in 7129-dimensions 13
14 Tufts University artificial nose chemical sensor White, Kauer, Dickinson, and Walt, Nature, Priebe, IEEE PAMI,
15 Vapor-sensing and pattern recognition with the Tufts University artificial nose chemical sensor. The plot in the cartoon represents sensor/analyte signatures for three sensors within the bundled nineteen-sensor array. Signature patterns of fluorescence changes vs. time are used for subsequent analysis. Nature, 382: (1996). 15
16 Observation Chloroform (Clfm0702). 16
17 Olfactory Classification Goal: Detection of distinguished analyte (Trichloroethylene (TCE)) at various concentrations in the presence of multiple confounders. Problem: Multivariate function-valued data; no parametric model. 17

18 Statistical Data Mining in the sense of Edward J. Wegman: Data Mining is an extension of exploratory data analysis and has basically the same goals: the discovery of unknown and unanticipated structure in the data. The chief distinction between the two topics resides in the size and dimensionality of the data sets involved. Data mining in general deals with much more massive data sets for which highly interactive analysis is not fully feasible. 18
19 The curse of dimensionality: nonparametric density estimation sample size 0 2*10^5 4*10^5 6*10^5 8*10^5 10^6 dimension samplesize dimension Choose n such that the relative mean squared error at 0 is small; n(d) = arg min n E[( ˆf n (0; d) ϕ(0; d)) 2 /ϕ(0; d) 2 ] = 0.1. Silverman,
20 The curse of dimensionality: statistical pattern recognition Consider class-conditional probability density functions f j = Normal(µ j, I d ), j = 0, 1, with equal priors. Let µ 0 = µ 1 = [1, 2 1/2, 3 1/2,, d 1/2 ]. Case I: µ 0 known. ayes optimal rule is available and L(d) 0 as d. Case II: µ 0 unknown. µ 0 must be estimated from training data and L n (d) 1/2 as d for fixed n. Trunk, 1979 Jain, et al.,
21 PEANUTS by Charles Schulz 21
22 PEANUTS by Charles Schulz 22
23 PEANUTS by Charles Schulz 23
24 Statistical Data Mining in the sense of rian Ripley: Data mining, also known as knowledge discovery in databases is one of many terms for finding structure in large-scale datasets on the boundaries of statistics, engineering, machine learning and computer science. Statistical data mining concentrates on methods for finding the structure (as distinct from manipulating the databases). 24
25 Statistical Data Mining in the sense of rian Ripley: Data mining, also known as knowledge discovery in databases is one of many terms for finding structure in large-scale datasets on the boundaries of statistics, engineering, machine learning and computer science. Statistical data mining concentrates on methods for finding the structure (as distinct from manipulating the databases). 25
26 Computational Statistics: A New Agenda for Statistical Theory and Practice high dimensional data computationally intensive methodologies imprecise questions weak assumptions nonlinear error structures distribution free models Edward J. Wegman 26
27 Computational Statistics: A New Agenda for Statistical Theory and Practice high dimensional data computationally intensive methodologies imprecise questions weak assumptions nonlinear error structures distribution free models Edward J. Wegman,
28 Computational Statistics: A New Agenda for Statistical Theory and Practice high dimensional data computationally intensive methodologies imprecise questions weak assumptions nonlinear error structures distribution free models Edward J. Wegman,
29 In his 1992 book David W. Scott writes: Fortunately, it appears that in practical situations, the dimension of the structure seldom exceeds 4 or 5. 29
30 Tufts University artificial nose chemical sensor 30
31 31
32 We choose to focus on methodologies which depend upon only the interpoint distances. To build a classifier for an unlabelled examplar Z, we restrict attention to information contained in the training sample interpoint distance matrix D = [d i,j = d(x i, X j )] and the test vector D Z = [d(z, X 1 ),, d(z, X n )]. Alas, the trick then first, get a million dollars is to pick a good distance. 32
33 The trick then... is to pick a good distance. Integrated Sensing and Processing DARPA ACMP ISP sensor/processor parameter selection (e.g. dimensionality selection) based on explicit optimization of exploitation objective (in the case of supervised classification, the probability of misclassification L) 33
34 Class Cover Catch Digraphs A statistical data mining methodology for investigating the structure of high dimensional pattern recognition problems. 34
35 Class Cover Catch Digraphs class conditional data X i Y i = j f j 35
36 Class Cover Catch Digraphs For X i s.t. Y i = j, i = {x : d(x i, x) < r Xi := min Xk :Y k =1 j d(x i, X k )} 36
37 Class Cover Catch Digraphs V j = {X i : Y i = j}. For i 1 i 2, (X i1, X i2 ) A j X i2 i1. 37
38 Class Cover Catch Digraphs D j = (V j, A j ) 38
39 Class Cover Catch Digraphs X X Choose a (minimum) dominating set Ŝ j for D j 39
40 Class Cover Catch Digraphs Consider { i : X i Ŝ j } 40
41 Class Cover Catch Digraphs Go and do likewise for class 1 j 41
42 Class Cover Catch Digraphs g(z) = arg min j min {Xi Ŝ j } (d(z, X i)/r Xi ) T X i 42
43 Class Cover Catch Digraphs g(z) = arg min j min {Xi Ŝ j } (d(z, X i)/r Xi ) T X i 43
44 Class Cover Catch Digraphs Monte Carlo results: ˆL(nearest neighbor) = ˆL(cccd) = L(ayes optimal) = (L := P [g(x) Y ] is probability of misclassification ) 44
45 Theorem 1: Let Ŝ j be dominating sets for cccds D j and g(z) = arg min j min {Xi Ŝ j } (d(z, X i)/r Xi ) T X i with T Xi 1 for all i. Then ˆL (R) n (g) = n i=1 I{g(X i ) Y i } = 0. 45
46 Theorem 2: Assume, in addition to the conditions of Theorem 1, that d is well-behaved (e.g. L p ) and the class-conditional distributions F j are strictly separable. Then g is consistent. That is, L n (g) L := L(ayes optimal). 46
47 Algorithmic extension: robustness (a) to contamination (b) to outliers 47
48 48
49 α = 0; β = 0 α = 10; β = 5 ˆL 0.21 ˆL

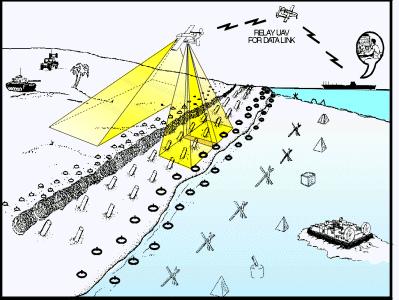
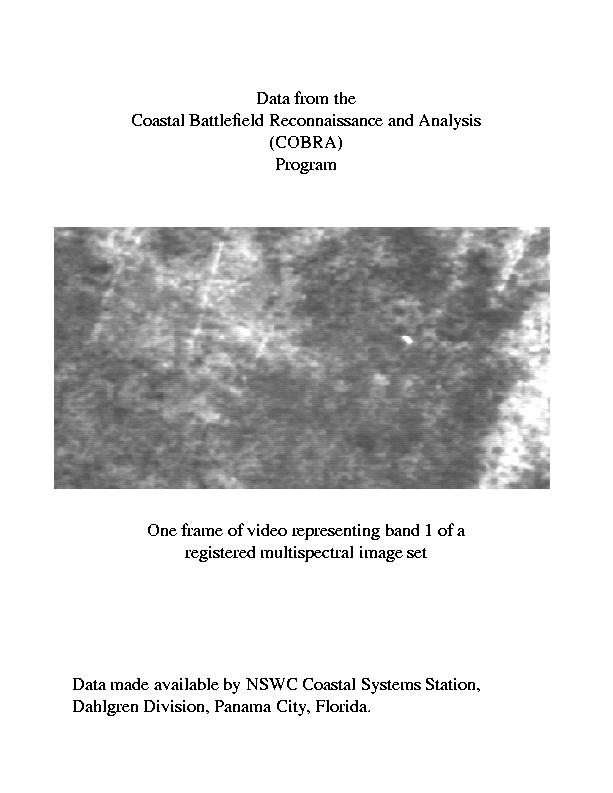
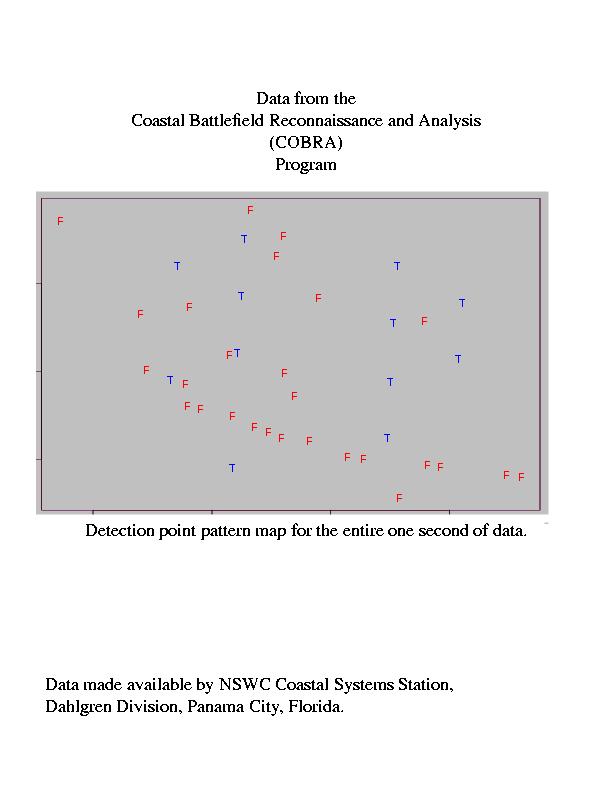
50 Coastal attlefield Reconnaissance and Analysis (CORA) 50
51 51
52 52
53 53
54 Coastal attlefield Reconnaissance and Analysis (CORA) Class Cover Catch Digraph with α = 1, β = 4 54
55 Coastal attlefield Reconnaissance and Analysis (CORA) Y band # 5 Y X X Y band # 3 55
56 Coastal attlefield Reconnaissance and Analysis (CORA) Y band # 5 Y X X Y band # 3 ˆL (D) (g) = n i=1 I{g ( i) (X i ) Y i } =
57 Complexity Reduction 1. cccd & dominating set 2. hierarchical complete linkage clustering on the size (radii) of the proximity regions: cluster(r Xi : X i Ŝ j ) 3. determine scale dimension 57
58 58
59 Define the scale dimension d to be the cluster map dimension which minimizes a dimensionality-penalized misclassification rate; d δ := min{arg min k L k + δ k} for some penalty coefficient δ [0, 1]. 59
60 Scale Dimension ˆd 7 Scale dimension for artificial nose data: d*=7 misclassification dimension 60
61 Scale Dimension ˆd 7 61
62 Return now to our example: Tufts University artificial nose chemical sensor Data: 80 observations of TCE + Chloroform in Air (at various concentrations) 40 observations of Chloroform in Air (at various concentrations) 62
63 63
64
65 Gene expression monitoring by DNA microarrays 65
66 66
67 Gene expression monitoring by DNA microarrays ALL vs. AML 67
68 T T T T T T T T T Gene expression monitoring by DNA microarrays -cell ALL vs. T-cell ALL vs. AML 68
69 0 T T T TT TTT d(x i, AML) H 0 : median(f d(x,aml) for X -cell ALL) = median(f d(x,aml) for X T-cell ALL) p-value = (Exact Wilcoxon rank-sum test) 69
70 Y X Y gene # 2275 X Y X X Y X X X Y gene # 6345 cccd classification on DNA microarry data ˆL =
71 Dimension Reduction Principle Components scree plot DNA microarray data scree plot DNA microarray data fraction of variance explained cumulative variance explained principle component principle component 71
72 Dimension Reduction Principle Components ˆL P_prcomp(e;k) k 72
73 Dimension Reduction ISP ALL 1 (i 1,, i k ) = arg inf 1 k d inf (i1,,i k ) {1,,d} L(g( i 1,, i k )) (Note: ( ) ) 73
74 Investigating the structure of high dimensional pattern recognition problems Lenore Cowen Jingdong Xie Adam Cannon Jason DeVinney Diego Socolinsky David Marchette Jeff Solka Dennis Healy Anna Tsao Wendy Martinez Ed Wegman 74
75 75
Graph Theoretic Latent Class Discovery
 Graph Theoretic Latent Class Discovery Jeff Solka jsolka@gmu.edu NSWCDD/GMU GMU BINF Colloquium 2/24/04 p.1/28 Agenda What is latent class discovery? What are some approaches to the latent class discovery
On the conditionality principle in pattern recognition
 On the conditionality principle in pattern recognition Carey E. Priebe cep@jhu.edu Johns Hopkins University Department of Applied Mathematics & Statistics Department of Computer Science Center for Imaging
Knowledge Discovery with Iterative Denoising
 Knowledge Discovery with Iterative Denoising kegiles@vcu.edu www.people.vcu.edu/~kegiles Assistant Professor Department of Statistics and Operations Research Virginia Commonwealth University Associate
Biochip informatics-(i)
") Biochip informatics-(i) : biochip normalization & differential expression Ju Han Kim, M.D., Ph.D. SNUBI: SNUBiomedical Informatics http://www.snubi snubi.org/ Biochip Informatics - (I) Biochip basics Preprocessing
Biochip informatics-(i) : biochip normalization & differential expression Ju Han Kim, M.D., Ph.D. SNUBI: SNUBiomedical Informatics http://www.snubi snubi.org/ Biochip Informatics - (I) Biochip basics Preprocessing
Microarray Data Analysis: Discovery
 Microarray Data Analysis: Discovery Lecture 5 Classification Classification vs. Clustering Classification: Goal: Placing objects (e.g. genes) into meaningful classes Supervised Clustering: Goal: Discover
Vertex Nomination via Attributed Random Dot Product Graphs
 Vertex Nomination via Attributed Random Dot Product Graphs Carey E. Priebe cep@jhu.edu Department of Applied Mathematics & Statistics Johns Hopkins University 58th Session of the International Statistical
Statistical Pattern Recognition
 Statistical Pattern Recognition Support Vector Machine (SVM) Hamid R. Rabiee Hadi Asheri, Jafar Muhammadi, Nima Pourdamghani Spring 2013 http://ce.sharif.edu/courses/91-92/2/ce725-1/ Agenda Introduction
Comparison of Shannon, Renyi and Tsallis Entropy used in Decision Trees
 Comparison of Shannon, Renyi and Tsallis Entropy used in Decision Trees Tomasz Maszczyk and W lodzis law Duch Department of Informatics, Nicolaus Copernicus University Grudzi adzka 5, 87-100 Toruń, Poland
Gene Expression Data Classification with Revised Kernel Partial Least Squares Algorithm
 Gene Expression Data Classification with Revised Kernel Partial Least Squares Algorithm Zhenqiu Liu, Dechang Chen 2 Department of Computer Science Wayne State University, Market Street, Frederick, MD 273,
Olfactory Classification via Interpoint Distance Analysis
 404 IEEE TRANSACTIONS ON PATTERN ANALYSIS AND MACHINE INTELLIGENCE, VOL. 23, NO. 4, APRIL 2001 Olfactory Classification via Interpoint Distance Analysis Carey E. Priebe AbstractÐDetection of the presence
Optimal normalization of DNA-microarray data
 Optimal normalization of DNA-microarray data Daniel Faller 1, HD Dr. J. Timmer 1, Dr. H. U. Voss 1, Prof. Dr. Honerkamp 1 and Dr. U. Hobohm 2 1 Freiburg Center for Data Analysis and Modeling 1 F. Hoffman-La
6.047 / Computational Biology: Genomes, Networks, Evolution Fall 2008
 MIT OpenCourseWare http://ocw.mit.edu 6.047 / 6.878 Computational Biology: Genomes, Networks, Evolution Fall 2008 For information about citing these materials or our Terms of Use, visit: http://ocw.mit.edu/terms.
Beyond the Point Cloud: From Transductive to Semi-Supervised Learning
 Beyond the Point Cloud: From Transductive to Semi-Supervised Learning Vikas Sindhwani, Partha Niyogi, Mikhail Belkin Andrew B. Goldberg goldberg@cs.wisc.edu Department of Computer Sciences University of
Clustering and classification with applications to microarrays and cellular phenotypes
 Clustering and classification with applications to microarrays and cellular phenotypes Gregoire Pau, EMBL Heidelberg gregoire.pau@embl.de European Molecular Biology Laboratory 1 Microarray data patients
Unsupervised Anomaly Detection for High Dimensional Data
 Unsupervised Anomaly Detection for High Dimensional Data Department of Mathematics, Rowan University. July 19th, 2013 International Workshop in Sequential Methodologies (IWSM-2013) Outline of Talk Motivation
Module Based Neural Networks for Modeling Gene Regulatory Networks
 Module Based Neural Networks for Modeling Gene Regulatory Networks Paresh Chandra Barman, Std 1 ID: 20044523 Term Project: BiS732 Bio-Network Department of BioSystems, Korea Advanced Institute of Science
Chap 1. Overview of Statistical Learning (HTF, , 2.9) Yongdai Kim Seoul National University
 Yongdai Kim Seoul National University") Chap 1. Overview of Statistical Learning (HTF, 2.1-2.6, 2.9) Yongdai Kim Seoul National University 0. Learning vs Statistical learning Learning procedure Construct a claim by observing data or using logics
Chap 1. Overview of Statistical Learning (HTF, 2.1-2.6, 2.9) Yongdai Kim Seoul National University 0. Learning vs Statistical learning Learning procedure Construct a claim by observing data or using logics
STA414/2104 Statistical Methods for Machine Learning II
 STA414/2104 Statistical Methods for Machine Learning II Murat A. Erdogdu & David Duvenaud Department of Computer Science Department of Statistical Sciences Lecture 3 Slide credits: Russ Salakhutdinov Announcements
Principles of Pattern Recognition. C. A. Murthy Machine Intelligence Unit Indian Statistical Institute Kolkata
 Principles of Pattern Recognition C. A. Murthy Machine Intelligence Unit Indian Statistical Institute Kolkata e-mail: murthy@isical.ac.in Pattern Recognition Measurement Space > Feature Space >Decision
Support Vector Machines for Classification: A Statistical Portrait
 Support Vector Machines for Classification: A Statistical Portrait Yoonkyung Lee Department of Statistics The Ohio State University May 27, 2011 The Spring Conference of Korean Statistical Society KAIST,
Face Recognition Using Laplacianfaces He et al. (IEEE Trans PAMI, 2005) presented by Hassan A. Kingravi
 presented by Hassan A. Kingravi") Face Recognition Using Laplacianfaces He et al. (IEEE Trans PAMI, 2005) presented by Hassan A. Kingravi Overview Introduction Linear Methods for Dimensionality Reduction Nonlinear Methods and Manifold
Face Recognition Using Laplacianfaces He et al. (IEEE Trans PAMI, 2005) presented by Hassan A. Kingravi Overview Introduction Linear Methods for Dimensionality Reduction Nonlinear Methods and Manifold
CS 540: Machine Learning Lecture 1: Introduction
 CS 540: Machine Learning Lecture 1: Introduction AD January 2008 AD () January 2008 1 / 41 Acknowledgments Thanks to Nando de Freitas Kevin Murphy AD () January 2008 2 / 41 Administrivia & Announcement
Feature Selection for SVMs
 Feature Selection for SVMs J. Weston, S. Mukherjee, O. Chapelle, M. Pontil T. Poggio, V. Vapnik, Barnhill BioInformatics.com, Savannah, Georgia, USA. CBCL MIT, Cambridge, Massachusetts, USA. AT&T Research
Jeff Howbert Introduction to Machine Learning Winter
 Classification / Regression Support Vector Machines Jeff Howbert Introduction to Machine Learning Winter 2012 1 Topics SVM classifiers for linearly separable classes SVM classifiers for non-linearly separable
Doing Right By Massive Data: How To Bring Probability Modeling To The Analysis Of Huge Datasets Without Taking Over The Datacenter
 Doing Right By Massive Data: How To Bring Probability Modeling To The Analysis Of Huge Datasets Without Taking Over The Datacenter Alexander W Blocker Pavlos Protopapas Xiao-Li Meng 9 February, 2010 Outline
FEATURE SELECTION COMBINED WITH RANDOM SUBSPACE ENSEMBLE FOR GENE EXPRESSION BASED DIAGNOSIS OF MALIGNANCIES
 FEATURE SELECTION COMBINED WITH RANDOM SUBSPACE ENSEMBLE FOR GENE EXPRESSION BASED DIAGNOSIS OF MALIGNANCIES Alberto Bertoni, 1 Raffaella Folgieri, 1 Giorgio Valentini, 1 1 DSI, Dipartimento di Scienze
Exploiting Sparse Non-Linear Structure in Astronomical Data
 Exploiting Sparse Non-Linear Structure in Astronomical Data Ann B. Lee Department of Statistics and Department of Machine Learning, Carnegie Mellon University Joint work with P. Freeman, C. Schafer, and
High Dimensional Discriminant Analysis
 High Dimensional Discriminant Analysis Charles Bouveyron LMC-IMAG & INRIA Rhône-Alpes Joint work with S. Girard and C. Schmid High Dimensional Discriminant Analysis - Lear seminar p.1/43 Introduction High
arxiv: v1 [stat.ml] 17 Sep 2012
![arxiv: v1 [stat.ml] 17 Sep 2012](/thumbs/89/100967923.jpg "arxiv: v1 [stat.ml] 17 Sep 2012") Generalized Canonical Correlation Analysis for Disparate Data Fusion Ming Sun a, Carey E. Priebe b,, Minh Tang c arxiv:1209.3761v1 [stat.ml] 17 Sep 2012 a Department of Electrical and Computer Engineering,
Generalized Canonical Correlation Analysis for Disparate Data Fusion Ming Sun a, Carey E. Priebe b,, Minh Tang c arxiv:1209.3761v1 [stat.ml] 17 Sep 2012 a Department of Electrical and Computer Engineering,
Gene Expression Data Classification With Kernel Principal Component Analysis
 Journal of Biomedicine and Biotechnology 25:2 25 55 59 DOI:.55/JBB.25.55 RESEARCH ARTICLE Gene Expression Data Classification With Kernel Principal Component Analysis Zhenqiu Liu, Dechang Chen, 2 and Halima
An Empirical Comparison of Dimensionality Reduction Methods for Classifying Gene and Protein Expression Datasets
 An Empirical Comparison of Dimensionality Reduction Methods for Classifying Gene and Protein Expression Datasets George Lee 1, Carlos Rodriguez 2, and Anant Madabhushi 1 1 Rutgers, The State University
Manifold Learning for Subsequent Inference
 Manifold Learning for Subsequent Inference Carey E. Priebe Johns Hopkins University June 20, 2018 DARPA Fundamental Limits of Learning (FunLoL) Los Angeles, California http://arxiv.org/abs/1806.01401 Key
Support Vector Machine (SVM) and Kernel Methods
 and Kernel Methods") Support Vector Machine (SVM) and Kernel Methods CE-717: Machine Learning Sharif University of Technology Fall 2015 Soleymani Outline Margin concept Hard-Margin SVM Soft-Margin SVM Dual Problems of Hard-Margin
Support Vector Machine (SVM) and Kernel Methods CE-717: Machine Learning Sharif University of Technology Fall 2015 Soleymani Outline Margin concept Hard-Margin SVM Soft-Margin SVM Dual Problems of Hard-Margin
MACHINE LEARNING. Methods for feature extraction and reduction of dimensionality: Probabilistic PCA and kernel PCA
 1 MACHINE LEARNING Methods for feature extraction and reduction of dimensionality: Probabilistic PCA and kernel PCA 2 Practicals Next Week Next Week, Practical Session on Computer Takes Place in Room GR
Artificial Neural Networks" and Nonparametric Methods" CMPSCI 383 Nov 17, 2011!
 Artificial Neural Networks" and Nonparametric Methods" CMPSCI 383 Nov 17, 2011! 1 Todayʼs lecture" How the brain works (!)! Artificial neural networks! Perceptrons! Multilayer feed-forward networks! Error
Statistics Toolbox 6. Apply statistical algorithms and probability models
 Statistics Toolbox 6 Apply statistical algorithms and probability models Statistics Toolbox provides engineers, scientists, researchers, financial analysts, and statisticians with a comprehensive set of
KERNEL LOGISTIC REGRESSION-LINEAR FOR LEUKEMIA CLASSIFICATION USING HIGH DIMENSIONAL DATA
 Rahayu, Kernel Logistic Regression-Linear for Leukemia Classification using High Dimensional Data KERNEL LOGISTIC REGRESSION-LINEAR FOR LEUKEMIA CLASSIFICATION USING HIGH DIMENSIONAL DATA S.P. Rahayu 1,2
Lecture 3: Statistical Decision Theory (Part II)
") Lecture 3: Statistical Decision Theory (Part II) Hao Helen Zhang Hao Helen Zhang Lecture 3: Statistical Decision Theory (Part II) 1 / 27 Outline of This Note Part I: Statistics Decision Theory (Classical
Lecture 3: Statistical Decision Theory (Part II) Hao Helen Zhang Hao Helen Zhang Lecture 3: Statistical Decision Theory (Part II) 1 / 27 Outline of This Note Part I: Statistics Decision Theory (Classical
EEE 241: Linear Systems
 EEE 4: Linear Systems Summary # 3: Introduction to artificial neural networks DISTRIBUTED REPRESENTATION An ANN consists of simple processing units communicating with each other. The basic elements of
L11: Pattern recognition principles
 L11: Pattern recognition principles Bayesian decision theory Statistical classifiers Dimensionality reduction Clustering This lecture is partly based on [Huang, Acero and Hon, 2001, ch. 4] Introduction
Machine Learning Ensemble Learning I Hamid R. Rabiee Jafar Muhammadi, Alireza Ghasemi Spring /
 Machine Learning Ensemble Learning I Hamid R. Rabiee Jafar Muhammadi, Alireza Ghasemi Spring 2015 http://ce.sharif.edu/courses/93-94/2/ce717-1 / Agenda Combining Classifiers Empirical view Theoretical
Collaborative topic models: motivations cont
 Collaborative topic models: motivations cont Two topics: machine learning social network analysis Two people: " boy Two articles: article A! girl article B Preferences: The boy likes A and B --- no problem.
Microarray data analysis
 Microarray data analysis September 20, 2006 Jonathan Pevsner, Ph.D. Introduction to Bioinformatics pevsner@kennedykrieger.org Johns Hopkins School of Public Health (260.602.01) Copyright notice Many of
Support Vector Machine (SVM) and Kernel Methods
 and Kernel Methods") Support Vector Machine (SVM) and Kernel Methods CE-717: Machine Learning Sharif University of Technology Fall 2014 Soleymani Outline Margin concept Hard-Margin SVM Soft-Margin SVM Dual Problems of Hard-Margin
Support Vector Machine (SVM) and Kernel Methods CE-717: Machine Learning Sharif University of Technology Fall 2014 Soleymani Outline Margin concept Hard-Margin SVM Soft-Margin SVM Dual Problems of Hard-Margin
What is semi-supervised learning?
 What is semi-supervised learning? In many practical learning domains, there is a large supply of unlabeled data but limited labeled data, which can be expensive to generate text processing, video-indexing,
Introduction to Machine Learning
 1, DATA11002 Introduction to Machine Learning Lecturer: Teemu Roos TAs: Ville Hyvönen and Janne Leppä-aho Department of Computer Science University of Helsinki (based in part on material by Patrik Hoyer
Machine Learning! in just a few minutes. Jan Peters Gerhard Neumann
 Machine Learning! in just a few minutes Jan Peters Gerhard Neumann 1 Purpose of this Lecture Foundations of machine learning tools for robotics We focus on regression methods and general principles Often
Terminology for Statistical Data
 Terminology for Statistical Data variables - features - attributes observations - cases (consist of multiple values) In a standard data matrix, variables or features correspond to columns observations
Clustering. CSL465/603 - Fall 2016 Narayanan C Krishnan
 Clustering CSL465/603 - Fall 2016 Narayanan C Krishnan ckn@iitrpr.ac.in Supervised vs Unsupervised Learning Supervised learning Given x ", y " "%& ', learn a function f: X Y Categorical output classification
Statistical Machine Learning Hilary Term 2018
 Statistical Machine Learning Hilary Term 2018 Pier Francesco Palamara Department of Statistics University of Oxford Slide credits and other course material can be found at: http://www.stats.ox.ac.uk/~palamara/sml18.html
Introduction to Machine Learning. PCA and Spectral Clustering. Introduction to Machine Learning, Slides: Eran Halperin
 1 Introduction to Machine Learning PCA and Spectral Clustering Introduction to Machine Learning, 2013-14 Slides: Eran Halperin Singular Value Decomposition (SVD) The singular value decomposition (SVD)
Support Vector Machines: Maximum Margin Classifiers
 Support Vector Machines: Maximum Margin Classifiers Machine Learning and Pattern Recognition: September 16, 2008 Piotr Mirowski Based on slides by Sumit Chopra and Fu-Jie Huang 1 Outline What is behind
Unsupervised machine learning
 Chapter 9 Unsupervised machine learning Unsupervised machine learning (a.k.a. cluster analysis) is a set of methods to assign objects into clusters under a predefined distance measure when class labels
Iterative Laplacian Score for Feature Selection
 Iterative Laplacian Score for Feature Selection Linling Zhu, Linsong Miao, and Daoqiang Zhang College of Computer Science and echnology, Nanjing University of Aeronautics and Astronautics, Nanjing 2006,
Applied Machine Learning Annalisa Marsico
 Applied Machine Learning Annalisa Marsico OWL RNA Bionformatics group Max Planck Institute for Molecular Genetics Free University of Berlin 29 April, SoSe 2015 Support Vector Machines (SVMs) 1. One of
Learning gradients: prescriptive models
 Department of Statistical Science Institute for Genome Sciences & Policy Department of Computer Science Duke University May 11, 2007 Relevant papers Learning Coordinate Covariances via Gradients. Sayan
STK Statistical Learning: Advanced Regression and Classification
 STK4030 - Statistical Learning: Advanced Regression and Classification Riccardo De Bin debin@math.uio.no STK4030: lecture 1 1/ 42 Outline of the lecture Introduction Overview of supervised learning Variable
Mathematics, Genomics, and Cancer
 School of Informatics IUB April 6, 2009 Outline Introduction Class Comparison Class Discovery Class Prediction Example Biological states and state modulation Software Tools Research directions Math & Biology
9/26/17. Ridge regression. What our model needs to do. Ridge Regression: L2 penalty. Ridge coefficients. Ridge coefficients
 What our model needs to do regression Usually, we are not just trying to explain observed data We want to uncover meaningful trends And predict future observations Our questions then are Is β" a good estimate
Kybernetika. Šarūnas Raudys Intrinsic dimensionality and small sample properties of classifiers
 Kybernetika Šarūnas Raudys Intrinsic dimensionality and small sample properties of classifiers Kybernetika, Vol. 34 (1998), No. 4, [461]--466 Persistent URL: http://dml.cz/dmlcz/135232 Terms of use: Institute
Fast Hierarchical Clustering from the Baire Distance
 Fast Hierarchical Clustering from the Baire Distance Pedro Contreras 1 and Fionn Murtagh 1,2 1 Department of Computer Science. Royal Holloway, University of London. 57 Egham Hill. Egham TW20 OEX, England.
An Alternative Algorithm for Classification Based on Robust Mahalanobis Distance
 Dhaka Univ. J. Sci. 61(1): 81-85, 2013 (January) An Alternative Algorithm for Classification Based on Robust Mahalanobis Distance A. H. Sajib, A. Z. M. Shafiullah 1 and A. H. Sumon Department of Statistics,
Linear and Non-Linear Dimensionality Reduction
 Linear and Non-Linear Dimensionality Reduction Alexander Schulz aschulz(at)techfak.uni-bielefeld.de University of Pisa, Pisa 4.5.215 and 7.5.215 Overview Dimensionality Reduction Motivation Linear Projections
Proceedings of the Twenty-Seventh AAAI Conference on Artificial Intelligence. Uncorrelated Lasso
 Proceedings of the Twenty-Seventh AAAI Conference on Artificial Intelligence Uncorrelated Lasso Si-Bao Chen School of Computer Science and Technology, Anhui University, Hefei, 23060, China Chris Ding Department
Score Normalization in Multimodal Biometric Systems
 Score Normalization in Multimodal Biometric Systems Karthik Nandakumar and Anil K. Jain Michigan State University, East Lansing, MI Arun A. Ross West Virginia University, Morgantown, WV http://biometrics.cse.mse.edu
GENOMIC SIGNAL PROCESSING. Lecture 2. Classification of disease subtype based on microarray data
 GENOMIC SIGNAL PROCESSING Lecture 2 Classification of disease subtype based on microarray data 1. Analysis of microarray data (see last 15 slides of Lecture 1) 2. Classification methods for microarray
An introduction to clustering techniques
 - ABSTRACT Cluster analysis has been used in a wide variety of fields, such as marketing, social science, biology, pattern recognition etc. It is used to identify homogenous groups of cases to better understand
Surprise Detection in Multivariate Astronomical Data Kirk Borne George Mason University
 Surprise Detection in Multivariate Astronomical Data Kirk Borne George Mason University kborne@gmu.edu, http://classweb.gmu.edu/kborne/ Outline What is Surprise Detection? Example Application: The LSST
Multivariate statistical methods and data mining in particle physics
 Multivariate statistical methods and data mining in particle physics RHUL Physics www.pp.rhul.ac.uk/~cowan Academic Training Lectures CERN 16 19 June, 2008 1 Outline Statement of the problem Some general
Dimension reduction methods: Algorithms and Applications Yousef Saad Department of Computer Science and Engineering University of Minnesota
 Dimension reduction methods: Algorithms and Applications Yousef Saad Department of Computer Science and Engineering University of Minnesota Université du Littoral- Calais July 11, 16 First..... to the
Supervised Learning. Regression Example: Boston Housing. Regression Example: Boston Housing
 Supervised Learning Unsupervised learning: To extract structure and postulate hypotheses about data generating process from observations x 1,...,x n. Visualize, summarize and compress data. We have seen
Graph Inference with Imperfect Edge Classifiers
 Graph Inference with Imperfect Edge Classifiers Michael W. Trosset Department of Statistics Indiana University Joint work with David Brinda (Yale University) and Shantanu Jain (Indiana University), supported
Support Vector Machine & Its Applications
 Support Vector Machine & Its Applications A portion (1/3) of the slides are taken from Prof. Andrew Moore s SVM tutorial at http://www.cs.cmu.edu/~awm/tutorials Mingyue Tan The University of British Columbia
A Sparse Solution Approach to Gene Selection for Cancer Diagnosis Using Microarray Data
 A Sparse Solution Approach to Gene Selection for Cancer Diagnosis Using Microarray Data Yoonkyung Lee Department of Statistics The Ohio State University http://www.stat.ohio-state.edu/ yklee May 13, 2005
CLASSIFIER FUSION FOR POORLY-DIFFERENTIATED TUMOR CLASSIFICATION USING BOTH MESSENGER RNA AND MICRORNA EXPRESSION PROFILES
 1 CLASSIFIER FUSION FOR POORLY-DIFFERENTIATED TUMOR CLASSIFICATION USING BOTH MESSENGER RNA AND MICRORNA EXPRESSION PROFILES Yuhang Wang and Margaret H. Dunham Department of Computer Science and Engineering,
SVAN 2016 Mini Course: Stochastic Convex Optimization Methods in Machine Learning
 SVAN 2016 Mini Course: Stochastic Convex Optimization Methods in Machine Learning Mark Schmidt University of British Columbia, May 2016 www.cs.ubc.ca/~schmidtm/svan16 Some images from this lecture are
COURSE INTRODUCTION. J. Elder CSE 6390/PSYC 6225 Computational Modeling of Visual Perception
 COURSE INTRODUCTION COMPUTATIONAL MODELING OF VISUAL PERCEPTION 2 The goal of this course is to provide a framework and computational tools for modeling visual inference, motivated by interesting examples
VC dimension, Model Selection and Performance Assessment for SVM and Other Machine Learning Algorithms
 03/Feb/2010 VC dimension, Model Selection and Performance Assessment for SVM and Other Machine Learning Algorithms Presented by Andriy Temko Department of Electrical and Electronic Engineering Page 2 of
Advanced analysis and modelling tools for spatial environmental data. Case study: indoor radon data in Switzerland
 EnviroInfo 2004 (Geneva) Sh@ring EnviroInfo 2004 Advanced analysis and modelling tools for spatial environmental data. Case study: indoor radon data in Switzerland Mikhail Kanevski 1, Michel Maignan 1
Lecture: Face Recognition
 Lecture: Face Recognition Juan Carlos Niebles and Ranjay Krishna Stanford Vision and Learning Lab Lecture 12-1 What we will learn today Introduction to face recognition The Eigenfaces Algorithm Linear
BAYESIAN CLASSIFICATION OF HIGH DIMENSIONAL DATA WITH GAUSSIAN PROCESS USING DIFFERENT KERNELS
 BAYESIAN CLASSIFICATION OF HIGH DIMENSIONAL DATA WITH GAUSSIAN PROCESS USING DIFFERENT KERNELS Oloyede I. Department of Statistics, University of Ilorin, Ilorin, Nigeria Corresponding Author: Oloyede I.,
CS281B/Stat241B. Statistical Learning Theory. Lecture 1.
 CS281B/Stat241B. Statistical Learning Theory. Lecture 1. Peter Bartlett 1. Organizational issues. 2. Overview. 3. Probabilistic formulation of prediction problems. 4. Game theoretic formulation of prediction
Classification CE-717: Machine Learning Sharif University of Technology. M. Soleymani Fall 2012
 Classification CE-717: Machine Learning Sharif University of Technology M. Soleymani Fall 2012 Topics Discriminant functions Logistic regression Perceptron Generative models Generative vs. discriminative
10-810: Advanced Algorithms and Models for Computational Biology. Optimal leaf ordering and classification
 10-810: Advanced Algorithms and Models for Computational Biology Optimal leaf ordering and classification Hierarchical clustering As we mentioned, its one of the most popular methods for clustering gene
Principal Component Analysis (PCA)
") Principal Component Analysis (PCA) Salvador Dalí, Galatea of the Spheres CSC411/2515: Machine Learning and Data Mining, Winter 2018 Michael Guerzhoy and Lisa Zhang Some slides from Derek Hoiem and Alysha
Principal Component Analysis (PCA) Salvador Dalí, Galatea of the Spheres CSC411/2515: Machine Learning and Data Mining, Winter 2018 Michael Guerzhoy and Lisa Zhang Some slides from Derek Hoiem and Alysha
Machine Learning Lecture 5
 Machine Learning Lecture 5 Linear Discriminant Functions 26.10.2017 Bastian Leibe RWTH Aachen http://www.vision.rwth-aachen.de leibe@vision.rwth-aachen.de Course Outline Fundamentals Bayes Decision Theory
Lecture : Probabilistic Machine Learning
 Lecture : Probabilistic Machine Learning Riashat Islam Reasoning and Learning Lab McGill University September 11, 2018 ML : Many Methods with Many Links Modelling Views of Machine Learning Machine Learning
Support Vector Machines. Introduction to Data Mining, 2 nd Edition by Tan, Steinbach, Karpatne, Kumar
 Data Mining Support Vector Machines Introduction to Data Mining, 2 nd Edition by Tan, Steinbach, Karpatne, Kumar 02/03/2018 Introduction to Data Mining 1 Support Vector Machines Find a linear hyperplane
Clustering & microarray technology
 Clustering & microarray technology A large scale way to measure gene expression levels. Thanks to Kevin Wayne, Matt Hibbs, & SMD for a few of the slides 1 Why is expression important? Proteins Gene Expression
Sparse statistical modelling
 Sparse statistical modelling Tom Bartlett Sparse statistical modelling Tom Bartlett 1 / 28 Introduction A sparse statistical model is one having only a small number of nonzero parameters or weights. [1]
Discriminative Direction for Kernel Classifiers
 Discriminative Direction for Kernel Classifiers Polina Golland Artificial Intelligence Lab Massachusetts Institute of Technology Cambridge, MA 02139 polina@ai.mit.edu Abstract In many scientific and engineering
Minimum Hellinger Distance Estimation in a. Semiparametric Mixture Model
 Minimum Hellinger Distance Estimation in a Semiparametric Mixture Model Sijia Xiang 1, Weixin Yao 1, and Jingjing Wu 2 1 Department of Statistics, Kansas State University, Manhattan, Kansas, USA 66506-0802.
Lecture 16: Small Sample Size Problems (Covariance Estimation) Many thanks to Carlos Thomaz who authored the original version of these slides
 Many thanks to Carlos Thomaz who authored the original version of these slides") Lecture 16: Small Sample Size Problems (Covariance Estimation) Many thanks to Carlos Thomaz who authored the original version of these slides Intelligent Data Analysis and Probabilistic Inference Lecture
Lecture 16: Small Sample Size Problems (Covariance Estimation) Many thanks to Carlos Thomaz who authored the original version of these slides Intelligent Data Analysis and Probabilistic Inference Lecture
On Improving the k-means Algorithm to Classify Unclassified Patterns
 On Improving the k-means Algorithm to Classify Unclassified Patterns Mohamed M. Rizk 1, Safar Mohamed Safar Alghamdi 2 1 Mathematics & Statistics Department, Faculty of Science, Taif University, Taif,
Non-Negative Factorization for Clustering of Microarray Data
 INT J COMPUT COMMUN, ISSN 1841-9836 9(1):16-23, February, 2014. Non-Negative Factorization for Clustering of Microarray Data L. Morgos Lucian Morgos Dept. of Electronics and Telecommunications Faculty
Machine Learning (BSMC-GA 4439) Wenke Liu
 Wenke Liu") Machine Learning (BSMC-GA 4439) Wenke Liu 02-01-2018 Biomedical data are usually high-dimensional Number of samples (n) is relatively small whereas number of features (p) can be large Sometimes p>>n Problems
Machine Learning (BSMC-GA 4439) Wenke Liu 02-01-2018 Biomedical data are usually high-dimensional Number of samples (n) is relatively small whereas number of features (p) can be large Sometimes p>>n Problems
Binary Classification / Perceptron
 Binary Classification / Perceptron Nicholas Ruozzi University of Texas at Dallas Slides adapted from David Sontag and Vibhav Gogate Supervised Learning Input: x 1, y 1,, (x n, y n ) x i is the i th data
Supervised Classification for Functional Data Using False Discovery Rate and Multivariate Functional Depth
 Supervised Classification for Functional Data Using False Discovery Rate and Multivariate Functional Depth Chong Ma 1 David B. Hitchcock 2 1 PhD Candidate University of South Carolina 2 Associate Professor
Statistical Pattern Recognition
 Statistical Pattern Recognition Feature Extraction Hamid R. Rabiee Jafar Muhammadi, Alireza Ghasemi, Payam Siyari Spring 2014 http://ce.sharif.edu/courses/92-93/2/ce725-2/ Agenda Dimensionality Reduction