3.2: Least Squares Regressions
|
|
|
- Rosanna Gallagher
- 6 years ago
- Views:
Transcription
1 3.2: Least Squares Regressions
2 Section 3.2 Least-Squares Regression After this section, you should be able to INTERPRET a regression line CALCULATE the equation of the least-squares regression line CALCULATE residuals CONSTRUCT and INTERPRET residual plots DETERMINE how well a line fits observed data INTERPRET computer regression output
3 Regression Lines A regression line summarizes the relationship between two variables, but only in settings where one of the variables helps explain or predict the other. A regression line is a line that describes how a response variable y changes as an explanatory variable x changes. We often use a regression line to predict the value of y for a given value of x.
4 Regression Lines Regression lines are used to conduct analysis. Colleges use student s SAT and GPAs to predict college success Professional sports teams use player s vital stats (40 yard dash, height, weight) to predict success The Federal Reserve uses economic data (GDP, unemployment, etc.) to predict future economic trends. Macy s uses shipping, sales and inventory data predict future sales.
 is the predicted value of the response variable y for a given value of the explanatory")
5 Regression Line Equation Suppose that y is a response variable (plotted on the vertical axis) and x is an explanatory variable (plotted on the horizontal axis). A regression line relating y to x has an equation of the form: ŷ = ax + b In this equation, ŷ (read y hat ) is the predicted value of the response variable y for a given value of the explanatory variable x. a is the slope, the amount by which y is predicted to change when x increases by one unit. b is the y intercept, the predicted value of y when x = 0.

6 Regression Line Equation
7 tail/2016/06/daily-chart-17
8 Format of Regression Lines Format 1: = x = predicted back pack weight x= student s weight Format 2: Predicted back pack weight= (student s weight)
9 Interpreting Linear Regression Y-intercept: A student weighing zero pounds is predicted to have a backpack weight of 16.3 pounds (no practical interpretation). Slope: For each additional pound that the student weighs, it is predicted that their backpack will weigh an additional pounds more, on average.
10 Interpreting Linear Regression Interpret the y-intercept and slope values in context. Is there any practical interpretation? = 37x x= Hours Studied for the SAT Predicted SAT Math Score
11 Interpreting Linear Regression = 37x Y-intercept: If a student studies for zero hours, then the student s predicted SAT score is 270 points. This makes sense. Slope: For each additional hour the student studies, his/her score is predicted to increase 37 points, on average. This makes sense.
12 Predicted Value What is the predicted SAT Math score for a student who studies 12 hours? = 37x Hours Studied for the SAT (x) Predicted SAT Math Score (y)
13 Predicted Value What is the predicted SAT Math score for a student who studies 12 hours? = 37x Hours Studied for the SAT (x) Predicted SAT Math Score (y) = 37(12) Predicted Score: 714 points
14 Self Check Quiz!
15 Self Check Quiz: Calculate the Regression Equation A crazy professor believes that a child with IQ 100 should have a reading test score of 50, and that reading score should increase by 1 point for every additional point of IQ. What is the equation of the professor s regression line for predicting reading score from IQ? Be sure to identify all variables used.
16 Self Check Quiz: Calculate the Regression Equation A crazy professor believes that a child with IQ 100 should have a reading test score of 50, and that reading score should increase by 1 point for every additional point of IQ. What is the equation of the professor s regression line for predicting reading score from IQ? Be sure to identify all variables used. Answer: = 50 + x = predicted reading score x = number of IQ points above 100
17 Self Check Quiz: Interpreting Regression Lines & Predicted Value Data on the IQ test scores and reading test scores for a group of fifth-grade children resulted in the following regression line: predicted reading score = (IQ score) (a) What s the slope of this line? Interpret this value in context. (b) What s the y-intercept? Explain why the value of the intercept is not statistically meaningful. (c) Find the predicted reading scores for two children with IQ scores of 90 and 130, respectively.
18 predicted reading score = (IQ score) (a) Slope = For each 1 point increase of IQ score, the reading score is predicted to increase points, on average. (b) Y-intercept= If the student has an IQ of zero, which is essential impossible (would not be able to hold a pencil to take the exam), the score would be This has no practical interpretation. (c) Predicted Value: 90: (90) = : (130) = points.


19 Least-Squares Regression Line Different regression lines produce different residuals. The regression line we use in AP Stats is Least-Squares Regression. The least-squares regression line of y on x is the line that makes the sum of the squared residuals as small as possible.
20 TI-NSpire: LSRL 1. Enter x data into list 1 and y data into list Press MENU, 4: Statistics, 1: Stat Calculations 3. Select Option4: Linear Regression. 4. Insert either name of list or a[] for x and name of list or b[] of y. Press ENTER.
21
22 TI-NSPIRE: LSRL to View Graph 1. Enter x data into list 1 and y data into list 2. Be sure to name lists 2. Press HOME/ON, Add Data & Statistics 3. Enter variables to x and y axis. 4. Click MENU, 4: Analyze 5. Option 6: Regression 6. Option 2: Show Linear (a + bx), ENTER
23
 residual Negative residuals (below")
24 Residuals A residual is the difference between an observed value of the response variable and the value predicted by the regression line. That is, residual = observed y predicted y residual = y - ŷ Positive residuals (above line) residual Negative residuals (below line)
25 How to Calculate the Residual 1. Calculate the predicted value, by plugging in x to the LSRE. 2. Determine the observed/actual value. 3. Subtract.
26 Calculate the Residual 1. If a student weighs 170 pounds and their backpack weighs 35 pounds, what is the value of the residual? 2. If a student weighs 105 pounds and their backpack weighs 24 pounds, what is the value of the residual?
27 Calculate the Residual 1. If a student weighs 170 pounds and their backpack weighs 35 pounds, what is the value of the residual? Predicted: ŷ = (170) = Observed: 35 Residual: = pounds The student s backpack weighs pounds more than predicted.
28 Calculate the Residual 2. If a student weighs 105 pounds and their backpack weighs 24 pounds, what is the value of the residual? Predicted: ŷ = (105) = Observed: 24 Residual: = The student s backpack weighs pounds less than predicted

29 Residual Plots A residual plot is a scatterplot of the residuals against the explanatory variable. Residual plots help us assess how well a regression line fits the data.

30 TI-NSpire: Residual Plots 1. Press MENU, 4: Analyze 2. Option 6: Residual, Option 2: Show Residual Plot

 The residual plot should show no obvious patterns")


31 Interpreting Residual Plots A residual plot magnifies the deviations of the points from the line, making it easier to see unusual observations and patterns. 1) The residual plot should show no obvious patterns 2) The residuals should be relatively small in size. A valid residual plot should look like the night sky with approximately equal amounts of positive and negative residuals. Pattern in residuals Linear model not appropriate
32 Should You Use LSRL? 1. 2.
33 Interpreting Computer Regression Output Be sure you can locate: the slope, the y intercept and determine the equation of the LSRL. y = x y = predicted... x = explanatory variable

34 r 2: Coefficient of Determination r 2 tells us how much better the LSRL does at predicting values of y than simply guessing the mean y for each value in the dataset. In this example, r 2 equals 60.6%. 60.6% of the variation in pack weight is explained by the linear relationship with bodyweight. (Insert r 2 )% of the variation in y is explained by the linear relationship with x.
35 Interpret r 2 Interpret in a sentence (how much variation is accounted for?) 1. r 2 = 0.875, x= hours studied, y= SAT score 2. r 2 = 0.523, x= hours slept, y= alertness score
36 Interpret r 2 Answers: % of the variation in SAT score is explained by the linear relationship with the number of hours studied % of the variation in alertness score is explained by the linear relationship with the number of hours slept.
37 S: Standard Deviation of the Residuals 1. Identify and interpret the standard deviation of the residual.
38 S: Standard Deviation of the Residuals Answer: S= Interpretation: On average, the model under predicts fat gain by kilograms using the least-squares regression line.
39 S: Standard Deviation of the Residuals If we use a least-squares regression line to predict the values of a response variable y from an explanatory variable x, the standard deviation of the residuals (s) is given by s residuals 2 n 2 (y i ˆ y ) 2 n 2 S represents the typical or average error (residual). Positive = UNDER predicts Negative = OVER predicts
40 Self Check Quiz! The data is a random sample of 10 trains comparing number of cars on the train and fuel consumption in pounds of coal. What is the regression equation? Be sure to define all variables. What is r 2 telling you? Define and interpret the slope in context. Does it have a practical interpretation? Define and interpret the y-intercept in context. What is s telling you?
41 1. ŷ = x ŷ = predicted fuel consumption in pounds of coal x = number of rail cars % of the varation is fuel consumption is explained by the linear relationship with the number of rail cars. 3. Slope = With each additional car, the fuel consuption increased by pounds of coal, on average. This makes practical sense. 4. Y-interpect = When there are no cars attached to the train the fuel consuption is pounds of coal. This has no practical intrepretation beacuse there is always at least one car, the engine. 5. S= On average, the model under predicts fuel consumption by pounds of coal using the least-squares regression line.
42 Extrapolation We can use a regression line to predict the response ŷ for a specific value of the explanatory variable x. The accuracy of the prediction depends on how much the data scatter about the line. Exercise caution in making predictions outside the observed values of x. Extrapolation is the use of a regression line for prediction far outside the interval of values of the explanatory variable x used to obtain the line. Such predictions are often not accurate.
43 Outliers and Influential Points An outlier is an observation that lies outside the overall pattern of the other observations. An observation is influential for a statistical calculation if removing it would markedly change the result of the calculation. Points that are outliers in the x direction of a scatterplot are often influential for the least-squares regression line. Note: Not all influential points are outliers, nor are all outliers influential points.
44 Outliers and Influential Points The left graph is perfectly linear. In the right graph, the last value was changed from (5, 5) to (8, 5) clearly influential, because it changed the graph significantly. However, the residual is very small.

45 Correlation and Regression Limitations The distinction between explanatory and response variables is important in regression.
46 Correlation and Regression Limitations Correlation and regression lines describe only linear relationships. NO!!!

47 Correlation and Regression Limitations Correlation and least-squares regression lines are not resistant.

48 Correlation and Regression Wisdom Association Does Not Imply Causation An association between an explanatory variable x and a response variable y, even if it is very strong, is not by itself good evidence that changes in x actually cause changes in y. A serious study once found that people with two cars live longer than people who only own one car. Owning three cars is even better, and so on. There is a substantial positive correlation between number of cars x and length of life y. Why?

49 Additional Calculations & Proofs
50 Least-Squares Regression Line We can use technology to find the equation of the leastsquares regression line. We can also write it in terms of the means and standard deviations of the two variables and their correlation. Equation of the least-squares regression line We have data on an explanatory variable x and a response variable y for n individuals. From the data, calculate the means and standard deviations of the two variables and their correlation. The least squares regression line is the line ŷ = a + bx with slope b r s y s x and y intercept a y bx
51 Calculate the Least Squares Regression Line Some people think that the behavior of the stock market in January predicts its behavior for the rest of the year. Take the explanatory variable x to be the percent change in a stock market index in January and the response variable y to be the change in the index for the entire year. We expect a positive correlation between x and y because the change during January contributes to the full year s change. Calculation from data for an 18-year period gives Mean x =1.75 % S x = 5.36% Mean y = 9.07% S y = 15.35% r = Find the equation of the least-squares line for predicting full-year change from January change. Show your work.
52 The Role of r 2 in Regression The standard deviation of the residuals gives us a numerical estimate of the average size of our prediction errors. The coefficient of determination r 2 is the fraction of the variation in the values of y that is accounted for by the leastsquares regression line of y on x. We can calculate r 2 using the following formula: r 2 1 SSE SST 2 SSE residual SST ( yi y) In practicality, just square the correlation r. 2


53 Accounted for Error If we use the LSRL to make our predictions, the sum of the squared residuals is SSE = SSE/SST = /83.87 r 2 = % of the variation in backpack weight is accounted for by the linear model relating pack weight to body weight.

54 Unaccounted for Error SSE/SST = 30.97/83.87 SSE/SST = If we use the mean backpack weight as our prediction, the sum of the squared residuals is SST = Therefore, 36.8% of the variation in pack weight is unaccounted for by the least-squares regression line.
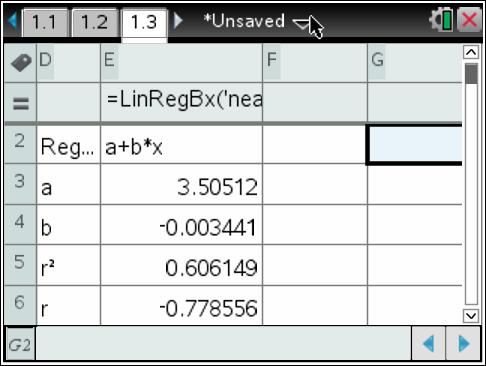
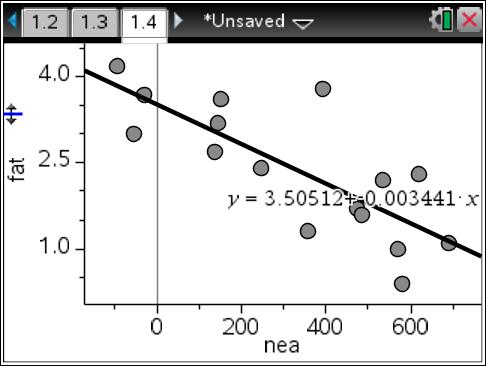
 The slope b = -0.00344 tells us that the amount of fat gained is predicted to go down by 0.00344 kg for each added calorie of NEA. The y-intercept a = 3.")
55 Interpreting a Regression Line Consider the regression line from the example (pg. 164) Does Fidgeting Keep You Slim? Identify the slope and y-intercept and interpret each value in context. fatgain = ( NEA change) The slope b = tells us that the amount of fat gained is predicted to go down by kg for each added calorie of NEA. The y-intercept a = kg is the fat gain estimated by this model if NEA does not change when a person overeats.
Chapter 3: Describing Relationships
 Chapter 3: Describing Relationships Section 3.2 The Practice of Statistics, 4 th edition For AP* STARNES, YATES, MOORE Chapter 3 Describing Relationships 3.1 Scatterplots and Correlation 3.2 Section 3.2
Determine is the equation of the LSRL. Determine is the equation of the LSRL of Customers in line and seconds to check out.. Chapter 3, Section 2
 3.2c Computer Output, Regression to the Mean, & AP Formulas Be sure you can locate: the slope, the y intercept and determine the equation of the LSRL. Slope is always in context and context is x value.
Chapter 3: Describing Relationships
 Chapter 3: Describing Relationships Section 3.2 The Practice of Statistics, 4 th edition For AP* STARNES, YATES, MOORE Chapter 3 Describing Relationships 3.1 Scatterplots and Correlation 3.2 Section 3.2
Scatterplots and Correlation
 Bivariate Data Page 1 Scatterplots and Correlation Essential Question: What is the correlation coefficient and what does it tell you? Most statistical studies examine data on more than one variable. Fortunately,
Scatterplots. 3.1: Scatterplots & Correlation. Scatterplots. Explanatory & Response Variables. Section 3.1 Scatterplots and Correlation
 3.1: Scatterplots & Correlation Scatterplots A scatterplot shows the relationship between two quantitative variables measured on the same individuals. The values of one variable appear on the horizontal
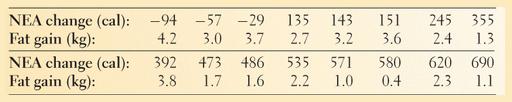
Example: Can an increase in non-exercise activity (e.g. fidgeting) help people gain less weight?
 help people gain less weight?") Example: Can an increase in non-exercise activity (e.g. fidgeting) help people gain less weight? 16 subjects overfed for 8 weeks Explanatory: change in energy use from non-exercise activity (calories)
Example: Can an increase in non-exercise activity (e.g. fidgeting) help people gain less weight? 16 subjects overfed for 8 weeks Explanatory: change in energy use from non-exercise activity (calories)
AP Statistics Unit 6 Note Packet Linear Regression. Scatterplots and Correlation
 Scatterplots and Correlation Name Hr A scatterplot shows the relationship between two quantitative variables measured on the same individuals. variable (y) measures an outcome of a study variable (x) may
Linear Regression Communication, skills, and understanding Calculator Use
 Linear Regression Communication, skills, and understanding Title, scale and label the horizontal and vertical axes Comment on the direction, shape (form), and strength of the relationship and unusual features
Chapter 1 Introduction & 1.1: Analyzing Categorical Data
 Chapter 1 Chapter 1 Introduction & 1.1: Analyzing Categorical Data Population Sample Make an inference about the population. Collect data from a representative sample... Perform Data Analysis, keeping
y = a + bx 12.1: Inference for Linear Regression Review: General Form of Linear Regression Equation Review: Interpreting Computer Regression Output
 12.1: Inference for Linear Regression Review: General Form of Linear Regression Equation y = a + bx y = dependent variable a = intercept b = slope x = independent variable Section 12.1 Inference for Linear
Chapter 3: Examining Relationships
 Chapter 3: Examining Relationships Most statistical studies involve more than one variable. Often in the AP Statistics exam, you will be asked to compare two data sets by using side by side boxplots or
The response variable depends on the explanatory variable.
 A response variable measures an outcome of study. > dependent variables An explanatory variable attempts to explain the observed outcomes. > independent variables The response variable depends on the explanatory
Review of Regression Basics
 Review of Regression Basics When describing a Bivariate Relationship: Make a Scatterplot Strength, Direction, Form Model: y-hat=a+bx Interpret slope in context Make Predictions Residual = Observed-Predicted
Unit 6 - Introduction to linear regression
 Unit 6 - Introduction to linear regression Suggested reading: OpenIntro Statistics, Chapter 7 Suggested exercises: Part 1 - Relationship between two numerical variables: 7.7, 7.9, 7.11, 7.13, 7.15, 7.25,
7. Do not estimate values for y using x-values outside the limits of the data given. This is called extrapolation and is not reliable.
 AP Statistics 15 Inference for Regression I. Regression Review a. r à correlation coefficient or Pearson s coefficient: indicates strength and direction of the relationship between the explanatory variables
Announcements: You can turn in homework until 6pm, slot on wall across from 2202 Bren. Make sure you use the correct slot! (Stats 8, closest to wall)
") Announcements: You can turn in homework until 6pm, slot on wall across from 2202 Bren. Make sure you use the correct slot! (Stats 8, closest to wall) We will cover Chs. 5 and 6 first, then 3 and 4. Mon,
Announcements: You can turn in homework until 6pm, slot on wall across from 2202 Bren. Make sure you use the correct slot! (Stats 8, closest to wall) We will cover Chs. 5 and 6 first, then 3 and 4. Mon,
Least-Squares Regression. Unit 3 Exploring Data
 Least-Squares Regression Unit 3 Exploring Data Regression Line A straight line that describes how a variable,, changes as an variable,, changes unlike, requires an and variable used to predict the value
Nov 13 AP STAT. 1. Check/rev HW 2. Review/recap of notes 3. HW: pg #5,7,8,9,11 and read/notes pg smartboad notes ch 3.
 Nov 13 AP STAT 1. Check/rev HW 2. Review/recap of notes 3. HW: pg 179 184 #5,7,8,9,11 and read/notes pg 185 188 1 Chapter 3 Notes Review Exploring relationships between two variables. BIVARIATE DATA Is
Mrs. Poyner/Mr. Page Chapter 3 page 1
 Name: Date: Period: Chapter 2: Take Home TEST Bivariate Data Part 1: Multiple Choice. (2.5 points each) Hand write the letter corresponding to the best answer in space provided on page 6. 1. In a statistics
Bivariate Data Summary
 Bivariate Data Summary Bivariate data data that examines the relationship between two variables What individuals to the data describe? What are the variables and how are they measured Are the variables
Lecture 4 Scatterplots, Association, and Correlation
 Lecture 4 Scatterplots, Association, and Correlation Previously, we looked at Single variables on their own One or more categorical variables In this lecture: We shall look at two quantitative variables.
Lecture 4 Scatterplots, Association, and Correlation
 Lecture 4 Scatterplots, Association, and Correlation Previously, we looked at Single variables on their own One or more categorical variable In this lecture: We shall look at two quantitative variables.
The following formulas related to this topic are provided on the formula sheet:
 Student Notes Prep Session Topic: Exploring Content The AP Statistics topic outline contains a long list of items in the category titled Exploring Data. Section D topics will be reviewed in this session.
Chapter 8. Linear Regression /71
 Chapter 8 Linear Regression 1 /71 Homework p192 1, 2, 3, 5, 7, 13, 15, 21, 27, 28, 29, 32, 35, 37 2 /71 3 /71 Objectives Determine Least Squares Regression Line (LSRL) describing the association of two
BIVARIATE DATA data for two variables
 (Chapter 3) BIVARIATE DATA data for two variables INVESTIGATING RELATIONSHIPS We have compared the distributions of the same variable for several groups, using double boxplots and back-to-back stemplots.
Unit 6 - Simple linear regression
 Sta 101: Data Analysis and Statistical Inference Dr. Çetinkaya-Rundel Unit 6 - Simple linear regression LO 1. Define the explanatory variable as the independent variable (predictor), and the response variable
Related Example on Page(s) R , 148 R , 148 R , 156, 157 R3.1, R3.2. Activity on 152, , 190.
 R , 148 R , 148 R , 156, 157 R3.1, R3.2. Activity on 152, , 190.") Name Chapter 3 Learning Objectives Identify explanatory and response variables in situations where one variable helps to explain or influences the other. Make a scatterplot to display the relationship
Name Chapter 3 Learning Objectives Identify explanatory and response variables in situations where one variable helps to explain or influences the other. Make a scatterplot to display the relationship
Chapter 7 Linear Regression
 Chapter 7 Linear Regression 1 7.1 Least Squares: The Line of Best Fit 2 The Linear Model Fat and Protein at Burger King The correlation is 0.76. This indicates a strong linear fit, but what line? The line
Linear Regression. Linear Regression. Linear Regression. Did You Mean Association Or Correlation?
 Did You Mean Association Or Correlation? AP Statistics Chapter 8 Be careful not to use the word correlation when you really mean association. Often times people will incorrectly use the word correlation
10.1: Scatter Plots & Trend Lines. Essential Question: How can you describe the relationship between two variables and use it to make predictions?
 10.1: Scatter Plots & Trend Lines Essential Question: How can you describe the relationship between two variables and use it to make predictions? Vocab Two-variable data: two data points, one individual/object.
Chapter 2: Looking at Data Relationships (Part 3)
") Chapter 2: Looking at Data Relationships (Part 3) Dr. Nahid Sultana Chapter 2: Looking at Data Relationships 2.1: Scatterplots 2.2: Correlation 2.3: Least-Squares Regression 2.5: Data Analysis for Two-Way
Chapter 2: Looking at Data Relationships (Part 3) Dr. Nahid Sultana Chapter 2: Looking at Data Relationships 2.1: Scatterplots 2.2: Correlation 2.3: Least-Squares Regression 2.5: Data Analysis for Two-Way
Chapter 5 Least Squares Regression
 Chapter 5 Least Squares Regression A Royal Bengal tiger wandered out of a reserve forest. We tranquilized him and want to take him back to the forest. We need an idea of his weight, but have no scale!
Relationships Regression
 Relationships Regression BPS chapter 5 2006 W.H. Freeman and Company Objectives (BPS chapter 5) Regression Regression lines The least-squares regression line Using technology Facts about least-squares
AP STATISTICS Name: Period: Review Unit IV Scatterplots & Regressions
 AP STATISTICS Name: Period: Review Unit IV Scatterplots & Regressions Know the definitions of the following words: bivariate data, regression analysis, scatter diagram, correlation coefficient, independent
Linear Regression and Correlation. February 11, 2009
 Linear Regression and Correlation February 11, 2009 The Big Ideas To understand a set of data, start with a graph or graphs. The Big Ideas To understand a set of data, start with a graph or graphs. If
appstats8.notebook October 11, 2016
 Chapter 8 Linear Regression Objective: Students will construct and analyze a linear model for a given set of data. Fat Versus Protein: An Example pg 168 The following is a scatterplot of total fat versus
Answer Key. 9.1 Scatter Plots and Linear Correlation. Chapter 9 Regression and Correlation. CK-12 Advanced Probability and Statistics Concepts 1
 9.1 Scatter Plots and Linear Correlation Answers 1. A high school psychologist wants to conduct a survey to answer the question: Is there a relationship between a student s athletic ability and his/her
Math 243 OpenStax Chapter 12 Scatterplots and Linear Regression OpenIntro Section and
 Math 243 OpenStax Chapter 12 Scatterplots and Linear Regression OpenIntro Section 2.1.1 and 8.1-8.2.6 Overview Scatterplots Explanatory and Response Variables Describing Association The Regression Equation
7.0 Lesson Plan. Regression. Residuals
 7.0 Lesson Plan Regression Residuals 1 7.1 More About Regression Recall the regression assumptions: 1. Each point (X i, Y i ) in the scatterplot satisfies: Y i = ax i + b + ɛ i where the ɛ i have a normal
Review of Regression Basics
 Review of Regression Basics When describing a Bivariate Relationship: Make a plot Strength, Direction, Form Model: yhata+b Interpret slope in contet Make Predictions Residual ObservedPredicted Assess the
Describing Bivariate Relationships
 Describing Bivariate Relationships Bivariate Relationships What is Bivariate data? When exploring/describing a bivariate (x,y) relationship: Determine the Explanatory and Response variables Plot the data
9. Linear Regression and Correlation
 9. Linear Regression and Correlation Data: y a quantitative response variable x a quantitative explanatory variable (Chap. 8: Recall that both variables were categorical) For example, y = annual income,
Chapter 5 Friday, May 21st
 Chapter 5 Friday, May 21 st Overview In this Chapter we will see three different methods we can use to describe a relationship between two quantitative variables. These methods are: Scatterplot Correlation
AP Statistics Two-Variable Data Analysis
 AP Statistics Two-Variable Data Analysis Key Ideas Scatterplots Lines of Best Fit The Correlation Coefficient Least Squares Regression Line Coefficient of Determination Residuals Outliers and Influential
AP Statistics L I N E A R R E G R E S S I O N C H A P 7
 AP Statistics 1 L I N E A R R E G R E S S I O N C H A P 7 The object [of statistics] is to discover methods of condensing information concerning large groups of allied facts into brief and compendious
Simple Linear Regression Using Ordinary Least Squares
 Simple Linear Regression Using Ordinary Least Squares Purpose: To approximate a linear relationship with a line. Reason: We want to be able to predict Y using X. Definition: The Least Squares Regression
SECTION I Number of Questions 42 Percent of Total Grade 50
 AP Stats Chap 7-9 Practice Test Name Pd SECTION I Number of Questions 42 Percent of Total Grade 50 Directions: Solve each of the following problems, using the available space (or extra paper) for scratchwork.
5.1 Bivariate Relationships
 Chapter 5 Summarizing Bivariate Data Source: TPS 5.1 Bivariate Relationships What is Bivariate data? When exploring/describing a bivariate (x,y) relationship: Determine the Explanatory and Response variables
6.1.1 How can I make predictions?
 CCA Ch 6: Modeling Two-Variable Data Name: Team: 6.1.1 How can I make predictions? Line of Best Fit 6-1. a. Length of tube: Diameter of tube: Distance from the wall (in) Width of field of view (in) b.
INFERENCE FOR REGRESSION
 CHAPTER 3 INFERENCE FOR REGRESSION OVERVIEW In Chapter 5 of the textbook, we first encountered regression. The assumptions that describe the regression model we use in this chapter are the following. We
Section 5.4 Residuals
 Section 5.4 Residuals A residual value is the difference between an actual observed y value and the corresponding predicted y value, y. Residuals are just errors. Residual error = observed value predicted
Examining Relationships. Chapter 3
 Examining Relationships Chapter 3 Scatterplots A scatterplot shows the relationship between two quantitative variables measured on the same individuals. The explanatory variable, if there is one, is graphed
Stat 101: Lecture 6. Summer 2006
 Stat 101: Lecture 6 Summer 2006 Outline Review and Questions Example for regression Transformations, Extrapolations, and Residual Review Mathematical model for regression Each point (X i, Y i ) in the
q3_3 MULTIPLE CHOICE. Choose the one alternative that best completes the statement or answers the question.
 q3_3 MULTIPLE CHOICE. Choose the one alternative that best completes the statement or answers the question. Provide an appropriate response. 1) In 2007, the number of wins had a mean of 81.79 with a standard
MATH 1070 Introductory Statistics Lecture notes Relationships: Correlation and Simple Regression
 MATH 1070 Introductory Statistics Lecture notes Relationships: Correlation and Simple Regression Objectives: 1. Learn the concepts of independent and dependent variables 2. Learn the concept of a scatterplot
Recall, Positive/Negative Association:
 ANNOUNCEMENTS: Remember that discussion today is not for credit. Go over R Commander. Go to 192 ICS, except at 4pm, go to 192 or 174 ICS. TODAY: Sections 5.3 to 5.5. Note this is a change made in the daily
HOMEWORK (due Wed, Jan 23): Chapter 3: #42, 48, 74
: Chapter 3: #42, 48, 74") ANNOUNCEMENTS: Grades available on eee for Week 1 clickers, Quiz and Discussion. If your clicker grade is missing, check next week before contacting me. If any other grades are missing let me know now.
ANNOUNCEMENTS: Grades available on eee for Week 1 clickers, Quiz and Discussion. If your clicker grade is missing, check next week before contacting me. If any other grades are missing let me know now.
Practice Questions for Exam 1
 Practice Questions for Exam 1 1. A used car lot evaluates their cars on a number of features as they arrive in the lot in order to determine their worth. Among the features looked at are miles per gallon
IT 403 Practice Problems (2-2) Answers
 Answers") IT 403 Practice Problems (2-2) Answers #1. Which of the following is correct with respect to the correlation coefficient (r) and the slope of the leastsquares regression line (Choose one)? a. They will
IT 403 Practice Problems (2-2) Answers #1. Which of the following is correct with respect to the correlation coefficient (r) and the slope of the leastsquares regression line (Choose one)? a. They will
Least Squares Regression
 Least Squares Regression Sections 5.3 & 5.4 Cathy Poliak, Ph.D. cathy@math.uh.edu Office in Fleming 11c Department of Mathematics University of Houston Lecture 14-2311 Cathy Poliak, Ph.D. cathy@math.uh.edu
Chapter 7. Scatterplots, Association, and Correlation
 Chapter 7 Scatterplots, Association, and Correlation Bin Zou (bzou@ualberta.ca) STAT 141 University of Alberta Winter 2015 1 / 29 Objective In this chapter, we study relationships! Instead, we investigate
20. Ignore the common effect question (the first one). Makes little sense in the context of this question.
. Makes little sense in the context of this question.") Errors & Omissions Free Response: 8. Change points to (0, 0), (1, 2), (2, 1) 14. Change place to case. 17. Delete the word other. 20. Ignore the common effect question (the first one). Makes little sense
Errors & Omissions Free Response: 8. Change points to (0, 0), (1, 2), (2, 1) 14. Change place to case. 17. Delete the word other. 20. Ignore the common effect question (the first one). Makes little sense
11 Correlation and Regression
 Chapter 11 Correlation and Regression August 21, 2017 1 11 Correlation and Regression When comparing two variables, sometimes one variable (the explanatory variable) can be used to help predict the value
a. Yes, it is consistent. a. Positive c. Near Zero
 Chapter 4 Test B Multiple Choice Section 4.1 (Visualizing Variability with a Scatterplot) 1. [Objective: Analyze a scatter plot and recognize trends] Doctors believe that smoking cigarettes lowers lung
MODELING. Simple Linear Regression. Want More Stats??? Crickets and Temperature. Crickets and Temperature 4/16/2015. Linear Model
 STAT 250 Dr. Kari Lock Morgan Simple Linear Regression SECTION 2.6 Least squares line Interpreting coefficients Cautions Want More Stats??? If you have enjoyed learning how to analyze data, and want to
Module 8: Linear Regression. The Applied Research Center
 Module 8: Linear Regression The Applied Research Center Module 8 Overview } Purpose of Linear Regression } Scatter Diagrams } Regression Equation } Regression Results } Example Purpose } To predict scores
Chapter 3: Examining Relationships
 Chapter 3: Examining Relationships 3.1 Scatterplots 3.2 Correlation 3.3 Least-Squares Regression Fabric Tenacity, lb/oz/yd^2 26 25 24 23 22 21 20 19 18 y = 3.9951x + 4.5711 R 2 = 0.9454 3.5 4.0 4.5 5.0
1. Use Scenario 3-1. In this study, the response variable is
 Chapter 8 Bell Work Scenario 3-1 The height (in feet) and volume (in cubic feet) of usable lumber of 32 cherry trees are measured by a researcher. The goal is to determine if volume of usable lumber can
Chapter 12 : Linear Correlation and Linear Regression
 Chapter 1 : Linear Correlation and Linear Regression Determining whether a linear relationship exists between two quantitative variables, and modeling the relationship with a line, if the linear relationship
Chapter Goals. To understand the methods for displaying and describing relationship among variables. Formulate Theories.
 Chapter Goals To understand the methods for displaying and describing relationship among variables. Formulate Theories Interpret Results/Make Decisions Collect Data Summarize Results Chapter 7: Is There
Algebra 1 Practice Test Modeling with Linear Functions Unit 6. Name Period Date
 Name Period Date Vocabular: Define each word and give an example.. Correlation 2. Residual plot. Translation Short Answer: 4. Statement: If a strong correlation is present between two variables, causation
THE PEARSON CORRELATION COEFFICIENT
 CORRELATION Two variables are said to have a relation if knowing the value of one variable gives you information about the likely value of the second variable this is known as a bivariate relation There
Correlation and Linear Regression
 Correlation and Linear Regression Correlation: Relationships between Variables So far, nearly all of our discussion of inferential statistics has focused on testing for differences between group means
AP Statistics Unit 2 (Chapters 7-10) Warm-Ups: Part 1
 Warm-Ups: Part 1") AP Statistics Unit 2 (Chapters 7-10) Warm-Ups: Part 1 2. A researcher is interested in determining if one could predict the score on a statistics exam from the amount of time spent studying for the exam.
AP Statistics Unit 2 (Chapters 7-10) Warm-Ups: Part 1 2. A researcher is interested in determining if one could predict the score on a statistics exam from the amount of time spent studying for the exam.
Section I: Multiple Choice Select the best answer for each question.
 Chapter 3 AP Statistics Practice Test (TPS- 4 p200) Section I: Multiple Choice Select the best answer for each question. 1. A school guidance counselor examines the number of extracurricular activities
Business Statistics. Lecture 9: Simple Regression
 Business Statistics Lecture 9: Simple Regression 1 On to Model Building! Up to now, class was about descriptive and inferential statistics Numerical and graphical summaries of data Confidence intervals
NAME: DATE: SECTION: MRS. KEINATH
 1 Vocabulary and Formulas: Correlation coefficient The correlation coefficient, r, measures the direction and strength of a linear relationship between two variables. Formula: = 1 x i x y i y r. n 1 s
Nonlinear Regression Section 3 Quadratic Modeling
 Nonlinear Regression Section 3 Quadratic Modeling Another type of non-linear function seen in scatterplots is the Quadratic function. Quadratic functions have a distinctive shape. Whereas the exponential
Describing Bivariate Data
 Describing Bivariate Data Correlation Linear Regression Assessing the Fit of a Line Nonlinear Relationships & Transformations The Linear Correlation Coefficient, r Recall... Bivariate Data: data that consists
Objectives. 2.3 Least-squares regression. Regression lines. Prediction and Extrapolation. Correlation and r 2. Transforming relationships
 Objectives 2.3 Least-squares regression Regression lines Prediction and Extrapolation Correlation and r 2 Transforming relationships Adapted from authors slides 2012 W.H. Freeman and Company Straight Line
AMS 7 Correlation and Regression Lecture 8
 AMS 7 Correlation and Regression Lecture 8 Department of Applied Mathematics and Statistics, University of California, Santa Cruz Suumer 2014 1 / 18 Correlation pairs of continuous observations. Correlation
IF YOU HAVE DATA VALUES:
 Unit 02 Review Ways to obtain a line of best fit IF YOU HAVE DATA VALUES: 1. In your calculator, choose STAT > 1.EDIT and enter your x values into L1 and your y values into L2 2. Choose STAT > CALC > 8.
Chapter 7. Linear Regression (Pt. 1) 7.1 Introduction. 7.2 The Least-Squares Regression Line
 7.1 Introduction. 7.2 The Least-Squares Regression Line") Chapter 7 Linear Regression (Pt. 1) 7.1 Introduction Recall that r, the correlation coefficient, measures the linear association between two quantitative variables. Linear regression is the method of fitting
Chapter 7 Linear Regression (Pt. 1) 7.1 Introduction Recall that r, the correlation coefficient, measures the linear association between two quantitative variables. Linear regression is the method of fitting
Midterm 2 - Solutions
 Ecn 102 - Analysis of Economic Data University of California - Davis February 24, 2010 Instructor: John Parman Midterm 2 - Solutions You have until 10:20am to complete this exam. Please remember to put
Chapter 4 Data with Two Variables
 Chapter 4 Data with Two Variables 1 Scatter Plots and Correlation and 2 Pearson s Correlation Coefficient Looking for Correlation Example Does the number of hours you watch TV per week impact your average
Correlation & Simple Regression
 Chapter 11 Correlation & Simple Regression The previous chapter dealt with inference for two categorical variables. In this chapter, we would like to examine the relationship between two quantitative variables.
Correlation & Regression
 Correlation & Regression Correlation It is critical that when "interpreting" the association between 2 variables via a scatterplot, to employ "weasel words" such as in general and on average and tends
Inferences for Regression
 Inferences for Regression An Example: Body Fat and Waist Size Looking at the relationship between % body fat and waist size (in inches). Here is a scatterplot of our data set: Remembering Regression In
Steps to take to do the descriptive part of regression analysis:
 STA 2023 Simple Linear Regression: Least Squares Model Steps to take to do the descriptive part of regression analysis: A. Plot the data on a scatter plot. Describe patterns: 1. Is there a strong, moderate,
Chapter 6. Exploring Data: Relationships. Solutions. Exercises:
 Chapter 6 Exploring Data: Relationships Solutions Exercises: 1. (a) It is more reasonable to explore study time as an explanatory variable and the exam grade as the response variable. (b) It is more reasonable
Intro to Linear Regression
 Intro to Linear Regression Introduction to Regression Regression is a statistical procedure for modeling the relationship among variables to predict the value of a dependent variable from one or more predictor
Chapter 3: Examining Relationships Review Sheet
 Review Sheet 1. A study is conducted to determine if one can predict the yield of a crop based on the amount of yearly rainfall. The response variable in this study is A) the yield of the crop. D) either
Multiple Choice Circle the letter corresponding to the best answer for each of the problems below (4 pts each)
") Math 221 Hypothetical Exam 1, Wi2008, (Chapter 1-5 in Moore, 4th) April 3, 2063 S. K. Hyde, S. Barton, P. Hurst, K. Yan Name: Show all your work to receive credit. All answers must be justified to get
Math 221 Hypothetical Exam 1, Wi2008, (Chapter 1-5 in Moore, 4th) April 3, 2063 S. K. Hyde, S. Barton, P. Hurst, K. Yan Name: Show all your work to receive credit. All answers must be justified to get
Chapter 4 Data with Two Variables
 Chapter 4 Data with Two Variables 1 Scatter Plots and Correlation and 2 Pearson s Correlation Coefficient Looking for Correlation Example Does the number of hours you watch TV per week impact your average
Chapter 6. Exploring Data: Relationships
 Chapter 6 Exploring Data: Relationships For All Practical Purposes: Effective Teaching A characteristic of an effective instructor is fairness and consistenc in grading and evaluating student performance.
STA Module 5 Regression and Correlation. Learning Objectives. Learning Objectives (Cont.) Upon completing this module, you should be able to:
 Upon completing this module, you should be able to:") STA 2023 Module 5 Regression and Correlation Learning Objectives Upon completing this module, you should be able to: 1. Define and apply the concepts related to linear equations with one independent variable.
STA 2023 Module 5 Regression and Correlation Learning Objectives Upon completing this module, you should be able to: 1. Define and apply the concepts related to linear equations with one independent variable.
ST Correlation and Regression
 Chapter 5 ST 370 - Correlation and Regression Readings: Chapter 11.1-11.4, 11.7.2-11.8, Chapter 12.1-12.2 Recap: So far we ve learned: Why we want a random sample and how to achieve it (Sampling Scheme)
Announcements. Lecture 18: Simple Linear Regression. Poverty vs. HS graduate rate
 Announcements Announcements Lecture : Simple Linear Regression Statistics 1 Mine Çetinkaya-Rundel March 29, 2 Midterm 2 - same regrade request policy: On a separate sheet write up your request, describing
Chapter 12 Summarizing Bivariate Data Linear Regression and Correlation
 Chapter 1 Summarizing Bivariate Data Linear Regression and Correlation This chapter introduces an important method for making inferences about a linear correlation (or relationship) between two variables,