Nov 13 AP STAT. 1. Check/rev HW 2. Review/recap of notes 3. HW: pg #5,7,8,9,11 and read/notes pg smartboad notes ch 3.
|
|
|
- Jesse Floyd
- 5 years ago
- Views:
Transcription
1 Nov 13 AP STAT 1. Check/rev HW 2. Review/recap of notes 3. HW: pg #5,7,8,9,11 and read/notes pg
2 Chapter 3 Notes Review Exploring relationships between two variables. BIVARIATE DATA Is there a relationship and if so what is it? Categorical variables can now play a role Review: Response Variable and Explanatory Variable Response Var: Measures the outcome dependant variables Explanatory Var: What's being studied, what do we want explained, what explains the respnse variable. independent vairables. Though Independent and dependent mean something unrelated to this in statistics which is why we don't really use those terms here. Ex's: Alcohol and body temp. and Math SAT vs Verbal SAT whas there a relationship. Can you predict math score if you know the verbal score. 2
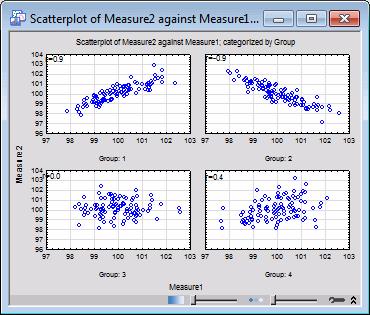
3 (do not consider the outlier rule) Scatter Plots and Correlation A SCATTER PLOT is the most effective way to display a relationship between quantitative data Be sure to label axes. Scale horizontal and vertical axes in uniform intervals Explanatory var is usally x, response is usually y Outliers are usually deviations that stand out from the rest of the data. Categoriacal data/info can be displayed with a different color or mark to determine if a pattern shows up (acts sort of like a third variable) can be used to make predictions based on pattern Directions/Associations Positive, negative, or none Form Are there Clusters Strength How close do they follow that form. 3
4 Correlation The correlation coefficient "r" Measures the strength of the relationship between the qualitative data 1 r 1 Closer it is to 1 or 1, the stronger the relationship. pos/neg is directional. Non resistant not a complete summary of the relationship its a start. Example pg 186: body weight vs backpack weight Body weight(lbs): Backpack weight (lbs): Make a scatter plot and determine r. 4
5 5
6 AP STAT Nov Check/Review HW/compare with neighbor what Qs do you have whole group...(10 min) 2. Activity with scatter plot using a scatter plot to solve a mystery 3. HW: pg #15,16,19,21,22,24 read and take notes (notes quiz) mult 2.54 to convert in to cm 6
7 Nov 15 AP STAT objective: students will write regression and least squares regression equations to make predictions. 1. Notes quiz HKREILLY 2. check and rev HW probs 3. notes review 4. least sq regression equation (notes) 5: HW : pg #29,31 pg #33,36,37 7
8 pg Regression Line (our eyeballed line) Regression requires an explanatory variable and response variable. a line that describes how a response variable changes as an explanatory variable changes makes predictions mathematical model use y=a+bx slope doesn't tell you how important a relationship is our M &M mystery 8
9 Extrapolation using the regression equation to make predictions outside the scope of the data set/range. Usually inaccurate. Interpolation using regression line to make predictions within a range of data 9
10 Least Squares Regression Line this is the line that makes the sum of the vertical (y) distances of data points from the line as small as possible (a "true" best fit) a way to get a regression line that does not depend on a guess (eyeball) since we use form y= a + bx for LRL, use same format but for least squares regression we will use y(hat) or y = a + bx LSRL «where b= r(s y /S x ) and a= y bx y hat usually not exact as the actual observ but still provides good info. 10
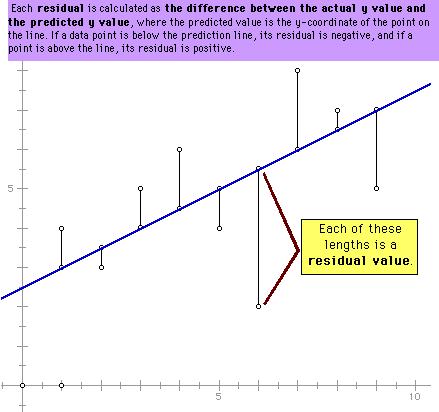
11 deviations error 11
12 Let's write a LSRL Given: x(mean)= Sx= 2.14 y(mean) = Sy=10.69 r=.705 (from eyeball line). 12
13 In calc 1. data use mystery data. input into L1 and L2 2. Stat>Calc>#8> calculate 13
.")
14 Looking Ahead: Residual plots being able to see the shape of the residuals is also telling about our prediction equation. the residual plot is a scatter plot of the residuals against the explanatory var(x/l1). Keeping in mind that the sum of the residuals should be zero or close to zero, the "trend" should be a horizontal line (slope=0). the residual plot tells us how well our regression equation fits our data. 14
15 If fanning of your residuals happens to take place, it indicates that your predicted y values (y hat) will be more inaccurate as your x increases. and vice versa 15
16 Lets make one: use list from M & M 1. L3: highlight it and type Y1(L1) enter it will fill your column 2. L4: highlight it and type L2 L3 3. now turn plot 1 off and turn plot 2 on nad select scatter plot with L1(x) and L4(y) 4. Turn off your Y= equations 5. Zoom #9 (zoom stat) 16
17 Typical prediction ERROR we use the standard deviation of the residuals. use 1 var stats wait for teacher to explain what to do. 17
18 Monday 11/20 AP STAT Objective: Students will use the coefficient of determination to describe LSRL and variation. 1. NOTES QUIZ: HKREILLY 2. Check/rev HW questions? 3. Review of notes 4. HW: pg #44,48 Pg #49,51,52,53,58 QUIZ WEDNESDAY 18
19 AP STAT Notes The coefficient of determination r 2 R sq is our correlation coefficient r...squared. This value essentially describes the percent variation that is due to the LSRL that we use to make predictions. The higher the value the better... For example: if r 2 =.82, then 82% of the variation is due to the given regression equation. The remaining "variation" of 18% would be due to the individual or subject. 82% is predictable from equation. The other 18%is variable for some other reason if r 2 =.60 that means our equation is relating the data "well" only about 60 percent of the time. the remaining 40 percent is individual which may say the LSRL isn't too great at helping make prediction or relating the two variables 19
20 Caution: Association is not causation. That is, just because a data set is characterized by having a large r squared value, it does not imply that x causes the changes in y. 20
21 4 Facts about Least squares regression 1. The distinction between explanatory and response variables is essential 2. There is a close connection between correlation and slope of the least squares regression line 3. The least squares regression line always passes through (x,y) 4. r 2 is the fraction of variation in the values of y that is explained by the least squares regression of y on x. other stuff: Since r 2 is a proportion, it is always a number between 0 and 1. If r 2 = 1, all of the data points fall perfectly on the regression line. The predictor x accounts for all of the variation in y! If r 2 = 0, the estimated regression line is perfectly horizontal. The predictor x accounts for none of the variation in y! 21
22 Nov 21 AP STAT Objective: Students will review topics in scatterplots, correlation, LSRL, and r sq 1. check HW and go over any questions 2. handout practice for quiz key will be on webpage 3. Be aware that the packet is not the end allreview all of sections 3.1,3.2 you will need to EXPLAIN answers on quiz 22

23 Nov 23 AP Stat 7:25 8:25 10:55 11:55 QUIZ! Pencil, calc spread out Have a great Thanksgiving weekend!!!???!!! There is HW on your calendar 23
24 Nov 27 AP Stat TEST WEDNESDAY 11/29 1. Section 3.3 Recap 2. Practice: pg 238 #62, pg 244 #70,72 24
25 Section 3.3 Correlation and Regression Wisdom -correlation and regression describe linear relationships -Extrapolation- unreliable predictions, predictions make no sense -Correlation- nonresistant (bc of SD- if points added changes SD) Outliers and Influential Observations: Subjective: how one point can change things LSRL or r. the graph/visual is important. Outlier: in real data gathering-check for error in collection/testing not all outliers are influential outliers are unusual data: in y direction, large residuals in x direction will not have large residuals Influential Data: influential data will have small residuals on x-not noticeable-thus scatter plot is crucial. pulls LSRL toward them (in x) so will not be noticeable on the residual plot- this means it will increase y intercept of line and decrease slope data point is influential if removing it changes the results in calculations If questionable point, find LSRL for both (with point and without point)- if changes more than slightly, then the point is influential 25
26 Making Decisions: Keep or throw away may need more data for that influential data or decide to exclude it. (Slow talker example) Lurking Variables: can make correlation and regression misleading not among explanatory or response variables but have influence in interpreting relationship between the initial variables/testing variables Lurking var can also show a nonsense relationship Lurking var can also disguise a relationship Remember Association does not imply causation. Other Odds and ends: remember that correlation (r) is based on z scores which are already standardized. Therefore, changing units of measure in an equation does not change the correlation 26
27 Review: pg #77,78,79,85 27
Describing Bivariate Relationships
 Describing Bivariate Relationships Bivariate Relationships What is Bivariate data? When exploring/describing a bivariate (x,y) relationship: Determine the Explanatory and Response variables Plot the data
5.1 Bivariate Relationships
 Chapter 5 Summarizing Bivariate Data Source: TPS 5.1 Bivariate Relationships What is Bivariate data? When exploring/describing a bivariate (x,y) relationship: Determine the Explanatory and Response variables
Scatterplots and Correlation
 Bivariate Data Page 1 Scatterplots and Correlation Essential Question: What is the correlation coefficient and what does it tell you? Most statistical studies examine data on more than one variable. Fortunately,
AP Statistics Two-Variable Data Analysis
 AP Statistics Two-Variable Data Analysis Key Ideas Scatterplots Lines of Best Fit The Correlation Coefficient Least Squares Regression Line Coefficient of Determination Residuals Outliers and Influential
Bivariate Data Summary
 Bivariate Data Summary Bivariate data data that examines the relationship between two variables What individuals to the data describe? What are the variables and how are they measured Are the variables
3.2: Least Squares Regressions
 3.2: Least Squares Regressions Section 3.2 Least-Squares Regression After this section, you should be able to INTERPRET a regression line CALCULATE the equation of the least-squares regression line CALCULATE
BIVARIATE DATA data for two variables
 (Chapter 3) BIVARIATE DATA data for two variables INVESTIGATING RELATIONSHIPS We have compared the distributions of the same variable for several groups, using double boxplots and back-to-back stemplots.
Related Example on Page(s) R , 148 R , 148 R , 156, 157 R3.1, R3.2. Activity on 152, , 190.
 R , 148 R , 148 R , 156, 157 R3.1, R3.2. Activity on 152, , 190.") Name Chapter 3 Learning Objectives Identify explanatory and response variables in situations where one variable helps to explain or influences the other. Make a scatterplot to display the relationship
Name Chapter 3 Learning Objectives Identify explanatory and response variables in situations where one variable helps to explain or influences the other. Make a scatterplot to display the relationship
Chapter 3: Describing Relationships
 Chapter 3: Describing Relationships Section 3.2 The Practice of Statistics, 4 th edition For AP* STARNES, YATES, MOORE Chapter 3 Describing Relationships 3.1 Scatterplots and Correlation 3.2 Section 3.2
The response variable depends on the explanatory variable.
 A response variable measures an outcome of study. > dependent variables An explanatory variable attempts to explain the observed outcomes. > independent variables The response variable depends on the explanatory
Chapter 3: Examining Relationships
 Chapter 3: Examining Relationships Most statistical studies involve more than one variable. Often in the AP Statistics exam, you will be asked to compare two data sets by using side by side boxplots or
AP Statistics. Chapter 6 Scatterplots, Association, and Correlation
 AP Statistics Chapter 6 Scatterplots, Association, and Correlation Objectives: Scatterplots Association Outliers Response Variable Explanatory Variable Correlation Correlation Coefficient Lurking Variables
Chapter 3: Describing Relationships
 Chapter 3: Describing Relationships Section 3.2 The Practice of Statistics, 4 th edition For AP* STARNES, YATES, MOORE Chapter 3 Describing Relationships 3.1 Scatterplots and Correlation 3.2 Section 3.2
Determine is the equation of the LSRL. Determine is the equation of the LSRL of Customers in line and seconds to check out.. Chapter 3, Section 2
 3.2c Computer Output, Regression to the Mean, & AP Formulas Be sure you can locate: the slope, the y intercept and determine the equation of the LSRL. Slope is always in context and context is x value.
Lecture 4 Scatterplots, Association, and Correlation
 Lecture 4 Scatterplots, Association, and Correlation Previously, we looked at Single variables on their own One or more categorical variable In this lecture: We shall look at two quantitative variables.
AP Statistics Unit 6 Note Packet Linear Regression. Scatterplots and Correlation
 Scatterplots and Correlation Name Hr A scatterplot shows the relationship between two quantitative variables measured on the same individuals. variable (y) measures an outcome of a study variable (x) may
Lecture 4 Scatterplots, Association, and Correlation
 Lecture 4 Scatterplots, Association, and Correlation Previously, we looked at Single variables on their own One or more categorical variables In this lecture: We shall look at two quantitative variables.
Objectives. 2.3 Least-squares regression. Regression lines. Prediction and Extrapolation. Correlation and r 2. Transforming relationships
 Objectives 2.3 Least-squares regression Regression lines Prediction and Extrapolation Correlation and r 2 Transforming relationships Adapted from authors slides 2012 W.H. Freeman and Company Straight Line
Chapter 8. Linear Regression /71
 Chapter 8 Linear Regression 1 /71 Homework p192 1, 2, 3, 5, 7, 13, 15, 21, 27, 28, 29, 32, 35, 37 2 /71 3 /71 Objectives Determine Least Squares Regression Line (LSRL) describing the association of two
Linear Regression. Linear Regression. Linear Regression. Did You Mean Association Or Correlation?
 Did You Mean Association Or Correlation? AP Statistics Chapter 8 Be careful not to use the word correlation when you really mean association. Often times people will incorrectly use the word correlation
AP Statistics L I N E A R R E G R E S S I O N C H A P 7
 AP Statistics 1 L I N E A R R E G R E S S I O N C H A P 7 The object [of statistics] is to discover methods of condensing information concerning large groups of allied facts into brief and compendious
Scatterplots. 3.1: Scatterplots & Correlation. Scatterplots. Explanatory & Response Variables. Section 3.1 Scatterplots and Correlation
 3.1: Scatterplots & Correlation Scatterplots A scatterplot shows the relationship between two quantitative variables measured on the same individuals. The values of one variable appear on the horizontal
appstats8.notebook October 11, 2016
 Chapter 8 Linear Regression Objective: Students will construct and analyze a linear model for a given set of data. Fat Versus Protein: An Example pg 168 The following is a scatterplot of total fat versus
Review of Regression Basics
 Review of Regression Basics When describing a Bivariate Relationship: Make a Scatterplot Strength, Direction, Form Model: y-hat=a+bx Interpret slope in context Make Predictions Residual = Observed-Predicted
Prob/Stats Questions? /32
 Prob/Stats 10.4 Questions? 1 /32 Prob/Stats 10.4 Homework Apply p551 Ex 10-4 p 551 7, 8, 9, 10, 12, 13, 28 2 /32 Prob/Stats 10.4 Objective Compute the equation of the least squares 3 /32 Regression A scatter
Chapter 12 Summarizing Bivariate Data Linear Regression and Correlation
 Chapter 1 Summarizing Bivariate Data Linear Regression and Correlation This chapter introduces an important method for making inferences about a linear correlation (or relationship) between two variables,
The following formulas related to this topic are provided on the formula sheet:
 Student Notes Prep Session Topic: Exploring Content The AP Statistics topic outline contains a long list of items in the category titled Exploring Data. Section D topics will be reviewed in this session.
Chapter 5 Least Squares Regression
 Chapter 5 Least Squares Regression A Royal Bengal tiger wandered out of a reserve forest. We tranquilized him and want to take him back to the forest. We need an idea of his weight, but have no scale!
6.1.1 How can I make predictions?
 CCA Ch 6: Modeling Two-Variable Data Name: Team: 6.1.1 How can I make predictions? Line of Best Fit 6-1. a. Length of tube: Diameter of tube: Distance from the wall (in) Width of field of view (in) b.
1. Create a scatterplot of this data. 2. Find the correlation coefficient.
 How Fast Foods Compare Company Entree Total Calories Fat (grams) McDonald s Big Mac 540 29 Filet o Fish 380 18 Burger King Whopper 670 40 Big Fish Sandwich 640 32 Wendy s Single Burger 470 21 1. Create
What is the easiest way to lose points when making a scatterplot?
 Day #1: Read 141-142 3.1 Describing Relationships Why do we study relationships between two variables? Read 143-144 Page 144: Check Your Understanding Read 144-149 How do you know which variable to put
Chapter 7. Scatterplots, Association, and Correlation
 Chapter 7 Scatterplots, Association, and Correlation Bin Zou (bzou@ualberta.ca) STAT 141 University of Alberta Winter 2015 1 / 29 Objective In this chapter, we study relationships! Instead, we investigate
Summarizing Data: Paired Quantitative Data
 Summarizing Data: Paired Quantitative Data regression line (or least-squares line) a straight line model for the relationship between explanatory (x) and response (y) variables, often used to produce a
AP STATISTICS Name: Period: Review Unit IV Scatterplots & Regressions
 AP STATISTICS Name: Period: Review Unit IV Scatterplots & Regressions Know the definitions of the following words: bivariate data, regression analysis, scatter diagram, correlation coefficient, independent
Least-Squares Regression. Unit 3 Exploring Data
 Least-Squares Regression Unit 3 Exploring Data Regression Line A straight line that describes how a variable,, changes as an variable,, changes unlike, requires an and variable used to predict the value
y n 1 ( x i x )( y y i n 1 i y 2
( y y i n 1 i y 2") STP3 Brief Class Notes Instructor: Ela Jackiewicz Chapter Regression and Correlation In this chapter we will explore the relationship between two quantitative variables, X an Y. We will consider n ordered
STP3 Brief Class Notes Instructor: Ela Jackiewicz Chapter Regression and Correlation In this chapter we will explore the relationship between two quantitative variables, X an Y. We will consider n ordered
Relationships Regression
 Relationships Regression BPS chapter 5 2006 W.H. Freeman and Company Objectives (BPS chapter 5) Regression Regression lines The least-squares regression line Using technology Facts about least-squares
Looking at data: relationships
 Looking at data: relationships Least-squares regression IPS chapter 2.3 2006 W. H. Freeman and Company Objectives (IPS chapter 2.3) Least-squares regression p p The regression line Making predictions:
Chapter 6. September 17, Please pick up a calculator and take out paper and something to write with. Association and Correlation.
 Please pick up a calculator and take out paper and something to write with. Sep 17 8:08 AM Chapter 6 Scatterplots, Association and Correlation Copyright 2015, 2010, 2007 Pearson Education, Inc. Chapter
Reminder: Univariate Data. Bivariate Data. Example: Puppy Weights. You weigh the pups and get these results: 2.5, 3.5, 3.3, 3.1, 2.6, 3.6, 2.
 TP: To review Standard Deviation, Residual Plots, and Correlation Coefficients HW: Do a journal entry on each of the calculator tricks in this lesson. Lesson slides will be posted with notes. Do Now: Write
Unit 6 - Introduction to linear regression
 Unit 6 - Introduction to linear regression Suggested reading: OpenIntro Statistics, Chapter 7 Suggested exercises: Part 1 - Relationship between two numerical variables: 7.7, 7.9, 7.11, 7.13, 7.15, 7.25,
Steps to take to do the descriptive part of regression analysis:
 STA 2023 Simple Linear Regression: Least Squares Model Steps to take to do the descriptive part of regression analysis: A. Plot the data on a scatter plot. Describe patterns: 1. Is there a strong, moderate,
MODELING. Simple Linear Regression. Want More Stats??? Crickets and Temperature. Crickets and Temperature 4/16/2015. Linear Model
 STAT 250 Dr. Kari Lock Morgan Simple Linear Regression SECTION 2.6 Least squares line Interpreting coefficients Cautions Want More Stats??? If you have enjoyed learning how to analyze data, and want to
Overview. 4.1 Tables and Graphs for the Relationship Between Two Variables. 4.2 Introduction to Correlation. 4.3 Introduction to Regression 3.
 3.1-1 Overview 4.1 Tables and Graphs for the Relationship Between Two Variables 4.2 Introduction to Correlation 4.3 Introduction to Regression 3.1-2 4.1 Tables and Graphs for the Relationship Between Two
CHAPTER 3 Describing Relationships
 CHAPTER 3 Describing Relationships 3.1 Scatterplots and Correlation The Practice of Statistics, 5th Edition Starnes, Tabor, Yates, Moore Bedford Freeman Worth Publishers Scatterplots and Correlation Learning
Chapter 3: Examining Relationships
 Chapter 3: Examining Relationships 3.1 Scatterplots 3.2 Correlation 3.3 Least-Squares Regression Fabric Tenacity, lb/oz/yd^2 26 25 24 23 22 21 20 19 18 y = 3.9951x + 4.5711 R 2 = 0.9454 3.5 4.0 4.5 5.0
Chapter 14. Statistical versus Deterministic Relationships. Distance versus Speed. Describing Relationships: Scatterplots and Correlation
 Chapter 14 Describing Relationships: Scatterplots and Correlation Chapter 14 1 Statistical versus Deterministic Relationships Distance versus Speed (when travel time is constant). Income (in millions of
Inferences for Regression
 Inferences for Regression An Example: Body Fat and Waist Size Looking at the relationship between % body fat and waist size (in inches). Here is a scatterplot of our data set: Remembering Regression In
Announcements. Lecture 18: Simple Linear Regression. Poverty vs. HS graduate rate
 Announcements Announcements Lecture : Simple Linear Regression Statistics 1 Mine Çetinkaya-Rundel March 29, 2 Midterm 2 - same regrade request policy: On a separate sheet write up your request, describing
STA Module 5 Regression and Correlation. Learning Objectives. Learning Objectives (Cont.) Upon completing this module, you should be able to:
 Upon completing this module, you should be able to:") STA 2023 Module 5 Regression and Correlation Learning Objectives Upon completing this module, you should be able to: 1. Define and apply the concepts related to linear equations with one independent variable.
STA 2023 Module 5 Regression and Correlation Learning Objectives Upon completing this module, you should be able to: 1. Define and apply the concepts related to linear equations with one independent variable.
Unit 6 - Simple linear regression
 Sta 101: Data Analysis and Statistical Inference Dr. Çetinkaya-Rundel Unit 6 - Simple linear regression LO 1. Define the explanatory variable as the independent variable (predictor), and the response variable
Linear Regression Communication, skills, and understanding Calculator Use
 Linear Regression Communication, skills, and understanding Title, scale and label the horizontal and vertical axes Comment on the direction, shape (form), and strength of the relationship and unusual features
Important note: Transcripts are not substitutes for textbook assignments. 1
 In this lesson we will cover correlation and regression, two really common statistical analyses for quantitative (or continuous) data. Specially we will review how to organize the data, the importance
Chapter 9. Correlation and Regression
 Chapter 9 Correlation and Regression Lesson 9-1/9-2, Part 1 Correlation Registered Florida Pleasure Crafts and Watercraft Related Manatee Deaths 100 80 60 40 20 0 1991 1993 1995 1997 1999 Year Boats in
Chapter 5 Friday, May 21st
 Chapter 5 Friday, May 21 st Overview In this Chapter we will see three different methods we can use to describe a relationship between two quantitative variables. These methods are: Scatterplot Correlation
Announcements: You can turn in homework until 6pm, slot on wall across from 2202 Bren. Make sure you use the correct slot! (Stats 8, closest to wall)
") Announcements: You can turn in homework until 6pm, slot on wall across from 2202 Bren. Make sure you use the correct slot! (Stats 8, closest to wall) We will cover Chs. 5 and 6 first, then 3 and 4. Mon,
Announcements: You can turn in homework until 6pm, slot on wall across from 2202 Bren. Make sure you use the correct slot! (Stats 8, closest to wall) We will cover Chs. 5 and 6 first, then 3 and 4. Mon,
Mrs. Poyner/Mr. Page Chapter 3 page 1
 Name: Date: Period: Chapter 2: Take Home TEST Bivariate Data Part 1: Multiple Choice. (2.5 points each) Hand write the letter corresponding to the best answer in space provided on page 6. 1. In a statistics
9. Linear Regression and Correlation
 9. Linear Regression and Correlation Data: y a quantitative response variable x a quantitative explanatory variable (Chap. 8: Recall that both variables were categorical) For example, y = annual income,
a. Length of tube: Diameter of tube:
 CCA Ch 6: Modeling Two-Variable Data Name: 6.1.1 How can I make predictions? Line of Best Fit 6-1. a. Length of tube: Diameter of tube: Distance from the wall (in) Width of field of view (in) b. Make a
4.1 Introduction. 4.2 The Scatter Diagram. Chapter 4 Linear Correlation and Regression Analysis
 4.1 Introduction Correlation is a technique that measures the strength (or the degree) of the relationship between two variables. For example, we could measure how strong the relationship is between people
Section I: Multiple Choice Select the best answer for each question.
 Chapter 3 AP Statistics Practice Test (TPS- 4 p200) Section I: Multiple Choice Select the best answer for each question. 1. A school guidance counselor examines the number of extracurricular activities
Examining Relationships. Chapter 3
 Examining Relationships Chapter 3 Scatterplots A scatterplot shows the relationship between two quantitative variables measured on the same individuals. The explanatory variable, if there is one, is graphed
Introduce Exploration! Before we go on, notice one more thing. We'll come back to the derivation if we have time.
 Introduce Exploration! Before we go on, notice one more thing. We'll come back to the derivation if we have time. Simplifying the calculation of variance Notice that we can rewrite the calculation of a
appstats27.notebook April 06, 2017
 Chapter 27 Objective Students will conduct inference on regression and analyze data to write a conclusion. Inferences for Regression An Example: Body Fat and Waist Size pg 634 Our chapter example revolves
Chapter 6: Exploring Data: Relationships Lesson Plan
 Chapter 6: Exploring Data: Relationships Lesson Plan For All Practical Purposes Displaying Relationships: Scatterplots Mathematical Literacy in Today s World, 9th ed. Making Predictions: Regression Line
Basic Practice of Statistics 7th
 Basic Practice of Statistics 7th Edition Lecture PowerPoint Slides In Chapter 4, we cover Explanatory and response variables Displaying relationships: Scatterplots Interpreting scatterplots Adding categorical
Chapter 8. Linear Regression. Copyright 2010 Pearson Education, Inc.
 Chapter 8 Linear Regression Copyright 2010 Pearson Education, Inc. Fat Versus Protein: An Example The following is a scatterplot of total fat versus protein for 30 items on the Burger King menu: Copyright
Stat 101: Lecture 6. Summer 2006
 Stat 101: Lecture 6 Summer 2006 Outline Review and Questions Example for regression Transformations, Extrapolations, and Residual Review Mathematical model for regression Each point (X i, Y i ) in the
Mathematical Notation Math Introduction to Applied Statistics
 Mathematical Notation Math 113 - Introduction to Applied Statistics Name : Use Word or WordPerfect to recreate the following documents. Each article is worth 10 points and should be emailed to the instructor
Analysis of Bivariate Data
 Analysis of Bivariate Data Data Two Quantitative variables GPA and GAES Interest rates and indices Tax and fund allocation Population size and prison population Bivariate data (x,y) Case corr® 2 Independent
7. Do not estimate values for y using x-values outside the limits of the data given. This is called extrapolation and is not reliable.
 AP Statistics 15 Inference for Regression I. Regression Review a. r à correlation coefficient or Pearson s coefficient: indicates strength and direction of the relationship between the explanatory variables
Chapter 10 Correlation and Regression
 Chapter 10 Correlation and Regression 10-1 Review and Preview 10-2 Correlation 10-3 Regression 10-4 Variation and Prediction Intervals 10-5 Multiple Regression 10-6 Modeling Copyright 2010, 2007, 2004
AP Statistics Bivariate Data Analysis Test Review. Multiple-Choice
 Name Period AP Statistics Bivariate Data Analysis Test Review Multiple-Choice 1. The correlation coefficient measures: (a) Whether there is a relationship between two variables (b) The strength of the
Chapter 4 Data with Two Variables
 Chapter 4 Data with Two Variables 1 Scatter Plots and Correlation and 2 Pearson s Correlation Coefficient Looking for Correlation Example Does the number of hours you watch TV per week impact your average
AP Stats ~ 3A: Scatterplots and Correlation OBJECTIVES:
 OBJECTIVES: IDENTIFY explanatory and response variables in situations where one variable helps to explain or influences the other. MAKE a scatterplot to display the relationship between two quantitative
Chapter 4 Describing the Relation between Two Variables
 Chapter 4 Describing the Relation between Two Variables 4.1 Scatter Diagrams and Correlation The is the variable whose value can be explained by the value of the or. A is a graph that shows the relationship
Correlation and Regression
 Correlation and Regression 8 9 Copyright Cengage Learning. All rights reserved. Section 9.2 Linear Regression and the Coefficient of Determination Copyright Cengage Learning. All rights reserved. Focus
Chapter 7 Summary Scatterplots, Association, and Correlation
 Chapter 7 Summary Scatterplots, Association, and Correlation What have we learned? We examine scatterplots for direction, form, strength, and unusual features. Although not every relationship is linear,
Chapter 4 Data with Two Variables
 Chapter 4 Data with Two Variables 1 Scatter Plots and Correlation and 2 Pearson s Correlation Coefficient Looking for Correlation Example Does the number of hours you watch TV per week impact your average
IF YOU HAVE DATA VALUES:
 Unit 02 Review Ways to obtain a line of best fit IF YOU HAVE DATA VALUES: 1. In your calculator, choose STAT > 1.EDIT and enter your x values into L1 and your y values into L2 2. Choose STAT > CALC > 8.
Announcements. Lecture 10: Relationship between Measurement Variables. Poverty vs. HS graduate rate. Response vs. explanatory
 Announcements Announcements Lecture : Relationship between Measurement Variables Statistics Colin Rundel February, 20 In class Quiz #2 at the end of class Midterm #1 on Friday, in class review Wednesday
AP Final Review II Exploring Data (20% 30%)
") AP Final Review II Exploring Data (20% 30%) Quantitative vs Categorical Variables Quantitative variables are numerical values for which arithmetic operations such as means make sense. It is usually a measure
AP Final Review II Exploring Data (20% 30%) Quantitative vs Categorical Variables Quantitative variables are numerical values for which arithmetic operations such as means make sense. It is usually a measure
Stat 101 Exam 1 Important Formulas and Concepts 1
 1 Chapter 1 1.1 Definitions Stat 101 Exam 1 Important Formulas and Concepts 1 1. Data Any collection of numbers, characters, images, or other items that provide information about something. 2. Categorical/Qualitative
Test 3A AP Statistics Name:
 Test 3A AP Statistics Name: Part 1: Multiple Choice. Circle the letter corresponding to the best answer. 1. Other things being equal, larger automobile engines consume more fuel. You are planning an experiment
NAME: DATE: SECTION: MRS. KEINATH
 1 Vocabulary and Formulas: Correlation coefficient The correlation coefficient, r, measures the direction and strength of a linear relationship between two variables. Formula: = 1 x i x y i y r. n 1 s
Chapter 2: Looking at Data Relationships (Part 3)
") Chapter 2: Looking at Data Relationships (Part 3) Dr. Nahid Sultana Chapter 2: Looking at Data Relationships 2.1: Scatterplots 2.2: Correlation 2.3: Least-Squares Regression 2.5: Data Analysis for Two-Way
Chapter 2: Looking at Data Relationships (Part 3) Dr. Nahid Sultana Chapter 2: Looking at Data Relationships 2.1: Scatterplots 2.2: Correlation 2.3: Least-Squares Regression 2.5: Data Analysis for Two-Way
The Simple Linear Regression Model
 The Simple Linear Regression Model Lesson 3 Ryan Safner 1 1 Department of Economics Hood College ECON 480 - Econometrics Fall 2017 Ryan Safner (Hood College) ECON 480 - Lesson 3 Fall 2017 1 / 77 Bivariate
M 140 Test 1 B Name (1 point) SHOW YOUR WORK FOR FULL CREDIT! Problem Max. Points Your Points Total 75
 SHOW YOUR WORK FOR FULL CREDIT! Problem Max. Points Your Points Total 75") M 140 est 1 B Name (1 point) SHOW YOUR WORK FOR FULL CREDI! Problem Max. Points Your Points 1-10 10 11 10 12 3 13 4 14 18 15 8 16 7 17 14 otal 75 Multiple choice questions (1 point each) For questions
M 140 est 1 B Name (1 point) SHOW YOUR WORK FOR FULL CREDI! Problem Max. Points Your Points 1-10 10 11 10 12 3 13 4 14 18 15 8 16 7 17 14 otal 75 Multiple choice questions (1 point each) For questions
PS2.1 & 2.2: Linear Correlations PS2: Bivariate Statistics
 PS2.1 & 2.2: Linear Correlations PS2: Bivariate Statistics LT1: Basics of Correlation LT2: Measuring Correlation and Line of best fit by eye Univariate (one variable) Displays Frequency tables Bar graphs
Conditions for Regression Inference:
 AP Statistics Chapter Notes. Inference for Linear Regression We can fit a least-squares line to any data relating two quantitative variables, but the results are useful only if the scatterplot shows a
Least Squares Regression
 Least Squares Regression Sections 5.3 & 5.4 Cathy Poliak, Ph.D. cathy@math.uh.edu Office in Fleming 11c Department of Mathematics University of Houston Lecture 14-2311 Cathy Poliak, Ph.D. cathy@math.uh.edu
1) A residual plot: A)
 A residual plot: A)") 1) A residual plot: A) B) C) D) E) displays residuals of the response variable versus the independent variable. displays residuals of the independent variable versus the response variable. displays residuals
1) A residual plot: A) B) C) D) E) displays residuals of the response variable versus the independent variable. displays residuals of the independent variable versus the response variable. displays residuals
Looking at Data Relationships. 2.1 Scatterplots W. H. Freeman and Company
 Looking at Data Relationships 2.1 Scatterplots 2012 W. H. Freeman and Company Here, we have two quantitative variables for each of 16 students. 1) How many beers they drank, and 2) Their blood alcohol
Example: Can an increase in non-exercise activity (e.g. fidgeting) help people gain less weight?
 help people gain less weight?") Example: Can an increase in non-exercise activity (e.g. fidgeting) help people gain less weight? 16 subjects overfed for 8 weeks Explanatory: change in energy use from non-exercise activity (calories)
Example: Can an increase in non-exercise activity (e.g. fidgeting) help people gain less weight? 16 subjects overfed for 8 weeks Explanatory: change in energy use from non-exercise activity (calories)
Regression and correlation. Correlation & Regression, I. Regression & correlation. Regression vs. correlation. Involve bivariate, paired data, X & Y
 Regression and correlation Correlation & Regression, I 9.07 4/1/004 Involve bivariate, paired data, X & Y Height & weight measured for the same individual IQ & exam scores for each individual Height of
Chapter 8. Linear Regression. The Linear Model. Fat Versus Protein: An Example. The Linear Model (cont.) Residuals
 Residuals") Chapter 8 Linear Regression Copyright 2007 Pearson Education, Inc. Publishing as Pearson Addison-Wesley Slide 8-1 Copyright 2007 Pearson Education, Inc. Publishing as Pearson Addison-Wesley Fat Versus
Chapter 8 Linear Regression Copyright 2007 Pearson Education, Inc. Publishing as Pearson Addison-Wesley Slide 8-1 Copyright 2007 Pearson Education, Inc. Publishing as Pearson Addison-Wesley Fat Versus
Business Statistics. Lecture 9: Simple Regression
 Business Statistics Lecture 9: Simple Regression 1 On to Model Building! Up to now, class was about descriptive and inferential statistics Numerical and graphical summaries of data Confidence intervals
YEAR 10 GENERAL MATHEMATICS 2017 STRAND: BIVARIATE DATA PART II CHAPTER 12 RESIDUAL ANALYSIS, LINEARITY AND TIME SERIES
 YEAR 10 GENERAL MATHEMATICS 2017 STRAND: BIVARIATE DATA PART II CHAPTER 12 RESIDUAL ANALYSIS, LINEARITY AND TIME SERIES This topic includes: Transformation of data to linearity to establish relationships
Correlation & Simple Regression
 Chapter 11 Correlation & Simple Regression The previous chapter dealt with inference for two categorical variables. In this chapter, we would like to examine the relationship between two quantitative variables.
Introduction to Regression
 Introduction to Regression Using Mult Lin Regression Derived variables Many alternative models Which model to choose? Model Criticism Modelling Objective Model Details Data and Residuals Assumptions 1