5.1 Bivariate Relationships
|
|
|
- Lionel Davis
- 5 years ago
- Views:
Transcription

1 Chapter 5 Summarizing Bivariate Data Source: TPS
2 5.1 Bivariate Relationships What is Bivariate data? When exploring/describing a bivariate (x,y) relationship: Determine the Explanatory and Response variables Plot the data in a scatterplot Note the Strength, Direction, and Form Note the mean and standard deviation of x and the mean and standard deviation of y Calculate and Interpret the Correlation, r Calculate and Interpret the Least Squares Regression Line in context. Assess the appropriateness of the LSRL by constructing a Residual Plot.
3 Response Vs. Explanatory Variables Response variable measures an outcome of a study, explanatory variable helps explain or influences changes in a response variable (like independent vs. dependent). Calling one variable explanatory and the other response doesn t necessarily mean that changes in one CAUSE changes in the other. Ex: Alcohol and Body temp: One effect of Alcohol is a drop in body temp. To test this, researches give several amounts of alcohol to mice and measure each mouse s body temp change. What are the explanatory and response variables?

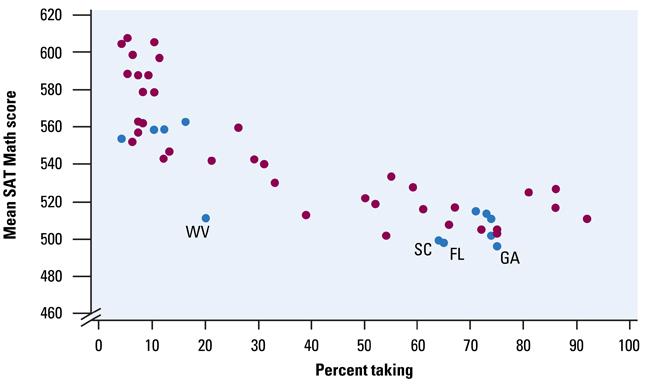
4 Scatterplots Scatterplot shows the relationship between two quantitative variables measured on the same individuals. Explanatory variables along X axis, Response variables along Y. Each individual in data appears as the point in the plot fixed by the values of both variables for that individual. Example:
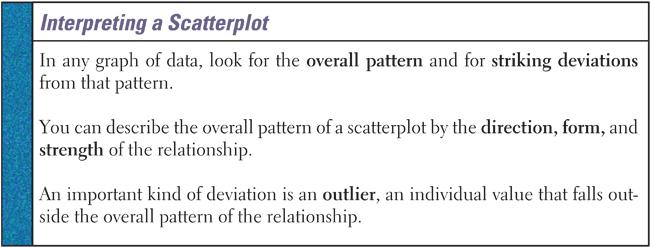
5 Interpreting Scatterplots Direction: in previous example, the overall pattern moves from upper left to lower right. We call this a negative association. Form: The form is slightly curved and there are two distinct clusters. What explains the clusters? (ACT States) Strength: The strength is determined by how closely the points follow a clear form. The example is only moderately strong. Outliers: Do we see any deviations from the pattern? (Yes, West Virginia, where 20% of HS seniors take the SAT but the mean math score is only 511).
6 Association
7 Introducing Categorical Variables
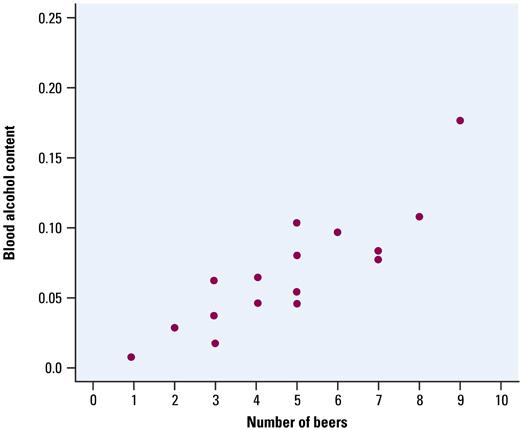
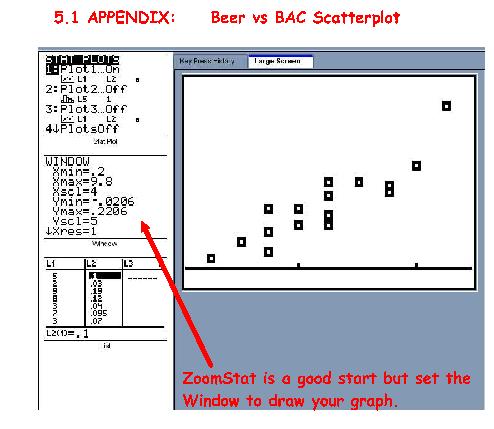
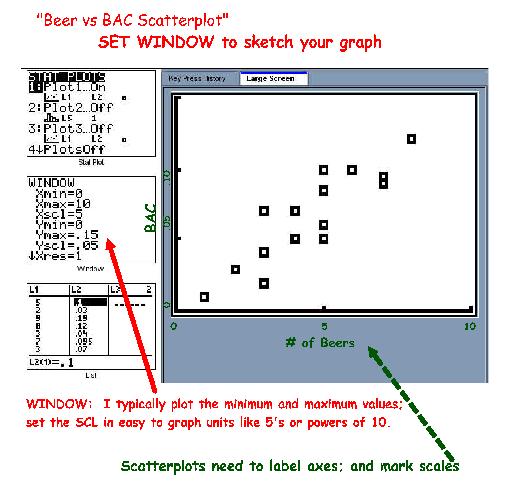
8 Calculator Scatterplot Student Beers BAC Enter the Beer consumption in L1 and the BAC values in L2 Next specify scatterplot in Statplot menu (first graph). X list L1 Y List L2 (explanatory and response) Use ZoomStat. Notice that their are no scales on the axes and they aren t labeled. If you are copying your graph to your paper, make sure you scale and label the Axis (use Trace)


9 Correlation Caution- our eyes can be fooled! Our eyes are not good judges of how strong a linear relationship is. The 2 scatterplots depict the same data but drawn with a different scale. Because of this we need a numerical measure to supplement the graph.
10 r The Correlation measures the direction and strength of the linear relationship between 2 variables. Z x Z y Formula- (don t need to memorize or use): r = n 1 In Calc: Go to Catalog (2nd, zero button), go to DiagnosticOn, enter, enter. You only have to do this ONCE! Once this is done: Enter data in L1 and L2 (you can do calc-2 var stats if you want the mean and sd of each) Calc, LinReg (A + Bx) enter
11 Interpreting r The absolute value of r tells you the strength of the association (0 means no association, 1 is a strong association) The sign tells you whether it s a positive or a negative association. So r ranges from -1 to +1 Note- it makes no difference which variable you call x and which you call y when calculating correlation, but stay consistent! Because r uses standardized values of the observations, r does not change when we change the units of measurement of x, y, or both. (Ex: Measuring height in inches vs. ft. won t change correlation with weight) values of -1 and +1 occur ONLY in the case of a perfect linear relationship, when the variables lie exactly along a straight line.

12 1. Correlation requires that both variables be quantitative Examples 2. Correlation measures the strength of only LINEAR relationships, not curved...no matter how strong they are! 3. Like the mean and standard deviation, the correlation is not resistant: r is strongly affected by a few outlying observations. Use r with caution when outliers appear in the scatterplot 4. Correlation is not a complete summary of twovariable data, even when the relationship is linearalways give the means and standard deviations of both x and y along with the correlation.
13 Properties of r (correlation coefficient) legitimate values are -1 < r < 1 Strong correlation No LINEAR Correlation Moderate Correlation Weak correlation
14 Appendix
15
16
17
Describing Bivariate Relationships
 Describing Bivariate Relationships Bivariate Relationships What is Bivariate data? When exploring/describing a bivariate (x,y) relationship: Determine the Explanatory and Response variables Plot the data
Bivariate Data Summary
 Bivariate Data Summary Bivariate data data that examines the relationship between two variables What individuals to the data describe? What are the variables and how are they measured Are the variables
BIVARIATE DATA data for two variables
 (Chapter 3) BIVARIATE DATA data for two variables INVESTIGATING RELATIONSHIPS We have compared the distributions of the same variable for several groups, using double boxplots and back-to-back stemplots.
AP Statistics Two-Variable Data Analysis
 AP Statistics Two-Variable Data Analysis Key Ideas Scatterplots Lines of Best Fit The Correlation Coefficient Least Squares Regression Line Coefficient of Determination Residuals Outliers and Influential
CHAPTER 3 Describing Relationships
 CHAPTER 3 Describing Relationships 3.1 Scatterplots and Correlation The Practice of Statistics, 5th Edition Starnes, Tabor, Yates, Moore Bedford Freeman Worth Publishers Scatterplots and Correlation Learning
Chapter 6: Exploring Data: Relationships Lesson Plan
 Chapter 6: Exploring Data: Relationships Lesson Plan For All Practical Purposes Displaying Relationships: Scatterplots Mathematical Literacy in Today s World, 9th ed. Making Predictions: Regression Line
AP Statistics Unit 6 Note Packet Linear Regression. Scatterplots and Correlation
 Scatterplots and Correlation Name Hr A scatterplot shows the relationship between two quantitative variables measured on the same individuals. variable (y) measures an outcome of a study variable (x) may
Scatterplots and Correlations
 Scatterplots and Correlations Section 4.1 1 New Definitions Explanatory Variable: (independent, x variable): attempts to explain observed outcome. Response Variable: (dependent, y variable): measures outcome
Nov 13 AP STAT. 1. Check/rev HW 2. Review/recap of notes 3. HW: pg #5,7,8,9,11 and read/notes pg smartboad notes ch 3.
 Nov 13 AP STAT 1. Check/rev HW 2. Review/recap of notes 3. HW: pg 179 184 #5,7,8,9,11 and read/notes pg 185 188 1 Chapter 3 Notes Review Exploring relationships between two variables. BIVARIATE DATA Is
AP Statistics. Chapter 6 Scatterplots, Association, and Correlation
 AP Statistics Chapter 6 Scatterplots, Association, and Correlation Objectives: Scatterplots Association Outliers Response Variable Explanatory Variable Correlation Correlation Coefficient Lurking Variables
Scatterplots. 3.1: Scatterplots & Correlation. Scatterplots. Explanatory & Response Variables. Section 3.1 Scatterplots and Correlation
 3.1: Scatterplots & Correlation Scatterplots A scatterplot shows the relationship between two quantitative variables measured on the same individuals. The values of one variable appear on the horizontal
Chapter 3: Examining Relationships
 Chapter 3: Examining Relationships Most statistical studies involve more than one variable. Often in the AP Statistics exam, you will be asked to compare two data sets by using side by side boxplots or
appstats8.notebook October 11, 2016
 Chapter 8 Linear Regression Objective: Students will construct and analyze a linear model for a given set of data. Fat Versus Protein: An Example pg 168 The following is a scatterplot of total fat versus
Session 4 2:40 3:30. If neither the first nor second differences repeat, we need to try another
 Linear Quadratics & Exponentials using Tables We can classify a table of values as belonging to a particular family of functions based on the math operations found on any calculator. First differences
4.1 Introduction. 4.2 The Scatter Diagram. Chapter 4 Linear Correlation and Regression Analysis
 4.1 Introduction Correlation is a technique that measures the strength (or the degree) of the relationship between two variables. For example, we could measure how strong the relationship is between people
Review of Regression Basics
 Review of Regression Basics When describing a Bivariate Relationship: Make a Scatterplot Strength, Direction, Form Model: y-hat=a+bx Interpret slope in context Make Predictions Residual = Observed-Predicted
Linear Regression. Linear Regression. Linear Regression. Did You Mean Association Or Correlation?
 Did You Mean Association Or Correlation? AP Statistics Chapter 8 Be careful not to use the word correlation when you really mean association. Often times people will incorrectly use the word correlation
2.1 Scatterplots. Ulrich Hoensch MAT210 Rocky Mountain College Billings, MT 59102
 2.1 Scatterplots Ulrich Hoensch MAT210 Rocky Mountain College Billings, MT 59102 Association Between Variables We now consider the situation where we have two variables. Example Let x be the age of a husband,
Scatterplots. STAT22000 Autumn 2013 Lecture 4. What to Look in a Scatter Plot? Form of an Association
 Scatterplots STAT22000 Autumn 2013 Lecture 4 Yibi Huang October 7, 2013 21 Scatterplots 22 Correlation (x 1, y 1 ) (x 2, y 2 ) (x 3, y 3 ) (x n, y n ) A scatter plot shows the relationship between two
Looking at Data Relationships. 2.1 Scatterplots W. H. Freeman and Company
 Looking at Data Relationships 2.1 Scatterplots 2012 W. H. Freeman and Company Here, we have two quantitative variables for each of 16 students. 1) How many beers they drank, and 2) Their blood alcohol
Prob/Stats Questions? /32
 Prob/Stats 10.4 Questions? 1 /32 Prob/Stats 10.4 Homework Apply p551 Ex 10-4 p 551 7, 8, 9, 10, 12, 13, 28 2 /32 Prob/Stats 10.4 Objective Compute the equation of the least squares 3 /32 Regression A scatter
y n 1 ( x i x )( y y i n 1 i y 2
( y y i n 1 i y 2") STP3 Brief Class Notes Instructor: Ela Jackiewicz Chapter Regression and Correlation In this chapter we will explore the relationship between two quantitative variables, X an Y. We will consider n ordered
STP3 Brief Class Notes Instructor: Ela Jackiewicz Chapter Regression and Correlation In this chapter we will explore the relationship between two quantitative variables, X an Y. We will consider n ordered
Least-Squares Regression. Unit 3 Exploring Data
 Least-Squares Regression Unit 3 Exploring Data Regression Line A straight line that describes how a variable,, changes as an variable,, changes unlike, requires an and variable used to predict the value
Lecture 4 Scatterplots, Association, and Correlation
 Lecture 4 Scatterplots, Association, and Correlation Previously, we looked at Single variables on their own One or more categorical variable In this lecture: We shall look at two quantitative variables.
Lecture 4 Scatterplots, Association, and Correlation
 Lecture 4 Scatterplots, Association, and Correlation Previously, we looked at Single variables on their own One or more categorical variables In this lecture: We shall look at two quantitative variables.
Scatterplots and Correlation
 Bivariate Data Page 1 Scatterplots and Correlation Essential Question: What is the correlation coefficient and what does it tell you? Most statistical studies examine data on more than one variable. Fortunately,
Example: Can an increase in non-exercise activity (e.g. fidgeting) help people gain less weight?
 help people gain less weight?") Example: Can an increase in non-exercise activity (e.g. fidgeting) help people gain less weight? 16 subjects overfed for 8 weeks Explanatory: change in energy use from non-exercise activity (calories)
Example: Can an increase in non-exercise activity (e.g. fidgeting) help people gain less weight? 16 subjects overfed for 8 weeks Explanatory: change in energy use from non-exercise activity (calories)
AP Stats ~ 3A: Scatterplots and Correlation OBJECTIVES:
 OBJECTIVES: IDENTIFY explanatory and response variables in situations where one variable helps to explain or influences the other. MAKE a scatterplot to display the relationship between two quantitative
Chapter 8. Linear Regression /71
 Chapter 8 Linear Regression 1 /71 Homework p192 1, 2, 3, 5, 7, 13, 15, 21, 27, 28, 29, 32, 35, 37 2 /71 3 /71 Objectives Determine Least Squares Regression Line (LSRL) describing the association of two
3.1 Scatterplots and Correlation
 3.1 Scatterplots and Correlation Most statistical studies examine data on more than one variable. In many of these settings, the two variables play different roles. Explanatory variable (independent) predicts
6.1.1 How can I make predictions?
 CCA Ch 6: Modeling Two-Variable Data Name: Team: 6.1.1 How can I make predictions? Line of Best Fit 6-1. a. Length of tube: Diameter of tube: Distance from the wall (in) Width of field of view (in) b.
Chapter 5: Data Transformation
 Chapter 5: Data Transformation The circle of transformations The x-squared transformation The log transformation The reciprocal transformation Regression analysis choosing the best transformation TEXT:
Related Example on Page(s) R , 148 R , 148 R , 156, 157 R3.1, R3.2. Activity on 152, , 190.
 R , 148 R , 148 R , 156, 157 R3.1, R3.2. Activity on 152, , 190.") Name Chapter 3 Learning Objectives Identify explanatory and response variables in situations where one variable helps to explain or influences the other. Make a scatterplot to display the relationship
Name Chapter 3 Learning Objectives Identify explanatory and response variables in situations where one variable helps to explain or influences the other. Make a scatterplot to display the relationship
Reminder: Univariate Data. Bivariate Data. Example: Puppy Weights. You weigh the pups and get these results: 2.5, 3.5, 3.3, 3.1, 2.6, 3.6, 2.
 TP: To review Standard Deviation, Residual Plots, and Correlation Coefficients HW: Do a journal entry on each of the calculator tricks in this lesson. Lesson slides will be posted with notes. Do Now: Write
Chapter 6 Scatterplots, Association and Correlation
 Chapter 6 Scatterplots, Association and Correlation Looking for Correlation Example Does the number of hours you watch TV per week impact your average grade in a class? Hours 12 10 5 3 15 16 8 Grade 70
S12 - HS Regression Labs Workshop. Linear. Quadratic (not required) Logarithmic. Exponential. Power
 Logarithmic. Exponential. Power") Summer 2006 I2T2 Probability & Statistics Page 181 S12 - HS Regression Labs Workshop Regression Types: Needed for Math B Linear Quadratic (not required) Logarithmic Exponential Power You can calculate
Summer 2006 I2T2 Probability & Statistics Page 181 S12 - HS Regression Labs Workshop Regression Types: Needed for Math B Linear Quadratic (not required) Logarithmic Exponential Power You can calculate
The response variable depends on the explanatory variable.
 A response variable measures an outcome of study. > dependent variables An explanatory variable attempts to explain the observed outcomes. > independent variables The response variable depends on the explanatory
Sem. 1 Review Ch. 1-3
 AP Stats Sem. 1 Review Ch. 1-3 Name 1. You measure the age, marital status and earned income of an SRS of 1463 women. The number and type of variables you have measured is a. 1463; all quantitative. b.
3.2: Least Squares Regressions
 3.2: Least Squares Regressions Section 3.2 Least-Squares Regression After this section, you should be able to INTERPRET a regression line CALCULATE the equation of the least-squares regression line CALCULATE
Chapter 3: Examining Relationships
 Chapter 3: Examining Relationships 3.1 Scatterplots 3.2 Correlation 3.3 Least-Squares Regression Fabric Tenacity, lb/oz/yd^2 26 25 24 23 22 21 20 19 18 y = 3.9951x + 4.5711 R 2 = 0.9454 3.5 4.0 4.5 5.0
Regression Using an Excel Spreadsheet Using Technology to Determine Regression
 Regression Using an Excel Spreadsheet Enter your data in columns A and B for the x and y variable respectively Highlight the entire data series by selecting it with the mouse From the Insert menu select
Chapter 12 Summarizing Bivariate Data Linear Regression and Correlation
 Chapter 1 Summarizing Bivariate Data Linear Regression and Correlation This chapter introduces an important method for making inferences about a linear correlation (or relationship) between two variables,
Module 1 Linear Regression
 Regression Analysis Although many phenomena can be modeled with well-defined and simply stated mathematical functions, as illustrated by our study of linear, exponential and quadratic functions, the world
Overview. 4.1 Tables and Graphs for the Relationship Between Two Variables. 4.2 Introduction to Correlation. 4.3 Introduction to Regression 3.
 3.1-1 Overview 4.1 Tables and Graphs for the Relationship Between Two Variables 4.2 Introduction to Correlation 4.3 Introduction to Regression 3.1-2 4.1 Tables and Graphs for the Relationship Between Two
Linear Correlation and Regression Analysis
 Linear Correlation and Regression Analysis Set Up the Calculator 2 nd CATALOG D arrow down DiagnosticOn ENTER ENTER SCATTER DIAGRAM Positive Linear Correlation Positive Correlation Variables will tend
Chapter 9. Correlation and Regression
 Chapter 9 Correlation and Regression Lesson 9-1/9-2, Part 1 Correlation Registered Florida Pleasure Crafts and Watercraft Related Manatee Deaths 100 80 60 40 20 0 1991 1993 1995 1997 1999 Year Boats in
Chapter 4 Data with Two Variables
 Chapter 4 Data with Two Variables 1 Scatter Plots and Correlation and 2 Pearson s Correlation Coefficient Looking for Correlation Example Does the number of hours you watch TV per week impact your average
Least Squares Regression
 Least Squares Regression Sections 5.3 & 5.4 Cathy Poliak, Ph.D. cathy@math.uh.edu Office in Fleming 11c Department of Mathematics University of Houston Lecture 14-2311 Cathy Poliak, Ph.D. cathy@math.uh.edu
Least-Squares Regression
 MATH 203 Least-Squares Regression Dr. Neal, Spring 2009 As well as finding the correlation of paired data {{ x 1, y 1 }, { x 2, y 2 },..., { x n, y n }}, we also can plot the data with a scatterplot and
Relationships Regression
 Relationships Regression BPS chapter 5 2006 W.H. Freeman and Company Objectives (BPS chapter 5) Regression Regression lines The least-squares regression line Using technology Facts about least-squares
Chapter 6. September 17, Please pick up a calculator and take out paper and something to write with. Association and Correlation.
 Please pick up a calculator and take out paper and something to write with. Sep 17 8:08 AM Chapter 6 Scatterplots, Association and Correlation Copyright 2015, 2010, 2007 Pearson Education, Inc. Chapter
Basic Practice of Statistics 7th
 Basic Practice of Statistics 7th Edition Lecture PowerPoint Slides In Chapter 4, we cover Explanatory and response variables Displaying relationships: Scatterplots Interpreting scatterplots Adding categorical
Chapter 4 Data with Two Variables
 Chapter 4 Data with Two Variables 1 Scatter Plots and Correlation and 2 Pearson s Correlation Coefficient Looking for Correlation Example Does the number of hours you watch TV per week impact your average
Reteach 2-3. Graphing Linear Functions. 22 Holt Algebra 2. Name Date Class
 -3 Graphing Linear Functions Use intercepts to sketch the graph of the function 3x 6y 1. The x-intercept is where the graph crosses the x-axis. To find the x-intercept, set y 0 and solve for x. 3x 6y 1
Objectives. 2.1 Scatterplots. Scatterplots Explanatory and response variables Interpreting scatterplots Outliers
 Objectives 2.1 Scatterplots Scatterplots Explanatory and response variables Interpreting scatterplots Outliers Adapted from authors slides 2012 W.H. Freeman and Company Relationship of two numerical variables
CHAPTER 3 Describing Relationships
 CHAPTER 3 Describing Relationships 3.1 Scatterplots and Correlation The Practice of Statistics, 5th Edition Starnes, Tabor, Yates, Moore Bedford Freeman Worth Publishers Scatterplots and Correlation Learning
Chapter 8. Linear Regression. The Linear Model. Fat Versus Protein: An Example. The Linear Model (cont.) Residuals
 Residuals") Chapter 8 Linear Regression Copyright 2007 Pearson Education, Inc. Publishing as Pearson Addison-Wesley Slide 8-1 Copyright 2007 Pearson Education, Inc. Publishing as Pearson Addison-Wesley Fat Versus
Chapter 8 Linear Regression Copyright 2007 Pearson Education, Inc. Publishing as Pearson Addison-Wesley Slide 8-1 Copyright 2007 Pearson Education, Inc. Publishing as Pearson Addison-Wesley Fat Versus
Chapter 8. Linear Regression. Copyright 2010 Pearson Education, Inc.
 Chapter 8 Linear Regression Copyright 2010 Pearson Education, Inc. Fat Versus Protein: An Example The following is a scatterplot of total fat versus protein for 30 items on the Burger King menu: Copyright
Mrs. Poyner/Mr. Page Chapter 3 page 1
 Name: Date: Period: Chapter 2: Take Home TEST Bivariate Data Part 1: Multiple Choice. (2.5 points each) Hand write the letter corresponding to the best answer in space provided on page 6. 1. In a statistics
Section 2.2: LINEAR REGRESSION
 Section 2.2: LINEAR REGRESSION OBJECTIVES Be able to fit a regression line to a scatterplot. Find and interpret correlation coefficients. Make predictions based on lines of best fit. Key Terms line of
Correlation A relationship between two variables As one goes up, the other changes in a predictable way (either mostly goes up or mostly goes down)
") Two-Variable Statistics Correlation A relationship between two variables As one goes up, the other changes in a predictable way (either mostly goes up or mostly goes down) Positive Correlation As one variable
Two-Variable Statistics Correlation A relationship between two variables As one goes up, the other changes in a predictable way (either mostly goes up or mostly goes down) Positive Correlation As one variable
Objectives. 2.1 Scatterplots. Scatterplots Explanatory and response variables. Interpreting scatterplots Outliers
 Objectives 2.1 Scatterplots Scatterplots Explanatory and response variables Interpreting scatterplots Outliers Adapted from authors slides 2012 W.H. Freeman and Company Relationships A very important aspect
Chapter 2: Looking at Data Relationships (Part 3)
") Chapter 2: Looking at Data Relationships (Part 3) Dr. Nahid Sultana Chapter 2: Looking at Data Relationships 2.1: Scatterplots 2.2: Correlation 2.3: Least-Squares Regression 2.5: Data Analysis for Two-Way
Chapter 2: Looking at Data Relationships (Part 3) Dr. Nahid Sultana Chapter 2: Looking at Data Relationships 2.1: Scatterplots 2.2: Correlation 2.3: Least-Squares Regression 2.5: Data Analysis for Two-Way
Prof. Bodrero s Guide to Derivatives of Trig Functions (Sec. 3.5) Name:
 Name:") Prof. Bodrero s Guide to Derivatives of Trig Functions (Sec. 3.5) Name: Objectives: Understand how the derivatives of the six basic trig functions are found. Be able to find the derivative for each of
Prof. Bodrero s Guide to Derivatives of Trig Functions (Sec. 3.5) Name: Objectives: Understand how the derivatives of the six basic trig functions are found. Be able to find the derivative for each of
Residuals, Coefficient of Determination Worksheet Solutions
 Math 121 Ravenwood Residuals, Coefficient of Determination Worksheet Solutions Atmospheric Temperature as a Function of Altitude (not real data) Which means the linear regression equation is 6.488 14.977,
THE PEARSON CORRELATION COEFFICIENT
 CORRELATION Two variables are said to have a relation if knowing the value of one variable gives you information about the likely value of the second variable this is known as a bivariate relation There
Name. The data below are airfares to various cities from Baltimore, MD (including the descriptive statistics).
.") Name The data below are airfares to various cities from Baltimore, MD (including the descriptive statistics). 178 138 94 278 158 258 198 188 98 179 138 98 N Mean Std. Dev. Min Q 1 Median Q 3 Max 12 166.92
Name The data below are airfares to various cities from Baltimore, MD (including the descriptive statistics). 178 138 94 278 158 258 198 188 98 179 138 98 N Mean Std. Dev. Min Q 1 Median Q 3 Max 12 166.92
9. Linear Regression and Correlation
 9. Linear Regression and Correlation Data: y a quantitative response variable x a quantitative explanatory variable (Chap. 8: Recall that both variables were categorical) For example, y = annual income,
x is also called the abscissa y is also called the ordinate "If you can create a t-table, you can graph anything!"
 Senior Math Section 6-1 Notes Rectangular Coordinates and Lines Label the following 1. quadrant 1 2. quadrant 2 3. quadrant 3 4. quadrant 4 5. origin 6. x-axis 7. y-axis 8. Ordered Pair (x, y) at (2, 1)
AP Statistics L I N E A R R E G R E S S I O N C H A P 7
 AP Statistics 1 L I N E A R R E G R E S S I O N C H A P 7 The object [of statistics] is to discover methods of condensing information concerning large groups of allied facts into brief and compendious
Announcements: You can turn in homework until 6pm, slot on wall across from 2202 Bren. Make sure you use the correct slot! (Stats 8, closest to wall)
") Announcements: You can turn in homework until 6pm, slot on wall across from 2202 Bren. Make sure you use the correct slot! (Stats 8, closest to wall) We will cover Chs. 5 and 6 first, then 3 and 4. Mon,
Announcements: You can turn in homework until 6pm, slot on wall across from 2202 Bren. Make sure you use the correct slot! (Stats 8, closest to wall) We will cover Chs. 5 and 6 first, then 3 and 4. Mon,
Important note: Transcripts are not substitutes for textbook assignments. 1
 In this lesson we will cover correlation and regression, two really common statistical analyses for quantitative (or continuous) data. Specially we will review how to organize the data, the importance
Algebra II Notes Quadratic Functions Unit Applying Quadratic Functions. Math Background
 Applying Quadratic Functions Math Background Previously, you Graphed and solved quadratic functions. Solved literal equations for a given variable. Found the inverse for a linear function. Verified by
Determine is the equation of the LSRL. Determine is the equation of the LSRL of Customers in line and seconds to check out.. Chapter 3, Section 2
 3.2c Computer Output, Regression to the Mean, & AP Formulas Be sure you can locate: the slope, the y intercept and determine the equation of the LSRL. Slope is always in context and context is x value.
Summarizing Data: Paired Quantitative Data
 Summarizing Data: Paired Quantitative Data regression line (or least-squares line) a straight line model for the relationship between explanatory (x) and response (y) variables, often used to produce a
Steps to take to do the descriptive part of regression analysis:
 STA 2023 Simple Linear Regression: Least Squares Model Steps to take to do the descriptive part of regression analysis: A. Plot the data on a scatter plot. Describe patterns: 1. Is there a strong, moderate,
Unit #2: Linear and Exponential Functions Lesson #13: Linear & Exponential Regression, Correlation, & Causation. Day #1
 Algebra I Name Unit #2: Linear and Exponential Functions Lesson #13: Linear & Exponential Regression, Correlation, & Causation Day #1 Period Date When a table of values increases or decreases by the same
UNIT 12 ~ More About Regression
 ***SECTION 15.1*** The Regression Model When a scatterplot shows a relationship between a variable x and a y, we can use the fitted to the data to predict y for a given value of x. Now we want to do tests
IF YOU HAVE DATA VALUES:
 Unit 02 Review Ways to obtain a line of best fit IF YOU HAVE DATA VALUES: 1. In your calculator, choose STAT > 1.EDIT and enter your x values into L1 and your y values into L2 2. Choose STAT > CALC > 8.
Mathematical Modeling
 Mathematical Modeling Sample Problem: The chart below gives the profit for a company for the years 1990 to 1999, where 0 corresponds to 1990 and the profit is in millions of dollars. Year 0 1 2 3 4 5 6
a) Do you see a pattern in the scatter plot, or does it look like the data points are
 Do you see a pattern in the scatter plot, or does it look like the data points are") Aim #93: How do we distinguish between scatter plots that model a linear versus a nonlinear equation and how do we write the linear regression equation for a set of data using our calculator? Homework:
Aim #93: How do we distinguish between scatter plots that model a linear versus a nonlinear equation and how do we write the linear regression equation for a set of data using our calculator? Homework:
Chapter 7. Scatterplots, Association, and Correlation
 Chapter 7 Scatterplots, Association, and Correlation Bin Zou (bzou@ualberta.ca) STAT 141 University of Alberta Winter 2015 1 / 29 Objective In this chapter, we study relationships! Instead, we investigate
AP STATISTICS Name: Period: Review Unit IV Scatterplots & Regressions
 AP STATISTICS Name: Period: Review Unit IV Scatterplots & Regressions Know the definitions of the following words: bivariate data, regression analysis, scatter diagram, correlation coefficient, independent
10.1: Scatter Plots & Trend Lines. Essential Question: How can you describe the relationship between two variables and use it to make predictions?
 10.1: Scatter Plots & Trend Lines Essential Question: How can you describe the relationship between two variables and use it to make predictions? Vocab Two-variable data: two data points, one individual/object.
The empirical ( ) rule
 rule") The empirical (68-95-99.7) rule With a bell shaped distribution, about 68% of the data fall within a distance of 1 standard deviation from the mean. 95% fall within 2 standard deviations of the mean. 99.7%
The empirical (68-95-99.7) rule With a bell shaped distribution, about 68% of the data fall within a distance of 1 standard deviation from the mean. 95% fall within 2 standard deviations of the mean. 99.7%
7. Do not estimate values for y using x-values outside the limits of the data given. This is called extrapolation and is not reliable.
 AP Statistics 15 Inference for Regression I. Regression Review a. r à correlation coefficient or Pearson s coefficient: indicates strength and direction of the relationship between the explanatory variables
Chapter 6. Exploring Data: Relationships
 Chapter 6 Exploring Data: Relationships For All Practical Purposes: Effective Teaching A characteristic of an effective instructor is fairness and consistenc in grading and evaluating student performance.
Correlation & Regression
 Correlation & Regression Correlation It is critical that when "interpreting" the association between 2 variables via a scatterplot, to employ "weasel words" such as in general and on average and tends
OHS Algebra 2 Summer Packet
 OHS Algebra 2 Summer Packet Good Luck to: Date Started: (please print student name here) Geometry Teacher s Name: Complete each of the following exercises in this formative assessment. To receive full
Chapter 3: Describing Relationships
 Chapter 3: Describing Relationships Section 3.2 The Practice of Statistics, 4 th edition For AP* STARNES, YATES, MOORE Chapter 3 Describing Relationships 3.1 Scatterplots and Correlation 3.2 Section 3.2
Chapter 3: Describing Relationships
 Chapter 3: Describing Relationships Section 3.2 The Practice of Statistics, 4 th edition For AP* STARNES, YATES, MOORE Chapter 3 Describing Relationships 3.1 Scatterplots and Correlation 3.2 Section 3.2
Chapter 5 Least Squares Regression
 Chapter 5 Least Squares Regression A Royal Bengal tiger wandered out of a reserve forest. We tranquilized him and want to take him back to the forest. We need an idea of his weight, but have no scale!
Intermediate Algebra Summary - Part I
 Intermediate Algebra Summary - Part I This is an overview of the key ideas we have discussed during the first part of this course. You may find this summary useful as a study aid, but remember that the
MATH 1150 Chapter 2 Notation and Terminology
 MATH 1150 Chapter 2 Notation and Terminology Categorical Data The following is a dataset for 30 randomly selected adults in the U.S., showing the values of two categorical variables: whether or not the
Final Exam - Solutions
 Ecn 102 - Analysis of Economic Data University of California - Davis March 19, 2010 Instructor: John Parman Final Exam - Solutions You have until 5:30pm to complete this exam. Please remember to put your
1) A residual plot: A)
 A residual plot: A)") 1) A residual plot: A) B) C) D) E) displays residuals of the response variable versus the independent variable. displays residuals of the independent variable versus the response variable. displays residuals
1) A residual plot: A) B) C) D) E) displays residuals of the response variable versus the independent variable. displays residuals of the independent variable versus the response variable. displays residuals
Math 1 Unit 1 EOC Review
 Math 1 Unit 1 EOC Review Solving Equations (including Literal Equations) - Get the variable to show what it equals to satisfy the equation or inequality - Steps (each step only where necessary): 1. Distribute
Chapter 7 Summary Scatterplots, Association, and Correlation
 Chapter 7 Summary Scatterplots, Association, and Correlation What have we learned? We examine scatterplots for direction, form, strength, and unusual features. Although not every relationship is linear,
Fish act Water temp
 A regression of the amount of calories in a serving of breakfast cereal vs. the amount of fat gave the following results: Calories = 97.53 + 9.6525(Fat). Which of the following is FALSE? a) It is estimated
LAB 5 INSTRUCTIONS LINEAR REGRESSION AND CORRELATION
 LAB 5 INSTRUCTIONS LINEAR REGRESSION AND CORRELATION In this lab you will learn how to use Excel to display the relationship between two quantitative variables, measure the strength and direction of the