Regression Using an Excel Spreadsheet Using Technology to Determine Regression
|
|
|
- Sheila Pope
- 5 years ago
- Views:
Transcription


1 Regression Using an Excel Spreadsheet Enter your data in columns A and B for the x and y variable respectively Highlight the entire data series by selecting it with the mouse From the Insert menu select Chart Select the XY (Scatter) for the plot type then click on Next Next Next Finish (During this time you can change the axis name, colour and scale) To find the regression for the graph select the graph and click on the Chart menu then select Add Treadline Select the regression you want to test

2 Note: The polynomial regression tool allows you to choose the degree of the polynomial: o Order 2 Quadratic o Order 3 Cubic o Order 4 Quartic o etc Click on the Options tab Then check off Display equations on chart and Display R-Squared value on chart then click OK The regression model will display on the graph Chart Title y = x x R 2 =
3 Regression with DESMOS.COM If you'd like to learn more about regressions, check out the Regressions page at Learn Desmos: To get started with regressions, you'll need some data. You can copy data from a spreadsheet and paste it into a blank expression in the calculator. Next, enter your regression model, like y1~mx1+b or y1~ax1 2 +bx1+c or y1~ax1 3 + bx1 2 +cx1+d or other degree polynomial or exponential like y1~a(b) x +c or other model (use subscripts on variables x and y). To decide which model is best look at R 2 value (needs to be as close to 1 as possible.) You can also long-hold the colored icon and make the points draggable to see how their values change the equation. Watch the video to learn more:


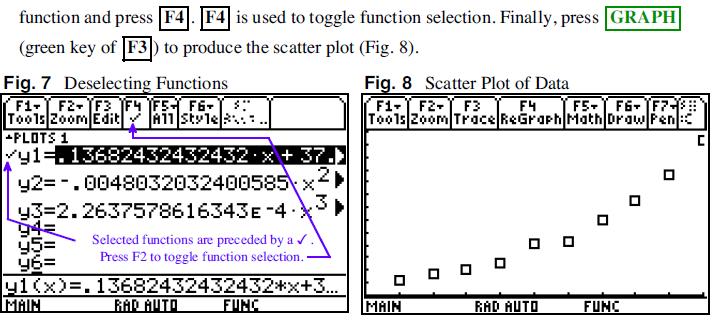
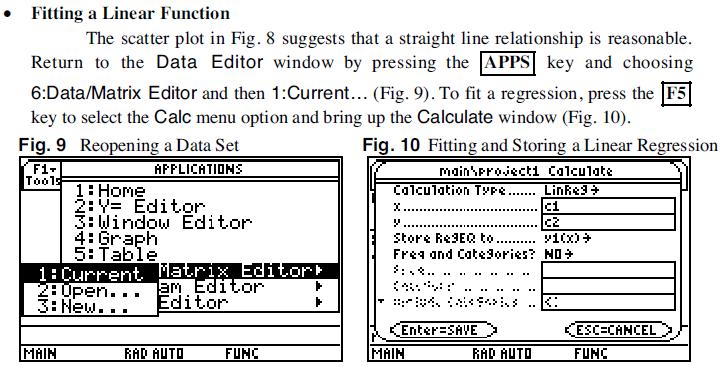
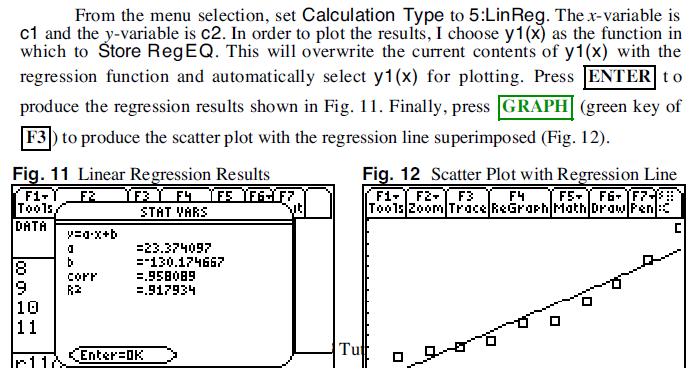
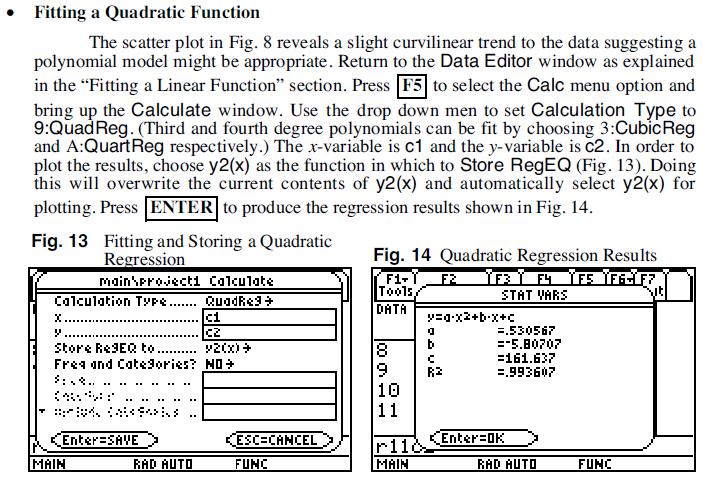
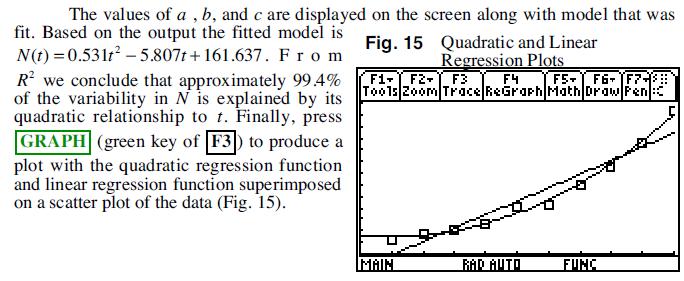
4 Regression with the Graphing Calculator TI-89

5
6
7

8 Regression with Curve Expert Free download from 1. Enter the data set in the x and y columns. 2. Click APPLY FIT from the menu, and choose nth order Polynomial, or from Calculate menu select nth order polynomial fit. 3. Type in the degree you want to use as regression. Note: The polynomial regression tool allows you to choose the degree of the polynomial: o Order 2 Quadratic o Order 3 Cubic o Order 4 Quartic o etc 4. Click INFO on the graph to see the coefficients. or from Window select to view Messages

9 Regression with the Graphing Calculator TI-83 Entering data into Lists Press STAT and select option 1 Clear lists by moving the cursor to the very top of each column in turn and pressing CLEAR then ENTER. Enter the independent variable in L1 Enter dependent variable in L2. Graphing Your Data Draw a scatter plot to show the relationship as follows: Use STATPLOT (2 nd Y=), select 1 (Plot 1) and press ENTER. Turn on the plot, choose a scatter plot and enter the correct lists for your Xlist is usually L1 (2 nd 1) and Ylist is usually L2 (2 nd 2). Press GRAPH to look at the scatter plot. (You may need to use ZOOM 9:ZoomStat in order to see the graph.) Finding the Equation of the Line of Best Fit (Regression) In order to determine the goodness of fit we need the coefficient of determination r 2. Press 2 nd 0 (CATALOG), cursor down to DIAGNOSTICON. Then press ENTER-ENTER- ENTER. (This only needs to be done one per use) Press STAT and cursor across to CALC. Choose the appropriate regression type: 4:LinReg(ax +b) LINEAR REGRESSION 5:QuadReg QUADRATIC REGRESSION 6:CubicReg CUBIC REGRESSION 7:QuartReg QUARTIC REGRESSION 9:LnReg LOGARITHMIC REGRESSION 0:ExpReg EXPONENTIAL REGRESSION For example using linear regression choose 5: QuadReg. Next, enter the appropriate list names (L1 first then L2) separated by commas. The press ENTER The r 2 value makes the quadratic model not the best fit for the data (moderate fit). The equation of this model is: Y = x x
Session 4 2:40 3:30. If neither the first nor second differences repeat, we need to try another
 Linear Quadratics & Exponentials using Tables We can classify a table of values as belonging to a particular family of functions based on the math operations found on any calculator. First differences
Lecture 48 Sections Mon, Nov 16, 2009
 and and Lecture 48 Sections 13.4-13.5 Hampden-Sydney College Mon, Nov 16, 2009 Outline and 1 2 3 4 5 6 Outline and 1 2 3 4 5 6 and Exercise 13.4, page 821. The following data represent trends in cigarette
Formative Assignment PART A
 MHF4U_2011: Advanced Functions, Grade 12, University Preparation Unit 2: Advanced Polynomial and Rational Functions Activity 2: Families of polynomial functions Formative Assignment PART A For each of
Mathematical Modeling
 Mathematical Modeling Sample Problem: The chart below gives the profit for a company for the years 1990 to 1999, where 0 corresponds to 1990 and the profit is in millions of dollars. Year 0 1 2 3 4 5 6
Introduce Exploration! Before we go on, notice one more thing. We'll come back to the derivation if we have time.
 Introduce Exploration! Before we go on, notice one more thing. We'll come back to the derivation if we have time. Simplifying the calculation of variance Notice that we can rewrite the calculation of a
Contents. 9. Fractional and Quadratic Equations 2 Example Example Example
 Contents 9. Fractional and Quadratic Equations 2 Example 9.52................................ 2 Example 9.54................................ 3 Example 9.55................................ 4 1 Peterson,
Unit Calendar. Date Sect. Topic Homework HW On-Time Apr , 2, 3 Quadratic Equations & Page 638: 3-11 Page 647: 3-29, odd
 Name/Period: Unit Calendar Date Sect. Topic Homework HW On-Time Apr. 4 10.1, 2, 3 Quadratic Equations & Page 638: 3-11 Graphs Page 647: 3-29, odd Apr. 6 9.4 10.4 Solving Quadratic Equations by Factoring
Computer simulation of radioactive decay
 Computer simulation of radioactive decay y now you should have worked your way through the introduction to Maple, as well as the introduction to data analysis using Excel Now we will explore radioactive
t. y = x x R² =
 A4-11 Model Functions finding model functions for data using technology Pre-requisites: A4-8 (polynomial functions), A4-10 (power and exponential functions) Estimated Time: 2 hours Summary Learn Solve
3 9 Curve Fitting with Polynomials
 3 9 Curve Fitting with Polynomials Relax! You will do fine today! We will review for quiz!!! (which is worth 10 points, has 20 questions, group, graphing calculator allowed, and will not be on your first
S12 - HS Regression Labs Workshop. Linear. Quadratic (not required) Logarithmic. Exponential. Power
 Logarithmic. Exponential. Power") Summer 2006 I2T2 Probability & Statistics Page 181 S12 - HS Regression Labs Workshop Regression Types: Needed for Math B Linear Quadratic (not required) Logarithmic Exponential Power You can calculate
Summer 2006 I2T2 Probability & Statistics Page 181 S12 - HS Regression Labs Workshop Regression Types: Needed for Math B Linear Quadratic (not required) Logarithmic Exponential Power You can calculate
Bivariate Data Summary
 Bivariate Data Summary Bivariate data data that examines the relationship between two variables What individuals to the data describe? What are the variables and how are they measured Are the variables
AP Statistics Two-Variable Data Analysis
 AP Statistics Two-Variable Data Analysis Key Ideas Scatterplots Lines of Best Fit The Correlation Coefficient Least Squares Regression Line Coefficient of Determination Residuals Outliers and Influential
Exponential Regression. Suppose we have paired sample data {{ x 1, y 1 }, { x 2, y 2 },..., { x n, y n }}, with all x i > 0,
 MATH 482 More Regression Dr. Neal, WKU The least-squares regression technique for linear data can be adjusted to paired data that appears to be non-linear but instead exponential, logarithmic, or power-based.
x and y, called the coordinates of the point.
 P.1 The Cartesian Plane The Cartesian Plane The Cartesian Plane (also called the rectangular coordinate system) is the plane that allows you to represent ordered pairs of real numbers by points. It is
3.7 Linear and Quadratic Models
 3.7. Linear and Quadratic Models www.ck12.org 3.7 Linear and Quadratic Models Learning Objectives Identif functions using differences and ratios. Write equations for functions. Perform eponential and quadratic
Module 2A Turning Multivariable Models into Interactive Animated Simulations
 Module 2A Turning Multivariable Models into Interactive Animated Simulations Using tools available in Excel, we will turn a multivariable model into an interactive animated simulation. Projectile motion,
Describing Bivariate Relationships
 Describing Bivariate Relationships Bivariate Relationships What is Bivariate data? When exploring/describing a bivariate (x,y) relationship: Determine the Explanatory and Response variables Plot the data
Math 52 Linear Regression Instructions TI-83
 Math 5 Linear Regression Instructions TI-83 Use the following data to study the relationship between average hours spent per week studying and overall QPA. The idea behind linear regression is to determine
Review of Section 1.1. Mathematical Models. Review of Section 1.1. Review of Section 1.1. Functions. Domain and range. Piecewise functions
 Review of Section 1.1 Functions Mathematical Models Domain and range Piecewise functions January 19, 2017 Even and odd functions Increasing and decreasing functions Mathematical Models January 19, 2017
Section 2.2: LINEAR REGRESSION
 Section 2.2: LINEAR REGRESSION OBJECTIVES Be able to fit a regression line to a scatterplot. Find and interpret correlation coefficients. Make predictions based on lines of best fit. Key Terms line of
5.1 Bivariate Relationships
 Chapter 5 Summarizing Bivariate Data Source: TPS 5.1 Bivariate Relationships What is Bivariate data? When exploring/describing a bivariate (x,y) relationship: Determine the Explanatory and Response variables
3.1 Notes for Lines and Linear Growth: What does a constant rate mean?
 3.1 Notes for Lines and Linear Growth: What does a constant rate mean? Key concept: A function is called _Linear_ if it has a _Constant growth rate You take notes and put in your own words. What is positive
Using a graphic display calculator
 12 Using a graphic display calculator CHAPTER OBJECTIVES: This chapter shows you how to use your graphic display calculator (GDC) to solve the different types of problems that you will meet in your course.
Studying Topography, Orographic Rainfall, and Ecosystems (STORE)
") Studying Topography, Orographic Rainfall, and Ecosystems (STORE) Introduction Basic Lesson 3: Using Microsoft Excel to Analyze Weather Data: Topography and Temperature This lesson uses NCDC data to compare
Studying Topography, Orographic Rainfall, and Ecosystems (STORE) Introduction Basic Lesson 3: Using Microsoft Excel to Analyze Weather Data: Topography and Temperature This lesson uses NCDC data to compare
Experiment: Oscillations of a Mass on a Spring
 Physics NYC F17 Objective: Theory: Experiment: Oscillations of a Mass on a Spring A: to verify Hooke s law for a spring and measure its elasticity constant. B: to check the relationship between the period
Connecticut Common Core Algebra 1 Curriculum. Professional Development Materials. Unit 8 Quadratic Functions
 Connecticut Common Core Algebra 1 Curriculum Professional Development Materials Unit 8 Quadratic Functions Contents Activity 8.1.3 Rolling Ball CBR Activity 8.1.7 Galileo in Dubai Activity 8.2.3 Exploring
6.1.1 How can I make predictions?
 CCA Ch 6: Modeling Two-Variable Data Name: Team: 6.1.1 How can I make predictions? Line of Best Fit 6-1. a. Length of tube: Diameter of tube: Distance from the wall (in) Width of field of view (in) b.
Using Tables and Graphing Calculators in Math 11
 Using Tables and Graphing Calculators in Math 11 Graphing calculators are not required for Math 11, but they are likely to be helpful, primarily because they allow you to avoid the use of tables in some
4.1 Introduction. 4.2 The Scatter Diagram. Chapter 4 Linear Correlation and Regression Analysis
 4.1 Introduction Correlation is a technique that measures the strength (or the degree) of the relationship between two variables. For example, we could measure how strong the relationship is between people
Unit 2, Ongoing Activity, Little Black Book of Algebra II Properties
 Unit 2, Ongoing Activity, Little Black Book of Algebra II Properties Little Black Book of Algebra II Properties Unit 2 - Polynomial Equations & Inequalities 2.1 Laws of Exponents - record the rules for
Conceptual Explanations: Modeling Data with Functions
 Conceptual Explanations: Modeling Data with Functions In school, you generally start with a function and work from there to numbers. Newton s Law tells us that F=ma. So if you push on a 3kg object with
Constant no variables, just a number. Linear Note: Same form as f () x mx b. Quadratic Note: Same form as. Cubic x to the third power
 x mx b. Quadratic Note: Same form as. Cubic x to the third power") Precalculus Notes: Section. Modeling High Degree Polnomial Functions Graphs of Polnomials Polnomial Notation f ( ) a a a... a a a is a polnomial function of degree n. n n 1 n n n1 n 1 0 n is the degree
Precalculus Notes: Section. Modeling High Degree Polnomial Functions Graphs of Polnomials Polnomial Notation f ( ) a a a... a a a is a polnomial function of degree n. n n 1 n n n1 n 1 0 n is the degree
Richter Scale and Logarithms
 activity 7.1 Richter Scale and Logarithms In this activity, you will investigate earthquake data and explore the Richter scale as a measure of the intensity of an earthquake. You will consider how numbers
Unit 8: Designs Applied Math 30. Unit 8: Designs
 8-1: Reviewing Perimeter, Area, Surface Area and Volume Perimeter: - the length (one-dimensional) around an object. Area: - the amount of space (two-dimensional) a flat-object occupies. Surface Area: -
Let the x-axis have the following intervals:
 1 & 2. For the following sets of data calculate the mean and standard deviation. Then graph the data as a frequency histogram on the corresponding set of axes. Set 1: Length of bass caught in Conesus Lake
Chill Out: How Hot Objects Cool
 Chill Out: How Hot Objects Cool Activity 17 When you have a hot drink, you know that it gradually cools off. Newton s law of cooling provides us with a model for cooling. It states that the temperature
Gravity: How fast do objects fall? Student Advanced Version
 Gravity: How fast do objects fall? Student Advanced Version Kinematics is the study of how things move their position, velocity, and acceleration. Acceleration is always due to some force acting on an
Typical kinetics Time. 1. What happens to the concentration of A over time? a. Increases b. Decreases c.
 Cheryl Coolidge Guided Inquiry Activity Enzyme Kinetics, Part One Why? Understanding the rate behavior of enzyme catalyzed reactions can help to explain how these biologically important reactions are controlled
Boyle s Law: A Multivariable Model and Interactive Animated Simulation
 Boyle s Law: A Multivariable Model and Interactive Animated Simulation Using tools available in Excel, we will turn a multivariable model into an interactive animated simulation. Projectile motion, Boyle's
How to Make or Plot a Graph or Chart in Excel
 This is a complete video tutorial on How to Make or Plot a Graph or Chart in Excel. To make complex chart like Gantt Chart, you have know the basic principles of making a chart. Though I have used Excel
Intermediate Algebra Summary - Part I
 Intermediate Algebra Summary - Part I This is an overview of the key ideas we have discussed during the first part of this course. You may find this summary useful as a study aid, but remember that the
Steps to take to do the descriptive part of regression analysis:
 STA 2023 Simple Linear Regression: Least Squares Model Steps to take to do the descriptive part of regression analysis: A. Plot the data on a scatter plot. Describe patterns: 1. Is there a strong, moderate,
1.2 Supplement: Mathematical Models: A Catalog of Essential Functions
 Math 131 -copyright Angela Allen, Fall 2011 1 1.2 Supplement: Mathematical Models: A Catalog of Essential Functions Note: Some of these examples and figures come from your textbook Single Variable Calculus:
Non-Linear Regression
 Non-Linear Regression Recall that linear regression is a technique for finding the equation of the line of best fit (LOBF) when two variables have a linear association (i.e. changes in one variable tend
Lab #10 Atomic Radius Rubric o Missing 1 out of 4 o Missing 2 out of 4 o Missing 3 out of 4
 Name: Date: Chemistry ~ Ms. Hart Class: Anions or Cations 4.7 Relationships Among Elements Lab #10 Background Information The periodic table is a wonderful source of information about all of the elements
Contents 16. Higher Degree Equations
 Contents 16. Higher Degree Equations 2 16.3 Finding Roots of Higher Degree Equations................. 2 Example 16.15............................... 2 Example 16.16............................... 2 Example
Unit #2: Linear and Exponential Functions Lesson #13: Linear & Exponential Regression, Correlation, & Causation. Day #1
 Algebra I Name Unit #2: Linear and Exponential Functions Lesson #13: Linear & Exponential Regression, Correlation, & Causation Day #1 Period Date When a table of values increases or decreases by the same
An area chart emphasizes the trend of each value over time. An area chart also shows the relationship of parts to a whole.
 Excel 2003 Creating a Chart Introduction Page 1 By the end of this lesson, learners should be able to: Identify the parts of a chart Identify different types of charts Create an Embedded Chart Create a
How many states. Record high temperature
 Record high temperature How many states Class Midpoint Label 94.5 99.5 94.5-99.5 0 97 99.5 104.5 99.5-104.5 2 102 102 104.5 109.5 104.5-109.5 8 107 107 109.5 114.5 109.5-114.5 18 112 112 114.5 119.5 114.5-119.5
α m ! m or v T v T v T α m mass
 FALLING OBJECTS (WHAT TO TURN IN AND HOW TO DO SO) In the real world, because of air resistance, objects do not fall indefinitely with constant acceleration. One way to see this is by comparing the fall
M&M Exponentials Exponential Function
 M&M Exponentials Exponential Function Teacher Guide Activity Overview In M&M Exponentials students will experiment with growth and decay functions. Students will also graph their experimental data and
Algebra Review. Finding Zeros (Roots) of Quadratics, Cubics, and Quartics. Kasten, Algebra 2. Algebra Review
 of Quadratics, Cubics, and Quartics. Kasten, Algebra 2. Algebra Review") Kasten, Algebra 2 Finding Zeros (Roots) of Quadratics, Cubics, and Quartics A zero of a polynomial equation is the value of the independent variable (typically x) that, when plugged-in to the equation,
Kasten, Algebra 2 Finding Zeros (Roots) of Quadratics, Cubics, and Quartics A zero of a polynomial equation is the value of the independent variable (typically x) that, when plugged-in to the equation,
CP Algebra 2. Unit 3B: Polynomials. Name: Period:
 CP Algebra 2 Unit 3B: Polynomials Name: Period: Learning Targets 10. I can use the fundamental theorem of algebra to find the expected number of roots. Solving Polynomials 11. I can solve polynomials by
Polynomial Models Studio Excel 2007 for Windows Instructions
 Polynomial Models Studio Excel 2007 for Windows Instructions A. Download the data spreadsheet, open it, and select the tab labeled Murder. This has the FBI Uniform Crime Statistics reports of Murder and
Chemical Kinetics: Integrated Rate Laws. ** updated Procedure for Spec 200 use **
 Chemical Kinetics: Integrated Rate Laws ** updated Procedure for Spec 200 use ** *DISCLAIMER: It is highly recommended that students bring in their own computers to lab this week to use excel. There may
USING THE EXCEL CHART WIZARD TO CREATE CURVE FITS (DATA ANALYSIS).
.") USING THE EXCEL CHART WIZARD TO CREATE CURVE FITS (DATA ANALYSIS). Note to physics students: Even if this tutorial is not given as an assignment, you are responsible for knowing the material contained
USING THE EXCEL CHART WIZARD TO CREATE CURVE FITS (DATA ANALYSIS). Note to physics students: Even if this tutorial is not given as an assignment, you are responsible for knowing the material contained
MEASUREMENT OF THE CHARGE TO MASS RATIO (e/m e ) OF AN ELECTRON
 OF AN ELECTRON") MEASUREMENT OF THE CHARGE TO MASS RATIO (e/m e ) OF AN ELECTRON Object This experiment will allow you to observe and understand the motion of a charged particle in a magnetic field and to measure the ratio
MEASUREMENT OF THE CHARGE TO MASS RATIO (e/m e ) OF AN ELECTRON Object This experiment will allow you to observe and understand the motion of a charged particle in a magnetic field and to measure the ratio
Algebra II Notes Quadratic Functions Unit Applying Quadratic Functions. Math Background
 Applying Quadratic Functions Math Background Previously, you Graphed and solved quadratic functions. Solved literal equations for a given variable. Found the inverse for a linear function. Verified by
MINI LESSON. Lesson 2a Linear Functions and Applications
 MINI LESSON Lesson 2a Linear Functions and Applications Lesson Objectives: 1. Compute AVERAGE RATE OF CHANGE 2. Explain the meaning of AVERAGE RATE OF CHANGE as it relates to a given situation 3. Interpret
MPM2D - Practice Mastery Test #5
 MPM2D - Practice Mastery Test #5 Multiple Choice Identify the choice that best completes the statement or answers the question. 1. 2. If, then x = a. -4 b. -3 c. 1 d. 2 3. Simplify 4. Select the table
EXPLORING THE RELATIONSHIP BETWEEN LIGHT INTENSITY AND DISTANCE
 Name Partner(s) Section Date EXPLORING THE RELATIONSHIP BETWEEN LIGHT INTENSITY AND DISTANCE We commonly refer to light intensity as brightness. More precisely, intensity is defined as the rate at which
Lab 15 Taylor Polynomials
 Name Student ID # Instructor Lab Period Date Due Lab 15 Taylor Polynomials Objectives 1. To develop an understanding for error bound, error term, and interval of convergence. 2. To visualize the convergence
M61 1 M61.1 PC COMPUTER ASSISTED DETERMINATION OF ANGULAR ACCELERATION USING TORQUE AND MOMENT OF INERTIA
 M61 1 M61.1 PC COMPUTER ASSISTED DETERMINATION OF ANGULAR ACCELERATION USING TORQUE AND MOMENT OF INERTIA PRELAB: Before coming to the lab, you must write the Object and Theory sections of your lab report
WEATHER AND CLIMATE COMPLETING THE WEATHER OBSERVATION PROJECT CAMERON DOUGLAS CRAIG
 WEATHER AND CLIMATE COMPLETING THE WEATHER OBSERVATION PROJECT CAMERON DOUGLAS CRAIG Introduction The Weather Observation Project is an important component of this course that gets you to look at real
MEASUREMENT OF THE CHARGE TO MASS RATIO (e/m e ) OF AN ELECTRON
 OF AN ELECTRON") MEASUREMENT OF THE CHARGE TO MASS RATIO (e/m e ) OF AN ELECTRON Object This experiment will allow you to observe and understand the motion of a charged particle in a magnetic field and to measure the ratio
MEASUREMENT OF THE CHARGE TO MASS RATIO (e/m e ) OF AN ELECTRON Object This experiment will allow you to observe and understand the motion of a charged particle in a magnetic field and to measure the ratio
Photometry of Supernovae with Makali i
 Photometry of Supernovae with Makali i How to perform photometry specifically on supernovae targets using the free image processing software, Makali i This worksheet describes how to use photometry to
371 Lab Rybolt Data Analysis Assignment Name
 Data Analysis Assignment 1 371 Lab Rybolt Data Analysis Assignment Name You wake up one morning and feel you may have a fever. You have an oral thermometer marked in Celsius degrees and find your temperature
Chapter 12: Linear Regression and Correlation
 Chapter 12: Linear Regression and Correlation Linear Equations Linear regression for two variables is based on a linear equation with one independent variable. It has the form: y = a + bx where a and b
UNIT 2 QUADRATIC FUNCTIONS AND MODELING Lesson 2: Interpreting Quadratic Functions Instruction
 Prerequisite Skills This lesson requires the use of the following skills: knowing the standard form of quadratic functions using graphing technolog to model quadratic functions Introduction The tourism
1 Introduction to Minitab
 1 Introduction to Minitab Minitab is a statistical analysis software package. The software is freely available to all students and is downloadable through the Technology Tab at my.calpoly.edu. When you
Experiment 0 ~ Introduction to Statistics and Excel Tutorial. Introduction to Statistics, Error and Measurement
 Experiment 0 ~ Introduction to Statistics and Excel Tutorial Many of you already went through the introduction to laboratory practice and excel tutorial in Physics 1011. For that reason, we aren t going
OHS Algebra 2 Summer Packet
 OHS Algebra 2 Summer Packet Good Luck to: Date Started: (please print student name here) Geometry Teacher s Name: Complete each of the following exercises in this formative assessment. To receive full
Error Analysis, Statistics and Graphing Workshop
 Error Analysis, Statistics and Graphing Workshop Percent error: The error of a measurement is defined as the difference between the experimental and the true value. This is often expressed as percent (%)
18-Dec-12 PHYS Simple Pendulum. To investigate the fundamental physical properties of a simple pendulum.
 Objective Simple Pendulum To investigate the fundamental physical properties of a simple pendulum. Equipment Needed Simple Pendulum Apparatus with Meter Scale and Protractor Bobs 4 (Aluminum, Brass, Lead,
Polynomial Functions and Their Graphs. Definition of a Polynomial Function: numbers, with a n 0. The function defined by
 Polynomial Functions and Their Graphs Definition of a Polynomial Function: Let n be a nonnegative number and let a n, a n 1, a 2, a 1, a 0 be real numbers, with a n 0. The function defined by f(x) = a
Probable Factors. Problem Statement: Equipment. Introduction Setting up the simulation. Student Activity
 Student Activity 7 8 9 10 11 1 TI-Nspire CAS Investigation Student 10min Problem Statement: What is the probability that a randomly generated quadratic can be factorised? This investigation looks at a
Reminder: Univariate Data. Bivariate Data. Example: Puppy Weights. You weigh the pups and get these results: 2.5, 3.5, 3.3, 3.1, 2.6, 3.6, 2.
 TP: To review Standard Deviation, Residual Plots, and Correlation Coefficients HW: Do a journal entry on each of the calculator tricks in this lesson. Lesson slides will be posted with notes. Do Now: Write
EXCELLING WITH BIOLOGICAL MODELS FROM THE CLASSROOM T0 RESEARCH
 EXCELLING WITH BIOLOGICAL MODELS FROM THE CLASSROOM T0 RESEARCH Timothy D. Comar Benedictine University Department of Mathematics 5700 College Road Lisle, IL 60532 tcomar@ben.edu Introduction Computer
Module 1 Linear Regression
 Regression Analysis Although many phenomena can be modeled with well-defined and simply stated mathematical functions, as illustrated by our study of linear, exponential and quadratic functions, the world
Heinemann VCE Zone textbook reference General Mathematics
 Contents Cross-reference table for TI-Nspire CAS skills required for Heinemann VCE Zone: General, Heinemann VCE Zone: Further and Heinemann VCE Zone: Specialist. Code Description TS.1 Rounding off 4 TS.2
Simple Linear Regression
 CHAPTER 13 Simple Linear Regression CHAPTER OUTLINE 13.1 Simple Linear Regression Analysis 13.2 Using Excel s built-in Regression tool 13.3 Linear Correlation 13.4 Hypothesis Tests about the Linear Correlation
through any three given points if and only if these points are not collinear.
 Discover Parabola Time required 45 minutes Teaching Goals: 1. Students verify that a unique parabola with the equation y = ax + bx+ c, a 0, exists through any three given points if and only if these points
LAB 5 INSTRUCTIONS LINEAR REGRESSION AND CORRELATION
 LAB 5 INSTRUCTIONS LINEAR REGRESSION AND CORRELATION In this lab you will learn how to use Excel to display the relationship between two quantitative variables, measure the strength and direction of the
Lesson 6b Rational Exponents & Radical Functions
 Lesson 6b Rational Exponents & Radical Functions In this lesson, we will continue our review of Properties of Exponents and will learn some new properties including those dealing with Rational and Radical
Module 8: Linear Regression. The Applied Research Center
 Module 8: Linear Regression The Applied Research Center Module 8 Overview } Purpose of Linear Regression } Scatter Diagrams } Regression Equation } Regression Results } Example Purpose } To predict scores
Free Fall. v gt (Eq. 4) Goals and Introduction
 Goals and Introduction") Free Fall Goals and Introduction When an object is subjected to only a gravitational force, the object is said to be in free fall. This is a special case of a constant-acceleration motion, and one that
Free Fall Goals and Introduction When an object is subjected to only a gravitational force, the object is said to be in free fall. This is a special case of a constant-acceleration motion, and one that
Regressions of Olympic Proportions
 About the Lesson In this activity, students use the Manual-Fit and Linear Regression commands to find lines of best fit to model data from the Olympic Games. As a result, students will: Develop and evaluate
3.2 Quadratic Equations by Graphing
 www.ck12.org Chapter 3. Quadratic Equations and Quadratic Functions 3.2 Quadratic Equations by Graphing Learning Objectives Identify the number of solutions of quadratic equations. Solve quadratic equations
Scatterplots. 3.1: Scatterplots & Correlation. Scatterplots. Explanatory & Response Variables. Section 3.1 Scatterplots and Correlation
 3.1: Scatterplots & Correlation Scatterplots A scatterplot shows the relationship between two quantitative variables measured on the same individuals. The values of one variable appear on the horizontal
Contents. 13. Graphs of Trigonometric Functions 2 Example Example
 Contents 13. Graphs of Trigonometric Functions 2 Example 13.19............................... 2 Example 13.22............................... 5 1 Peterson, Technical Mathematics, 3rd edition 2 Example 13.19
THE CRYSTAL BALL SCATTER CHART
 One-Minute Spotlight THE CRYSTAL BALL SCATTER CHART Once you have run a simulation with Oracle s Crystal Ball, you can view several charts to help you visualize, understand, and communicate the simulation
Correlation and Regression
 A. The Basics of Correlation Analysis 1. SCATTER DIAGRAM A key tool in correlation analysis is the scatter diagram, which is a tool for analyzing potential relationships between two variables. One variable
Topic 1: Plotting Data Basic introduction to entering and plotting data, displaying error bars and appropriate labels.
 PHY 530 Module C1 Spread Sheet Physics Topic 1: Plotting Data Basic introduction to entering and plotting data, displaying error bars and appropriate labels. Topic 2: Plotting functions How to generate
Tools. What do you notice? understand the meaning of negative and zero exponents? multiply each power to get the next result? power of 2.
 .6 Negative and Zero Exponents Archaeologists use radioactivity to determine the age of an artifact. For organic remains, such as bone, cloth, and wood, the typical method used is carbon- dating. This
Stoichiometric Reactor Simulation Robert P. Hesketh and Concetta LaMarca Chemical Engineering, Rowan University (Revised 4/8/09)
") Stoichiometric Reactor Simulation Robert P. Hesketh and Concetta LaMarca Chemical Engineering, Rowan University (Revised 4/8/09) In this session you will learn how to create a stoichiometric reactor model
Stoichiometric Reactor Simulation Robert P. Hesketh and Concetta LaMarca Chemical Engineering, Rowan University (Revised 4/8/09) In this session you will learn how to create a stoichiometric reactor model
module, with the exception that the vials are larger and you only use one initial population size.
 Population Dynamics and Space Availability (http://web.as.uky.edu/biology/faculty/cooper/population%20dynamics%20examples%2 0with%20fruit%20flies/TheAmericanBiologyTeacher- PopulationDynamicsWebpage.html
TEACHER NOTES MATH NSPIRED
 Math Objectives Students will understand how various data transformations can be used to achieve a linear relationship and, consequently, how to use the methods of linear regression to obtain a line of
Measuring Momentum: Using distance moved after impact to estimate velocity
 Case File 6 Measuring Momentum: Using distance moved after impact to estimate velocity Explore how the speed of an impacting vehicle causes a stationary object to move. Police Report Last Tuesday night,
LESSON #59 - LINEAR FUNCTIONS AND MODELING COMMON CORE ALGEBRA II
 1 LESSON #59 - LINEAR FUNCTIONS AND MODELING COMMON CORE ALGEBRA II A linear function is any pattern where the function increases or decreases by the same numerical constant per unit. It is a function