a) Do you see a pattern in the scatter plot, or does it look like the data points are
|
|
|
- Holly Smith
- 5 years ago
- Views:
Transcription
1

2
3 Aim #93: How do we distinguish between scatter plots that model a linear versus a nonlinear equation and how do we write the linear regression equation for a set of data using our calculator? Homework: Handout Do Now: 1) A scatter plot is an informative way to display numerical data with two variables. Here is a scatter plot of the data on elevation and mean number of clear days. a) Do you see a pattern in the scatter plot, or does it look like the data points are scattered? b) How would you describe the relationship between elevation and mean number of clear days for these 14 cities? Do the mean number of clear days tend to increase or decrease as elevation increases? Since the points correlate in a linear fashion, a linear regression equation (also known as the line of best fit or least squares line) can be used to represent the relationship between the mean number of clear days and elevation. The line of best fit will not go through every point on this scatter plot above. 2) The scatter plot below shows number of cell phone calls and age. Is there a relationship between number of cell phone calls and age? If there is a relationship between number of cell phone calls and age, does the relationship appear to be linear?
4 3) Below are three scatter plots. Each one represents a data set with eight observations. The scales on the x and y axes have been left off these plots on purpose so you will have to think carefully about the relationships. a) If one of these scatter plots represents the relationship between height and weight for eight adults, which scatter plot do you think it is and why? b) If one of these scatter plots represents the relationship between height and SAT math score for eight high school seniors, which scatter plot do you think it is and why? c) If one of these scatter plots represents the relationship between the weight of a car and fuel efficiency for eight cars, which scatter plot do you think it is and why? d) Which of these three scatter plots does not appear to represent a linear relationship? Explain the reasoning behind your choice.
5 4) Describe the type of relationship (linear, exponential, quadratic, or none) for each scatter plot: 5) The scatter plot below compares frying time and moisture content. Is there a relationship, and if so, what type, between these variables or do the data points look scattered?
6 6) The scatter plot below shows a straight line that can be used to model the relationship between elevation and mean number of clear days. The equation of this line is y = x. a) There are 14 US cities shown in the scatter plot above. Should you see more clear days per year in Los Angeles, which is near sea level or in Denver which is known as the mile high city? Justify your choice. b) One of the cities in the data set was Albany, New York, which has an elevation of 275 feet. What would you predict this number to be based on the equation of the line that describes the relationship between elevation and mean number of clear days? c) Another city in the data set was Albuquerque, New Mexico. It has an elevation of 5,311 feet. What would you predict this number to be using the equation of the line? d) The actual value for Albany is 69 clear days and the actual value for Albuquerque is 167 clear days. Was the prediction of the mean number of clear days based on the line closer to the actual value for Albany or for Albuquerque? How could you tell this from looking at the scatter plot with the line shown above?
7 7) Kendra watched a show where investigators used a shoe print to help identify a suspect in a case. She questioned how it is possible to predict someone s height from his shoe print. To investigate, she collected data on shoe length (in inches) and height (in inches) from 10 adult men. Her data appears in the table and scatter plot below. Steps for finding the linear regression equation (also known as the line of best fit) 1. Stat Edit Enter your data into L1 and L2 2. Stat Calc Choose LinReg (4) a) Using your calculator, write the linear regression equation for the table above where shoe size is the independent variable. Round the slope to the nearest hundredth and y-intercept to the nearest tenth. b) Is there a relationship between shoe length and height? Explain c) Do the men with longer shoe lengths tend to be taller? d) Using the equation of the line of best fit from part (a), predict the height of a man with a shoe length of 12 inches. Round to the nearest hundredth. e) Use the equation of the line of best fit to predict the height of a man with a shoe length of 12.6 inches. f) How does the predication from part e compare to the first data point in the table? Sum it up! A scatter plot can be used to investigate whether or not there is a relationship between two numerical variables. This relationship can be described as linear or nonlinear.
Aim #92: How do we interpret and calculate deviations from the mean? How do we calculate the standard deviation of a data set?
 Aim #92: How do we interpret and calculate deviations from the mean? How do we calculate the standard deviation of a data set? 5-1-17 Homework: handout Do Now: Using the graph below answer the following
1. Write an expression of the third degree that is written with a leading coefficient of five and a constant of ten., find C D.
 1. Write an expression of the third degree that is written with a leading coefficient of five and a constant of ten. 2 2 2. If C = 4x 7x 9 and D = 5x 7x 3, find C D. 3. At an ice cream shop, the profit,,
Reteach 2-3. Graphing Linear Functions. 22 Holt Algebra 2. Name Date Class
 -3 Graphing Linear Functions Use intercepts to sketch the graph of the function 3x 6y 1. The x-intercept is where the graph crosses the x-axis. To find the x-intercept, set y 0 and solve for x. 3x 6y 1
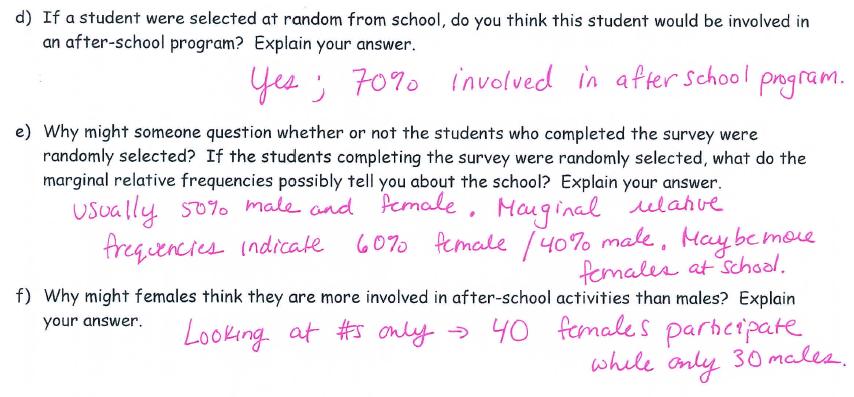
a. Write what the survey would look like (Hint: there should be 2 questions and options to select for an answer!).
.") HW 13-1 1. Several students at Rufus King High School were debating whether males or females were more involved in afterschool activities. There are three organized activities in the afterschool program
HW 13-1 1. Several students at Rufus King High School were debating whether males or females were more involved in afterschool activities. There are three organized activities in the afterschool program
Unit Six Information. EOCT Domain & Weight: Algebra Connections to Statistics and Probability - 15%
 GSE Algebra I Unit Six Information EOCT Domain & Weight: Algebra Connections to Statistics and Probability - 15% Curriculum Map: Describing Data Content Descriptors: Concept 1: Summarize, represent, and
Interpreting Correlation & Examining Cause and Effect
 LESSON 15 Interpreting Correlation & Examining Cause and Effect LEARNING OBJECTIVES Today I am: exploring linear relationships between data sets. So that I can: determine if the r-value will be closer
Mrs. Poyner/Mr. Page Chapter 3 page 1
 Name: Date: Period: Chapter 2: Take Home TEST Bivariate Data Part 1: Multiple Choice. (2.5 points each) Hand write the letter corresponding to the best answer in space provided on page 6. 1. In a statistics
POLYNOMIAL FUNCTIONS. Chapter 5
 POLYNOMIAL FUNCTIONS Chapter 5 5.1 EXPLORING THE GRAPHS OF POLYNOMIAL FUNCTIONS 5.2 CHARACTERISTICS OF THE EQUATIONS OF POLYNOMIAL FUNCTIONS Chapter 5 POLYNOMIAL FUNCTIONS What s a polynomial? A polynomial
OHS Algebra 2 Summer Packet
 OHS Algebra 2 Summer Packet Good Luck to: Date Started: (please print student name here) Geometry Teacher s Name: Complete each of the following exercises in this formative assessment. To receive full
H l o t lol t M t c M D gc o ed u o g u al a 1 g A al lg Al e g b e r r 1 a
 Holt Algebra McDougal 1 Algebra 1 Warm Up Line of Best Fit Identify the slope and the y-intercept. 1. y = -2x + 1 m = -2, b = 1 2. y = 2 2 x - 4 m=, b = -4 3 3 Identify the correlation (positive, negative,
Algebra II Notes Quadratic Functions Unit Applying Quadratic Functions. Math Background
 Applying Quadratic Functions Math Background Previously, you Graphed and solved quadratic functions. Solved literal equations for a given variable. Found the inverse for a linear function. Verified by
Announcements: You can turn in homework until 6pm, slot on wall across from 2202 Bren. Make sure you use the correct slot! (Stats 8, closest to wall)
") Announcements: You can turn in homework until 6pm, slot on wall across from 2202 Bren. Make sure you use the correct slot! (Stats 8, closest to wall) We will cover Chs. 5 and 6 first, then 3 and 4. Mon,
Announcements: You can turn in homework until 6pm, slot on wall across from 2202 Bren. Make sure you use the correct slot! (Stats 8, closest to wall) We will cover Chs. 5 and 6 first, then 3 and 4. Mon,
Name Class Date. Residuals and Linear Regression Going Deeper
 Name Class Date 4-8 and Linear Regression Going Deeper Essential question: How can you use residuals and linear regression to fit a line to data? You can evaluate a linear model s goodness of fit using
Unit #2: Linear and Exponential Functions Lesson #13: Linear & Exponential Regression, Correlation, & Causation. Day #1
 Algebra I Name Unit #2: Linear and Exponential Functions Lesson #13: Linear & Exponential Regression, Correlation, & Causation Day #1 Period Date When a table of values increases or decreases by the same
1) A residual plot: A)
 A residual plot: A)") 1) A residual plot: A) B) C) D) E) displays residuals of the response variable versus the independent variable. displays residuals of the independent variable versus the response variable. displays residuals
1) A residual plot: A) B) C) D) E) displays residuals of the response variable versus the independent variable. displays residuals of the independent variable versus the response variable. displays residuals
1. The following two-way frequency table shows information from a survey that asked the gender and the language class taken of a group of students.
 Name Algebra Unit 13 Practice Test 1. The following two-way frequency table shows information from a survey that asked the gender and the language class taken of a group of students. Spanish French other
Unit 3 Functions HW #1 Mrs. Dailey
 HW#1 Name Algebra II Unit Functions HW #1 Mrs. Dailey 1) In each of the following, the variable pair given are proportional to one another. Find the missing value. (a) b = 8 when a = 16 b =? when a = 18
SHORT ANSWER. Write the word or phrase that best completes each statement or answers the question. x )
") Midterm Review Name SHORT ANSWER. Write the word or phrase that best completes each statement or answers the question. Decide whether or not the arrow diagram defines a function. 1) Domain Range 1) Determine
Midterm Review Name SHORT ANSWER. Write the word or phrase that best completes each statement or answers the question. Decide whether or not the arrow diagram defines a function. 1) Domain Range 1) Determine
0815AI Common Core State Standards
 0815AI Common Core State Standards 1 Given the graph of the line represented by the equation f(x) = 2x + b, if b is increased by 4 units, the graph of the new line would be shifted 4 units 1) right 2)
NUMB3RS Activity: How Does it Fit?
 Name Regression 1 NUMB3RS Activity: How Does it Fit? A series of sniper shootings has reduced the city of Los Angeles to a virtual ghost town. To help solve the shootings, the FBI has enlisted the help
PAP Geometry Summer Work- Show your work
 PRE- PAP Geometry Summer Work- Show your work Solve the equation. Check your solution. 1. 2. Solve the equation. 3. 4. 5. Describe the values of c for which the equation has no solution. Write the sentence
Section 2.2: LINEAR REGRESSION
 Section 2.2: LINEAR REGRESSION OBJECTIVES Be able to fit a regression line to a scatterplot. Find and interpret correlation coefficients. Make predictions based on lines of best fit. Key Terms line of
Correlation and Regression
 A. The Basics of Correlation Analysis 1. SCATTER DIAGRAM A key tool in correlation analysis is the scatter diagram, which is a tool for analyzing potential relationships between two variables. One variable
Reminder: Univariate Data. Bivariate Data. Example: Puppy Weights. You weigh the pups and get these results: 2.5, 3.5, 3.3, 3.1, 2.6, 3.6, 2.
 TP: To review Standard Deviation, Residual Plots, and Correlation Coefficients HW: Do a journal entry on each of the calculator tricks in this lesson. Lesson slides will be posted with notes. Do Now: Write
4.5 linear regression ink.notebook. November 29, page 159. page 160. page Linear Regression. Standards. Lesson Objectives Standards
 4.5 linear regression ink.notebook page 159 page 160 page 158 4.5 Linear Regression Lesson Objectives Lesson Objectives Standards Standards Lesson Notes Lesson Notes 4.5 Linear Regression F.BF.1 I will
In 1 6, match each scatterplot with the appropriate correlation coefficient. a) +1 b) +0.8 c) +0.3 d) 0 e) -0.6 f) -0.9
 +1 b) +0.8 c) +0.3 d) 0 e) -0.6 f) -0.9") Homework 11.1 In 1 6, match each scatterplot with the appropriate correlation coefficient. a) +1 b) +0.8 c) +0.3 d) 0 e) -0.6 f) -0.9 1. 2. 3. 4. 5. 6. Match each graph with a description of its correlation
Homework 11.1 In 1 6, match each scatterplot with the appropriate correlation coefficient. a) +1 b) +0.8 c) +0.3 d) 0 e) -0.6 f) -0.9 1. 2. 3. 4. 5. 6. Match each graph with a description of its correlation
Session 4 2:40 3:30. If neither the first nor second differences repeat, we need to try another
 Linear Quadratics & Exponentials using Tables We can classify a table of values as belonging to a particular family of functions based on the math operations found on any calculator. First differences
4.5 linear regression ink.notebook. November 30, page 177 page Linear Regression. Standards. page 179. Lesson Objectives.
 4.5 linear regression ink.notebook page 177 page 178 4.5 Linear Regression Lesson Objectives Standards Lesson Notes page 179 4.5 Linear Regression Press the tabs to view details. 1 Lesson Objectives Standards
Determine the line of best fit for this data. Write an equation to represent the line of best fit.
 Integrated Math I, Subpart 3 Calculator Allowed TN0030684 21 Samatha owns a local ice cream stand. She recorded the high temperatures, in degrees Fahrenheit, and her ice cream sales, in dollars, for eight
Correlation Coefficient: the quantity, measures the strength and direction of a linear relationship between 2 variables.
 AFM Unit 9 Regression Day 1 notes A mathematical model is an equation that best describes a particular set of paired data. These mathematical models are referred to as models and are used to one variable
Five people were asked approximately how many hours of TV they watched per week. Their responses were as follows.
 Exit icket Sample Solutions Five people were asked approximately how many hours of V they watched per week. heir responses were as follows. 1. Find the mean number of hours of V watched for these five
Analyzing Lines of Fit
 4.5 Analyzing Lines of Fit Essential Question How can you analytically find a line of best fit for a scatter plot? Finding a Line of Best Fit Work with a partner. The scatter plot shows the median ages
HighSchoolMathTeachers 2017 Page 1
 1 A study compared the number of years of education a person received and that person's average yearly salary. It was determined that the relationship between these two quantities was linear and the correlation
Steps to take to do the descriptive part of regression analysis:
 STA 2023 Simple Linear Regression: Least Squares Model Steps to take to do the descriptive part of regression analysis: A. Plot the data on a scatter plot. Describe patterns: 1. Is there a strong, moderate,
S.ID.C.8: Correlation Coefficient
 S.ID.C.8: Correlation Coefficient 1 Which statement regarding correlation is not true? 1) The closer the absolute value of the correlation coefficient is to one, the closer the data conform to a line.
1. Graph (on graph paper) the following equations by creating a table and plotting points on a coordinate grid y = -2x 2 4x + 2 x y.
 the following equations by creating a table and plotting points on a coordinate grid y = -2x 2 4x + 2 x y.") 1. Graph (on graph paper) the following equations by creating a table and plotting points on a coordinate grid y = -2x 2 4x + 2 x y y = x 2 + 6x -3 x y domain= range= -4-3 -2-1 0 1 2 3 4 domain= range=
1. Graph (on graph paper) the following equations by creating a table and plotting points on a coordinate grid y = -2x 2 4x + 2 x y y = x 2 + 6x -3 x y domain= range= -4-3 -2-1 0 1 2 3 4 domain= range=
LESSON #59 - LINEAR FUNCTIONS AND MODELING COMMON CORE ALGEBRA II
 1 LESSON #59 - LINEAR FUNCTIONS AND MODELING COMMON CORE ALGEBRA II A linear function is any pattern where the function increases or decreases by the same numerical constant per unit. It is a function
A C E. Answers Investigation 3. Applications. 2 are equivalent. It takes 3 thirds to. 1 or 1. 4 or. 2 or
 Applications Answers Investigation. and are equivalent. It takes thirds to make whole, so thirds is equivalent to wholes and one third.. B. (See Figure.). Answers will vary. (See Figure.) Pay attention
Practice Test Chapter 6 Polynomial Functions
 FOM 12 Practice Test Chapter 6 Polnomial Functions Multiple Choice Identif the choice that best completes the statement or answers the question. Name: Block: _ 1. Determine the degree of this polnomial
The Ultimate Algebra I Regents Review Guide
 Name Algebra I The Ultimate Algebra I Regents Review Guide Mr. Peralta Individual Score Log: Regents June 2014 August 2014 January 2015 June 2015 August 2015 January 2016 June 2016 August 2016 January
6.1.1 How can I make predictions?
 CCA Ch 6: Modeling Two-Variable Data Name: Team: 6.1.1 How can I make predictions? Line of Best Fit 6-1. a. Length of tube: Diameter of tube: Distance from the wall (in) Width of field of view (in) b.
Lesson 2: Exploring Quadratic Relations Quad Regression Unit 5 Quadratic Relations
 (A) Lesson Context BIG PICTURE of this UNIT: CONTEXT of this LESSON: How do we analyze and then work with a data set that shows both increase and decrease What is a parabola and what key features do they
Guidelines for Graphing Calculator Use at the Commencement Level
 Guidelines for Graphing Calculator Use at the Commencement Level Introduction Graphing calculators are instrumental in the teaching and learning of mathematics. The use of this technology should be encouraged
Name: Teacher s Name: Estimated Test Date:
 Name: Teacher s Name: Estimated Test Date: Concept Page(s) Study Guide 2 3 Vocabulary 4 Constant and Average Rate of Change 5 6 Calculating Slope from Data and from a Graph 7 15 Graphing Slope-Intercept
Math 147 Lecture Notes: Lecture 12
 Math 147 Lecture Notes: Lecture 12 Walter Carlip February, 2018 All generalizations are false, including this one.. Samuel Clemens (aka Mark Twain) (1835-1910) Figures don t lie, but liars do figure. Samuel
0815AI Common Core State Standards
 0815AI Common Core State Standards 1 Given the graph of the line represented by the equation f(x) = 2x + b, if b is increased by 4 units, the graph of the new line would be shifted 4 units 1) right 2)
Chapter 3: Linear Functions & Their Algebra
 Chapter 3: Linear Functions & Their Algebra Lesson 1: Direct Variation Lesson 2: Average Rate of Change Lesson 3: Forms of a Line Lesson 4: Linear Modeling Lesson 5: Inverse of Linear Functions Lesson
Rational Numbers. Integers. Irrational Numbers
 EOC Review: Pre-Algebra Unit Rational Numbers Integers Irrational Numbers Ex: Matrices: Ex 1: Ex 2: Ex 3: Unit 1 Equations Equations To solve an equation, use your calculator. STEPS: 1. Menu 2. Algebra
Using a Graphing Calculator
 Using a Graphing Calculator Unit 1 Assignments Bridge to Geometry Name Date Period Warm Ups Name Period Date Friday Directions: Today s Date Tuesday Directions: Today s Date Wednesday Directions: Today
Scatterplots. 3.1: Scatterplots & Correlation. Scatterplots. Explanatory & Response Variables. Section 3.1 Scatterplots and Correlation
 3.1: Scatterplots & Correlation Scatterplots A scatterplot shows the relationship between two quantitative variables measured on the same individuals. The values of one variable appear on the horizontal
date: math analysis 2 chapter 18: curve fitting and models
 name: period: date: math analysis 2 mr. mellina chapter 18: curve fitting and models Sections: 18.1 Introduction to Curve Fitting; the Least-Squares Line 18.2 Fitting Exponential Curves 18.3 Fitting Power
Lesson 3 - Linear Functions
 Lesson 3 - Linear Functions Introduction As an overview for the course, in Lesson's 1 and 2 we discussed the importance of functions to represent relationships and the associated notation of these functions
Copyright, Nick E. Nolfi MPM1D9 Unit 6 Statistics (Data Analysis) STA-1
 STA-1") UNIT 6 STATISTICS (DATA ANALYSIS) UNIT 6 STATISTICS (DATA ANALYSIS)... 1 INTRODUCTION TO STATISTICS... 2 UNDERSTANDING STATISTICS REQUIRES A CHANGE IN MINDSET... 2 UNDERSTANDING SCATTER PLOTS #1... 3 UNDERSTANDING
UNIT 6 STATISTICS (DATA ANALYSIS) UNIT 6 STATISTICS (DATA ANALYSIS)... 1 INTRODUCTION TO STATISTICS... 2 UNDERSTANDING STATISTICS REQUIRES A CHANGE IN MINDSET... 2 UNDERSTANDING SCATTER PLOTS #1... 3 UNDERSTANDING
AP Statistics Bivariate Data Analysis Test Review. Multiple-Choice
 Name Period AP Statistics Bivariate Data Analysis Test Review Multiple-Choice 1. The correlation coefficient measures: (a) Whether there is a relationship between two variables (b) The strength of the
Section 1.2 DOMAIN, RANGE, INTERCEPTS, SYMMETRY, EVEN/ODD
 Section 1.2 DOMAIN, RANGE, INTERCEPTS, SYMMETRY, EVEN/ODD zeros roots line symmetry point symmetry even function odd function Estimate Function Values A. ADVERTISING The function f (x) = 5x 2 + 50x approximates
Which of the following is an irrational number? a) 2.8 b) 19
 2.8 b) 19") Which of the following is an irrational number? a) 2.8 b) 19 c)!! d) 81 A discounted ticket for a football game costs $12.50 less than the original price p. You pay $63 for a discounted ticket. Write and
Which of the following is an irrational number? a) 2.8 b) 19 c)!! d) 81 A discounted ticket for a football game costs $12.50 less than the original price p. You pay $63 for a discounted ticket. Write and
Describing Bivariate Relationships
 Describing Bivariate Relationships Bivariate Relationships What is Bivariate data? When exploring/describing a bivariate (x,y) relationship: Determine the Explanatory and Response variables Plot the data
Lesson 4.1 Exercises, pages
 Lesson 4.1 Eercises, pages 57 61 When approimating answers, round to the nearest tenth. A 4. Identify the y-intercept of the graph of each quadratic function. a) y = - 1 + 5-1 b) y = 3-14 + 5 Use mental
CHAPTER 5-1. Regents Exam Questions - PH Algebra Chapter 5 Page a, P.I. 8.G.13 What is the slope of line shown in the
 Regents Exam Questions - PH Algebra Chapter Page 1 CHAPTER -1 SLOPE AND DIRECT VARIATION 4. 069918a, P.I. 8.G.1 What is the slope of line shown in the accompanying diagram? 1. 080417a, P.I. A.A. If the
February 29 th March 4 th
 February 29 th March 4 th Unit 7: Introduction to Functions Jump Start Table A: Bags of candy ( ) Cost ( ) 1 2 3 4 5 6 7 8 $1.25 $2.50 $3.75 $5.00 $6.25 $7.50 $8.75 $10.00 Table B: Number of seconds (
Math 0210 Common Final Review Questions (2 5 i)(2 5 i )
(2 5 i )") Math 0 Common Final Review Questions In problems 1 6, perform the indicated operations and simplif if necessar. 1. ( 8)(4) ( )(9) 4 7 4 6( ). 18 6 8. ( i) ( 1 4 i ) 4. (8 i ). ( 9 i)( 7 i) 6. ( i)( i )
Math 0 Common Final Review Questions In problems 1 6, perform the indicated operations and simplif if necessar. 1. ( 8)(4) ( )(9) 4 7 4 6( ). 18 6 8. ( i) ( 1 4 i ) 4. (8 i ). ( 9 i)( 7 i) 6. ( i)( i )
Complete Week 9 Package
 Complete Week 9 Package Algebra1Teachers @ 2015 Table of Contents Unit 3 Pacing Chart -------------------------------------------------------------------------------------------- 1 Day 41 Bellringer --------------------------------------------------------------------------------------------
M1-Lesson 8: Bell Curves and Standard Deviation
 M1-Lesson 8: Bell Curves and Standard Deviation 1. Read over the description of a bell curve and then mark the picture with the characteristics of the curve. Which characteristic was confusing for you?
7) If 2x 9 < 11, which statement is correct?
 If 2x 9 < 11, which statement is correct?") Math 2 EOCT Practice Test #1 1) 5) The graph shows the relationship between time and distance as Pam rides her bike. During which time period was the rate of change the greatest? 2) 6) The equation y =
Math 2 EOCT Practice Test #1 1) 5) The graph shows the relationship between time and distance as Pam rides her bike. During which time period was the rate of change the greatest? 2) 6) The equation y =
Lesson 4 Linear Functions and Applications
 In this lesson, we take a close look at Linear Functions and how real world situations can be modeled using Linear Functions. We study the relationship between Average Rate of Change and Slope and how
HW38 Unit 6 Test Review
 HW38 Unit 6 Test Review Name Per 1. How would you describe the relationship between the x and y values in the scatter plot? 90 80 70 60 50 0 '90 '95 '00 '05 '10 2. Based on the data in the scatter plot
1 Which expression represents 5 less than twice x? 1) 2) 3) 4)
 2) 3) 4)") 1 Which expression represents 5 less than twice x? 2 Gabriella has 20 quarters, 15 dimes, 7 nickels, and 8 pennies in a jar. After taking 6 quarters out of the jar, what will be the probability of Gabriella
1 Which expression represents 5 less than twice x? 2 Gabriella has 20 quarters, 15 dimes, 7 nickels, and 8 pennies in a jar. After taking 6 quarters out of the jar, what will be the probability of Gabriella
Name Date Class California Standards 17.0, Quadratic Equations and Functions. Step 2: Graph the points. Plot the ordered pairs from your table.
 California Standards 17.0, 1.0 9-1 There are three steps to graphing a quadratic function. Graph y x 3. Quadratic Equations and Functions 6 y 6 y x y x 3 5 1 1 0 3 1 1 5 0 x 0 x Step 1: Make a table of
S12 - HS Regression Labs Workshop. Linear. Quadratic (not required) Logarithmic. Exponential. Power
 Logarithmic. Exponential. Power") Summer 2006 I2T2 Probability & Statistics Page 181 S12 - HS Regression Labs Workshop Regression Types: Needed for Math B Linear Quadratic (not required) Logarithmic Exponential Power You can calculate
Summer 2006 I2T2 Probability & Statistics Page 181 S12 - HS Regression Labs Workshop Regression Types: Needed for Math B Linear Quadratic (not required) Logarithmic Exponential Power You can calculate
MULTIPLE CHOICE. Choose the one alternative that best completes the statement or answers the question.
 Math 1 Chapter 1 Practice Test Bro. Daris Howard MULTIPLE CHOICE. Choose the one alternative that best completes the statement or answers the question. 1) When going more than 38 miles per hour, the gas
Growth 23%
 y 100 0. 4 x Decay 23% Math 109C - Fall 2012 page 16 39. Write the quantity 12,600,000,000 miles in scientific notation. The result is: (A) 12. 6 x 10 9 miles (B) 12. 6 x 10 9 miles (C) 1. 26 x 10 10 miles
Math 111, Spring 2009 Final Exam
 Math 111, Spring 009 Final Exam Name (print) Instructor s name Directions 1. Time limit: 1 hour 50 minutes. Each test should have 8 pages. Points for each problem are to the right of the blank.. To receive
5.1 Bivariate Relationships
 Chapter 5 Summarizing Bivariate Data Source: TPS 5.1 Bivariate Relationships What is Bivariate data? When exploring/describing a bivariate (x,y) relationship: Determine the Explanatory and Response variables
Unit Calendar. Date Sect. Topic Homework HW On-Time Apr , 2, 3 Quadratic Equations & Page 638: 3-11 Page 647: 3-29, odd
 Name/Period: Unit Calendar Date Sect. Topic Homework HW On-Time Apr. 4 10.1, 2, 3 Quadratic Equations & Page 638: 3-11 Graphs Page 647: 3-29, odd Apr. 6 9.4 10.4 Solving Quadratic Equations by Factoring
Tips for doing well on the final exam
 Algebra I Final Exam 01 Study Guide Name Date Block The final exam for Algebra 1 will take place on May 1 and June 1. The following study guide will help you prepare for the exam. Tips for doing well on
Review - 3rd Quarter Exam Algebra I CP ~ Chapters 7, 9, 10
 Class: Date: Review - 3rd Quarter Exam Algebra I CP ~ Chapters 7, 9, 10 1. A new inkjet printer priced at $130 increases 5% each year. How much will a similar model cost in two years? 2. The amount of
Name Date. Answers 1.
 Name Date Honors Algebra 2 Summer Work Due at Meet the Teacher Night Show all work. You will be graded on accuracy and completion. Partial credit will be given on problems where work is not shown. 1. Plot
fall07ia Integrated Algebra Regents Exam Test Sampler fall07 4x 6 simplest form? 1) x 2 2) x 9 3) 4x 2 4) 4x 9
 x 2 2) x 9 3) 4x 2 4) 4x 9") fall07ia 1 For 10 days, Romero kept a record of the number of hours he spent listening to music. The information is shown in the table below. Which scatter plot shows Romero s data graphically? 2 Throughout
fall07ia 1 For 10 days, Romero kept a record of the number of hours he spent listening to music. The information is shown in the table below. Which scatter plot shows Romero s data graphically? 2 Throughout
Chapter 2.1 Relations and Functions
 Analyze and graph relations. Find functional values. Chapter 2.1 Relations and Functions We are familiar with a number line. A number line enables us to locate points, denoted by numbers, and find distances
MATH 099 Name (please print) FINAL EXAM - FORM A Winter 2015 Instructor Score
 FINAL EXAM - FORM A Winter 2015 Instructor Score") MATH 099 Name (please print) Winter 2015 Instructor Score Point-values for each problem are shown at the right in parentheses. PART I: SIMPLIFY AS MUCH AS POSSIBLE: 1. ( 16 c 12 ) 3 4 1. (2) 2. 52 m "7
MATH 099 Name (please print) Winter 2015 Instructor Score Point-values for each problem are shown at the right in parentheses. PART I: SIMPLIFY AS MUCH AS POSSIBLE: 1. ( 16 c 12 ) 3 4 1. (2) 2. 52 m "7
Correlation A relationship between two variables As one goes up, the other changes in a predictable way (either mostly goes up or mostly goes down)
") Two-Variable Statistics Correlation A relationship between two variables As one goes up, the other changes in a predictable way (either mostly goes up or mostly goes down) Positive Correlation As one variable
Two-Variable Statistics Correlation A relationship between two variables As one goes up, the other changes in a predictable way (either mostly goes up or mostly goes down) Positive Correlation As one variable
Graphs of Non-Linear Functions
 Classwork Exploratory Challenge 1. Plot a graphical representation of the distance of the ball down a ramp over time. https://www.youtube.com/watch?v=zinszqvhaok Discussion 2. Did everyone s graph have
Name Period Date MATHLINKS GRADE 8 STUDENT PACKET 11 EXPONENTS AND ROOTS
 Name Period Date 8-11 STUDENT PACKET MATHLINKS GRADE 8 STUDENT PACKET 11 EXPONENTS AND ROOTS 11.1 Squares and Square Roots Use numbers and pictures to understand the inverse relationship between squaring
Intermediate Algebra Final Exam Review
 Intermediate Algebra Final Exam Review Note to students: The final exam for MAT10, MAT 11 and MAT1 will consist of 30 multiple-choice questions and a few open-ended questions. The exam itself will cover
Calculate the volume of the sphere. Give your answer correct to two decimal places. (3)
") 1. Let m = 6.0 10 3 and n = 2.4 10 5. Express each of the following in the form a 10 k, where 1 a < 10 and k. mn; m. n (Total 4 marks) 2. The volume of a sphere is V =, where S is its surface area. 36π
1. Let m = 6.0 10 3 and n = 2.4 10 5. Express each of the following in the form a 10 k, where 1 a < 10 and k. mn; m. n (Total 4 marks) 2. The volume of a sphere is V =, where S is its surface area. 36π
Chapter 1 Notes: Quadratic Functions
 19 Chapter 1 Notes: Quadratic Functions (Textbook Lessons 1.1 1.2) Graphing Quadratic Function A function defined by an equation of the form, The graph is a U-shape called a. Standard Form Vertex Form
Relationships between variables. Association Examples: Smoking is associated with heart disease. Weight is associated with height.
 Relationships between variables. Association Examples: Smoking is associated with heart disease. Weight is associated with height. Income is associated with education. Functional relationships between
LESSON 11 PRACTICE PROBLEMS
 LESSON 11 PRACTICE PROBLEMS 1. a. Determine the volume of each of the figures shown below. Round your answers to the nearest integer and include appropriate units of b. Determine the volume of each of
9-8 Completing the Square
 In the previous lesson, you solved quadratic equations by isolating x 2 and then using square roots. This method works if the quadratic equation, when written in standard form, is a perfect square. When
How can you find decimal approximations of square roots that are not rational? ACTIVITY: Approximating Square Roots
 . Approximating Square Roots How can you find decimal approximations of square roots that are not rational? ACTIVITY: Approximating Square Roots Work with a partner. Archimedes was a Greek mathematician,
Do Now 18 Balance Point. Directions: Use the data table to answer the questions. 2. Explain whether it is reasonable to fit a line to the data.
 Do Now 18 Do Now 18 Balance Point Directions: Use the data table to answer the questions. 1. Calculate the balance point.. Explain whether it is reasonable to fit a line to the data.. The data is plotted
Day 1 Scatter Plots and Linear Correlation Coefficients
 Math 11R Regression - Notetaking Guide Name: Period: Day 1 Scatter Plots and Linear Correlation Coefficients Statisticians and scientists gather data to determine correlations or between events. Regression
IF YOU HAVE DATA VALUES:
 Unit 02 Review Ways to obtain a line of best fit IF YOU HAVE DATA VALUES: 1. In your calculator, choose STAT > 1.EDIT and enter your x values into L1 and your y values into L2 2. Choose STAT > CALC > 8.
Least-Squares Regression. Unit 3 Exploring Data
 Least-Squares Regression Unit 3 Exploring Data Regression Line A straight line that describes how a variable,, changes as an variable,, changes unlike, requires an and variable used to predict the value
Released Items. Grade 8 Mathematics North Carolina End-of-Grade Assessment. Published January 2019
 Released Items Published Januar 019 Grade 8 Mathematics North Carolina End-of-Grade Assessment Public Schools of North Carolina Department of Public Instruction State Board of Education Division of Accountabilit
Review for Algebra Final Exam 2015
 Review for Algebra Final Exam 2015 Could the data in the table represent a linear model. If Linear write an equation to model the relationship. x Y 4 17 2 11 0 5 2 1 4 7 Could the data in the table represent
November 30, direct variation ink.notebook. page 162. page Direct Variation. page 163. page 164 page 165
 4.6 direct variation ink.notebook page 161 page 162 4.6 Direct Variation page 163 page 164 page 165 1 Lesson Objectives Standards Lesson Notes Lesson Objectives Standards Lesson Notes 4.6 Direct Variation
Expressions and the Number System
 Name: 8 th Grade Math 1 st Semester Review Pd: Expressions and the Number System 1. A square rug has an area of 225 square feet. How long is each side of the rug? A 15 feet B 22.5 feet C 23 feet D 25 feet
Jakarta International School 8 th Grade AG1 Summative Assessment
 Jakarta International School 8 th Grade AG1 Summative Assessment Unit 6: Quadratic Functions Name: Date: Grade: Standard Advanced Highly Advanced Unit 6 Learning Goals NP Green Blue Black Radicals and
Linear Regression Communication, skills, and understanding Calculator Use
 Linear Regression Communication, skills, and understanding Title, scale and label the horizontal and vertical axes Comment on the direction, shape (form), and strength of the relationship and unusual features