Intro to Linear Regression
|
|
|
- Ernest Dennis
- 5 years ago
- Views:
Transcription

1 Intro to Linear Regression
2 Introduction to Regression Regression is a statistical procedure for modeling the relationship among variables to predict the value of a dependent variable from one or more predictor variables. Imagine that I ask you to guess the weight of a college-aged male who is hidden from view What would your best guess be?
3 Introduction to Regression weight weight
4 Introduction to Regression Regression is a statistical procedure for modeling the relationship among variables to predict the value of a dependent variable from one or more predictor variables. Imagine that I ask you to guess the weight of a college-aged male who is hidden from view What would your best guess be? What if I also gave you his height? Intuitively, it should be clear that you can do better
5 Introduction to Regression
6 Introduction to Regression The Pearson correlation, which we covered in the last lecture measures the degree to which a set of data points form a linear (straight line) relationship. Simple regression describes the linear relationship between a dependent variable () and one predictor variable (X) The resulting line is called the regression line.
7 Regression and Linear Equations ou should remember the following from your high school algebra course: Any straight line can be represented by an equation of the form = bx + a, where b and a are constants. The value of b is called the slope and determines the direction and degree to which the line is tilted. The value of a is called the -intercept and determines the point where the line crosses the -axis. In the context of linear regression, a and b are called regression coefficients
8 Regression and Linear Equations b 0.5 a 1.0 ˆ bx a 0.5X 1
9 Clicker Question In the equation ˆ 12.6X 5 a) a difference of one unit in X will lead to a 5 point difference in the prediction. b) will decrease as X increases. c) a difference of one unit in X will lead to a 17.6 point difference in the prediction. d) a difference of one unit in X will lead to a 12.6 point difference in the prediction.
10 Residuals: Errors of Prediction How well a regression line fits a set of data points can be measured by calculating the distance between the data points and the line. Using the formula Ŷ = bx + a, it is possible to find the predicted value of Ŷ for any X. The residual, or error of prediction, between the predicted value and the actual value can be found by computing the difference -Ŷ The regression line is selected to be the best fit in the leastsquares sense. This means that we want to compute the line that minimizes the sum of squared residuals: SS residual ˆ 2
11 Residuals: Errors of Prediction Ŷ bx a X, ˆ
12 The Standard Error of Estimate The measure of unpredicted variability or error for the regression line is called the standard error of estimate (s e or s -Ŷ ) ou can think of it as analogous to the standard deviation if we were to use the mean M as our estimate of the variable s SS df M 2 n1 s ˆ SS df residual residual ˆ 2 n 2
13 Computing Regression Coefficients b change in change i n X SP SS X X or rs s X a M bm X
14 Example X M M s s X X cov X
15 Example: Computing Regression Coefficients M M s s X X cov X Compute r : cov X 36.8 r s s X Compute b : rs b 5.44 s 2.6 X Compute a : a M bm X So, ˆ bx a 5.44X
16 Example: Predicting from X ou are told that a college-aged male is 74 inches tall. Given the computed regression coefficients, what is your best estimate of his weight? X : height : weight ˆ bx a 5.44X ˆ
17 Example: Computing Accuracy of Prediction Regression M M s s X X cov X 36.8 r Two measures for accuracy of prediction: standard error of estimate (s e or s -Ŷ ) interpreted as standard deviation about the regression line r 2 interpreted as % of variance accounted for by regression model r 2 cov s s 2 X 2 2 X variation explained by X total variation r 2 r ˆ 2 n 1 s ˆ s 1 r n2 n

18 Example: Computing Accuracy of Prediction Regression Just as σ or s can be used to compute confidence intervals for population means, s -Ŷ can be used to compute confidence intervals for t crit ˆ df s
19 Standardized Regression The standardized regression coefficient (β) is computed by first standardizing both the predictor and dependent variables (i.e., by converting both the X values and the values to z-scores) and then computing the regression coefficient (b) on the transformed scores For standardized regression, the y-offset is always zero For standardized regression with a single predictor variable, β is always equal to r. Standardized regression coefficients are only really useful in multiple regression, where there are multiple predictor variables). In these cases, standardizing can make it easier to determine the relative contribution of the different predictor variables to the regression model
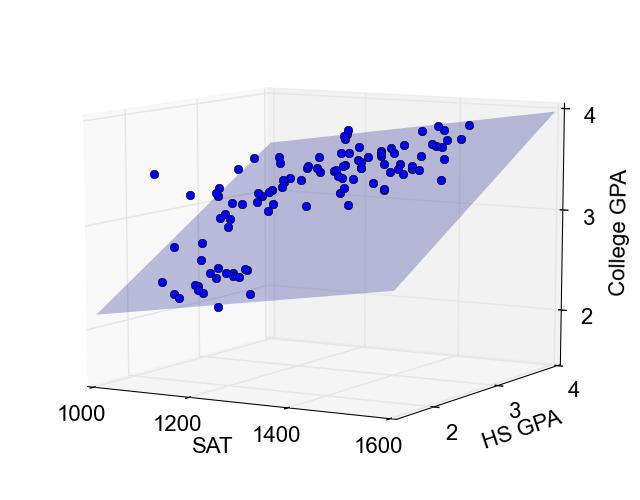
20 Multiple Regression Often, researchers measure several variables that are hypothesized to predict a particular dependent variable For example, we might be interested in how well both SAT scores and high school GPAs predict college GPA s Multiple regression is an appropriate tool for such situations. Multiple regression describes the linear relationship between multiple predictor variables (X 1,,X n ) and one criterion variable () The resulting surface is called the regression surface.
21 Multiple Regression with Two Predictor Variables In the same way that linear regression produces an equation that uses values of X to predict values of, multiple regression produces an equation that uses two different variables (X 1 and X 2 ) to predict values of. The equation is determined by a least squared error solution that minimizes the squared distances between the actual values and the predicted values. For two predictor variables, the general form of the multiple regression equation is: Ŷ= b 1 X 1 + b 2 X 2 + a The resulting plane is called the regression plane.
22 Multiple Regression
23 Multiple Regression
24 Multiple Regression
Intro to Linear Regression
 Intro to Linear Regression Introduction to Regression Regression is a statistical procedure for modeling the relationship among variables to predict the value of a dependent variable from one or more predictor
Correlation and Linear Regression
 Correlation and Linear Regression Correlation: Relationships between Variables So far, nearly all of our discussion of inferential statistics has focused on testing for differences between group means
Can you tell the relationship between students SAT scores and their college grades?
 Correlation One Challenge Can you tell the relationship between students SAT scores and their college grades? A: The higher SAT scores are, the better GPA may be. B: The higher SAT scores are, the lower
INFERENCE FOR REGRESSION
 CHAPTER 3 INFERENCE FOR REGRESSION OVERVIEW In Chapter 5 of the textbook, we first encountered regression. The assumptions that describe the regression model we use in this chapter are the following. We
Simple Linear Regression Using Ordinary Least Squares
 Simple Linear Regression Using Ordinary Least Squares Purpose: To approximate a linear relationship with a line. Reason: We want to be able to predict Y using X. Definition: The Least Squares Regression
Inferences for Regression
 Inferences for Regression An Example: Body Fat and Waist Size Looking at the relationship between % body fat and waist size (in inches). Here is a scatterplot of our data set: Remembering Regression In
REVIEW 8/2/2017 陈芳华东师大英语系
 REVIEW Hypothesis testing starts with a null hypothesis and a null distribution. We compare what we have to the null distribution, if the result is too extreme to belong to the null distribution (p
Business Statistics. Lecture 10: Correlation and Linear Regression
 Business Statistics Lecture 10: Correlation and Linear Regression Scatterplot A scatterplot shows the relationship between two quantitative variables measured on the same individuals. It displays the Form
Correlation. A statistics method to measure the relationship between two variables. Three characteristics
 Correlation Correlation A statistics method to measure the relationship between two variables Three characteristics Direction of the relationship Form of the relationship Strength/Consistency Direction
Multiple Regression. Inference for Multiple Regression and A Case Study. IPS Chapters 11.1 and W.H. Freeman and Company
 Multiple Regression Inference for Multiple Regression and A Case Study IPS Chapters 11.1 and 11.2 2009 W.H. Freeman and Company Objectives (IPS Chapters 11.1 and 11.2) Multiple regression Data for multiple
Correlation: Relationships between Variables
 Correlation Correlation: Relationships between Variables So far, nearly all of our discussion of inferential statistics has focused on testing for differences between group means However, researchers are
s e, which is large when errors are large and small Linear regression model
 Linear regression model we assume that two quantitative variables, x and y, are linearly related; that is, the the entire population of (x, y) pairs are related by an ideal population regression line y
Variance. Standard deviation VAR = = value. Unbiased SD = SD = 10/23/2011. Functional Connectivity Correlation and Regression.
 10/3/011 Functional Connectivity Correlation and Regression Variance VAR = Standard deviation Standard deviation SD = Unbiased SD = 1 10/3/011 Standard error Confidence interval SE = CI = = t value for
Inference for the Regression Coefficient
 Inference for the Regression Coefficient Recall, b 0 and b 1 are the estimates of the slope β 1 and intercept β 0 of population regression line. We can shows that b 0 and b 1 are the unbiased estimates
Chapter 7 Linear Regression
 Chapter 7 Linear Regression 1 7.1 Least Squares: The Line of Best Fit 2 The Linear Model Fat and Protein at Burger King The correlation is 0.76. This indicates a strong linear fit, but what line? The line
Multiple Regression. More Hypothesis Testing. More Hypothesis Testing The big question: What we really want to know: What we actually know: We know:
 Multiple Regression Ψ320 Ainsworth More Hypothesis Testing What we really want to know: Is the relationship in the population we have selected between X & Y strong enough that we can use the relationship
AMS 315/576 Lecture Notes. Chapter 11. Simple Linear Regression
 AMS 315/576 Lecture Notes Chapter 11. Simple Linear Regression 11.1 Motivation A restaurant opening on a reservations-only basis would like to use the number of advance reservations x to predict the number
Unit 6 - Introduction to linear regression
 Unit 6 - Introduction to linear regression Suggested reading: OpenIntro Statistics, Chapter 7 Suggested exercises: Part 1 - Relationship between two numerical variables: 7.7, 7.9, 7.11, 7.13, 7.15, 7.25,
Unit 6 - Simple linear regression
 Sta 101: Data Analysis and Statistical Inference Dr. Çetinkaya-Rundel Unit 6 - Simple linear regression LO 1. Define the explanatory variable as the independent variable (predictor), and the response variable
Chapter 27 Summary Inferences for Regression
 Chapter 7 Summary Inferences for Regression What have we learned? We have now applied inference to regression models. Like in all inference situations, there are conditions that we must check. We can test
Business Statistics. Lecture 9: Simple Regression
 Business Statistics Lecture 9: Simple Regression 1 On to Model Building! Up to now, class was about descriptive and inferential statistics Numerical and graphical summaries of data Confidence intervals
Reminder: Student Instructional Rating Surveys
 Reminder: Student Instructional Rating Surveys You have until May 7 th to fill out the student instructional rating surveys at https://sakai.rutgers.edu/portal/site/sirs The survey should be available
STA 108 Applied Linear Models: Regression Analysis Spring Solution for Homework #6
 STA 8 Applied Linear Models: Regression Analysis Spring 011 Solution for Homework #6 6. a) = 11 1 31 41 51 1 3 4 5 11 1 31 41 51 β = β1 β β 3 b) = 1 1 1 1 1 11 1 31 41 51 1 3 4 5 β = β 0 β1 β 6.15 a) Stem-and-leaf
Introduction and Single Predictor Regression. Correlation
 Introduction and Single Predictor Regression Dr. J. Kyle Roberts Southern Methodist University Simmons School of Education and Human Development Department of Teaching and Learning Correlation A correlation
Lecture 10 Multiple Linear Regression
 Lecture 10 Multiple Linear Regression STAT 512 Spring 2011 Background Reading KNNL: 6.1-6.5 10-1 Topic Overview Multiple Linear Regression Model 10-2 Data for Multiple Regression Y i is the response variable
bivariate correlation bivariate regression multiple regression
 bivariate correlation bivariate regression multiple regression Today Bivariate Correlation Pearson product-moment correlation (r) assesses nature and strength of the linear relationship between two continuous
Relationship Between Interval and/or Ratio Variables: Correlation & Regression. Sorana D. BOLBOACĂ
 Relationship Between Interval and/or Ratio Variables: Correlation & Regression Sorana D. BOLBOACĂ OUTLINE Correlation Definition Deviation Score Formula, Z score formula Hypothesis Test Regression - Intercept
Lecture 18: Simple Linear Regression
 Lecture 18: Simple Linear Regression BIOS 553 Department of Biostatistics University of Michigan Fall 2004 The Correlation Coefficient: r The correlation coefficient (r) is a number that measures the strength
regression analysis is a type of inferential statistics which tells us whether relationships between two or more variables exist
 regression analysis is a type of inferential statistics which tells us whether relationships between two or more variables exist sales $ (y - dependent variable) advertising $ (x - independent variable)
Chapter 9 - Correlation and Regression
 Chapter 9 - Correlation and Regression 9. Scatter diagram of percentage of LBW infants (Y) and high-risk fertility rate (X ) in Vermont Health Planning Districts. 9.3 Correlation between percentage of
Psychology 282 Lecture #3 Outline
 Psychology 8 Lecture #3 Outline Simple Linear Regression (SLR) Given variables,. Sample of n observations. In study and use of correlation coefficients, and are interchangeable. In regression analysis,
Measuring the fit of the model - SSR
 Measuring the fit of the model - SSR Once we ve determined our estimated regression line, we d like to know how well the model fits. How far/close are the observations to the fitted line? One way to do
This document contains 3 sets of practice problems.
 P RACTICE PROBLEMS This document contains 3 sets of practice problems. Correlation: 3 problems Regression: 4 problems ANOVA: 8 problems You should print a copy of these practice problems and bring them
TABLES AND FORMULAS FOR MOORE Basic Practice of Statistics
 TABLES AND FORMULAS FOR MOORE Basic Practice of Statistics Exploring Data: Distributions Look for overall pattern (shape, center, spread) and deviations (outliers). Mean (use a calculator): x = x 1 + x
Homework 6. Wife Husband XY Sum Mean SS
 . Homework Wife Husband X 5 7 5 7 7 3 3 9 9 5 9 5 3 3 9 Sum 5 7 Mean 7.5.375 SS.5 37.75 r = ( )( 7) - 5.5 ( )( 37.75) = 55.5 7.7 =.9 With r Crit () =.77, we would reject H : r =. Thus, it would make sense
Key Algebraic Results in Linear Regression
 Key Algebraic Results in Linear Regression James H. Steiger Department of Psychology and Human Development Vanderbilt University James H. Steiger (Vanderbilt University) 1 / 30 Key Algebraic Results in
23. Inference for regression
 23. Inference for regression The Practice of Statistics in the Life Sciences Third Edition 2014 W. H. Freeman and Company Objectives (PSLS Chapter 23) Inference for regression The regression model Confidence
Analysis of Bivariate Data
 Analysis of Bivariate Data Data Two Quantitative variables GPA and GAES Interest rates and indices Tax and fund allocation Population size and prison population Bivariate data (x,y) Case corr® 2 Independent
appstats27.notebook April 06, 2017
 Chapter 27 Objective Students will conduct inference on regression and analyze data to write a conclusion. Inferences for Regression An Example: Body Fat and Waist Size pg 634 Our chapter example revolves
Black White Total Observed Expected χ 2 = (f observed f expected ) 2 f expected (83 126) 2 ( )2 126
 2 f expected (83 126) 2 ( )2 126") Psychology 60 Fall 2013 Practice Final Actual Exam: This Wednesday. Good luck! Name: To view the solutions, check the link at the end of the document. This practice final should supplement your studying;
Psychology 60 Fall 2013 Practice Final Actual Exam: This Wednesday. Good luck! Name: To view the solutions, check the link at the end of the document. This practice final should supplement your studying;
Answer Key. 9.1 Scatter Plots and Linear Correlation. Chapter 9 Regression and Correlation. CK-12 Advanced Probability and Statistics Concepts 1
 9.1 Scatter Plots and Linear Correlation Answers 1. A high school psychologist wants to conduct a survey to answer the question: Is there a relationship between a student s athletic ability and his/her
Multiple Regression Analysis
 Multiple Regression Analysis y = β 0 + β 1 x 1 + β 2 x 2 +... β k x k + u 2. Inference 0 Assumptions of the Classical Linear Model (CLM)! So far, we know: 1. The mean and variance of the OLS estimators
STAT 350: Geometry of Least Squares
 The Geometry of Least Squares Mathematical Basics Inner / dot product: a and b column vectors a b = a T b = a i b i a b a T b = 0 Matrix Product: A is r s B is s t (AB) rt = s A rs B st Partitioned Matrices
Lecture # 31. Questions of Marks 3. Question: Solution:
 Lecture # 31 Given XY = 400, X = 5, Y = 4, S = 4, S = 3, n = 15. Compute the coefficient of correlation between XX and YY. r =0.55 X Y Determine whether two variables XX and YY are correlated or uncorrelated
9 Correlation and Regression
 9 Correlation and Regression SW, Chapter 12. Suppose we select n = 10 persons from the population of college seniors who plan to take the MCAT exam. Each takes the test, is coached, and then retakes the
Lecture 18 MA Applied Statistics II D 2004
 Lecture 18 MA 2612 - Applied Statistics II D 2004 Today 1. Examples of multiple linear regression 2. The modeling process (PNC 8.4) 3. The graphical exploration of multivariable data (PNC 8.5) 4. Fitting
Answer Key: Problem Set 6
 : Problem Set 6 1. Consider a linear model to explain monthly beer consumption: beer = + inc + price + educ + female + u 0 1 3 4 E ( u inc, price, educ, female ) = 0 ( u inc price educ female) σ inc var,,,
From last time... The equations
 This work is licensed under a Creative Commons Attribution-NonCommercial-ShareAlike License. Your use of this material constitutes acceptance of that license and the conditions of use of materials on this
Simple Linear Regression for the Climate Data
 Prediction Prediction Interval Temperature 0.2 0.0 0.2 0.4 0.6 0.8 320 340 360 380 CO 2 Simple Linear Regression for the Climate Data What do we do with the data? y i = Temperature of i th Year x i =CO
Mathematics for Economics MA course
 Mathematics for Economics MA course Simple Linear Regression Dr. Seetha Bandara Simple Regression Simple linear regression is a statistical method that allows us to summarize and study relationships between
Simple Linear Regression
 Simple Linear Regression ST 370 Regression models are used to study the relationship of a response variable and one or more predictors. The response is also called the dependent variable, and the predictors
Chapter 10-Regression
 Chapter 10-Regression 10.1 Regression equation predicting infant mortality from income Y = Infant mortality X = Income Y = 6.70 s Y = 0.698 s 2 Y = 0.487 X = 46.00 s X = 6.289 s 2 X = 39.553 cov XY = 2.7245
Information Sources. Class webpage (also linked to my.ucdavis page for the class):
:") STATISTICS 108 Outline for today: Go over syllabus Provide requested information I will hand out blank paper and ask questions Brief introduction and hands-on activity Information Sources Class webpage
STATISTICS 108 Outline for today: Go over syllabus Provide requested information I will hand out blank paper and ask questions Brief introduction and hands-on activity Information Sources Class webpage
AMS 7 Correlation and Regression Lecture 8
 AMS 7 Correlation and Regression Lecture 8 Department of Applied Mathematics and Statistics, University of California, Santa Cruz Suumer 2014 1 / 18 Correlation pairs of continuous observations. Correlation
Multiple Linear Regression
 Multiple Linear Regression Simple linear regression tries to fit a simple line between two variables Y and X. If X is linearly related to Y this explains some of the variability in Y. In most cases, there
Introduction to Linear Regression
 Introduction to Linear Regression James H. Steiger Department of Psychology and Human Development Vanderbilt University James H. Steiger (Vanderbilt University) Introduction to Linear Regression 1 / 46
Regression and correlation. Correlation & Regression, I. Regression & correlation. Regression vs. correlation. Involve bivariate, paired data, X & Y
 Regression and correlation Correlation & Regression, I 9.07 4/1/004 Involve bivariate, paired data, X & Y Height & weight measured for the same individual IQ & exam scores for each individual Height of
9. Linear Regression and Correlation
 9. Linear Regression and Correlation Data: y a quantitative response variable x a quantitative explanatory variable (Chap. 8: Recall that both variables were categorical) For example, y = annual income,
Linear Regression. Linear Regression. Linear Regression. Did You Mean Association Or Correlation?
 Did You Mean Association Or Correlation? AP Statistics Chapter 8 Be careful not to use the word correlation when you really mean association. Often times people will incorrectly use the word correlation
Lecture 3: Inference in SLR
 Lecture 3: Inference in SLR STAT 51 Spring 011 Background Reading KNNL:.1.6 3-1 Topic Overview This topic will cover: Review of hypothesis testing Inference about 1 Inference about 0 Confidence Intervals
STATISTICAL DATA ANALYSIS IN EXCEL
 Microarra Center STATISTICAL DATA ANALYSIS IN EXCEL Lecture 5 Linear Regression dr. Petr Nazarov 14-1-213 petr.nazarov@crp-sante.lu Statistical data analsis in Ecel. 5. Linear regression OUTLINE Lecture
Ch. 16: Correlation and Regression
 Ch. 1: Correlation and Regression With the shift to correlational analyses, we change the very nature of the question we are asking of our data. Heretofore, we were asking if a difference was likely to
Simple linear regression
 Simple linear regression Business Statistics 41000 Fall 2015 1 Topics 1. conditional distributions, squared error, means and variances 2. linear prediction 3. signal + noise and R 2 goodness of fit 4.
Announcements: You can turn in homework until 6pm, slot on wall across from 2202 Bren. Make sure you use the correct slot! (Stats 8, closest to wall)
") Announcements: You can turn in homework until 6pm, slot on wall across from 2202 Bren. Make sure you use the correct slot! (Stats 8, closest to wall) We will cover Chs. 5 and 6 first, then 3 and 4. Mon,
Announcements: You can turn in homework until 6pm, slot on wall across from 2202 Bren. Make sure you use the correct slot! (Stats 8, closest to wall) We will cover Chs. 5 and 6 first, then 3 and 4. Mon,
Chapter 12 - Lecture 2 Inferences about regression coefficient
 Chapter 12 - Lecture 2 Inferences about regression coefficient April 19th, 2010 Facts about slope Test Statistic Confidence interval Hypothesis testing Test using ANOVA Table Facts about slope In previous
Chapter Goals. To understand the methods for displaying and describing relationship among variables. Formulate Theories.
 Chapter Goals To understand the methods for displaying and describing relationship among variables. Formulate Theories Interpret Results/Make Decisions Collect Data Summarize Results Chapter 7: Is There
Section 3.3. How Can We Predict the Outcome of a Variable? Agresti/Franklin Statistics, 1of 18
 Section 3.3 How Can We Predict the Outcome of a Variable? Agresti/Franklin Statistics, 1of 18 Regression Line Predicts the value for the response variable, y, as a straight-line function of the value of
Simple Linear Regression Analysis
 LINEAR REGRESSION ANALYSIS MODULE II Lecture - 6 Simple Linear Regression Analysis Dr. Shalabh Department of Mathematics and Statistics Indian Institute of Technology Kanpur Prediction of values of study
The Multiple Regression Model
 Multiple Regression The Multiple Regression Model Idea: Examine the linear relationship between 1 dependent (Y) & or more independent variables (X i ) Multiple Regression Model with k Independent Variables:
Objectives Simple linear regression. Statistical model for linear regression. Estimating the regression parameters
 Objectives 10.1 Simple linear regression Statistical model for linear regression Estimating the regression parameters Confidence interval for regression parameters Significance test for the slope Confidence
Regression, part II. I. What does it all mean? A) Notice that so far all we ve done is math.
 Notice that so far all we ve done is math.") Regression, part II I. What does it all mean? A) Notice that so far all we ve done is math. 1) One can calculate the Least Squares Regression Line for anything, regardless of any assumptions. 2) But, if
Regression, part II I. What does it all mean? A) Notice that so far all we ve done is math. 1) One can calculate the Least Squares Regression Line for anything, regardless of any assumptions. 2) But, if
Simple Linear Regression
 Simple Linear Regression EdPsych 580 C.J. Anderson Fall 2005 Simple Linear Regression p. 1/80 Outline 1. What it is and why it s useful 2. How 3. Statistical Inference 4. Examining assumptions (diagnostics)
Chapter 12 - Part I: Correlation Analysis
 ST coursework due Friday, April - Chapter - Part I: Correlation Analysis Textbook Assignment Page - # Page - #, Page - # Lab Assignment # (available on ST webpage) GOALS When you have completed this lecture,
Chs. 15 & 16: Correlation & Regression
 Chs. 15 & 16: Correlation & Regression With the shift to correlational analyses, we change the very nature of the question we are asking of our data. Heretofore, we were asking if a difference was likely
Chapter Learning Objectives. Regression Analysis. Correlation. Simple Linear Regression. Chapter 12. Simple Linear Regression
 Chapter 12 12-1 North Seattle Community College BUS21 Business Statistics Chapter 12 Learning Objectives In this chapter, you learn:! How to use regression analysis to predict the value of a dependent
Confidence Intervals, Testing and ANOVA Summary
 Confidence Intervals, Testing and ANOVA Summary 1 One Sample Tests 1.1 One Sample z test: Mean (σ known) Let X 1,, X n a r.s. from N(µ, σ) or n > 30. Let The test statistic is H 0 : µ = µ 0. z = x µ 0
Simple Linear Regression
 Simple Linear Regression ST 430/514 Recall: A regression model describes how a dependent variable (or response) Y is affected, on average, by one or more independent variables (or factors, or covariates)
This module focuses on the logic of ANOVA with special attention given to variance components and the relationship between ANOVA and regression.
 WISE ANOVA and Regression Lab Introduction to the WISE Correlation/Regression and ANOVA Applet This module focuses on the logic of ANOVA with special attention given to variance components and the relationship
AP Statistics L I N E A R R E G R E S S I O N C H A P 7
 AP Statistics 1 L I N E A R R E G R E S S I O N C H A P 7 The object [of statistics] is to discover methods of condensing information concerning large groups of allied facts into brief and compendious
" M A #M B. Standard deviation of the population (Greek lowercase letter sigma) σ 2
 σ 2") Notation and Equations for Final Exam Symbol Definition X The variable we measure in a scientific study n The size of the sample N The size of the population M The mean of the sample µ The mean of the
Notation and Equations for Final Exam Symbol Definition X The variable we measure in a scientific study n The size of the sample N The size of the population M The mean of the sample µ The mean of the
How to mathematically model a linear relationship and make predictions.
 Introductory Statistics Lectures Linear regression How to mathematically model a linear relationship and make predictions. Department of Mathematics Pima Community College Redistribution of this material
How to mathematically model a linear relationship and make predictions.
 Introductory Statistics Lectures Linear regression How to mathematically model a linear relationship and make predictions. Department of Mathematics Pima Community College (Compile date: Mon Apr 28 20:50:28
Lecture 19 Multiple (Linear) Regression
 Regression") Lecture 19 Multiple (Linear) Regression Thais Paiva STA 111 - Summer 2013 Term II August 1, 2013 1 / 30 Thais Paiva STA 111 - Summer 2013 Term II Lecture 19, 08/01/2013 Lecture Plan 1 Multiple regression
Lecture 19 Multiple (Linear) Regression Thais Paiva STA 111 - Summer 2013 Term II August 1, 2013 1 / 30 Thais Paiva STA 111 - Summer 2013 Term II Lecture 19, 08/01/2013 Lecture Plan 1 Multiple regression
Data Analysis and Statistical Methods Statistics 651
 y 1 2 3 4 5 6 7 x Data Analysis and Statistical Methods Statistics 651 http://www.stat.tamu.edu/~suhasini/teaching.html Lecture 32 Suhasini Subba Rao Previous lecture We are interested in whether a dependent
Regression, Part I. - In correlation, it would be irrelevant if we changed the axes on our graph.
 Regression, Part I I. Difference from correlation. II. Basic idea: A) Correlation describes the relationship between two variables, where neither is independent or a predictor. - In correlation, it would
Chapter 14 Simple Linear Regression (A)
") Chapter 14 Simple Linear Regression (A) 1. Characteristics Managerial decisions often are based on the relationship between two or more variables. can be used to develop an equation showing how the variables
Chapter 14 Simple Linear Regression (A) 1. Characteristics Managerial decisions often are based on the relationship between two or more variables. can be used to develop an equation showing how the variables
Chapter 10. Regression. Understandable Statistics Ninth Edition By Brase and Brase Prepared by Yixun Shi Bloomsburg University of Pennsylvania
 Chapter 10 Regression Understandable Statistics Ninth Edition By Brase and Brase Prepared by Yixun Shi Bloomsburg University of Pennsylvania Scatter Diagrams A graph in which pairs of points, (x, y), are
Overview. Overview. Overview. Specific Examples. General Examples. Bivariate Regression & Correlation
 Bivariate Regression & Correlation Overview The Scatter Diagram Two Examples: Education & Prestige Correlation Coefficient Bivariate Linear Regression Line SPSS Output Interpretation Covariance ou already
Business Statistics. Lecture 10: Course Review
 Business Statistics Lecture 10: Course Review 1 Descriptive Statistics for Continuous Data Numerical Summaries Location: mean, median Spread or variability: variance, standard deviation, range, percentiles,
Chapter 14 Student Lecture Notes Department of Quantitative Methods & Information Systems. Business Statistics. Chapter 14 Multiple Regression
 Chapter 14 Student Lecture Notes 14-1 Department of Quantitative Methods & Information Systems Business Statistics Chapter 14 Multiple Regression QMIS 0 Dr. Mohammad Zainal Chapter Goals After completing
Sampling Distributions: Central Limit Theorem
 Review for Exam 2 Sampling Distributions: Central Limit Theorem Conceptually, we can break up the theorem into three parts: 1. The mean (µ M ) of a population of sample means (M) is equal to the mean (µ)
Chapter 3. Introduction to Linear Correlation and Regression Part 3
 Tuesday, December 12, 2000 Ch3 Intro Correlation Pt 3 Page: 1 Richard Lowry, 1999-2000 All rights reserved. Chapter 3. Introduction to Linear Correlation and Regression Part 3 Regression The appearance
Regression and the 2-Sample t
 Regression and the 2-Sample t James H. Steiger Department of Psychology and Human Development Vanderbilt University James H. Steiger (Vanderbilt University) Regression and the 2-Sample t 1 / 44 Regression
Problems. Suppose both models are fitted to the same data. Show that SS Res, A SS Res, B
 Simple Linear Regression 35 Problems 1 Consider a set of data (x i, y i ), i =1, 2,,n, and the following two regression models: y i = β 0 + β 1 x i + ε, (i =1, 2,,n), Model A y i = γ 0 + γ 1 x i + γ 2
Ch 2: Simple Linear Regression
 Ch 2: Simple Linear Regression 1. Simple Linear Regression Model A simple regression model with a single regressor x is y = β 0 + β 1 x + ɛ, where we assume that the error ɛ is independent random component
SMAM 314 Exam 42 Name
 SMAM 314 Exam 42 Name Mark the following statements True (T) or False (F) (10 points) 1. F A. The line that best fits points whose X and Y values are negatively correlated should have a positive slope.
Chapter 19 Sir Migo Mendoza
 The Linear Regression Chapter 19 Sir Migo Mendoza Linear Regression and the Line of Best Fit Lesson 19.1 Sir Migo Mendoza Question: Once we have a Linear Relationship, what can we do with it? Something
Regression Estimation Least Squares and Maximum Likelihood
 Regression Estimation Least Squares and Maximum Likelihood Dr. Frank Wood Frank Wood, fwood@stat.columbia.edu Linear Regression Models Lecture 3, Slide 1 Least Squares Max(min)imization Function to minimize
Review of Statistics 101
 Review of Statistics 101 We review some important themes from the course 1. Introduction Statistics- Set of methods for collecting/analyzing data (the art and science of learning from data). Provides methods
Inverse of a Square Matrix. For an N N square matrix A, the inverse of A, 1
 Inverse of a Square Matrix For an N N square matrix A, the inverse of A, 1 A, exists if and only if A is of full rank, i.e., if and only if no column of A is a linear combination 1 of the others. A is