Copyright Warning & Restrictions
|
|
|
- Noel Gilmore
- 6 years ago
- Views:
Transcription
1 Copyright Warning & Restrictions The copyright law of the United States (Title 17, United States Code) governs the making of photocopies or other reproductions of copyrighted material. Under certain conditions specified in the law, libraries and archives are authorized to furnish a photocopy or other reproduction. One of these specified conditions is that the photocopy or reproduction is not to be used for any purpose other than private study, scholarship, or research. If a, user makes a request for, or later uses, a photocopy or reproduction for purposes in excess of fair use that user may be liable for copyright infringement, This institution reserves the right to refuse to accept a copying order if, in its judgment, fulfillment of the order would involve violation of copyright law. Please Note: The author retains the copyright while the New Jersey Institute of Technology reserves the right to distribute this thesis or dissertation Printing note: If you do not wish to print this page, then select Pages from: first page # to: last page # on the print dialog screen
2 The Van Houten library has removed some of the personal information and all signatures from the approval page and biographical sketches of theses and dissertations in order to protect the identity of NJIT graduates and faculty.
3 ABSTRACT MEASUREMENT OF THE NONLINEAR REFRACTIVE INDEX (n 2) AND STIMULATED RAMAN SCATTERING IN OPTICAL FIBERS AS A FUNCTION OF GERMANIA CONTENT, USING THE PHOTOREFRACTIVE BEAM COUPLING TECHNIQUE By Ferdinand A. Oguama One of the greatest challenges in optical communication is the understanding and control of optical fiber nonlinearities. While these nonlinearites limit the power handling capacity of optical fibers and can cause noise, signal distortion and cross talk in optically amplified transmission systems, they have been equally harnessed for the development of new generations of optical amplifiers and tunable laser sources. The two prominent parameters that characterize the nonlinear properties of an optical fiber are the nonlinear refractive index (n2) and the Raman gain coefficient (g R). These parameters are related to the third order nonlinear susceptibility [x(3)]. In this work, the photorefractive beam coupling technique, also called induced grating autocorrelation (IGA), has been used to measure the nonlinear refractive index (n2) and the Raman gain coefficient (g R) of short lengths ( z 20 m) of optical fibers. In the IGA experiment, a transform limited Gaussian pulse is propagated through a short length of an optical fiber, where it undergoes self-phase modulation (SPM) and other nonlinear distortions, and the output pulse is split into two. The two-excitation pulses are then coupled into a photorefractive crystal, where they interfere and form a photorefractive phase grating. The IGA response is determined by delaying one beam (the probe) and plotting the diffracted intensity of the probe versus the relative delay (t).
4 Analysis of the IGA response yields information about the nonlinear phase distortions and other calibration parameters of the fiber. Using the IGA technique the author has measured the nonlinear refractive index in several types of fibers, including pure silica, Er-Al-Ge doped fibers, DCF (dispersion compensating fiber) and the recently developed TrueWave Rs fiber, and investigated the dependence of n2 on the doping profiles of Er, Al, and Ge in optical fibers. The standard IGA model for n2 measurements was derived from the solution of the nonlinear wave equation for pulse propagation in the limit of pure self-phase modulation. This model assumed that GVD (group velocity dispersion) and other nonlinear processes such as SRS (stimulated Raman scattering) are negligible. This model has been successfully used to fit the experimental data and determine the n2 of the fiber from the time dependent phase shift. However, SRS has been observed to distort the IGA trace, thus leading to a breakdown of the standard IGA model. A new IGA model has been developed in this study from the solution of the coupled-amplitude nonlinear Schrodinger equation, using both analytical and numerical approaches. This new model successfully accounts for the SRS effects on the IGA trace, in the limit of zero GVD, and allows the direct determination of the Raman gain coefficient from the fit of the SRSdistorted IGA trace. The measured nonlinear refractive index and Raman gain coefficients are in good agreement with published results. It was also shown that in the limit of zero GVD and no Raman, the IGA technique reduces to the widely accepted spectral domain SPM technique pioneered by Stolen and Lin, but is readily applicable to shorter lengths of fiber and is sensitive to smaller phase shifts.
5 MEASUREMENT OF THE NONLINEAR REFRACTIVE INDEX (n2) AND STIMULATED RAMAN SCATTERING IN OPTICAL FIBERS AS A FUNCTION OF GERMANIC CONTENT, USING Into fi1photorefract1ve BEAM COUPLING TECHNIQUE by Ferdinand Anayo Oguama A Dissertation Submitted to the Faculty of New Jersey Institute of Technology and Rutgers, The State University of New Jersey in Partial Fulfillment of the Requirements for the Degree of Doctor of Philosophy in Applied Physics Federated Physics Department August 2003
6 Copyright 2003 by Ferdinand Anayo Oguama ALL RIGHTS RESERVED
7 APPROVAL PAGE MEASUREMENT OF THE NONLINEAR REFRACTIVE INDEX (n2) AND STIMULATED RAMAN SCATTERING IN OPTICAL FIBERS AS A FUNCTION OF GERMANIA CONTENT, USING THE PHOTOREFRACTIVE BEAM COUPLING TECHNIQUE Ferdinand Anayo Oguama August 2003 Dr. Anthony M. John Date Distinguished Prof soar Physics, NJIT Dr. Jo Federici Professor of Physics, NJIT bate Dr. Dan Mufnick Professbr of Pliacs. Mergers University /Date Dr. Haim Gp6el Professor o Electrical & Computer Engineering, NJIT. bate Dr. Gordon Thomas Professor of Physics and Biomedical Engineering, NJIT. Date Dr. DavidiGioyanni Director, S Optics Inc. Murray Hill, NJ Date
8 BIOGRAPHICAL SKETCH Author: Ferdinand A. Oguama. Degree: Doctor of Philosophy Date: August 2003 Undergraduate and Graduate Education: Doctor of Philosophy in Applied Physics New Jersey Institute of Technology/Rutgers University -Newark, NJ, 2003 Master of Science in Physics Nnamdi Azikiwe University, Awka, Nigeria,1990 Bachelor of Science in Industrial Physics Anambra State University of Technology, Enugu, Nigeria, 1986 Major: Applied Physics Publications and Presentations: H. Garcia, A. M. Johnson, F. A. Oguama, and Sudhir Trivedi, " A new approach to the measurement of the nonlinear refractive index of short (<25 m) lengths of silica and erbium-doped fibers," Accepted for publication in Optics Letters. F. A. Oguama, A. Tchouassi and A. M. Johnson, "Influence of Stimulated Raman Scattering and High Ge02 Doping on the Induced Grating Autocorrelation Measurements in Er-Al-Ge Doped Single Mode Fibers", 2003 Annual Conference of the National society of Black Physicists-NSBP, Feb , Atlanta, GA, (2003) F. A. Oguama, A. Tchouassi and A. M. Johnson, "Effect of High Germania Content and Stimulated Raman Scattering on n2 Measurements in Erbium-Doped Single Mode Fibers", Optical Society of America (OSA) annual meeting, (Orlando Florida) October, (2002). F. A. Oguama, H. Garcia, A. M. Johnson and S. Trivedi, "Photorefractive Beam Coupling Measurement of the Nonlinear Refractive Index (n2) of Erbium-Doped Fibers as a Function of Germania and Aluminum Content", in: Coif. Lasers and Electro-optics CEO' 2001 Technical Digest, Baltimore MD, pp (2001). iv
9 F. A. Oguama, H. Garcia, A. M. Johnson and S. Trivedi, "Photorefractive Beam Coupling Measurement of the Nonlinear Refractive Index (n2) of Erbium-Doped Fibers as a Function of Germania Content", A paper presented at the 84 th Annual Meeting/Conference of the Optical Society of America held at Providence, Rl, Oct. 22nd-26th, (2000). F. A. Oguama and H. Shields, Measurement of the Spin Hamiltonian Parameters of Cu e+ lon in Zn2+-Doped CaCd(CH3C00)4.6H20. Japanese Journal of Applied Physics, 30, pp (1999). F. A. Oguama, H. Shields and D. K. De, Effect of Zn 2 Doping on the Phase Transition Temperature of Cadmium Calcium Acetate Hexahydrate Single Crystals, in: Proceedings of the 12th Annual Conference of the National Society of Black Physicists (NSBP/NCBPS) Lexington, Kentucky, pp (1998). F. A. Oguama, H. Shields and D. K. De, EPR Studies of Phase Transition in Cadmium Calcium Acetate Hexahydrate as a Function of Different Paramagnetic Impurities: Phys. Rev. B 56, pp (1997). 17
10 Dedicated to my grand mother Mrs. Maria lbekwe vi
11 ACKNOWLEDGEMENT I would like to express my gratitude to my dissertation advisor, Dr. Anthony M. Johnson. He was instrumental in attracting me to NJIT and in stimulating my interest (which was then leaning towards condensed matter Physics) in optics and photonics research. He provided the insightful suggestions that encouraged my strong and consistent research endeavors that led to the successful findings made in this study. I am also grateful to the members of my dissertation committee: Dr. John Federici, Dr. Dan Murnick, Dr. Haim Grebel, Dr. Gordon Thomas and Dr. David DiGiovanni. Their useful advice and suggestions were of immense help in the completion of this thesis. My appreciation goes to Dr. Hernando Garcia and Dr. Main Tchouassi, who also contributed useful ideas that helped me advance forward in the course of this investigation. I would like to give special thanks to Dr. Bill Reed for devoting some of his time and expertise in helping to operate the sensitive apparatus for measuring the mode-field diameter and the effective area of the fibers, at the OFS laboratory, Murray Hill, NJ; and also for providing some of the fibers studied in this work. Other individuals that deserve recognition for providing some research materials include Dr. Jake Bromage of OFS laboratory, Holmdel, NJ; Dr. Nelson Newbury of the National lnstitute of Standards and Technology (NlST), Boulder CO; and Dr. Sudhir Trivedi, Brimrose corporation of America, Baltimore, MD. vii
12 TABLE OF CONTENTS Chapter Page 1 INTRODUCTlON Background Overview of the Dissertation 7 2 NONLINEAR EFFECTS AND PAULSE DISPERSION IN OPTICAL FIBERS Nonlinear Susceptibility and Index of Refraction Self-Phase Modulation Cross-Phase Modulation Four-Wave Mixing Stimulated Raman Scattering Stimulated Brillouin Scattering (SBS) Optical Solitons in Fibers Two-Photon Absorption Pulse Dispersion and GVD in Optical Fibers The Role of GVD in Nonlinear Interactions in Optical Fibers OTHER TECHNIQUES FOR MEASURING n2 ln OPTlCAL FIBERS AND THE NEED FOR A NEW APPROACH Introduction The Spectral Domain SPM Technique Cross-Phase Modulation Technique Four-Wave Mixing Technique Modulation Instability Method 44 Ali
13 TABLE OF CONTENTS (Continued) Chapter Page 3.6 Long Period Fiber Grating Pair (LPG) Method for n2 Measurement The Need for a New Technique for Measuring n2 in Fibers 48 4 THE PHOTOREFRACTIVE BEAM-COUPLING TECHNIQUE [INDUCED GRATlNG AUTOCORRELATION (IGA)] lntroduction The Photorefractive Effect IGA Modeling Based on Pure SPM in the Absence of GVD and SRS Experimental Details and Measurement Procedure for the IGA Technique Laser Source and Pulse Characterization Experimental Setup for IGA Measurement Analysis of IGA Data and n2 Determination 71 5 MEASUREMENT OF THE NONLINEAR REFRACTIVE INDEX OF Er-Al-Ge DOPED SINGLE MODE FIBERS AS A FUNCTlON OF THE DOPING PROFILES, USING THE IGA TECHNIQUE Introduction Why Measuring the Nonlinear Refractive Index in Er-Al-Ge Doped Fibers? True Wave Rs and Dispersion Compensating Fiber Experimental Details Fiber Properties Effective area and Mode-field Diameter Measurement Measurement of n2 Using IGA Results and Analysis 91 ix
14 TABLE OF CONTENTS (Continued) Chapter Page 5.4 Discussion of Results and Comparison with Published Results MEASURMENT OF THE RAMAN GAIN COEFFICIENT IN OPTICAL FIBERS USING INDUCED GRATING AUTOCORRELATION: THEORY AND EXPERIMENT Introduction Observation of Distortion of IGA Trace by Stimulated Raman Scattering And Initial Breakdown of the Standard IGA Model Based on Pure SPM The Observed Deviation and Possible Cause(s) Measurement of he Pulse Spectrum and Further Evidence of the Role of SRS Raman Gain coefficient of Highly Ge02 Doped Fibers Modification of the IGA Model and Measurement of Raman Gain Coefficient in Optical Fiber Modification of IGA Model in the Undepleted Pump Approximation Through the Analytical Solution of the Coupled Nonlinear Schrodinger Equation Determination of the Raman Gain Coefficient from IGA data Comparison With Published Results Numerical Modeling of IGA in the Presence of Pump Depletion Discussion of Result of the Numerical Simulation DETERMINATION OF THE SENSITIVITY OF IGA MEASUREMENTS, AND THE RELATIONSHIP BETWEEN IGA TECHNIQUE AND THE SPECTRAL DOMAIN SPM TECHNIQUE Introduction 137 x
15 Chapter TABLE OF CONTENTS (Continued) Page 7.2 Derivation of the Relationship Between IGA and the Spectral Domain SPM Technique 7.3 Determination of the Sensitivity of the IGA Technique CONCLUSION Definition and Measurement Discussion of Results 8.1 Summary 8.2 Scientific Values and Practical Applications 8.3 Recommendations for Future Studies APPENDIX A DIFFERENT MECHANISMS THAT CAN PRODUCE NONLINEAR REFRACTIVE INDEX (n2) IN OPTICAL MATERIALS APPENDIX B VARIOUS UNITS FOR EXPRESSING THE CONCENTRATION OF DOPANTS IN OPTICAL FIBER APPENDIX C DEPENDENCE OF An ON GeO2 CONCENTRATION APPENDIX D ESTIMATION OF FIBER MODE-FIELD DIAMETER AT AT 1064 nm FROM 1314 nm AND 1552 nm VALUES APPENDIX E MATLAB FITTING PROGRAM FOR IGA (PURE SPM CASE APPENDIX F MATLAB FITTING PROGRAM FOR THE MODIFIED IGA MODEL (SPM & RAMAN) APPENDIX G C-PROGRAM FOR THE NUMERICAL SIMULATION REFERENCES xi
16 LIST OF TABLES Table Page 5.1 Properties of the Er-Al-Ge Doped Fibers Values of n2 and Relative Concentration of Dopants in Al-Ge-Er Doped silica Fibers Published Values of n2/aeff and n Properties of the Fibers whose Raman Gain Coefficients were Measured Raman Gain Coefficients and Walk-off Parameter Determined from IGA Measurements in Four Different Fibers Comparison of the Raman Gain Coefficient Measured in this Work with Published Values. 129 A.1 Different Mechanisms Leading to a Nonlinear Refractive Index, Including Typical Values and Response Times. 159 B.1 Some Common Compounds Used as Dopants in Optical Fibers 160 xii
17 LIST OF FIGURES Figure Page 2.1 Raman gain spectrum for fused silica at a pump wavelength of 1.0 p.m Variation of material, waveguide and total dispersion (D) with wavelength Variation of 02 and d12 (walk-on parameter) with wavelength for fused Silica. 02 = 0 at 1.27 pin Variation of d2n/d2 with A. for pure silica and doped fibers. Dopant concentration is in parenthesis Dispersion curves for three types of fibers (standard silica fiber, dispersion shifted fiber and dispersion flattened fiber Experimental setup and analysis procedure for the spectral domain SPM technique Measurement system of the nonlinear refractive index by the XPM method Experimental setup and typical spectra for the four-wave mixing n2 technique. (a) represents the spectrum of the fiber input and (b) is the spectrum of the fiber output Experimental setup and typical output spectrum for the modulation instability technique for n2 measurement in fibers Experimental arrangement and typical emission spectra in the measurement of n2 in Yb + /A1 3+ doped fibers using LPG Two-beam coupling in photorefractive crysta Photoexcitation of free carriers in electro-optic material. The free carriers diffuse in concentration gradient thereby creating space-charge fields Creation of space charge field and photorefractive gratings in photorefractive material. The space charge field is 90 out of phase with the space charge Simulated IGA traces based on Equation (4.12) for low self-phase modulated Gaussian pulse Simulated IGA traces for a Gaussian pulse that has been moderately self-phase modulated at two different values of SPMS. 59
18 LIST OF FIGURES (Continued) Figure Page 4.6 Simulated IGA Traces for a highly self-phase modulated Gaussian pulse that has at two different values of SPMS Experimental setup for the noncollinear background-free SHG autocorrelation Experimental SHG autocorrelation trace fitted to a Gaussian Scatter plot of the residual of the Gaussian fit to the autocorrelation trace Experimental set-up and beam geometry for the photorefactive beam coupling technique Experimental IGA traces at different power levels in 20 m erbium doped fiber Typical experimental IGA traces at different power levels fitted to Equation 4.12 to obtain cootpq. The fit is excellent Typical absorption and gain curves for erbium-doped fiber A typical variation of total attenuation with wavelength in silica based optical fibers Energy level diagram of erbium ions in a silica matrix Dispersion slope of NZDF fiber compared to other standard fibers Measure refractive index profiles for pure silica fiber and erbium doped fiber Measured refractive index profiles for two Er-Al-Ge doped fibers with different dopant contents Measured refractive index profiles for two fibers with different doping profiles Typical IGA trace and a plot of SPM strength versus average power for 20m Silica fiber Typical results obtained with erbium doped fiber 89 xiv
19 LIST OF FIGURES (Continued) Figure Page 5.10 Plot of result obtained for fiber #43(Er-Al-doped only,26%m of Al) Plot of results obtained or fiber#4 (Er-Al-ge doped,4%m Ge and 2%M Al) Typical results obtained for fiber #5 (Er-Al-Ge doped fiber with 12%M Al and 5%mGe) Pot of typical measured result for Er-Al-Ge doped fiber #6(1%M Ge, 12%M A and Erbium conc. = 0.15 x cm"3 ) Plot of typical results obtained in Er-Al-Ge doped fiber(with 13%M Ge, 12%M Al and Er3 conc. = 0.88 x cm 3) Typical results obtained for true wave fiber Typical rsuts obtained for DCF Typically measured IGA trace fitted with the standard IGA model for high germania doped fiber A Amplitude normalized spectrum of pure silica (Si-O-Si) and binary (Si-O-Ge) B Pump and Stokes spectra at the output of a 6-m long high Ge fiber Typical spectra from high Ge02 doped fibers Spectrum of the out put pulse from pure silica fiber, containing no germania The interaction of the pump and the Stokes fields in the photorefactive crystal in the four-wave mixing configuration Measure IGA traces fitted to the modified IGA model that accounts For SPM and SRS, for fiber 6B with >28% M Ge and 2% M Al Measure IGA trace at about 30% Raman conversion indicating the Breakdown of the undepleted pump IGA model 121 DV
20 LIST OF FIGURES (Continued) Figure Page 6.8 IGA trace at high Raman conversion in high Germania doped fibers 7B (fiber length = 20 m, Ppeak-36W) Measured IGA traces fitted to the model for 100 m long pure Silica core fiber at different power levels Typical IGA trace measured in Ge02 doped fiber, #6C (Fiber length = 20m, PH = 8.8W) Typical IGA trace measured in DCF, #6D (Fiber length = 20m PH =.36.6W) Plot of the "Raman gain parameter" (RGP) versus peak power for fiber #6B for estimating gr Comparison of Numerically Simulated IGA trace with Experimental result Experimental (a) and Numerically Simulated (b) IGA Traces at high Raman conversion >35% Low power IGA trace and the corresponding Gaussian fitted Autocorrelation trace to show the onset of narrowing due to SPM. The minimum detectable SPM strength is Low power IGA trace and the corresponding Gaussian fitted autocorrlation trace to show gradual narrowing due to SPM. The detectable SPM strength is Low power IGA trace and corresponding Gaussian fitted autocorelation strength to show the progessive narrowing due to SPM. The measured SPM strength is Low power IGA trace and corresponding Gaussian fitted autocorrelation trace to how increased narrowing due to SPM as the power increases 148 C.1 Plot of core-cladding refractive index difference as a function of Ge02 concentration 166 D.1 Typical graphs showing the variation of MFD with wavelength, used to estimate MFD values at 1064 nm 168 xvi
21 GLOSSARY OF TERMS DCF Dispersion Compensating Fiber DSF Dispersion Shifted Fiber DWDM Dense Wavelength Division Multiplexing EDFA Erbium-Doped Fiber Amplifier FWHM Full Width at Half Maximum FWM Four Wave Mixing GVD Group Velocity Dispersion IGA Induced Grating Autocorrelation LD Laser Diode LPG Long Period Fiber Grating MFD Mode Field Diameter Nd:YAG Neodymium-Doped Yttrium Aluminum Garnet NLSE Non Linear Schrodinger Equation RFA Raman Fiber Amplifier RFL Raman Fiber Laser RGP Raman Gain Parameter SBS Stimulated Brillouin Scattering SHG Second Harmonic Generation SHGA Second Harmonic Generation Autocorrelation SPM Self-Phase Modulation SPMP Self-Phase Modulation Parameter
22 GLOSSARY OF TERMS (Continued) SPMS Self-Phase Modulation Strength SRS Stimulated Raman Scattering WDM Wavelength Division Multiplexing WOT Walk-Off Term XPM Cross-Phase Modulation xviii
23 CHAPTER 1 INTRODUCTION 1.1 Background The ability to communicate worldwide on demand would not have possible without the development of low loss silica fiber as a broadband medium for transporting voice, video, and data traffic. At the time the laser was invented in 1960 [1] following an earlier suggestion [2], it was already recognized that communication using lightwaves offered immense potential but it took over ten years before a practical medium capable of effectively transporting light pulses around the world was developed. The manufacture of low loss optical fibers began in the 1970s [3-5], and continuous improvements on fiber fabrication technology resulted by 1979 in the reduction of fiber loss to only about 0.2 db/km near 1.55 Alm wavelength [6]. The availability of such low loss fibers represented a critical milestone in the global telecommunication and information technology revolution. Added to its low loss is its enormous bandwidth, which makes it possible for large amounts of different information to be transmitted simultaneously through the same fiber in a process referred to as wavelength division multiplexing (WDM). Another major revolution in the optical communication industry occurred in the early 1990s when erbium doped fiber amplifiers (EDFAs) invented in 1987 [7-9]] became commercially available. Prior to the advent of EDFAs, the standard way of coping with the effect of attenuation and dispersion in long-haul fiber optic communication was to use periodically spaced electronic repeaters. Such repeaters consist of a photodetector to detect the weak incoming light, electronic amplifiers, timing 1
24 2 circuitry to maintain the timing of the signals and a laser along with its driver to launch the signals along the next span. Thus the input optical signal is first detected and converted to electrical signals. The electrical signals are processed (reshaped and retimed) to remove the effect of pulse dispersion and then amplified to drive an optical pulse, hence regenerating the pulse train. The emerging optical signal is then sent again through the next segment of the link. The use of EDFAs permits the direct amplification of optical signals without the optical-to-electrical-to-optical conversion associated with electronic repeaters. These optical amplifiers are now referred to as optical repeaters. Transmission systems with tens of thousands of kilometers of fibers are now possible using EDFAs for periodic optical amplification (typically every 40 to 80 km) to compensate for fiber loss. A major advantage of EDFAs is they operate independent of data rate, format and wavelength (within the erbium gain spectrum), and this paves the way for dense wavelength division multiplexing (DWDM). The DWDM technology utilizes many independent lasers, each operating at evenly spaced wavelengths and each carrying its own stream of data or information and all propagating down a single optical fiber. For example, in DWDM technology, one could have 100 lasers, each operating at a data rate of 10 Gbits/s resulting in an aggregate data rate of 1 Tbit/s. The introduction of a two-band architecture, which includes amplifier sections for the C-band (1530 nm 1560 Om) and L-band (1570 nm 1620 nm), resulted in a further increase of the bandwidth. In addition, these amplifiers provide high output power and low noise figure to support the everincreasing capacity demand on lightwave systems.
25 3 All these attempts to fully utilize the capabilities of silica fibers will ultimately be limited by nonlinear interactions between the information bearing lightwaves and the transmission medium. These optical nonlinearities can cause noise, signal distortion, crosstalk, and excess attenuation of the optical signals, resulting in system degradation [10-12]. Thus, as the world continues to push for ever higher data rates, continued progress in research and understanding of the impairments caused by optical nonlinearities is critical. There exist a collection of nonlinear effects in optical fibers [13-31] each of which manifests itself in a unique way and affects specific lightwave systems in different ways. The majority of the fiber nonlinearities arise from the dependence of the refractive index on light intensity. This intensity induced refractive index change referred to as the nonlinear refractive index (n2), is responsible for self-phase modulation (SPM) [13,14]; cross phase modulation (XPM) [15]; four wave mixing (FWM) [16,17], and soliton formation [18,19]. Self-phase modulation can lead to a shift in the frequency of the pulse (selfchirping), which influences the pulse shape via its interaction with the fiber dispersion. It is possible for self-chirping and dispersion to cancel each other. If this happens, solitons can form [18-20]. However, when the cancellation is not complete, self-chirping leads to broadening of the optical spectrum and can cause additional pulse distortion. XPM results from the intensity variation in one channel modulating the phase of all the other channels in the fiber. In FWM, two or more optical waves (signals) at different wavelengths mix to produce new optical waves at other wavelengths. This depletes certain waves and by means of frequency conversion, generates interfering signals for other channels in wavelength-multiplexed systems. This leads to both noise and crosstalk, thus degrading
26 4 the quality of the transmitted signals. Another class of optical nonlinearities that occur in optical fibers is stimulated (Raman and Brillouin) scattering [21-28]. Stimulated Raman scattering [21-23], an interaction between light and vibrations of silica molecules, causes frequency conversion of light and results in crosstalk, and attenuation of shortwavelength channels in wavelength multiplexed systems. Stimulated Brillouin scattering [24-28] arises from the interaction between light and sound waves in the fiber. This causes frequency conversion and reversal of propagation direction of light and can lead to depletion of signal power and modulation instability [29]. Therefore, accurate measurement and characterization of these fiber nonlinearities are crucial for predicting and improving the performance of optical communication systems. In as much as it is crucial to control the adverse effects of fiber nonlinearities, it is equally pertinent to note that nonlinear effects in optical fibers are also useful in some aspects [30-49] and this creates additional incentives to the study of fiber nonlinearities. For example the nonlinear phenomenon of SPM has been used in optical pulse compression [30-34] by taking advantage of the SPM-induced chirp and spectral broadening. Soliton based optical communication systems have been developed [35-40]. Optical solitons result from the interplay between SPM and GVD in the anomalous dispersion regime. The development of the Raman fiber amplifier (RFA) [41-43] and Raman fiber lasers (RFL) [43,44] are also other positive rewards stemming from fiber nonlinearities. The RFA has been used as discrete, analog, and digital amplifiers at both 1.3 t1111 [45] and 1.5 gm [46,47] and as remotely pumped amplifiers in the repeaterless optical communication systems [48,49].
27 5 It is in recognition of all these effects that considerable attention has been given to the study of optical fiber nonlinearities. Stolen and Ippen measured the gain coefficients for SRS and SBS in single mode silica fiber as early as 1972 [50,51]. Measurements of the nonlinear index of refraction in silica fibers have also been reported by a number of authors, using different techniques [13, 52-62]. The most widely used of all these techniques is the self-phase modulation method developed by Stolen and Lin [13]. In this technique, a transform limited optical pulse is coupled into a fiber of appreciable length (z ~ 100 m to 2 km) where it suffers self-phase modulation as it propagates. The output spectrum is measured as a function of the input power using a scanning Fabry-Perot interferometer. The frequency broadening is proportional to the spectral phase shift, which is in turn proportional to the input power. As the input power is increased, maxima and minima peaks occur in the frequency spectrum when the phase shift is in integer multiple of 7t12. The number of peaks in the spectrum reveals the magnitude of the spectral phase shifts. From the analysis of the phase shifts versus peak power, n 2/Aeff can be precisely deduced. However, in this technique and other known approaches, one would typically require several hundred meters of fiber and sometimes several kilometers for experiments utilizing cw lasers [57]. The investigation embodied in this thesis utilizes a new technique the photorefractive beam coupling technique (also called induced grating autocorrelation- IGA) to measure n2 and stimulated Raman scattering in short lengths (Z 20m) of Er-Al- Ge doped single mode fibers. IGA was originally developed for characterization of ultrashort pulses [63,64]. The use of the photorefractive beam coupling technique for measuring n2 relies on the fact that the IGA can detect the time dependent phase change
28 6 acquired by an optical pulse after propagating through a nonlinear medium, such as optical fiber. It is the SPM induced phase change that is used to characterize the nonlinear medium. Generally, because of the short length of fiber needed to generate SPM in IGA experiments, GVD (group velocity dispersion) can be neglected. The first application of the IGA technique for n2 measurement in optical fiber was carried out in previously characterized pure silica fibers and Er-doped fibers [66] and a good agreement with earlier published results confirmed the accuracy of the this technique. This technique has also been utilized to measure the magnitude and sign of n2 in 1 mm thick GaAs, ZnTe and CdTe films and proved to be within 5%s of published values as determined by Z- scan [67]. The main goal of this thesis is three-fold: (1) A systematic study of the n2/aeff as a function of Er, Al and Ge contents. (2) To establish the ultimate sensitivity of the IGA technique and relate it to other known techniques, and (3) To modify the existing IGA model which is based on the simple theory of SPM, include the Raman contribution to the nonlinearity (in the limits of zero GVD). This modified model was successful in explaining the observed deviation in IGA model and has paved the way for the use of IGA technique for the measurement of the Raman gain coefficient in optical fibers. These outlined objectives have been achieved and the details of the work are reported in this thesis and in conference presentations that the author has delivered [68-71].
29 7 1.2 Overview of the Dissertation The dissertation consists of eight chapters, including this introduction that forms Chapter 1. In Chapter 2, the basic nonlinear effects in optical fibers are discussed, together with the conditions under which they occur. The relation between the nonlinear refractive index and the third order nonlinear susceptibility was derived for linearly polarized optical field. The simple theory of SPM was presented, and the nonlinear wave equation was solved for a self-phase modulated Gaussian pulse in the zero GAD regimes, to show the nonlinear phase shift and frequency broadening associated with SPM are determined. Stimulated Brillouin and Stimulated Raman scattering are briefly explained. Pulse dispersion in optical fibers is discussed, and the role of GAD in the nonlinear interactions in optical fibers at different propagation regimes is explained. Chapter 3 contains a survey and description of the different measurement techniques that have been used to measure the nonlinear index of refraction (n2) in optical fibers, including the "famous" spectral domain SPM method pioneered by Stolen and Lin [13]. The levels of performance of these techniques as well as their limitations are discussed, and the need for a new approach, such as the IGA technique was highlighted. In Chapter 4 the basic theory and principles of the IGA technique is discussed. The concept of photorefractive effect and photorefractive two beam coupling are explained. The simple model of the IGA technique is presented in the limit of pure selfphase modulation for a propagating Gaussian beam, in the regime of negligible GVD (group velocity dispersion) of the fiber. The experimental set-up and procedures to for taking IGA measurements are explained.
30 8 In Chapter 5, the author reports the results of several n2 measurements he has done in different fibers using the IGA technique. Of particular interest in this chapter is the result of the dependence of the nonlinear coefficient (n2hkeff) on the doping profiles in Er-Al-Ge doped single mode fibers. Results of the measurement of n2hk eff in DCF (dispersion compensating fiber) and in True-Wave fiber are also presented. These results are compared with published values. Chapter 6 contains the new modification of IGA model, which takes into account the stimulated Raman scattering as an additional nonlinear process to SPM, for a propagating Gaussian pulse in the zero GAD regime. The initial observation of the break-down of the pure-spm IGA model in high Ge02-doped fibers is outlined, which necessitated the modification. As a result of the new model, IGA can be used to measure another crucial parameter in optical fibers, known as the Raman gain coefficient. The results of the Raman gain coefficient measurements in four different fibers including pure silica core fiber, dispersion compensating fiber (DCF), and highly Ge02 doped fibers are outlined in this chapter. A numerical modeling of IGA, in the presence of pump depletion during SRS is also presented. In Chapter 7, the author relates the IGA technique to the widely accepted spectral domain n2 measurement technique. It is shown that, in the pure SPM limit, IGA results converge with the results of the Stolen's method [13,52], through a direct mathematical relation. The measured sensitivity of IGA is also discussed in this chapter and it is shown that IGA could detect phase shifts as small as 0.14n. Chapter 8 contains the conclusion and the recommendations for further research in this field.
31 CHAPTER 2 NONLINEAR EFFECTS AND PULSE DISPERSION IN OPTICAL FIBERS 2.1 Nonlinear Susceptibility and Index of Refraction The nonlinear effects in optical fibers originate from the polarizability of the molecules under applied optical field. The polarizability of a molecule is affected on two time scales during pulse propagation in optical fiber. The first is an essentially instantaneous time scale associated with the electronic response and leads to an intensity-dependent refractive index (Kerr nonlinearity). This effect arises from an optically induced distortion of electronic charge distribution within the medium. Typical response time of electronic nonlinearity is approximately 1 fs. [72]. The second time scale is associated with molecular vibrations with response time in order of fs [73], which is regarded as a non-instantaneous time scale. The later is responsible for SRS in fibers. When light passes through a dielectric medium such as an optical fiber, there is induced electric polarization arising from the influence of the applied field on the electric dipoles: Where co is the vacuum permittivity, E is the electric field of the optical pulse, and x is the susceptibility. If the laser beam is of high intensity, the response of the medium becomes nonlinear and the induced polarization P can be expressed as a perturbation expansion in successive higher orders of the optical electric field: 9
32 10 where x(n (n = 1,2,...) is the nth order dielectric susceptibility. In general, the third order susceptibility is a fourth-rank tensor (i.e. z (3) ). To simplify the problem, one normally assumes a linearly polarized optical field, which ensures that only one component x (3) contributes to the refractive index, and the problem can be treated using scalar approach. This assumption is justified in the present circumstance as well, considering the short length of single mode fibers utilized in this work. In practice, the tensorial nature of x (3) can affect the polarization properties of the optical field through nonlinear birefringence [77,78]. The linear susceptibility x (1) represents the dominant contribution to P. Its effect is included through the linear refractive index (n) and the attenuation constant a. The second order susceptibility X(2) is responsible for such nonlinear effects as second harmonic generation (SHG), sum-frequency generation, parametric fluorescence and optical rectification [74]. It is nonzero only for media that lack inversion symmetry. As a result, since Si02 is a symmetric molecule, X(2) vanishes for silica fibers. Thus optical fibers do not normally exhibit second-order nonlinear effects. However, electric-quadrupole and magnetic dipole moments can sometimes generate weak second-order nonlinear effects. Defects or color centers inside the fiber can also give rise to SHG, under certain conditions [75,76]. The lowest order nonlinear effects in optical fibers therefore originate from the third order susceptibility X(3) which
33 11 gives rise to nonlinear refraction. Nonlinear refraction refers to the intensity dependence of the refractive index resulting from the contribution of x (3). The relationship between x(3) and the nonlinear refractive index (n2) will be derived in the following analysis: Assume a plane optical wave with electric field of the form: with the real part given simply by: Equation (2.2) can now be re-written as: Using the trigonometric identity [79] cos 3 8 = 41 (cos3 + 3 cos8 ), equation (2.5) can be written as The intensity of an optical field is related to the electric field by the expression [20] : where no is the low field refractive index of the medium. Equation (2.7) can thus be written as:
34 12
35 13 In the above Equation, n2 is the nonlinear refractive index, no is the linear refractive vacuum (c = x 10 8 mis) and no is the low field refractive index. ), c is the velocity of light in To have a feeling of typical values, note that for silica fibers n o k and n2 ~ Thus for a laser beam with peak power of 30W propagating through a single mode fiber with effective core area (Aeff ) of 50 utm2. The and the change in refractive index due to nonlinear effects is An = n2 =1.5 x This change in refractive index seems very small, but due to very long interaction lengths in optical fiber communication (typically 10,000 km in long haul systems), the accumulated effects become significant and can result to severe penalty. In fact, it is this small nonlinear term that is responsible for SPM, XPM, FWM and for the formation of solitons in optical fibers.
36 Self-Phase Modulation Self-phase modulation (SPM) is a phenomenon in which a laser beam propagating in a medium interacts with the medium and imposes a phase modulation on itself. The physical origin of SPM lies in the fact that the strong field of a laser beam is capable of inducing an appreciable intensity-dependent refractive index change in the medium. The medium then reacts back and inflicts a phase change on the incoming wave, resulting in self-phase modulation. This phase modulation is associated with frequency broadening of the optical pulse. The first observation of SPM was made in the context of transient selffocusing of an optical pulse propagating in a solution of a CS2-fihled cell [81]. Alfano and Shapiro observed SPM in solids and glasses by using picosecond pulses [82]. The first observation of SPM in optical fibers was made by Ippen et al [83] in a fiber whose core was filled with CSC. This work led to a systematic study of SPM in optical fiber by Stolen and Lin [3]. To describe the process of SPM of light in optical fibers, the author starts with the nonlinear wave equation for the electric field: where 13(3) is the third order polarizability and can given by: 0ne can assume a plane wave of the form:
37 15 In the simple theory of SPM [84-86], it is normal to use the slowly varying amplitude approximation by neglecting the a22.-vatc term in the equation. Also assume an instantaneous response of x (3). The assumption of instantaneous response amounts to a neglect of the contribution of molecular vibrations (Raman effect) to x (3). Thus, from Equations (2.15), (2.16) and (2.17) together with the assumptions, one obtains, equations for the electric field amplitude and the phase: Equation (2.18) will yield two sets of These equations have the following solution:
38 16 Equation (2.20a) implies that the laser pulse propagates in the fiber without distortion of the pulse shape. Equation (2.20b) on the other hand shows that as the optical pulse propagate along the fiber from 0 to z, it acquires an induced phase change AC given by: The SPM induced spectral broadening can be deduced from the time derivative of the phase. The spectrum of the SPM broadened pulse can be calculated from the Fourier transform of the electric field: where E is the field amplitude which is assumed to be normalized such that 1E(0,0) I = 1 and I E(z,t) 1 C represents the optical power. Such a spectrum calculated from Equation (2.23) is called the power spectrum.
39 Cross-Phase Modulation Cross-phase modulation (XPM) refers to the nonlinear phase change of an optical pulse induced by another pulse, co-propagating with it at a different wavelength. The XPMinduced coupling among optical waves can give rise to spectral broadening, nonlinear birefringence and modulation instability. A detailed discussion of XPM and its effects on pulse propagation can be found in the following references [20, 87-90]. An important characteristic of XPM is that for equally intense optical fields (copropagating), the contribution of XPM to the nonlinear phase shift is twice compared with that of SPM. However, the XPM interaction between counter propagating optical pulses is generally weak and contributes little to the nonlinear phase shifts. This is because the group velocity mismatch is so large that the two pulses have little time to interact with each other. 2.4 Four-Wave Mixing This is a process in which three optical wave interact to generate another wave at different frequency. The intensity of the generated wave is proportional to the product of the intensities of the incident waves. FWM is a X(3) process and originates from the response of the bound electrons of a material to an applied optical field. 0ne important property of four-wave mixing is that it requires phase matching. The phase matching condition required for the process shown in Equation (2.24) to occur is that Aka = 0, where:
40 The four wave mixing process can also be defined as an interaction between four photons a photon of frequency co combines with a photon of frequency (04 to produce a photon of frequency Doi and another of frequency 0)C- This can be written simply as: with the phase matching condition: A special case is obtained when (Di = (oc = co = (04. The process is then called degenerate four wave mixing [91]. FWM processes in optical fibers have been studied extensively [16-17,20, 92-94]. 2.5 Stimulated Raman Scattering Raman scattering describes the interaction of light with molecular vibrations. Incident light scattered by molecules experience a downshift in optical frequency. The change in optical frequency is equal to molecular vibrational frequency (called the Stokes frequency). This process is called Raman effect. In silica fibers, this frequency shift is about 13.2 THz (1 THz = 10 1C Hz). If two optical waves separated by the Stokes frequency co-propagate in a Raman active medium, such as an optical fiber, the lower frequency (probe) wave will experience optical gain generated by, and at the expense of,
41 19 the higher frequency (pump) wave. This process is called stimulated Raman scattering (SRS). The growth of the Stokes wave in optical fibers can be describe by the following expression [12]: where Pp(0) is the initial power of the Stokes wave, P S(L) is the final (output) power of the Stokes wave after traveling a length (L) in the fiber. P p(0) is the initial injected power of the pump wave, Leff is the effective length. The effective length is introduced to account for the exponential decay with length of the pump power due to fiber loss. It is given by: where a is the loss coefficient for the fiber (for a << 1, Leff = L). Jeff is the effective area of the fiber [18]. The factor b accounts for the relative polarizations of pump and probe waves and the polarization properties of the fiber. In a polarization maintaining fiber, with identical pump and probe polarization states, b = 1. In a conventional fiber that does not maintain polarization, b = 2. The quantity gm is called the Raman gain coefficient. The gm for silica fiber was measured by Stolen et al, in the early experiments on SRS in single mode fibers [50,95]. In general, g R scales inversely with wavelength. The value of gm for silica fibers is about 1.5 x cmiw [50] in the visible and at 1064 nm, gm = 0.92 x cm/w [96]. It also depends on the composition of the fiber core and can vary significantly with the use of different dopants [97,98].
42 20 In general, the Raman gain coefficient is related to the imaginary part of the third order susceptibility [xi(3 through the following expression [91]: where Trio is the impedance of free space {no= (.10/60) 1/C }, P is the optical power, X.0 is the laser wavelength and A is cross-sectional area (for optical fibers, A E.- A 4f). The Raman threshold is defined as the input pump power at which the Stokes power becomes equal to the pump power at the fiber output [99]. This implies that: where a1 is the fiber loss coefficient at the pump wavelength and the rest of the symbols have their usual meanings as earlier defined. Smith [99] has shown that the threshold power (Pth) for this condition to occur can be given in terms of the Raman gain coefficient and the fiber length as follow: where Leff is the effective fiber length defined by Equation (2.29) and J eff is the effective core area of the fiber. The factor b accounts for polarization (b = 2 if polarization is completely scrambled and b = 1 if polarization is maintained). Thus for a typical silica fiber with Jeffs = 50 Ai,mC and Leff = 20 m and b = 1, the SRS threshold power is about the threshold power can be as low as 3 W for a
43 21 25 utm2 core fiber. An important feature of the Raman gain in silica is that gr extends over a large frequency range (~ 40 1Hz), with a broad peak near Hz [20,50,100]. Figure 2.1 shows typical Raman gain spectrum for fused silica. Figure 2.1 Raman gain spectrum for fused silica at a pump wavelength of 1.0 um [100]. A few words needs to be mentioned about the formation of a higher frequency photon during SRS. The optical wave associated with the high frequency photons is called anti-stokes and is generated when a phonon combines with the pump photon to generate a high frequency photon at frequency w a = cop + Act) for a Stokes wave of frequency cos = cop - Act), where cop is the pump frequency and Act) is the Raman frequency shift. The anti-stokes waves are typically much weaker than the Stokes
44 22 intensity. Since 2wp = cos + wpm the formation of anti-stokes during SRS leads to fourwave mixing a process where two photons annihilate themselves to produce Stokes and anti-stokes photons, provided that the total momentum is conserved. The momentum conservation requirement is associated with the phase matching condition that must be fulfilled for four-wave mixing to take place. This phase matching condition is not easily satisfied in single mode fibers for Awe!O 1Hz [20]. Thus, the anti-stokes wave is rarely observed during SRS in single mode fibers. 2.6 Stimulated Brillouin Scattering Stimulated Brillouin scattering (SBS) is similar to SRS except that SBS involves the interaction of light with sound (acoustic) waves rather than molecular vibrations. Part of the incident (pump) light is converted into Stokes light of lower frequency with a concomitant excitation of an acoustical phonon. The Stokes shift in SBS (~10 GHz) is smaller by three orders of magnitude compared with that occurring in SRS. In addition, the SBS generated Stokes wave propagates in the backward direction. The peak SBS gain coefficient (gm) in silica fibers (gr ~ 4.0 x 10⁻⁹ cmiw [51 ]) is over two orders of magnitude larger than the gain coefficient for SRS, but the bandwidth of the Brillouin gain spectrum is very narrow, typically 20 MHz [101]. The threshold power for SBS is given by [99]
45 23 Although SBS can occur in optical fibers at input power levels much lower than those needed for stimulated Raman Scattering, SBS only occurs for a continuous wave (cw) pump or when the pumping is in the form of relatively wide pulses (with pulsewidth in the range of nanoseconds and higher). For short pulses in the picosecond range SBS is negligible. As a result, the author would not consider SBS in his measurements and analysis in this work. 2.7 Optical Solitons in Fibers 0ptical soliton refers to optical wave that preserves its pulse shape and velocity as it travels over long distances. Solitons can form in optical fiber if there is an exact balance between the effects of non-linearity and the dispersion in the fiber material. The condition can be fulfilled in the anomaous dispersion regime, with f3c < 0, where 0C is the GAD parameter. Therefore, for single mode fibers the operating wavelengths for solitons are usually about 1.3 p.m or longer. The work discussed in this thesis has been carried out below the soliton regime. For more detailed discussion on soliton propagation, readers should consult the following references [20, 56-59] 2.8 Two-Photon Absorption This is a process in which an atom makes a transition from its ground state to an excited state by simultaneous absorption of two laser photons. Thus in this process when two low-energy photons strike a molecule at almost the same time and get absorbed, they have approximately the same effect as one photon of half the wavelength (twice the frequency). This process is related to the optical absorption property of the materials and
46 24 is generally observed at high intensities. At high optical intensity, the absorption coefficient (a) of a nonlinear material becomes intensity dependent and can be written as: where I is the optical intensity ac, is the linear (low field) absorption coefficient and a C is the two-photon absorption coefficient. The two-photon absorption is related to the imaginary part of the third order nonlinear susceptibility in the following manner [20]: where coo is the central angular frequency of the laser, n is the linear refractive index of the material and c is the speed of light. In optical fibers, two-photon absorption can lead to intensity dependent loss and sometimes cause color center formations that degrade the quality of an optical fiber. It has been reported that two-photon absorption also leads to modulation instability [102]. It should be noted however that two-photon absorption can only occur in silica fibers for laser wave lengths of about 320 nm or less, because the sum of the energy of two photons at this wavelengths is typically greater than the band gap of fused silica (-8.3 ev). Typical value of a C measured in silica fiber at 260 nm is 3.0 x 10 "5 [103]. Because of the long wavelength (1064 nm) of the laser used in this work, two-
47 25 photon absorption is not expected to occur and as such it will not be taken into account in analyzing the data obtained in the present work. 2.9 Pulse Dispersion and GVD in Optical Fibers Pulse dispersion refers to broadening in time of an optical pulse as it propagates through the fiber. There are three types of pulse dispersion in optical fibers namely: intermodal dispersion, material dispersion and waveguide dispersion. Intermodal dispersion arises due to different group velocities of different modes in the waveguide. This form of dispersion is dominant in multimode fibers and negligible in single mode fibers. Both material dispersion and waveguide dispersion are called intramodal dispersion and arise due to the different transverse times taken by different wavelength components of the source. In single mode fibers, material dispersion and waveguide dispersion are the dominant dispersion mechanisms. Material dispersion results from the dependence of the fiber material on wavelength. 0n the other hand, waveguide dispersion is purely a geometric effect resulting from the waveguide structure. Both material and waveguide dispersions depend on the spectral width of the source and form what is known as chromatic dispersion in single mode fibers. Chromatic dispersion plays an important role in the propagation of short laser pulses because different spectral components associated with the pulse travel at different speeds given by dn(co). Mathematically, the effect of fiber dispersion can be accounted for by expanding the mode-propagation constant f3 in a Taylor series (since the propagating pulse is assumed to have a relatively narrow frequency spectrum) about the frequency (coo) at which the pulse spectrum is centered:
48 26 The parameters 131 and 0C are related to the linear refractive index n and its derivative in the following manner: where kg is the group index and vg is the group velocity and (3 1 is the group velocity parameter. In principle, the envelope of an optical pulse moves at the group velocity (vg) while the f3 C represents the dispersion of the group velocity. For this reason, this phenomenon is called the group velocity dispersion (GVD) and 13C is referred to as GADS parameter and represents the lowest order dispersion term. The term 133 appearing in the
49 27 Taylor expansion is called the third order dispersion parameter and is usually generally negligible except in the vicinity of zero dispersion wavelength of the fiber, where 13C vanish. For ultrashort pulses in the femtoseconds regime, it may be necessary to include the effect of 133 even if f3c # 0, because the expansion of Aa/o is no longer small enough to neglect it. Typical value of 13 3 is 0.1 ps3/km [20]. The quantity 13 C is measured in pscikm. Typically f3 C is of the order 50 ps Cikm in the visible region, while at 1550 nm it is about 20 ps Cikm. In the literature, the dispersion D (also called dispersion coefficient) is sometimes used in place of 0 C, and the two are related by: The dispersion coefficient D is defined as the time delay per unit length of the propagating distance per unit spectral width of the source. The commonly used unit for D is (psikm.nm). Figure 2.2 shows a typical dispersion curve for conventional single mode fibers [104] with contributions from material and waveguide dispersion to the total dispersion in the fiber.
50 28 Figure 2.2 Variation of material, waveguide and total dispersion (D) with wavelength [104]. The material dispersion curve passes through zero around 1.27 um and changes sign, while the waveguide dispersion is continually negative. The combined effect of the two results to a total dispersion curve that passes through zero around 1.3 gm. This is the so-called zero dispersion wavelength, denoted by XD. It should be noted however that dispersion does not completely go to zero at X = XD, because in the vicinity of zero dispersion wavelength higher order dispersion terms (such as the cubic term) become important and the pulse will still undergo dispersion although by a much smaller amount. The slope of the total dispersion in Figure (2.2) is called the dispersion slope, and is related to the cubic dispersion term (j3 3). Figure (2.3) shows the variation of GVD parameter 13C with wavelength for fused silica [20].
51 Figure 2.3 Variation of 13C and d1c (walk-off parameter) with wavelength for fused Silica [20]. 29
52 Figure 2.4 Variation of dcnidx.c with X for pure silica and doped fibers. Dopant concentration is in parenthesis [105].
53 31 It needs to be mentioned that the dispersion behavior of some telecommunication fibers may deviate from the that shown in Figures (2.2) and (2.3) because the fiber core is sometimes doped with Ge02, PC05, or other dopants which changes the refractive index of the fiber and modifies the dispersion curve. Figure 2.4 shows the variation of d CnidXC with X for doped silica fibers. This shows that dcnidx2 depends significantly on dopant concentration and varies also with wavelength. The dispersion coefficient due to material dispersion (Dm) can be written: where At is the time delay in the arrival of the fastest and the slowest wavelength component in a material with refractive index n(x). AX is the spectral width of the source and L is the propagation distance. For single mode fibers, the total dispersion is given by a similar expression, except that the refractive index n is replaced with the effective index of the mode (nee) thus: This expression contains contributions from both material and waveguide dispersion. The parameter n e is called the effective index of the mode (n e = (3/1(0), where 13 is the propagation constant of
54 32 the mode and k0 = 27ciX. In the case of waveguide dispersion alone, the parameter D B can be written in terms of the normalized frequency (V) thus: where noel is the cladding index, A is the relative refractive index between the core and the cladding, b is the normalized propagation constant. The normalized frequency (A) is given by A = (2na/X.)(ne2-ne 12 ) 1/2 where Inc is the refractive index of the fiber core and a is the core radius. Thus waveguide dispersion can be changed considerably by varying the operating A-value and the value of A. By changing the magnitude of the waveguide dispersion, one can locate zero dispersion at a desired wavelength. This feature is used in the telecommunication industry to shift the zero dispersion wavelengths in the vicinity of 1.55 lam where the fiber loss is minimum. Such fibers are called dispersion-shifted fibers (DSF). If the GAD is shifted beyond 1.6 p.m, then the fiber is called dispersion compensating fiber (DCF). It is also possible to design a fiber with relatively low dispersion over the wavelength region m. Such fibers are called dispersionflattened fibers. Figure (2.5) shows a combined plot of dispersion curves for standard silica fiber, dispersion shifted fiber and dispersion flattened fiber p on the same scale.
55 33
56 The Role of GVD in Nonlinear Interactions in Optical Fibers Pulse dispersion plays an important role in nonlinear interaction in optical fibers because nonlinear effects can manifest qualitatively different behavior depending on the sign of GVD. For wavelengths less than the zero-dispersion wavelength (A, > XD), GAD is positive (132 >0) and the fiber is said to exhibit normal dispersion. In the normal dispersion regime, the red shifted (low frequency or long wave length) component of an optical pulse travel faster that the blue shifted (short wavelength) component. In the wavelength region beyond the zero-dispersion wavelength, GAD is negative (132 < 0) and the fiber exhibits anomalous dispersion. In this regime, the blue shifted component of the pulse now travels faster than the red-shifted component. It is in this regime that optical fibers can support solitons through a balance between dispersion and self-phase modulation. Because of GVD effects, two different pulses at different wavelengths would travel at different speeds in the fiber. The nonlinear interactions between the two pulses would cease to occur when the faster moving pulse has completely "walked" through the slower moving pulse. The separation between them is governed by the walk-off parameter d defined by d = (1Ivgi 11vg2). Here, vgl and vgl represent the group velocities of the two pulses. 0ne can define a walk-off length L, as the distance within which the faster moving pulse walks through the slower moving pulse. The walk-off length can be given in terms of the walkoff parameter thus:
57 35 In order to properly analyze experimental results involving pulse propagation in optical fibers, it is necessary to classify the experimental fiber length (L) in terms of two length scales, (depending on the laser pulsewidth and peak power used), namely: the nonlinear length (LNL) and the dispersion length (LD). The nonlinear length represents the length scale over which the effect of nonlinearity (both SPM and XPM) becomes important. In terms of the pump peak power (P0) this length can be is given by: where y is the nonlinear coefficient (y = n2co0/cjeff), AAeff is effective core area of the fiber and c is the speed of light. Similarly, the dispersion length, LD represents the length scale over which the effect of GVD becomes important. In terms of the laser pulsewidth and the GVD parameter (j32), this length can be given by: Generally, when the experimental fiber length (L) is such that L << LD, but L LNL, GAD can be neglected and the pulse propagation is governed by nonlinear effects. If on the other hand, (through the choice of pulsewidth, laser power and experimental length) L is comparable to both LNL and LD the GVD will no longer be negligible and must be included in the analysis of experimental results. As a check, the author would like to run through some numbers and establish valid experimental and theoretical conditions for the work. Typically y ~ 3 Wikm-1 for standard silica fibers and 132r'z 24 ps2/km at limp. Thus, for 50 As pulses with a peak power of 36 W, LNL is approximately 10 meters while
58 36 LD is about 100 km. In practice however, dispersion may set in at a length shorter than this (100km), since there are other factors than 132 that contribute to dispersion in fibers (see Section 2.8). However, the above estimate gives a justification as to why GVD in neglected in analyzing the results presented in this thesis. Most of the fibers used are in the range of m, except in few cases where 100 m was required for SRS measurements. Even at that, this length is still far below the dispersion length for silica fibers.
59 CHAPTER 3 OTHER TECHNIQUES FOR MEASURING n2 IN OPTICAL FIBERS AND THE NEED FOR A NEW APPROACH 3.1 Introduction It has been realized over the years that most of the nonlinear effects in optical fiber are associated with the nonlinear refractive index (n 2) and that these nonlinear effects can have a relevant impact on the performance of optical telecommunication systems [10-12]. As a result, n2 is a crucial parameter whose value in the fiber must be known precisely in order to perform calculations for predicting system performance. A variety of techniques [13, 15, 54-59, ] have been developed since the pioneering work of Stolen and Lin in 1978 [13]. Some of these include spectral domain self-phase modulation method by use of pulsed lasers [13, 53-54, 56, 62, 107], cross phase modulation [15, 55, ], four wave mixing [110] and modulation instability [111]. A technique based on LPG (long period fiber grating) pairs, utilizing enhanced absorption of rare earth ions has also been developed [61]. In this chapter the author wishes to discuss briefly some of these techniques and point out their utility and limitations. 3.2 The Spectral Domain SPM Technique This is the most widely used method for n2 measurement in fibers [13, 53, 62, 66, 107]. The method utilizes pulsed lasers and typical pulsewidths reported ranges from picoseconds. In this technique, the laser pulses are launched into the test fiber whose length is typically meters or more [13,107] and sometimes kilometers [62]. Spectral broadening occurs due to SPM because of the phase delay at the pulse maximum 37
60 38 relative to the wings. The output is passed through a scanning Fabry-Perot interferometer, which resolves the spectrum. The spectrum assumes readily identifiable shapes characterized by maxima and minima peaks at maximum phase shifts given by: One measures the power after adjusting the input power to produce these identifiable shapes. As the input power is increased, the number of peaks increases. The number of peaks is proportional to the spectral phase shift which is in turn proportional to n2/aeff (where Jeffs is the effective core area of the fiber). The fiber length L and the vacuum wavelength (X) are usually known, so that the slope of a plot of Om versus P. produces the nonlinear coefficient in the form of n2/jeff. If Jeffs is known, n2 can be deduced. The experimental setup is shown in Figure 3.1.
61 Figure 3.1 Experimental setup and analysis procedure for the spectral domain SPM technique [107]. 39
62 40 This technique is relatively simple (because one can deduce the phase shift simply by counting the number of nodes in the spectrum) and yields accurate results. The pioneering work on this performed in 1978 at nm gave the well-known value of n2 However, this technique requires long fibers in order to generate some orders of ici2 phase shifts. It may therefore not be suitable for use in measuring n2 in standard EDFAs (Erbium-Doped Fiber Amplifiers) which are typically between 15 to 25 meters. In addition, because the technique relies on counting of the number of nodes that appear at integer orders of 7t/2 phase shift, the minimum detectable phase shift is limited to 7t/ Cross-Phase Modulation Technique The cross-phase modulation (PM) technique has been used to measure n2 as early as 1987 [54] using interferometfic method. In a 1995 experiment Kato et al [15] used a pump and probe configuration utilizing two independent cw laser sources from laser diodes (LDs) at the same wavelength (1550 nm) as the pump and probe signals. The probe signal was made relatively weaker than the pump, so that the phase shift in the test fiber was caused principally by the pump, through XPM. The two were coupled into the fiber where they interact as shown in Figure 3.2.
63 41 Figure 3.2 Measurement system of the nonlinear refractive index by the XPM method [15]. When the pump light was modulated in its intensity at low frequencies (7.36 MHz) with the electrical oscillator, the probe signal developed FM sidebands because of the XPM induced phase modulation. To ensure that the relative polarization between the pump and the probe varied randomly, the pump light was depolarized before entering the fiber. Typical fiber length used ranged from 5-15 km. The n2 values obtained here ranged from 2.48 x CM2/W for silica core fibers to 3.95 x cm2fw for DCF (dispersion compensating fibers). Measured n2 values in these experiments are in many cases higher than that obtained using SPM-based techniques. This is due to the fact that there is electrostrictive contribution to n2 that occurs for pulsevvidths greater than 1 ns or modulation frequency less than 1 GHz. The electrostrictive process results from the density change of an optical material due to the stress caused by intense electromagnetic
64 42 waves. This change in density alters the index of refraction of the material. The speed of response is however very slow, since the growth of the density change is governed by acoustic propagation. The XPM technique has also been used to study the frequency dependence of the electrostrictive contribution to n2 by changing the pump modulation frequency from 10 MHz to values over 1 GHz [109,112]. Apart from the electrostrictive contribution that is known to occur for measurements with this technique, another drawback is that it requires very long fibers and two laser sources and therefore appears to be an expensive venture. 3.4 Four-wave Mixing Technique In the four-wave mixing technique one uses two cw laser sources [110]. When two pump waves of frequencies v 1 and v2 are launched into a single mode fiber, the nonlinear Kerr effect is responsible through FWM process for the creation of new beating frequencies at (2v2 vi) and (2v1 v2) which give rise to sidebands on the output spectrum, whose amplitude and frequency depend on n2. In an experiment performed by Prigent and Hamaide in 1993 [110] using this technique, two cw laser sources operating near 1550 nm with a wave length separation of 0.8 nm were used. The output of the two lasers was amplified using fiber amplifier and then injected into 12.5 kilometers of the test fiber. Figure (3.3) shows a sketch of the experimental setup. The powers in the FWM sidebands were fitted numerically and used to estimate the n2 value. A value of n2 = 2.25 x cm2/w was reported in that measurement [110]. lasers. This technique requires very long fibers (-12 km) and in addition, the use of two
65 Figure 3.3 Experimental setup and typical spectra for the four-wave mixing n 2 technique (a) represents the spectrum of the fiber input and (b) represents the spectrum of the fiber output [110]. 43
66 Modulation Instability Method The technique based on modulation instability is similar to FWM technique except that only a single pump beam is needed at the fiber input. The method relies on the measurement of the modulation instability peak gain as a function of pump power. Modulation instability originates from the interplay between Kerr effect and anomalous dispersion, and gives rise to two spectral gain bands symmetrically located with respect to the pump frequency. The frequency shift and the amplitude of the sidebands depend on n2 and can be used to deduce it. In a recent experiment, Artiglia and co-workers [111] utilized a DFB (distributed feedback) laser operating at 1553 nm, which was modulated externally to produce 25 ns pulses at a repetition rate of 4 MHz. The pulses were amplified using two cascaded fiber amplifiers and then coupled into the test fiber. The test fiber consisted of a 10.1 km DSF (dispersion shifted fiber). The experimental setup is shown in Figure 3.4. The spectrum of output of the fiber was measured by means of an optical spectrum analyzer. The spectral gain due to modulation instability was obtained by normalizing the spectrum of the light exiting the fiber to that of the input light, which consists of the amplified laser signal superimposed onto the ASE (amplified spontaneous emission) of the optical amplifiers. The amplitude of the modulation instability sidebands was used to determine n2 for the fiber. They reported a value of n2 = 2.64 x 10 "16 cm2/w [111]. This value must include electrostrictive contribution because of the wide pump pulses used in the experiment, which explains why it appears larger than typical values obtained from the SPM technique.
67 45 In this technique however, the major drawback of long fiber resurfaces, and the electrostrictive contribution that tends to exaggerate the n2 values. One cannot also apply this technique for measuring n2 in typical EDFAs, for the same reason of fiber length requirement. Figure 3.4 Experimental setup and typical output spectrum for the modulation instability technique for n2 measurement in fibers [111].
68 Long Period Fiber Grating Pair (LPG) Method for n2 Measurement Recently, Kim et al [61] reported the use of LPG (long period fiber grating) pairs to measure resonant nonlinearity in short lengths of Yb 3+/A13+ co-doped nonlinear optical fibers. This technique is based on the changes on the absorption properties of ytterbium ions on laser pumping. A long period fiber grating (LPG) pair is used as a sensor. In the experimental arrangement shown in Figure 3.5, the test fiber with lengh L1 is spliced between the two LPGs with lengths L2. The light sources consist of a signal beam from a 1550 Om broadband source together with a 980 LD (laser diode) pump laser.
69 47 In this technique, the change in refractive index of the fiber core is related to the shift in wavelength that arises from the interference between the core mode and the cladding mode of the fiber through the LPG pair [61, ]. When a laser beam (1550 nm) pumped by a LD at 980 nm is lunched into the core of the high-concentration ytterbium doped fiber, a change in effective refractive index takes place with the pump power, and this results in a shift of the interference fringes. Because the intensity of the pump beam decreases exponentially with increasing absorption through the fiber, the amounts of the effective refractive index is different along the fiber. The total phase shift induced by the effective index change of the core along the fiber can be deduced from the shift of the interference fringe pattern, and from the phase shift n2 can be calculated. The reported value of n2 in this measurement was approximately 5.6 x cm2/w [61]. This is over four orders of magnitude higher than the n2 reported with the other techniques described above. This is because the nonlinearity measured here is mainly due to carrierenhanced nonlinearity, which differs from the well-known small Kerr coefficient. This technique works well in very short lengths of fiber (typically 45 centimeters), which is a good advantage. Unfortunately however, the use of this technique is only limited to measuring the nonlinear index of refraction due to the absorption-enhanced nonlinearities resulting from Kramers-Kronig effect [60] in highly rare earth doped fibers. This type of nonlinearity although large, is inherently very slow, of the order of milliseconds in comparison to the known fast Kerr nonlinearity. The technique is therefore not suitable for measuring n2 due to the Kerr nonlinearity in standard telecommunication fibers.
70 The Need for a New Technique for Measuring n2 in Fibers A reliable determination of n2 in optical fibers is a difficult task. Several methods have been discussed above, with their corresponding merits and demerits. It is however fair to say that there is no experimental technique that is at the same time simple, fast, accurate and applicable to a variety of situations. With the spectral SPM technique using pulsed lasers [13, 56, 62, 107], one avoids electrostrictive contribution but it still needs a long fiber. The long fiber requirement is also a general problem to the other techniques except in the case of the LPG method, which however fails to meet the general applicability as seen in Section 3.6. A major problem with n2 measurements in long fibers is the fact that parameters such as effective area and dispersion are not constant along the entire length of the fiber. Generally, the accuracy of n 2 measurement depends strongly on how accurately one can determine the effective area of the fibers and the laser power. A variation in effective area along the length of the fiber during measurements would lead to additional uncertainties in the measured n2 values. The effect of dispersion introduces pulse broadening which reduces the peak power along the fiber in a non-uniform way. Even for measurements at 1550 nm, which is near the zero dispersion wavelength of DSF (dispersion shifted fibers), dispersive broadening is still a problem, because of the incredibly long length (-20 km) of fibers required [62] in such circumstance, to obtain the necessary phase shifts with the relatively low power lasers available. In a recent report [62], Stolen et al have shown that in order to improve the accuracy of n2 in measurements in long fibers, one would need to fit the experimental spectrum with a computer program that simulates the variation of the power, pulse shape, and fiber properties along the length of the fiber. This is necessary to
71 49 properly account for the fiber loss and the pulse spreading. This is certainly a tedious exercise. Another problem in measuring n2 in long fibers is the effect of polarization. The nonlinear refractive index depends on the state of polarization of the field. In isotropic glass fibers, the nonlinear refractive index is maximum for linear polarization and drops to 2/3 of maximum for the circular polarization state [59]. In long non-polarization maintaining fibers, the polarization state wanders over all values from linear to circular and it is practically impossible to map the evolution. These polarization changes have been shown to produce significant variations in n2 values with the result that an approximate factor [59, ] of 8/9 of the value for linear polarization is needed to correct the values of n2 obtained in such measurement. An accurate method for measuring n2 in short lengths of fibers is therefore highly desirable to overcome these problems associated with n2 measurements in long fibers. In addition, with the increasing use of erbium doped fiber amplifiers (EDFAs) in long-haul optical communication and in DWDM (Dense-Wave Division Multiplexed) systems, it is crucial that a technique capable of measuring n 2 in commercial available EDFAs be developed, in order to accurately predict the performance of the systems. The standard length of EDFJs is between 15 to 25 meters. Therefore, in this thesis, a new method [66-68] for measuring n 2 (due to Kerr nonlinearity) in short lengths of fibers has been used. This technique is based on photorefractive two-beam coupling also known as induced grating autocorrelation (IGA). The use of the photorefractive beam coupling technique for measuring n 2 relies on the fact that the IGA can detect the time dependent phase change acquired by an optical pulse
72 50 after propagating through a nonlinear medium, such as optical fiber. It is the SPM induced phase change that is used to characterize the nonlinear medium. Generally, because of the short length of fiber needed (typically m) to generate SPM in IGA experiments, GVD (group velocity dispersion) is negligible and the effect of polarization scrambling is highly minimized. In the next chapter, the author will describe the basic principles, modeling and the experimental setup of the IGA technique.
73 CHAPTER 4 THE PHOTOREFRACTIVE BEAM-COUPLING TECHNIQUE [INDUCED GRATING AUTOCORRELATION (IGA)] 4.1 Introduction In Chapter 3, the need for a new technique capable of measuring n2 accurately in short lengths of fibers was made obvious. It is in recognition of this that the photorefractive two-beam coupling technique (also called induced grating autocorrelation) was developed [65,67,68] for measuring n2 in short lengths of fibers (z ~ 10 to 20 meters), with pulses as short as 50 to 75 picoseconds. In this chapter the author would discuss the basics of the photorefractive beam coupling technique, the mathematical formulation and modeling as well as the experimental realization. A general overview on how the selfphase modulation strength is determined from the fit of the experimental data to the IGA model based on pure SPM will be given together with the final steps for calculating n2 from the data. 4.2 The Photorefractive Effect The concept of photorefractive effect is well established [ ]. It can simply be defined as the change in refractive index of an optical material that results from the optically induced redistribution of charges (electrons and holes). The processes involved are explained below. When two mutually coherent beams intersect inside a photorefractive crystal, as shown in Figure 4.1, a light intensity pattern is created due to the beams' interference. Free charge carriers are generated within the bright region by 51


74 52 photo-excitation from impurity energy levels to an energy band at a rate proportional to the optical intensity. These carriers then diffuse away by concentration gradient or drift from the position of high intensity where they are generated to the dark region, leaving behind fixed charges of the opposite sign. These free carriers are then trapped by ionized impurities within the dark region, depositing their charge as they recombine. The result is the creation of an inhomogeneous space-charge distribution that can remain in place for a period of time after the light is removed. The charge distribution creates an internal electric field pattern that modulates the local refractive index of the material by virtue of electro-optic effect. The change in refractive index corresponds to a phase grating. The entire process is illustrated in Figures (4.2) and (4.3). The refractive index change (An) is related to the space-charge electric field (E) by the following expression: where n is the background refractive index and ref is the effective electro-optic coefficient.


75 Figure 4.3 Creation of space charge field and photorefractive gratings in photorefractive material. The space charge fleld is 90 out of phase with the space charge. 53
76 54 In the two-beam coupling configuration (two wave mixing), the photorefractive grating resulting from the refractive index modulation causes energy transfer (by diffraction) from one of the beams (the probe) to the other (the pump) beam. Kukhtarev and co-workers [127] have worked out the mathematical details for two-wave mixing. In the absence of an external field, the amount of energy transfer is determined by the gain coefficient (I): where 8 is the Bragg angle inside the crystal, X.0 is the vacuum wavelength of light. For negligible depletion of the signal beam, the transmitted signal intensity, I sm is given by: where L is the thickness of the photorefractive crystal and I s(o) is the incident signal intensity. The response time of an elemental grating (for either writing or erasure) is determined by the rate at which space-charge fleld is created or decays. This is proportional to the dielectric relaxation time td = s/4716 of the material, where s is the dielectric constant and a is the conductivity. The grating period (spacing) A is a function of the wavelength of the laser used and the incident angle 4 of the beams, thus: The importance of refractive effect in this work lies with the fact that the photorefractive gratings (An) contain the information about the phase of the writing pulses. This allows one to use photorefractive crystal as a phase-detection tool for self-
77 55 phase modulated pulses through the induced grating autocorrelation, provided that the decay time of the gratings in the medium is long compared with the pulse length of the laser to be measured and with any delays used in the interaction. In this experiment, the author uses semiconductor CdMnTe:V and GaAs:Cr as the photorefractive medium because semiconductor photorefractive materials have the advantage of significantly faster response time, longer recombination time and better sensitivity in both visible and near infrared wavelength regions compared to conventional oxide based materials (such as BaTi03) [ ]. At 1064nm, both CdMnTe:V and GaAs:Cr provide excellent measurement capability. 4.3 IGA Modeling Based on Pure SPM in the Absence of GAD and SRS The basic idea behind IGA is the splitting of a pulse and the interference in a photorefractive medium of the resulting two excitation pulses. The resulting interference fringes may then induce a modulation of the medium's refractive index (i.e. a grating). The modulation is then probed by one of the excitation pulses and the diffracted light is detected. Different geometries of IGA configuration exist [64], but only the two-beam geometry is relevant to this technique. In this section, IGA will be modeled with the assumption that the effective nonlinear interaction during the pulse propagation in the fiber is the self-phase modulation that leads to nonlinear phase shift of the propagating pulse. Through the choice of fiber length and input power, GAD and SRS are neglected. In the two-beam coupling geometry (Figure 4.1), one of the excitation pulses also acts as the probe. A small portion of the probe field gets diffracted into the pump beam and co-propagates with it. It is this diffracted beam that is measured in IGA experiments.
78 56 The detected IGA signal (Wde.) is proportional to the squared magnitude of the electric where Eo is the field amplitude, r p is the pulse width and 4) is the phase. The propagation of the pulse in the fiber can be accurately described by the nonlinear wave equation for the electric field given in Equation (2.15). The solution of the nonlinear wave equation (see Section 2.2 for details) showed that in absence GAD, the pulse propagates though the medium without distortion. This is the underlining principle of the simple theory of SPM [84-85]. Shen and Yang have used this theory [84] to show that when a Gaussian pulse propagates through a nonlinear medium of length z, and undergoes SPM (without GAD), the intensity of the pulse retains its Gaussian form and acquires a time-dependent phase-shift A4 (t) which is also Gaussian in nature. The phase shift can be written as [see Equation (2.21), Section 2.2]: Substitute Equation (4.6) into (4.7) one obtains:
79 This equation can be reduced to the following expression: where In the above equations, Q is the spectral broadening parameter, Doo is the central (angular) frequency of the laser, z is the propagation length in the fiber and x (3) is the third order susceptibility. The quantity coot pq is termed the self-phase modulation strength (SPMS) this defines the magnitude or strength of the self-phase modulation experienced by the propagating pulse in the nonlinear medium and provides a direct measurement of the temporal phase shift imparted on the pulse. From Equations (4.6 & 4.9), the electric field of the self-phase modulated Gaussian pulse can be written as: This can be substituted into Equation (4.5) to obtain the explicit expression for the detected IGA signal (Wad.):
80 58 where the author has introduced a normalized time u = Shp and normalized delay x = tipto p and has normalized the correlation function K(x) such that K(0) = 1. A numerical evaluation of the complicated integral shown in Equation (4.12) generates a theoretical time-domain IGA trace. Simulated traces for different values of worpq are shown in Figures (4.4), ( 4.5) and (4.6).
81 Figure 4.5 Simulated IGA traces for a Gaussian pulse that has been moderately self-phase modulated at two different values of SPMS. 59
82 60
83 61 As the value of the SPMS is increased to 4.72, two-well established sidelobes are formed, symmetrically located on either sides of the central peak. With increasing value of coorpq the number of oscillations (sidelobes) increases accompanied with increased narrowing of the central peak. These oscillations can be explained as follow: The self-phase modulation induces a time dependent phase shift on the pulse, whose magnitude is determined by self-phase modulation strength (a Q) as described above. Delaying one signal by an appropriate amount can force the relative phase delay either to add-up or to cancel, which gives rise to the peaks and valleys (zeros) in the trace. The number of specific delays for which exact cancellation (zero) is observed depends on the magnitude of the SPMS. The width of the central peak of the IGA trace is a measure of the bandwidth of the IGA writing pulse as the bandwidth increases (i.e., by SPM) the narrower the central peak of the IGA trace. Thus the narrowing and oscillations are clear signatures of self-phase modulation on IGA traces. It should be noted that these oscillations do not exist in the presence of significant GVD. This is because GVD imposes non-uniform chirp (frequency shift) on the selfphase modulated pulse. Thus, nonzero delays result in a frequency difference between pulses. This frequency difference leads to a moving (interference) fringe pattern, which washes out the gratings. As a result, no oscillation can form on the wings of the resulting IGA trace. Hence GVD would cause narrowing of IGA traces without the oscillations. Care must therefore be taken when performing IGA experiments to operate within short lengths of fibers where GADS is negligible.
84 Experimental Details and Measurement Procedure for the IGA Technique Laser Source and Pulse Characterization The Laser Source. The laser source consists of a Quantronix made cw (continuous wave)-modelocked Nd:YAG laser model 116. The laser operates at a wavelength of 1064 nm with a modelocked frequency of MHz, which produces pulses every 10-nsec. The Nd:YAG model 116 is a solid state laser. The active lasing material consists of Neodymium-doped yttrium aluminum garnet (YAG) crystal, with chemical formula Y3A15O12. Enclosed in the laser pot with the crystal rod, and parallel to it is a high-pressure Krypton lamp that runs on 30 A power supply. Both the crystal rod and the lamp are surrounded by a cylindrical gold reflector which ensures that most of the energy radiated by the lamp is focused on the rod to provide the optical pumping. 0ptical pumping refers to the excitation of electrons to a higher energy level from which they rapidly relax into the upper level of the lasing transition. In Nd:YAG laser operating at 1064 nm, the upper level has a relatively long life-time (250 ns). Most of the energy in this laser is converted into heat, which is removed through water-cooling. The mode-locking process is achieved with model 352 Quantronix mode-locker. This is an acousto-optic mode-locker acting as a fast optical gate. The mode-locking technique ensures that laser resonator modes will have coherent phase relationship. The proper modulation frequency for the laser to generate pulses that grow to a stable value is given by [131].
85 63 where f, is the modulation frequency, L is the total length of the resonator, c is the speed of light and T is the transit time. The width of the output pulse depends on the number of resonator modes that are phase coherent (mode-locked) or equivalently, the bandwidth of the oscillation. For a Gaussian pulse, the pulsewidth-bandwidth product is given by: Pulse Characterization. IGA experiments require a well-characterized input pulse. This implies that the pulsewidth and the peak power must be precisely known. If the pulsewidth of laser source is known together with the repetition rate, then the peak power can always be determine for any given average power. Thus the pulsewidth of the laser is usually measured before and after a set of IGA measurement. A set of IGA measurements (in this case) consists of about four to five different IGA traces taken successive at different powers. For the pulsewidth measurement, the author uses the wellknown [132] noncollinear, background-free, second harmonic generation autocorrelation (SHGA). The experimental set-up is shown in Figure (4.7).
 is split into two with one beam chopped at a frequency of 2 KHz, to provide a detection reference to a lock-in")
 is varied by mechanically changing the path length transversed by one of the beams using a computer controlled retroreflector/stepper-motor combination.")
86 64 Figure 4.7 Experimental setup for the noncollinear background-free SHG autocorrelation. In the arrangement shown above, the output of the Nd:YAG laser (at 1064-nm, 100 MHz) is split into two with one beam chopped at a frequency of 2 KHz, to provide a detection reference to a lock-in amplifier. One arm is delayed with respect to the other. The delay time (t) is varied by mechanically changing the path length transversed by one of the beams using a computer controlled retroreflector/stepper-motor combination. The two beams are spatially overlapped in an instantaneously responding nonlinear-optical medium, such as a second-harmonic-generation (SHG) crystal (in this case KTP crystal). The SHG crystal produces the detected "signal light" at twice the frequency (half the wavelength) of the input light. With 1064 nm, the autocorrelation signal has wavelength
87 65 of 532 nm. In this case, the detection system consists of Thorlabs amplified (Model PDA5O) photodetector connected to a lock-in amplifier with the reference frequency provided by the chopper. The autocorrelation signal is automatically collected and plotted by the computer using a Labview program with IEEE-488 bus. The detected SHG signal is proportional to the product of the intensities of the two pulses: In practice, because detectors are typically too slow to resolve the beam in time, what is actually measured is the integrated (correlation) function G 2 (S) defined by: which is sometimes written as: where E(t) and E(t-'r) are the electric fields of the two pulses, 1(t) and /(t-t) are their intensities and S is the delay. Equation (4.16) is the so-called second harmonic intensity autocorrelation function. The pulsewidth (Sp ) of the laser is determined from the FWHM (full width at half-maximum) of the SHAG intensity autocorrelation trace (tauro) using the relation:
: A typical SHG autocorrelation trace used to determine the pulsewidth is shown in Figure (4.8). The smooth red curve is a Gaussian curve that fits the data shown by blue square dots.")

88 66 The measured pulsewidth ranges from 50 psec. to 75 psec. The experimental autocorrelation trace is fitted to a Gaussian of the form shown in Equation (4.6): A typical SHG autocorrelation trace used to determine the pulsewidth is shown in Figure (4.8). The smooth red curve is a Gaussian curve that fits the data shown by blue square dots. The fit is excellent, even in the far wings of the pulse. Figure 4.8 Experimental SHG autocorrelation trace fitted to a Gaussian Analysis of Goodness of Fit for the Autocorrelation Trace. In order to establish further evidence that the pulse used in this work is truly Gaussian, the author has carried out a statistical analysis on the goodness of fit. One of the best-known procedures to evaluate how good experimental data fits a theoretical model is to calculate the residual of the fit defined by:
89 67 and evaluate its standard deviation. The smaller the standard deviation of the residual, the closer the data to the model. The residual of the fit in Figure 4.8 has been calculated and the scatter plot shows its distribution about the mean (Figure 4.9). The residual distribution shows that the experimental trace fits excellently to the theoretical Gaussian, including at the wings. The standard deviation (a) of the residual was calculated using the well-known relation: where N is the weighting factor, r ib is the jth residual and r is the mean. The standard deviation has been calculated to be a 4.O X 1O -6 (for a perfect fit, a -4 0)..This justifies the assumption made in the theoretical derivation of the IGA model that the pulses have a Gaussian nature.
90 Experimental Setup for IGA Measurement The experimental set-up for the photorefractive beam coupling technique is shown in Figure A train of pulses (with pulsewidth in the range of picoseconds) are generated by a cw mode-locked Nd:YAG laser operating at 1064 nm wavelength and 1OO MHz repetition rate (described in section ). These pulses are launched into the test fiber by free-space coupling using a 1OX microscope objective focusing lens, mounted on the Newport's model 562 XYZ stage. The test fiber is typically meters long. As the pulses propagated through the fiber (a nonlinear medium) they undergo self-phase modulation. The output pulses from the fiber are split in a modified Michelson interferometer, with one arm of a fixed optical delay and the other delayed by a stepper motor-retroreflector combination. The two beams are focused into a photorefractive Cadmium Manganese Telluride crystal doped with Vanadium (CdMnTe:V) or GaAs:Cr by 15-cm focal length convex lenses at an intersection angle of 20 = 64. The beam geometry follows the standard pump-probe configuration in two wave mixing. One beam designated as the probe beam is mechanically chopped at a frequency of about 2 KHz and the transfer of modulation from the probe to the pump is detected in the path of the pump beam with Thorlabs amplified InGaAs high-speed photodetector (model PDA50) connected to a lock-in amplifier (EGG 1510). The IGA response is determined by measurement of the lock-in amplifier output as a function of delay between the pump and probe beams. The data is collected automatically using a 1EEE488 bus and LJBView software package. Typical experimentally measured IGA traces are shown in Figure (4.11).


91 Figure 4.10 Experimental set-up and beam geometry for the photorefractive beam coupling technique. 69
92 70 As can be seen from the recorded traces, as the input power in the fiber is increased there is increased narrowing of the central peak and increased number of sidelobes. This is expected since increasing the input power implies more SPM and hence increasing cootpq. The dependence of the narrowing and oscillations on the magnitude of worpq has been explained in Section 4.3. The value of worpq is determined for each trace by fitting the experimental data to the IGA model. This will be discussed in the next section. Figure 4.11 Experimental IGA traces at different power levels in 20 m erbium doped fiber.
93 Analysis of IGA Data and n2 Determination In order to extract the nonlinear refractive index from IGA measurements, the experimental data must be fitted to the theoretical model developed in section 4.3. What is actually measured in IGA is modeled after Equation (4.5) whose full expression is given in Equation (4.12). By numerically evaluating this integral and fitting the resultant trace to the experimental data, one obtains the exact value of the self-phase modulation strength (cootpq) for the given input power. As an illustration, Figure (4.12) shows the two experimental traces fitted to the model with the resulting co otpq values.
94 72 The process of calculating the nonlinear index (n2) from the data involves the use of a direct relationship between the average power, n 2 and cootpq. This relationship will be derive in the following analysis. The self phase modulation strength can be expressed as [56,57]: where Eon is the peak electric field amplitude, n2 is the nonlinear refractive index, L is the length of the fiber, coo is the angular frequency [coo = (27cc)/X0], and c is the speed of light. The peak electric field amplitude E0 can be deduced from power measurements and the effective cross-sectional area (Jeffs) for the mode propagation in the fiber. The relationship is given (in cgs units) by [10]: If /peak denotes the peak intensity [peak power per unit area] averaged over the optical period, then for a Gaussian pulse one can write: where Pan. is the average power, tm is the laser repetition rate, Sp is the laser pulsewidth and the rest have their usual meanings as earlier defined. One can replace (PpealdJeff) in Equation (4.21) by Speak as given in Equation (4.22) and substitute the entire expression into Equation (4.20) to obtain the following result This equation can be written in a more compact form thus:
95 73 The parameters appearing in Equation (4.25) are usually known, so that Equation (4.24) can be used to calculate n2/a eff or n2 (if A Jeff is known). In this technique, it is a good practice (for improving the accuracy of measurement) to measure a series of IGA traces at different powers and plot the resulting w otpq versus the average powers as determined from power meter readings after correcting for losses in the focusing optics. The slope of the linear plot can then be used in Equation (4.24) to calculate n2/j eff. This reduces the uncertainties due to the power and pulsewidth measurements. It should be noted that the n2 calculated from the above equation is in units of esu (electrostatic units). It is common to quote n2 in units of cm 2IW, where n2[cm 2IW] = (n2[esu])/
96 CHAPTER 5 MEASUREMENT OF THE NONLINEAR REFRACTIVE INDEX OF Er-Al-Ge DOPED SINGLE MODE FIBERS AS A FUNCTION OF THE DOPING PROFILES, USING THE IGA TECHNIQUE 5.1 Introduction Why Measuring the Nonlinear Refractive Index in Er-Al-Ge Doped Fibers? The recent increase in the use of Erbium-Doped Fibers for optical amplification in long haul optical transmission systems has given rise to an overwhelming interest in the study of the optical properties of such fibers [ ]. Erbium doped fibers are used in modules known as erbium-doped fiber amplifiers (EDFAs) which have rapidly replaced electronic repeaters in transoceanic cable networks [ ]. The use of EDFAs permits direct amplification of optical signals without the optical-to-electrical-to-optical conversions associated with electronic repeaters. Optical amplifiers amplify incident light through stimulated emission, the same mechanism used by lasers. Its main ingredient is the optical gain realized when the amplifier is pumped (optically) to achieve population inversion. The two commonly pumping wavelengths for EDFAs are 980 nm and 1480 Om. These erbium ions absorb light at 980 or 1480 nm and store this energy to amplify signals at wavelengths near 155O nm. Figure (5.1) shows typical absorption and gain profiles for an erbium-doped silica fibers [138]. The key success to erbium is the fact that the amplification band coincides with the minimum loss wavelength of optical fibers [139]. Figure (5.2) shows the variation of fiber loss with wavelength. 74
97 75
98 76 There are two main mechanisms for losses in optical fibers radiative losses and absorption losses. The radiative losses are due primarily to Rayleigh scattering, which is caused by small scale (small compared to the wavelength of the light wave) inhomogeneties in the fiber. As a result, a guided mode can sometimes get coupled to a radiation mode. Rayleigh scattering is proportional to X"4 and thus falls rapidly with increase in wavelength. At pm, the value is approximately ldb/.km and at 1.55 pm it is about 0.15 db/km, which represents the ultimate loss limit of optical fibers. On the other hand, the absorption loss arises from the interaction of the propagating wave with the major components of glass that constitute the fiber, such as the infrared absorption band of Si02 and also due to the presence of the OH ions in the fiber. Another success of erbium as an amplifying dopant is that the energy level structure of Er3 ions in silica host is such that all transitions are nonradiative except the last transition between the 4113/2 and 4115/2, which is almost 100% radiative. The lifetime of the 41 13/2 is also very long ( 10 ms) [134]. This long lifetime permits the inversion of the population between the 4113/2 and 4115/2 with a relatively weak and practical pump source. A simplified energy level diagram of Er3 is shown in Figure 5.3. A three level model can be used for the 980 nm pumps, while a two-level model usually suffices for the 1480 nm pumping [133,134].
99 Figure 5.3 Energy level diagram of erbium ions in a silica matrix. Population inversion between 41 13/2 and 4115/2 levels leads to amplification in the 1.55 lam band [139]. In spite of the numerous research work done on the optical properties of erbium doped fibers and EDFAs [ ], the nonlinear index of refraction remains the least studied parameter in this class of fibers. Yet this single parameter (n2) controls the majority of the nonlinear optical effects that have relevant impacts on optically amplified signals. The nonlinear index has been studied extensively in other types of (non-erbium doped) silica fibers using different measurement techniques [13, 15, 54-59, ] but only few reports are available [ , 145] on n2 measurements in erbium-doped fibers. The situation is further worsened by the fact that some of the few available reports dwelled on the measurement of absorption-enhanced nonlinearity [137, 145] rather than the Kerr nonlinearity. The absorption enhanced nonlinearity in erbium-doped fibers are based on the principle that the refractive index of a material depends on the
100 78 electronic population distribution between energy levels and this dependence is enhanced near an electronic absorption transition [ ]. By applying an optical pump, the population distribution can be modified, which results in a change in refractive index. This is similar to the mechanism responsible for optical nonlinearity present in semiconductors [149]. This type of nonlinearity has been investigated in erbium-doped fibers primarily for switching applications [137, ]. On the other hand, the only known report that considered Kerr nonlinearity in erbium-doped fibers merely estimated [136] n2 value based on known result for pure silica fibers. In order to accurately predict and improve the performance of optical transmission systems, it is important for system designers to know the numerical values of n2 (due to Kerr effect) for all types of fibers used especially the optical amplifiers. Therefore, an accurate measurement of n2 in erbium-doped fibers has become ever more crucial. As a contribution towards this (part of which is contained in this thesis), the author in collaboration with other workers has recently reported [66] an accurate measurement of n2 (due to Kerr nonlinearity) in erbium-doped fibers and found that the value of n2 is higher in erbium-doped fiber than in pure silica fiber. A systematic study of how n2 would vary with erbium concentration still remains open. This open question would also be answered in this chapter. In addition, present-day telecommunication fibers (including erbium-doped fibers and EDFAs) are doped with varying amounts of aluminum, germanium or phosphorus to modify the structural and transmission properties of the fibers. These dopants (for example GeOC and P2O5) are particularly used to increase the linear refractive index of the fiber core above that of the cladding to provide
101 79 a better guiding structure. Mostly, Al203 is used to enhance the solubility of rare-earth dopants and to suppress excited state absorption in EDFAs [134,1501 In a recent report, Boskovic et 'al and Kato et' al have independently measured n2 in germania and fluoride co-doped silica fibers and showed that while fluoride reduced n2, germania did increase n2 of the fibers. In this chapter, the author has used the IGA technique to measure n2 of several Er-Al-Ge doped single mode fibers and investigated the dependence of n2jaeff on the doping profiles of the three dopants. This appears to be the first known systematic study of n2 as a function of the dopant contents in erbiumdoped fibers. The result would provide system designers with a better understanding of the nonlinear properties of erbium-doped fibers, needed for a more accurate design and evaluation of EDFAs TrueWave Rs and Dispersion Compensating Fiber (DCF) The TrueWave Rs fiber is one of the special new-generation transmission fibers developed by Lucent Technologies in 1998 [1561 An important characteristic of this fiber is that the dispersion slope (the rate of change of dispersion with wavelength) is very small, hence the name "reduced slope". Because of this reduced slope, it is used for extending high-powered long distance networks for operation in both the third and forth communication windows. This fiber is also called Non-zero dispersion fiber (NZDF) and it has zero dispersion around 1450 nm.

![The Raman gain efficiency in this fiber has recently been measured by Bromage [157]. Research on other nonlinear optical properties of this fiber (especially n2 measurement) is relatively unexplored.](/docs-images/74/71432597/images/102-2.jpg "Thus, this measurement will serve to provide the much-needed data on the nonlinear index coefficient of this fiber.")
102 80 Figure 5.4 shows the dispersion slope of the TrueWave Rs fiber in comparison to other standard telecommunication fibers. Because of the overwhelming choice of this fiber over other standard transmission fibers, it is very important that its nonlinearity be characterized. The Raman gain efficiency in this fiber has recently been measured by Bromage [157]. Research on other nonlinear optical properties of this fiber (especially n2 measurement) is relatively unexplored. Thus, this measurement will serve to provide the much-needed data on the nonlinear index coefficient of this fiber. Also of equal importance is the measurement of n2 in DCF (dispersion compensating fiber). The DCFs are fibers specially designed to compensate for dispersion in the transmission fiber lines. For example, a DCF can be designed to have large "normal dispersion" D ~ -100 ps/km-nm in the region in which standard transmission fibers have anomalous dispersion (D ~ 16 ps/km-nm). A small length of DCF can then be inserted along the line to compensate for dispersion incurred by the
103 81 optical pulse in propagating through about 8-10 km of transmission distance. Generally DCF has relatively small core diameter, and this increases the intensity of the information bearing lightwave in the DCF core, which increases nonlinear interactions. Therefore, the understanding the nonlinear properties of DCF has always been a crucial issue. This investigation is expected to provide useful data that will help in this understanding. 5.2 Experimental Details Fiber Properties Effective Area and Mode-field Diameter Measurements Nine different fiber types were investigated. These include a polarization maintaining (PM) silica core fiber with no dopants, True-Wave fiber, DCF, and six other Erbium doped fibers with varying amounts of Ge02 and Al203 content. This measurement will investigate how the nonlinear coefficient changes as a function of the dopants' contents in these fibers. Fiber properties are listed in (Table 5.1). The effective area and mode field diameter (MFD) of the fibers were determined through the transmitted near-filed scanning technique. The measurement was done using EXFO high-resolution optical fiber analyzer, model NR-9200 at 1314 nm and 1552 nm. The fiber effective area is defined from the near-field intensity distribution by [ ]: where Ea(r) is the amplitude and /(r) is the near-field intensity distribution of the fundamental mode, r being the radial distance from the center of the mode profile. The modified diameter is defined in the near field by [151, 153]
104 82 In conventional step-index fibers, the mode-field diameter is well approximated by a Gaussian function of radius w at 1/e amplitude points. In this case, the effective area may be given by where 2w(A,) is the so-called "Peterman-II mode-field diameter" of the fiber at wavelength X. For fibers that do not share the step-index geometry, such as dispersion shifted fibers and dispersion flattened fibers, the mode-field cannot be approximated by a Gaussian function, and Equation (5.3) no longer holds. It has been proposed [154] that the effective area of various types of standard fibers can be calculated using Equation (5.3) but including a correction factor Na m, that depends on wavelength and type of fiber. This has led to the so called "Namihira relation", given by: The refractive index proflle was measured through the refractive near field (RNF) [155] scanning at 673 nm. The measured refractive index profiles for six of the fibers are shown in Figures (5.5) through (5.7). The core-cladding refractive index difference (An) is obtained from the plotted index profile and can also be estimated from the germania concentration in the fiber (see appendix B). The delta parameter (A), defined as the relative refractive index difference between the core index and the cladding index is given as:
105 83


106 84


107 Figure 5.6 Measured refractive index profiles for two Er-Al-Ge doped fibers with different dopant contents. 85


108 Figure 5.7 Measured refractive index profiles for two fiber with different doping profiles. 86
109 Measurement of n2 using IGA The IGA measurements were taken on the fibers listed in Table 5.1. The experimental set up was arranged in the usual form described in Chapter 4 (Figure 4.10). The experiments were carried out on the fibers one at a time. The laser pulses (with pulsewidths picoseconds) were coupled into the test fiber using 10X microscope objective. The average power coupled into the fiber ranged from 20 mw to 800 mw, depending on the fiber effective area and the level of SPM desired.. In each case, these pulses undergo self-phase modulation as they propagate through the fiber. The IGA traces of the out pulses from the fiber were recorded at different power inputs by following the procedure described in Chapter 4, Section In measuring the power, attention was paid to the losses encountered within the focusing optics and these were corrected for. Losses within the fibers were negligible because with L ~ 20 m, Leff ~ 19.9 m. Therefore, Leff L for L 20 m, where L is the experimental fiber length and Leff is the effective length. 5.3 Results and Analysis The IGA traces obtained from the above measurements were fitted to the pure SPM model (Equation 4.12) as described in Chapter 4. In order to obtain the nonlinear coefficient (n2hkeff) for each fiber, several traces are fitted, and the resulting SPM strength is plotted as a function of the average power. The slope of the linear fit to the graph is proportional to n2hkeff. Typical fitted traces and the linear graphs are shown in Figures (5.8) through (5.16). The resulting n2hkeff as a function of dopant contents are given in Table 5.2.

110 88

111 89

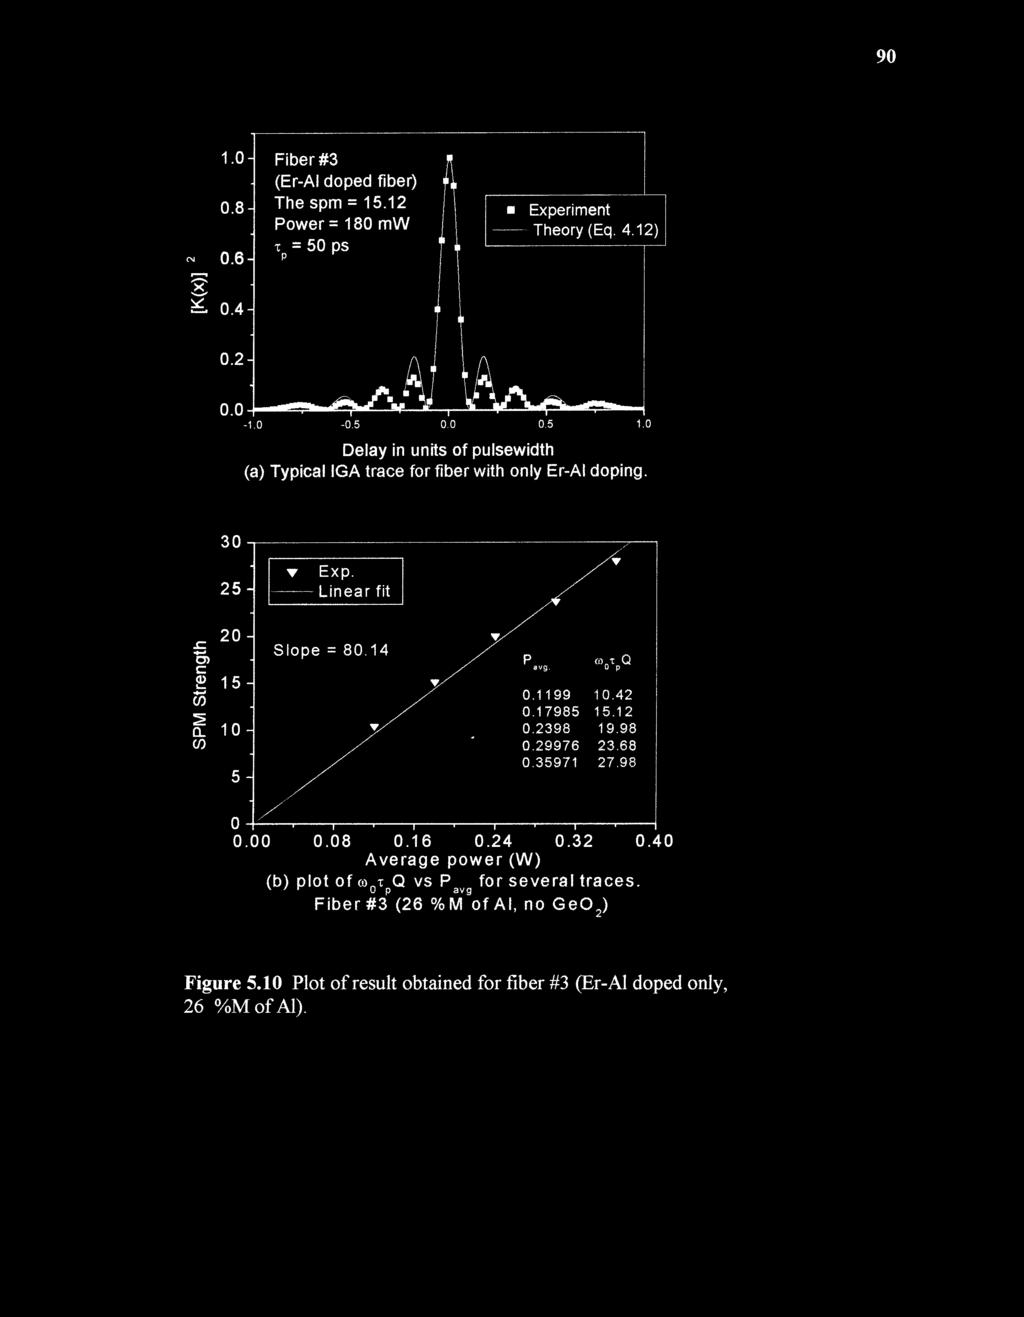
112 90
113 Discussion of Result and Comparison with Published Results The measured n2hkeff and n 2 values in this work are given in Table 5.2. The nonlinear coefficient (n2hkeff) in the Er-Al-Ge is found to increase with germanium content as well as with the Jluminum and erbium. An earlier calculation of n2 from the measured nonlinear coefficient (n2hkeff) using the Jeff at 1.55 for the Er-Al-Ge doped fibers and Jeffs at 1064 nm for the pure silica indicated that n2 in erbium (only) doped fiber was higher than n2 in the pure silica. This analysis was done with the feeling that the mode field diameter (used to calculate the effective area) does not vary significantly with wavelength. The analysis also showed that n2 in the Er-Al-Ge doped fibers, increased more with Ge02 content and only slightly with Al and Er concentration in the fiber (6th column in Table 5.2). It was later found (see Appendix D) that indeed, both MFD and J eff vary significantly with wavelength. This was noted after the author has made MFD and A Aeff measurements at 1552 nm and 1314 nm and compared the results. For example, the J effs for the pure silica at 1552 nm was found to be utm2 and at 1314 nm the value reduced to pm2, while the value at 1064 nm (obtained from Roger Stolen [164]) was 5O p.m. This huge variation (and sometimes more) was also observed in all the fibers measured. It therefore became necessary to evaluate n2 with the J eff at the same wavelength of measurement (1064 nm). In the absence of the equipment for measuring MFD and Jeffs at 1064 nm, and lack of readily available scaling equation, the author has used the measured values at 1314 nm and 1552 nm to extrapolate the value at 1064 nm (see Appendix D). In doing this, the pure silica fiber whose value is known at these three wavelengths was used as a yardstick for determining the slope of the extrapolation.


114 92


115 93


116 94
117 95 The last column of Table 5.2 shows the result of n2 obtained using J effs at 1064 nm. Contrary to expectations, it is seen that n2 of the silica is higher that of the erbium (only) doped fibers and in the Er-Al-Ge doped fibers with little Ge02. Nevertheless, in the Er-Al-Ge doped fibers where the germania concentration is high (rows 5 and 7), the n2 is significantly higher than in pure silica, as expected. The n2 in the DCF (dispersion shifted fiber) in row 8 of Table (5.2) is also higher than in pure silica. These are consistent with earlier reports [52,57]. However, since one expects n2 to be higher in the erbium (only) doped fiber and in the E-A1-Ge doped fibers with low Ge02 content than in pure silica, the observed contrary raises some questions on the actual role of erbium in the n2 of the fiber. If erbium reduces the n2 of the fiber, this could upset the slight increase due to the Ge02 and Jl in the Er-Al-Ge with low Ge02 content, thus leading to a smaller net value than expected. It is also possible that this reduction in the value of n 2 in the erbium (only) doped fiber and in the E-A1-Ge may have arisen due to polarization effect. The silica core fiber is a polarization maintaining fiber, while all the doped fibers are non-polarization maintaining fibers. The value of n2 is usually higher if polarization is maintained and lower if polarization is scrambled. Although, it is usually assumed in IGA experiments that polarization scrambling is not effective, because the fiber length is short, this may not generally hold in the actual experiments. With this observation, it may be necessary to investigate the role of polarization in IGA experiment for n2 measurements. The major source of uncertainties in this work is the effective area measurement. The effective area used at 1064 nm were estimated (as explained in Appendix C) based


118 96 on the measurements done at other wavelengths. An additional source of uncertainty is the laser amplitude fluctuation of the Nd:YAG (typically 2-4%), which is translated into
119 97 fluctuations in the average power. This is minimized by averaging the results of several measurements, through a plot of a linear graph of SPM strength Vs average power, and using the slope to calculate n2. The error in the slope is typically less than 2%. Table 5.3 shows some reported values of n2 measurements in different fiber, using obtained with the IGA technique is in good agreement within 5% with earlier measurement cm2iw) using SPM in the same fiber [164, 66]. The IGA measured value for the DCF is also in good agreement with the published results for the DCFs shown in Table (5.3).


120 98

121 99

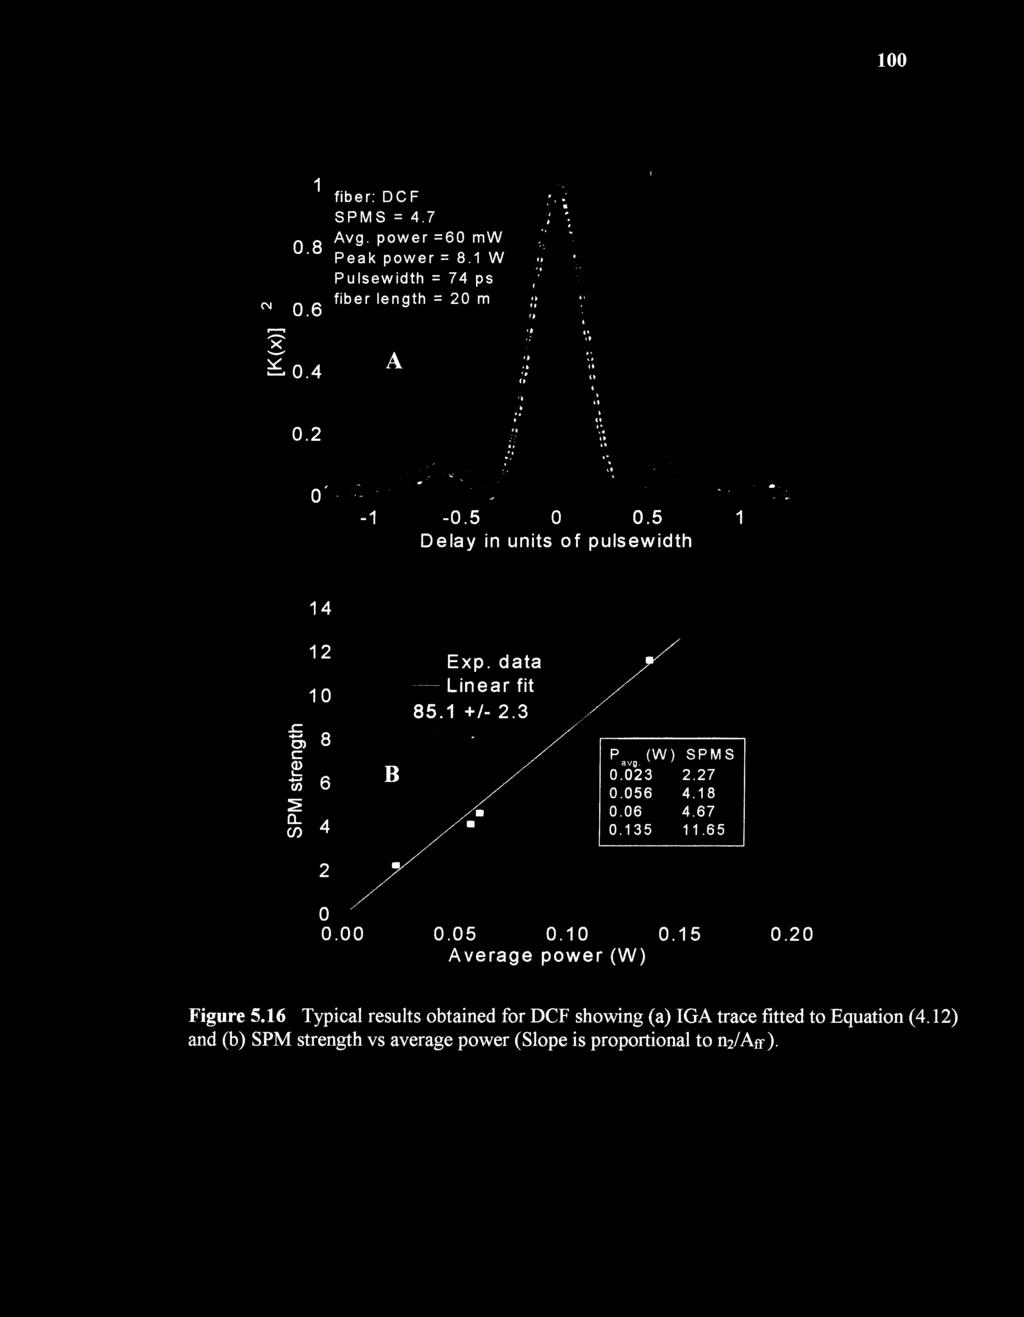
122 100
123 CHAPTER 6 MEASUREMENT OF THE RAMAN GAIN COEFFICIENT IN OPTICAL FIBERS USING INDUCED GRATING AUTOCORRELATION: THEORY AND EXPERIMENT 6.1 Introduction One of the most important nonlinear effects in optical fibers that greatly influence optical communications is stimulated Raman scattering. While this phenomenon is known to cause noise and cross-talk in optically amplified transmission systems [12], it is equally the "key" process that drive the newly emerging Raman fiber amplifiers and Raman fiber lasers [41-44]. The efficiency of performance of these systems depends on the stimulated Raman gain through the SRS process. Raman gain is proportional to the Raman gain coefficient, which is specific to the fiber material among other factors; such as pump wavelength, effective core area and fiber length. Different experimental techniques have been used to measure the Raman gain coefficient in optical fiber [ ]. The use of IGA technique to measure the Raman gain coefficient is a new development, which is part of the investigations embodied in this thesis. The incentive to this stemmed from a recent observation made by the author [70] while performing experiments on n2 measurements in Er-Al-Ge doped single mode fiber with high germania content. It was observed that the IGA trace was distorted in a fiber with high germania doping, even at moderate power inputs, and the resulting trace deviated significantly from the theoretical fit modeled in the context of pure SPM (see Chapter 4). This observation resulted in the subsequent modification of the original IGA model and its subsequent application in the measurement of Raman gain coefficient of fibers. These investigations are reported in this chapter. 101
, the result obtained from high germania")
 assumes that there is no GAD within the typically-used 20 m long fibers, and that there is no contribution to the nonlinearity from SRS and XPM.")
124 Observation of Distortion of IGA Trace by Stimulated Raman Scattering and Initial Breakdown of the Standard IGA Model Based on Pure SPM The Observed Deviation and Possible Cause(s) While the author has obtained an excellent agreement between theory and experiment for IGA measurements on Er-Al-Ge fibers with low germania contents (0 13 %M), the result obtained from high germania doped ( >28 %M) specie showed clear deviations from the standard IGA model. The standard IGA model (see chapter 4) assumes that there is no GAD within the typically-used 20 m long fibers, and that there is no contribution to the nonlinearity from SRS and XPM. The observed deviation is characterized by the lifting of the base region of the central peak of the IGA trace and outward shifting of the sidelobes. There is also a gradual depletion of the sidelobes (see Figure 6.1).
125 103 To investigate this observation further and in attempts to nail down the cause of this deviation, the author has systematically performed IGA measurements in two wellcharacterized fibers: (a) silica core fiber [164 (of lengths 20 m & 100 m), and (b) a DCF (dispersion compensating fiber) [165, whose Raman proprieties have been previously studied [157, 163]. IGA measurement performed on the 20 m long silica core fiber from low (< 20 W peak power) to high (>70 W peak power) showed no deviation. With the 100 m long fiber, GAD is negligible because this is still far below the dispersion length of silica fiber. However, fiber loss may not be neglected. Thus, with a loss of 1.2 db/km (at pm), the effective length (see Equation 2.29) was calculated to be m. Normal IGA trace that fit the standard pure SPM model were obtained with this fiber at moderate powers but at high power (typically 40 W), deviations were observed similar to the case of high germania fibers. The IGA traces measured in the DCF also showed good fit with the standard IGJ model at low powers but deviated as the power was increased. Although, DCF fibers are known to have high negative dispersion [105], the occurrence of normal IGA traces (with sidelobes) at low powers has ruled out the effect of dispersion, so that one is safely working in the limit of zero GAD. In the presence of dispersion, IGA does not exhibit sidelobes [63-64]. Since this deviation appears to be intensity dependent, it must be associated with additional nonlinear process. The other commonly encountered nonlinear processes (apart from SPM) for a single propagating pulse in optical fiber, are stimulated Brillouin scattering (SBS), stimulated Raman scattering (SRS), intra-pulse Raman scattering, selfsteepening and two-photon absorption. Some of these processes and the conditions under which they are observed have been explained in details in Chapter 2 of this thesis.
126 104 The SBS is known to occur in optical fiber only for cw (continuous wave) beams and for pulses with pulsewidth in the range of nanoseconds and higher [20]. As a result SBS is not a possible suspect, since these experiments were done with short pulses ( 50 to 70 picoseconds). Stimulated Raman scattering is a prime suspect because it is usually effective in both long and short pulses if the appropriated threshold is reached (see Chapter 2, Section 2.5). In addition germania doping is known to increase the Raman gain coefficient in silica fibers [163]. On the other hand, intra-pulse Raman scattering is a process where the Raman gain amplifies the lower frequency component of a pulse by transferring energy to it from the high frequency component of the same pulse. As a result, the pulse spectrum shifts toward the low frequency side as the pulse propagates. This is sometimes referred to as self-frequency shift [166]. However, this phenomenon occurs for ultra-short pulses, with pulsewidth less than 1 picosecond [166]. Thus, because of the fact that the pulses used here are far from this range, the process has to be ruled out. Self-steepening is also another phenomena that occur with ultra-short pulses (< 1 psec) and arises from the intensity dependence of group velocity. In this case, the center of the pulse (which is more intense) moves at a lower speed than the wings. Therefore as the pulse propagate through the fiber, it becomes asymmetric with its peak shifting toward the trailing edge. As a result, the trailing edge becomes steeper and steeper with increasing propagation distance and eventually this leads to the formation of an optical shock [20]. Since the pulsewidth used here is much longer than that for which self-steepening occurs, it is not expected to contribute to the above-observed deviation.
127 105 Two-photon absorption has been previously explained in Chapter 2. This effect is automatically ruled out when one considers the long wavelength of the laser used in this work. The band-gap of silica is about 8.3 ev, while the photon energy at 1064 nm is only about 2 ev. With the exclusion of all the nonlinear effects listed above except SRS, one needs to examine the spectrum, since the Raman has a characteristic frequency shift. Bromage et al [163] has shown that the Raman spectrum of Ge02 and Si02 sufficiently overlap in a germania doped silica fiber and exhibits a peak value at about 430 cm"1. On the same scale, the peak for pure silica fiber (containing no Ge02), is shown ( Figure 6.2A) to occur at about 445 cm1 [163]. This is not surprising, since in the bulk, GeOC and Si02 are known to exhibit Raman peak values at 420 cm -1 and 440 cm"1 respectively [98]. In silica fibers, the Raman gain increases with increase in germania concentration [97,163]. This is because it reduces the effective core area of the fiber thereby increasing the pump intensity in the core. Secondly it increases the Raman gain coefficient. The Raman gain coefficient of Ge02 is about one order of magnitude higher than that of Si02 [168]. In a recent experiment, Torres et al [167] has obtain very high Raman conversion with only 6 meters length of high Ge02 doped (-20 %M) silica fiber, using 120 ps pulses from modelocked Nd:YAG laser operating at 1064 nm(82.5 MHz repetition rate). The Raman peak of Si02 were indistinguishable, and appeared at 1117 nm, corresponding to a shift of about 53 nm from the 1064 nm pump, as expected (see Figure 6.2B).
128 106
129 Measurement of the Pulse Spectrum and Further Evidence of the Role of SRS The output spectra from different fiber samples were measured using an optical spectrum analyzer (Advantest model Q83 81A) with 0.1 nm resolution and also with a McPherson (0.06 nm resolution) spectrometer (model 207). The auxiliary detection system for the spectrometer includes a Judson Technologies' J16 germanium photodiode, coupled to a lock-in amplifier. Typical measured spectra for pure silica core fiber and high germania doped fibers are shown in Figures 6.3 and 6.4. From the spectra, it was noted that the fiber with high germania content revealed a significant conversion of the pump (1064 nm) into stokes pulse (1117 nm) while the pure silica fiber of the same length (20 m) showed no Raman peak, even at much higher peak power. In the 100 m silica fiber Raman conversion was appreciable at 48 W peak power, but even below this power, the high germania fiber has already produced well-developed second Stokes at 1174 nm. These are indicators that germania enhances stimulated Raman scattering in silica fibers and that the observed distortion on the IGA trace results from the influence of SRS on the pulse. The reduction in the core size of the Ge02 doped fiber helps it to develop high power density in the core, which favors the SRS process. In addition Ge02 increasing the Raman gain coefficient of the fiber [98].
130 108
131 Figure 6.4 Spectrum of the out put pulse from pure silica fiber, containing no germania. 20 m and 100 m were examined. 109
132 Raman Gain Coefficient of Highly Ge02 Doped Fibers The Raman gain coefficient of a high germania doped silica fiber can be predicted from a knowledge of the germania concentration in the fiber. The Raman gain in a germania doped fiber is shown to depend on the relative index difference between the core and the fiber cladding [97]. The core-cladding relative refractive index is proportional to the Ge02 contents. The Raman gain coefficient can be expressed as [98,167] where is the pump wavelength, measured in p.m, and A is the relative refractive index between the core and the cladding. Thus the Raman gain also scales inversely with wavelength. The above equation assumes that polarization is maintained in the fiber in the fiber. If the polarization is completely scrambled (as seen in long non-polarization preserving fibers), the Raman gain decreases by a factor of 2. One can now estimate the Raman gain coefficient of the two high germania doped fibers listed in Table 6.1, which gave the enhanced SRS signal in the spectrum. For fiber #6B, with An = 0.041, A,', Taking X, = gm, the Raman gain coefficient is calculated from Equation (6.1) to be gr = 2.83 x 10"llcm/W. For the other fiber #6C, An = and A N The calculated Raman gain coefficient is gr = 2.98 x cmiw. The calculated values of gr in these fibers suggest that the Raman gain coefficient in the two high germania doped fibers are about three times higher than the valued for pure silica - the value of gr reported by Lin et al [96] for silica fiber is 0.92 x 10 "11 cm/w. Such high values of gr in the doped fibers are expected, since Ge02 has high Raman gain coefficient, about an order of magnitude higher that Si02 [168]. In the next section,
133 111 the IGA technique will be modified and used to measure the gain coefficient in these fibers to confirm the above-predicted results. 6.3 Modification of the IGA Model and Measurement of Raman Gain Coefficient in Optical Fiber Using IGA Modification of IGA Model in the Undepleted Pump Approximation Through the Analytical Solution of the Coupled Nonlinear Schrodinger Equation One way to take into account the effect of SRS in pulse propagation in optical fibers is to solve the coupled nonlinear Schroedinger equation (NLSE), which is typically written for the pump and the Stokes pulses as simultaneous, coupled-amplitude differential equation. In the absence of SRS (when only the SPM is the sole nonlinear process in the fibers), the simple NLSE suitable for describing picosecond pulses can be written as [20]: where A = A(z,t) is the envelope of the electric field, 13 1 is the group velocity dispersion term W I = 1/vg vg is the group velocity ), 132 is the dispersion parameter{ = di31/do In the literature, D is sometimes used [22] in place of 02 and the two are related by: where D is measured in psl(km-nm) and 132 is in ps 2/km, y is the nonlinear coefficient (y = n2coo/cjeff), and a represents the fiber losses. In principle, the NLSE can be derived from the wave equation, but this derivation will be omitted. Such derivation has been treated in details elsewhere [20]. It should be noted that the NLSE is (conventionally) written for the pulse envelope. The electric field, E(z,t) of an optical pulse is related to the pulse envelope A(z,t) by the following expression [20, 105]:
134 where expi(oot kor) is the phase term and F(x,y) represents the spatial modal distribution (which is unimportant in this case, since single mode fibers have a confined mode). Therefore, for the analysis here, one can assume that for single mode flbers, A(z,t) E(z,t). It is sometimes more convenient to write the Schrodinger equation with the time measured in a frame of reference moving with the pulse at group velocity v g (this is called the retarded frame) by making the following transformation: Equation (6.1) therefore reduces to: representing the pump and Stokes respectively) is the slowly varying amplitude of the pulse envelope; ye = n20ojicjeff is the nonlinear parameter; /32j is the dispersion parameter and fa represents the fractional contribution of the delayed Raman response to the nonlinear polarization [20]. Typically, fa is about 0.18 [20,53, ]. The nonlinear parameter yid and the Raman gain coefficient gj for the pump and Stokes are related through the wavelengths as follow:
135 1,11. The walk-off parameter d is introduced to account for the group velocity mismatch between the pump and the Raman pulses (d=11vgp l/vgs). One can define a walk-off length (L,,) as the distance in which the Stokes pulse passes through one pump pulsewidth. This is effectively the distance over which the pump and the Stokes pulses overlap. This distance can be given in terms of the walk-off parameter (d) and the pump pulsewidth (Cps) and as follow: The walk-off length depends on both the pulsewidth and the wavelength of the laser as well as the relative refractive (A) difference between the fiber core and the cladding. Typically, L, ~ 6 m in silica fibers at 532 nm for a pump pulse of width 36 Cps [30] while at 1064 nm, the author has calculated L W to be 38 ps in silica fibers for a 5O Cps pump pulse. For typically high Ge02 doped flber (with A ~ 0.025), L W ~ 20 m at 1064 nm for 5O Cps pulses, since the d = 2.5 ps/m for such a flber [167]. One can further introduce The Raman gain length (LG) which represents the length scale over which the Raman gain becomes important. This length can also be given in terms of the pump peak power and its Raman gain coefficient g p [actually, gp looks like "pump depletion coefficient" since its sign in Equation (6.6) is negative] and it predicts accurately how energy is transferred to the Stokes.
136 114 The solution to Equation (6.6) is generally obtained by numerical procedures, but analytical solution is also possible by making some few approximations [169]. Analytical solution is advantageous because it allows one have an expression for the pulse envelope, which can be fitted directly to the experimental data. The author has used the undepleted pump approximation to obtain the analytical solution to Equation (6.6) by following the framework developed in [20] and elsewhere [169]. First, one neglects GAD (/62p = = 0) and fiber loss (ap = as = 0). This assumption is justified in the present circumstance due to the short lengths of fibers typically used in IGA experiments. Equation (6.6) therefore simplifies to: Second, one makes further simplification by assuming that the Stokes' amplitude is small compared with the pump such that undepleted pump approximation). Thus all terms containing I AsI 2 in Equation (6.12) can be dropped, so that we have
137 115 The Stokes pulse changes both its shape and spectrum as it propagates. The change in shape (temporal change) results from the Raman gain, while the spectral change results from the cross-phase modulation. Because of pulse walk-off, the extent of these changes would depend on the overlap factor w(z,t), which takes into account the relative separation between the pump and the Raman pulses along the fiber. This overlap factor depends on the shape of the pulse [20] and thus the integral given in Equation (6.15) needs to be evaluated for a given pulse shape. For the particular case of a Gaussian pump pulse of the form used in this work: has introduced the normalized time t = Bhp and normalized propagation distance 45 = zditp, d being the walk-off parameter (in units of pslm). At this point, it of interest to examine what happens in the photorefractive crystal with the presence of the pump and the Raman pulses. In the present analysis, one
 and the Stokes (1117 nm) pulses, If one designates the amplitudes of the pump and Stokes parts of the signal beam by A l")

138 116 considers the interference of four beams in the photorefractive crystal in the geometry shown in below (Figure 6.5). This is because each arm of the two arriving beams contains the pump (1064 nm) and the Stokes (1117 nm) pulses, If one designates the amplitudes of the pump and Stokes parts of the signal beam by A l and AC respectively, while the pump and Raman part of the probe beam are designated A3 and A4. The above configuration is similar to four-wave mixing and can be analyzed within that context. The general problem of fourwave mixing in photorefractive crystal is very complicated because the material response consists of four distinct gratings, namely, one grating due to the interference of beams 1 & 2 with 3 & 4, one grating due to the interference of beams 1 & 3 with 2 & 4, one grating due to the interference of beam 1 with beam 3 and one grating formed from the interference of beam 2 with beam 4. If the phase matching conditions are satisfied:
139 117 then the problem can be simplified by assuming that of all the gratings present in the system, only one grating (in our case the one created by the interference of beams 1 &2 with 3 &4) gives rise to strong beam coupling. This predominance of one grating is common in many practical situations and is due to the direction, polarization, and coherent relationships of the four beams relative to the photorefractive crystal [170]. If one further assumes that the rise time of the grating is fast compared with the pulse length and that the decay time of the grating is long compared with the pulse length and all delays between pulses in the experiment, then it can be shown that the detected IGA signal can be given by the following expression: where t is the delay in units of pulse length and A d and As are the pump and Raman pulses. The first term in this expression is just the contribution from pure SPM while the rest of the terms are contributions from the SRS effects through the Raman gain and cross-phase modulation. The above equation is then numerically integrated and the resulting trace fitted to the experimental data. In doing so, Equations (6.14a) and (6.14b) together with Equation (6.17) are substituted and the fitting parameters are factored from the values in the exponents of these equations. These parameters are for convenience identified in dimensionless quantities and represented by: (a) The self-phase modulation parameter (SPMP) given by:
140 where d is the walk-off parameter and tp is the laser pulsewidth. The first parameter (SPMP) is usually supplied exactly, or guessed approximately from the self-phase modulation strength (SPMS)of an equivalent undistorted IGJ trace. The last two parameters are randomly supplied and the fitting routine returns the appropriate values upon convergence. Typically fitted traces using Equation (6.19) are shown in Figure (6.7).


141 119
142 120 There is excellent agreement between theory and experiment, especially in the region where the Raman conversion is less than 25%. At increased Raman conversion, the distortion is severe and the fit deteriorates (Figure 6.7). This is expected, since the assumption of undepleted pump was made in arriving at the solution. In the expression of Equation (6.21), all the parameters except gm are usually known from the experiment. Thus, in the region where the fit is good, one may use this to estimate the Raman gain coefficient of the fiber. This will be examined in the next section of this chapter. Meanwhile, one can now understand the reason for the lifting and depletion of the IGA sidelobes. The SRS gives rise to two different frequency components, which make their way into the photorefractive crystal. The presence of the two frequencies affects the stability of the photorefractive gratings, since interference of difference frequencies usually leads to a moving interference fringes and dynamic grating [171]. A moving grating usually does not support the formation of sidelobes in IGA. At low Raman conversion, the gratings are partially stable since the Stokes pulses are very weak compared to the pump, and few lobes still get formed. As the strength of the Stokes pulses increase, the potential to transform into moving grating intensifies, and lobes deplete. At sufficiently high enough Raman conversion, the contribution of the Stokes in the interference process becomes sufficient to upset the "semi-stable" interference pattern and the grating becomes completely dynamic. At this stage the IGA sidelobes are expected to be completely washed out. In fact, close to this has been experimentally observed in this work (see Figure 6.8).
143 CND 0.6 x e 0.4 Fiber 7A (silica core fiber) SPMP = 19.1 RG P = WOT = 1.59 Peak power = 46 W Pulsewidth = 77.5 psec. o Exp Theory Time delay in units of pulsewidth Figure 6.7 Measured IGA trace at about 30 % Raman conversion indicating the breakdown of the undepleted pump IGA model. Fiber length 100 m. (silica core), Peak power = 46 W. The same effect was observed in high Ge doped fiber #7C at peak power of < 36 W.
144 6.3.2 Determination of the Raman Gain Coefficient from IGA Data One of the fitting parameters shown in Equation (6.20) contains the Raman gain coefficient. The rest of the quantities lumped together in the dimensionless fitting parameter are usually known from the experimental apparatus, except the Raman gain coefficient. One can therefore estimate Raman gain coefficient (gi) this. Writing the gib, in terms of the other quantities, one obtains:
145 123 Recognizing that the quantity 1A(O.T)1 2 is just the peak power while z is the propagation distance in the fiber, which is the same as the effective length (Leff). This equation can then be written as: where Aff is the effective core area of the fiber. The fitting routine returns RGP, and with the knowledge of the laser parameters, the peak power can be calculated from the average power. Thus gi can be calculated. It is recommended (for improving the accuracy) to take several IGA traces of the same fiber (with the same length) and plot the resulting RGP versus the peak power. The slope can then be used to estimate gr. In such a case It is also possible to estimate the walk-off parameter d from the fit using Equation (6.21). As an initial test, the author has used this technique to determine the gi and d in four different fibers, including two well-characterized fibers. Fiber properties are listed in Table 6.l. Typical IGA traces from some of the measured fibers are shown in Figures 6.6 through The measured gr and d values as determined from the fit are shown in Table 6.2
146 124
147 125
148 126
149 6.3.3 Comparison with Published Results It will be useful at this point to compare the results obtained here with reported values [50,96,157,158,163,167]. In doing this it should be noted that some of these measurements and estimates reported in the literature have been done with different ranges of wavelength. Raman gain coefficient scales inversely with wavelength. For a meaningful comparison, one must scale values measured at other wavelength to 1064 nm, used in this measurement. The scaling equations have been derived by Newbury [160,161] and by Cordina and Fludger [162 ]. In frequency terms, this equation can be written as [161]
150 128 where g+ is the Raman gain, and the plus sign indicates gain on the Stokes side. co d is the pump wavelength, AG) = Do p - ci p is the frequency difference between the pump frequency and the signal (Stokes) frequency co,. The exponent k describes the power law scaling of the Raman gain with pump wavelength and condo is an arbitrary chosen reference pump frequency. This factor k generally ranges from 2 to 4, and have been determined for a host of fibers [161]. Typical values are 2.3 for SM1F-28, and 4.2 for LEJF (large effective area fiber). In terms of pump and Stokes wavelengths, a similar equation can be written [162] where CR is the Raman gain efficiency coefficient of the fiber as a function of the signal wavelength X p, X, is the new pump wavelength. X, is the pump wavelength at which the measurement was taken ands is the scaling coefficient. Therefore, once CR is known at a given wavelength, its value at any wavelength can be determined from Equation (6.26). Values of the scaling coefficient c typically range from 2-5 [162 ]. Its value for "All wave" fiber (silica core) is 2.8 [162] and this can be used for SM-28, since they have similar properties. The Raman gain efficiency CR in units of (Wm)-1 may be approximately related to the Raman gain coefficient in units of miw by multiplying CR by the effective area of the fiber. Table 6.3 shows some reported Raman gain coefficient, which are compared with the measurement done with this technique.
151 Table 6.3 Comparison of the Raman Gain Coefficient Measured in this Work with Publishedvalues. Scaled Values at 1064 nm were Deduced from the Original Wavelength of Measurement Using Equation (6.26) 129
152 130 Js seen from the table, reported values of the Raman gain coefficient vary widely. The variation is due some differences in the fibers, Fibers supplied by different manufactures may have some slight differences in the composition and on the wave-guide structure. Another reason for this variation is polarization effect. The Raman gain coefficient depends on the state of polarization of the pump and the Stokes (signal) and also on the polarization property of the fiber. The value of gi is higher if pump and Stokes have the same polarization state, and if polarization is maintained in the fiber. If polarization is completely scrambled as is the case in long non-polarization preserving fibers, the value of gm can fall as low as half its actual value in polarization maintaining fiber. The highest reported gib is in pure silica in the table is 9.2 x cm/w [ 96] while the least value is 2.1 x cmiw. The value obtained with the IGA technique is 6.13 x cmiw, which is within the accepted range. Jn interesting comparison is the measurement made on the same fiber that has been previously characterized. The accepted value [163] of the Raman gain efficiency of 3.2 (W-km) -1 at 145O nm, which corresponds to gr = x cmiw at 1064 nm was measured in the same DCF used in this work. The value obtained from this work for this fiber is x cm/w. This is in agreement within 4% of the accepted value. The main source of uncertainties in the measurement with this technique is the effective area. The effective area used in the calculations was obtained from interpolation (see Appendix D) from measurements done at other wavelengths (1552 nm nm and 1314 nm). Another possible source of error is the laser amplitude fluctuations, which is translated into fluctuations in the average power. The amplitude fluctuation of the Nd:YAG laser used is between 2-4%. However, this power fluctuation was minimized by averaging.
153 131 For the high germania doped fibers, the calculations using Equation (6.l) predicts that the Raman gain coefficients for the two fibers #6B and #6C should be 2.83 x 10 "11 cm/w and 2.98 x 10 1 cmiw respectively, based on the known germania contents. The IGA technique yielded 2.56 x cm/w and 2.77 x 10 1 cm/w respectively. These are in close agreement with the prediction within 8%. The slight difference arises from experimental uncertainties mentioned above, and perhaps also from polarization effect. The IGA analysis assumed that polarization is maintained in the fiber, which is a reasonable assumption considering the short fiber length used, but this may not generally hold in practice.
154 Numerical Modeling of IGA in the Presence of Pump Depletion One limitation of the analytical solution with the undepleted pump approximation is its failure to predict the IGA traces when the Stokes pulse becomes comparable in strength to the pump (see Figures 6.7 and 6.8). To have an insight into the behavior of the IGA signal in this regime, one has to solve Equation (6.6) numerically. In solving these equations, fiber loss and dispersion have been neglected but all other terms were retained, so that the appropriate equation now becomes: where the parameters have their usual meanings as earlier defined. This equation has been solved numerically, using the split step Fourier algorithm [20], and used to simulate the IGA trace of the output pulse. In the simulation, the Raman gain coefficient of pure silica is assumed (9.2 x cmiw). It is then used as a base value to calculate the Raman gain for a given input power, fiber properties and the SPM strength, with reference to an undistorted IGA trace.. The input power and the Raman gain are then varied until the resulting IGA trace becomes identical to the observed experimental trace. The Raman gain folds at this point are then used to deduce the gain coefficient of the fiber in relative term. Raman gain coefficient five times higher than the gain coefficient for silica fiber was estimated for the high germanium doped fibers.. Typical simulated IGA traces are shown in Figures 6.13 and The simulated traces are in qualitative agreement with the experimental observation. By dropping the
155 133
156 a) Co C Normalized delay (a) experimental IGA trace for Er-Al-Ge doped fibers with 28% germania (at peak power 36 W) Normalized Time Delay (b) Simulation based on the numerical solution of NSE taking into account SPM and SRS' Figure 6.14 Experimental (a) and Numerically Simulated( b) IGA traces at high Raman conversion > 35%.
157 Discussion of the Result of the Numerical Simulation It should be mentioned that the aim of the numerical solution is not to provide a direct fitting process with the experimental data, rather, it is to stimulate IGA traces with known input parameters whose shapes are then compared with the experimental IGA trace to establish a qualitative agreement with the observed trend. Such numerical simulation method has been used by Weiner et al [172] to study the influence of stimulated Raman scattering on optical pulse compression and by Genty et al [175] to investigate spectral modulation due to pulse reshaping in photonic crystal fibers. In all of the above cases, important parameters concerning the experiments have been deduced by comparing the simulated spectra with the experimental data without necessarily performing a fit. The numerical simulation predicted Raman gain coefficient five times higher than in pure silica for the highly doped germania fibers. If the value of gp for pure silica fiber is take as 9.2 x 1042 cmiw, the actual value for gib predicted is 4.6 xl0-11 cmiw. This is about 35% higher than the value obtained from calculations (2.98 x cm!w), using the refractive index difference in one of the highly germania doped fibers and about 40% higher than the measured value of 2.77 x cmiw. This increase in the result obtained from the numerical approach may be associated with the condition of pump depletion assumed in the numerical simulations. The inclusion of pump depletion increases the contribution of cross-phase between the pump and the Stokes. This implies increased nonlinear interaction, including the Raman gain. It is therefore not too surprising that the simulation over estimates the Raman gain coefficient. Added to this is the fact that linear polarization of the optical field was assumed to be maintained in the simulation, which may not necessarily be the case in the actual experiment.
158 136 One advantage of the numerical approach in this analysis is that it can be used to solve the NLSE and simulate IGA traces when both pump depletion and walk-off effect are both taken into account a situation that does not lend itself to analytical solution. The Numerical simulation predicts IGA trace even at very high Raman conversion, including in the region where IGA sidelobes get completely washed out as seen in Figure 6.14.
159 CHAPTER 7 DETERMINATION OF THE SENSITIVITY OF IGA MEASUREMENTS, AND THE RELATIONSHIP BETWEEN IGA TECHNIQUE AND THE SPECTRAL DOMAIN SPM TECHNIQUE 7.1 Introduction The level of acceptance of any new experimental technique depends on how well its performance and the interpretation of its data relate to other known techniques in the field. Among all the n2 measurement techniques (see Chapter 3), the spectral domain SPM technique pioneered by Stolen and Lin [13,62], is the most widely used method for measuring the n2 in optical fibers, and it has a well-established measurement accuracy. The relation between this technique and IGA will be discussed in Section 7.2. A mathematical formulation is derived to establish the link between the two techniques, and it is shown that one can in certain cases predict the results of the spectral domain SPM technique from IGA measurements. The sensitivity of the IGA, defined by the least detectable phase shift has also been determined and the result is presented in Section Derivation of the Relationship Between IGA and the Spectral Domain SPM Technique It is known that SPM causes pulse broadening in the spectral domain that leads to a periodic structure in the power spectrum of the broadened pulse [13,20, ]. It was shown by the stationary phase method [176] that the maximum nonlinear phase shift of a modulated pulse can be written as: 137
160 138 where m is the total number of minima of the spectrum at the Stokes side. The quantity ygnp represents the peak (maximum) nonlinear phase shift, y = cooz/c, and Snp is the nonlinear refractive index change induce by the field, coo is the laser angular frequency, where the subscript p implies the peak value. The above equation can be written as [179]: where Om is the maximum phase shift (Om -:: yen p ), m is the number of minima that appear on either the Stokes side or the anti-stokes side of the power spectrum [2]. The corresponding maximum frequency shift, disregarding variation in amplitude should occur at the inflection point of the phase profile and it is obtained from the timederivative of the phase. If the inflection point occurs at a time ti, for a fixed point in space then the maximum frequency shift can be written as [179]: where 0(t) is the time-dependent nonlinear phase shift profile of the pulse. Now, assuming a Gaussian phase shape of the form:
161 139 Equations (7.lb), (7.6) and (7.8) can be substituted into equation (7.4) to obtain the following result: where fm is the frequency bandwidth of the spectrum. In the Stolen's spectral domain SPM technique [13,52,62] the total spectrum is counted (Stokes and anti-stokes sides) and the result must be divided by two. His expression for the maximum phase shift measured is therefore given by [52]
162 140 It was shown previously that the frequency bandwidth (4t) of a SPM broadened spectrum can be given approximately by the relation [64]: where Q is the spectral broadening parameter and co0 is the central angular frequency of the laser. Recognizing that, both Rif and fm are the same, (a measure of the frequency bandwidth of SPM broadened spectrum) Equation (7.13) can then be substituted into Equation (7.12) to have: Interestingly, the parameter o.)s ph is what is actually measured in the IGA technique [65-68] called the "self-phase modulation strength", while. AO m is the parameter measured in the spectral domain SPM technique [13,52-53,62], called the "maximum spectral phase shift". Thus equation (7.15) relates the IGA to the spectral domain SPM technique. Re-writing the above equation in the conventional notation, one has:
163 141 where N is the number of peaks in the power spectrum for N 2 (readily identifiable spectral shapes exist for phase shifts of n/2 and 7c). Q m is the value of the spectral broadening parameter at the maximum phase shift. Equation (7.15) relates the IGA technique directly to the spectral domain. At Q = Qm the IGA trace should have well defined lobes (zeros) on either side of the central peak. For a typical IGA trace with three well defined lobes on either side of the central peak, coot dqm = and the corresponding AOm = 3.57t. This should yield a spectrum with 4 peaks in the spectral domain SPM measurement. J limitation on the sensitivity of the spectral domain SPM measurement is the fact that it allows one to determine the phase shift only in (2N-l) multiples of n/2. This limits the lowest measurable phase shift to 0.57t. In the IGA technique however, one can measure continuous values of o)ot pq at values of Q other than Q m. One significant advantage of the continuous value measurement of the phase in the IGA technique is that it is possible to detect values of phase shift lower than 0.5n, which is the current limit of the spectral domain SPM technique. The sensitivity of IGA technique to the measurement of small phase shift will be discussed in the next section.
164 Determination of the Sensitivity of the IGA Technique Definition and Measurement The sensitivity of the IGA technique is the lowest value of phase shift that can be detected experimentally with this technique. The IGA technique is a useful tool for accurate measurement of pulsewidth just like the famous noncollinear background-free second harmonic generation intensity autocorrelation (SHGA), discussed in chapter four. However, while the SHGA is not sensitive to the phase, IGA is. For a non-phase modulated Gaussian pulse, the IGA trace is identical to the SHGA trace. A self-phase modulated Gaussian pulse would appear the same and exhibit its original pulsewidth under SHGJ trace but its IGA trace would show narrowing and sometimes oscillation, to reflect the level of the change in phase of the pulse. This property can be used to determine the smallest level of phase shift imparted onto a pulse that has propagated through the fiber, by comparing the resulting IGA trace with the SHGA trace. For a Gaussian input pulse in the zero GAD regime, the minimum detectable SPM strength cootq occurs near the limit where the width of the IGA trace approaches the non-collinear background-free intensity autocorrelation width (tauro - RIGA --> 0). Here TAIGA is the FWHM of the central peak of the IGA trace and TAUT() is the FWHM of the SHGA trace. For a Gaussian input pulse, the pulsewidth is given by -u p = AUTO h12. A prediction was made earlier [ 66 ] through simulation that IGA can detect phase shift as low as cootpq fe:i 0.6, by assuming a laser amplitude fluctuation of 5%. This corresponds to AO,:,' 0.19n. Careful and systematic measurements were performed to match this prediction and to establish the ultimate sensitivity of the IGA technique.
165 143 The measurements were performed in a 20 meters long silica core fiber and at very low power. A variable attenuator was used to attenuate the laser beam before coupling into the fiber. The laser was optimized for stability. The amplitude fluctuation was below 4%. A sensitive digital power meter (Newport model 835, which is good to sub microwatts) was used for the power measurement. IGJ traces were taken in the usual procedure earlier described (Chapter 4). The resulting IGA traces are fitted with the IGA model. The autocorrelation trace of the input pulse was also measured. Figures (7.l) to (7.4) show the series of low power IGA traces plotted in the same scale with a Gaussian fitted SHGA trace of the input pulse, to show the onset of narrowing and how it progressed with slight increases in the power in the fiber.

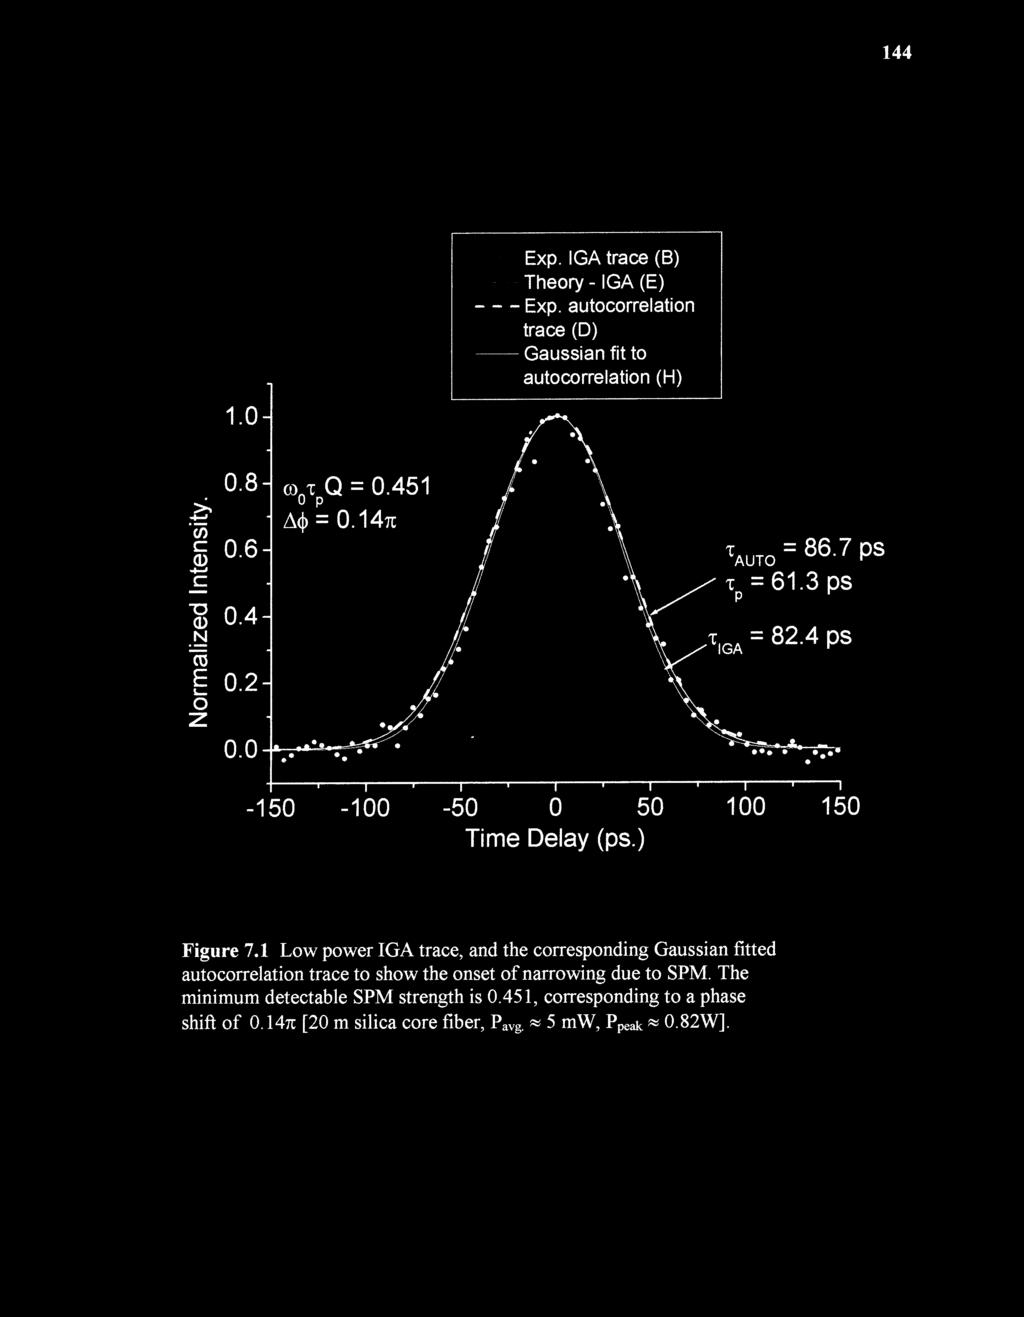
166 144


167 = Fyn IPA trace 145

168 146
169 Discussion of Results From Figure (7.l), it is clear that one has approached the ultimate limit of phase shift detection using this technique. The minimum SPM strength is shown to be co otpq = 0.451, which corresponds to 64 = 0.147E. Due to laser amplitude fluctuations, one can barely resolve the difference between the IGA trace and the SHGA trace. Any further attempt to reduce the power leads to a total overlap between the IGA and SHGA. As the power increases, the difference becomes more resolved between IGA trace and the SHGA trace. In Figure 7.2, the two traces are clearly separated and the corresponding self-phase modulation strength is 0.644, which corresponds to A4) = 0.207E. The result obtained here is remarkable because it appears to be the most sensitive measurement of the nonlinear phase shift in optical fiber. Although, a comprehensive data on the sensitivity of detection of the different n2 measurement techniques is not available, one can compare with the spectral domain SPM method, which is currently the most popular technique. The reported minimum measured phase shift with this technique to date is 0.57E. This is so limited primarily due to the fact that one relies on counting of nodes in the spectrum to determine the phase shift, which appear only at integer orders of 7E/2. Comparing this with the current result of 0.147E reported here, it is seen that the sensitivity of IGA is over a factor of three better. One may in principle improve the sensitivity of the spectral domain SPM technique by evaluating the integral listed in [13] and fitting the resulting spectrum to the experimental data. In this case, one can obtain a continuous value measurement of the phase.


170 148 It should be mentioned that the minimum phase shift theoretically predicted [66] for the IGA technique was A(I = 0.19, which is about 30% higher than the lower limit of the measured sensitivity ( 0.14n) the measured value, implying that the measured value
171 149 has pushed further the sensitivity by 30%. The prediction assumed 5% amplitude fluctuation in the theoretical simulation. This is slightly higher than the amplitude fluctuation of the laser at the time of the measurement. Fluctuation in laser amplitude limits one's ability to resolve the difference between the IGA trace and the SHGA trace when the narrowing is substantially low, and reduces the accuracy of the fitting routine. The fitting routine yields the cooi pq value by establishing a convergence between the experimental data and the IGA model. With a more stable pulse, better resolution and convergence accuracy is obtained, which improves the sensitivity of detection. At this juncture, it may be useful to specify the power-length product used for this measurement and mention some important numbers. The corresponding laser power that propagated into the 20 m long silica core fiber used in the experiment was approximately 0.82 W of peak power. This implies a power length product of 16.4 W-m. (or 1640 W- Om). The fiber has an effective area of 5O utm2. This gives a peak intensity of l.64 x 10 1 Wcm-2 (l.64 x 106 Wcm"2 ) and intensity-length product of 3.28 x Wcm-1 (3.28 x 10⁹ Wcm"1).
172 CHAPTER 8 CONCLUSION 8.1 Summary In this study, the photorefractive beam coupling technique, also called induced grating autocorrelation (IGA), has been used to measure the nonlinear refractive index (n2) and the Raman gain coefficient (gi) in short lengths ( z 20 m) of different types of optical fibers, and the dependence of n2 on the doping profiles of Er-Al-Ge has been investigated. A detailed review of other available techniques [13,15,54-59, ] for n2 measurements given in Chapter 3 has shown that all these techniques typically require hundreds of meters and sometimes, kilometers of fibers for n2 measurement setup. In measuring n2 in long fibers, one has to deal with the problems of pulse dispersion and polarization scrambling, which amounts to additional uncertainties in the n2 measurement. The IGA technique has the advantage of measuring n2 accurately in short lengths of fibers, thereby avoiding the above mentioned problems, in addition to costsaving. In the IGA experiment, a transform limited Gaussian pulse is propagated through a short length of an optical fiber, where it undergoes self-phase modulation (SPM) and other nonlinear distortions, and the output pulse is split into two. The two-excitation pulses are then coupled into a photorefractive crystal, where they interfere and form a photorefractive phase grating. The IGA response is determined by delaying one beam (the probe) and plotting the diffracted intensity of the probe versus the relative delay (t). Analysis of the IGA response yields information about the nonlinear phase distortions and other calibration parameters of the fiber. The standard IGA model for n2 150
173 151 measurements as discussed in chapter four was derived from the solution of the wave equation for pulse propagation, in the limit of pure SPM. This model assumed that GAD (group velocity dispersion) and other nonlinear processes such as stimulated Raman scattering (SRS), are negligible. This model has been successfully used to fit the experimental data and determine the n2 of the fiber from the time dependent phase shift imparted on the pulse.. The breakdown of the standard IGA model was initially observed [70-71] in high Ge02 doped fibers, where it was noted that the measured IGA trace was distorted and showed clear deviations from the standard IGA model. Investigations into the cause of this deviation revealed that stimulated Raman scattering was responsible. Measurement of the spectrum of the output pulse from these highly Ge02 doped fibers showed a strong Raman peak (including second Stokes signals), in some cases exceeding 50% conversion at moderate power input. To account for this deviation, a new model of the IGA has been developed, from the solution of the coupled-amplitude nonlinear Schrodinger equation using both analytical and numerical approaches. The analytical solution was obtained using the "undepleted pump approximation", in which the Stokes signal is treated as a perturbation on the pump. The IGA model developed from this solution accounted for the SRS effects on the IGA trace and allowed the direct determination of the Raman gain coefficient from the fit of the SRS-distorted IGA trace, provided that the Raman conversion does not exceed 25% of the pump. Measurement of Raman gain coefficient was made in four different fibers including pure silica fiber, Er-Al-Ge doped fiber with 28% Ge, a Ge02 doped fiber with 30% germania and a DCF (dispersion compensating fiber). The results
174 152 obtained in all these cases are in good agreement with published results. The numerical approach extends the IGA model further into the region of pump depletion and predicts IGA traces quite well even when the Stokes signal exceeds the pump. This numerical procedure also allows the determination of the Raman gain coefficient of high germania doped fiber, on a relative term with pure silica.. It has also be shown in this work (Chapter 7) that, in the limits of pure self-phase modulation, the IGA technique reduces to the widely accepted spectral domain SPM technique pioneered by Stolen and Lin [13], but is readily applicable to shorter lengths of fiber and is sensitive to smaller phase shifts. 8.2 Scientific Value and Practical Applications The development of IGA as a new technique for measuring Raman gain coefficient in short lengths of fibers, will have a strong positive impact on scientific research in this field because it is both economical and simple. With the exception of few cases [50], available techniques for measuring Raman gain coefficient in optical fibers have always required the use of very long fibers, z >10 km [159,160,162], while some require the use of two independent laser sources [158,160]. This makes the Raman gain coefficient measurement quite an expensive venture. With the IGA technique, one can measure Raman gain coefficient in meter lengths of fiber, using picosecond pulses at a single wavelength (1064 nm). In addition, one minimizes the effect of polarization scrambling, since the fiber length is short. These advantages that results from gi measurement with the IGA technique is also true in the case of n2 measurements.
175 153 System designers require n2 data of different telecommunication fibers for predicting and, improving the performance of optical communication systems. In today's telecommunication market, fiber manufacturers are sometimes required to specify the numerical value of the n2 of their fibers. The results of the n2 measurements obtained in different fiber types in this work will serve to provide these much needed data. The IGA technique, combining its accuracy with its ability to measure n 2 and gi in short fiber lengths, will now make it possible for these parameters to be measured directly in standard EDFAs. The typical lengths of EDFAs are about m Recommendations for Future Studies There are many new challenging areas in which IGA can be of use. For example, the study of nonlinear optical properties of holey fibers [HFs] is an emerging area of research interest in which IGA can be applied. Unlike conventional fibers, which use different core and cladding materials, HFs can be made from a single material. Light is guided in holey fibers owing to an effective volume average index difference between the center, which forms the core, and the surrounding region, which contains air holes that act as the cladding. One of the pioneering attempts [179] to measure the nonlinearity in this fiber has indicated that the nonlinear coefficient (n 2hkeff) in this class of fibers is about four times higher than that of DSF (dispersion shifted fiber). Measurement of the Raman gain coefficient and n2 in tellurite glass fibers is still an open challenge. Measurement of the Raman gain coefficient has only recently been reported [180] in the bulk sample of tellurite glasses, which showed that the gi is about
176 times higher than in fused silica. This indicates that tellurite fibers would be a good candidate for Raman amplification. Another very interesting research opportunity would be to extend the IGA technique into the femtosecond regime. With such short pulses, the IGA would require even much shorter fiber lengths and low average power. However this may not be all that simple as it sounds, because with femtosecond pulses, additional nonlinear effects such as intra-pulse Raman scattering and self-steepening may become important. In addition, the pulse shape would no longer be Gaussian, and the IGA model must be modified for hyperbolic secant pulses. Finally, the author recommends that polarization dependent measurements of the nonlinear refractive index and the Raman gain coefficient in optical fibers be performed using the IGA technique. This is necessary in order to confirm that the assumption of non-polarization scrambling in IGA experiments, owing to short fiber lengths is not an over simplification.
177 APPENDIX A DIFFERENT MECHANISMS THAT CAN PRODUCE NONLINEAR REFRACTIVE INDEX (n2) IN OPTICAL MATERIALS A.1 Introduction Although, the nonlinear refractive index (n 2) studied in this work is known to arise from the so called "electronic Kerr effect" (which results from the nonlinear electronic polarizability), it is important to note that there are other physical mechanism that can as well lead to nonlinear refractive index (n2), with different response times. In this Appendix, the different mechanisms that can contribute to the nonlinear refractive index (n2) in optical materials are briefly described, together with their relative magnitudes and response times. A.2 Electronic Kerr Effect One of the most important mechanisms that produce the nonlinear refractive index is the electronic Kerr effect, which results from the nonlinear electronic polarizability. This was the case discussed in Section 2.l. This effect which arises from an optically induced distortion of the electronic charge distribution, is essentially instantaneous with response time 'I seconds, and it is in general considerably small in magnitude. Typically, n2(electronic) ~ 10 "13 (esu) cm2w-1 (see Chapter 5). This effect occurs in solids and in fluids composed of isotropic molecules [72, ]. 155
178 156 A.3 Orientational Kerr Effect The orientational Kerr effect occurs in fluids (liquids and gases) composed of anisotropic molecules, whose optical polarizabilities in different coordinate directions are unequal. A good example is a symmetric top molecule whose polarizability along its axis (Mx) is not equal to its polarizability perpendicular to its axis (ax). In the absence of an electric field, the molecules are oriented in random directions, so that the index of refraction is isotropic (has the same value in different directions or axis). When an optical field is applied, it induces a dipole moment in the direction of the field. The field can further interact with this induced moment to exert a torque on the molecules proportional to (ocz -a, )E2. Since the induced moment and the field has the same frequency and phase, this torque will have a dc component which will tend to rotate the molecules into alignment with the field. The incremental rotation of a molecule produces a change in index of refraction parallel to the electric field. This index change is given by [72,184] : N is the density of molecules, 8 is the angle between the molecule and the electric field, and n0 is the linear index of refraction. The average is over all orientations with a weighting factor of a Boltzmann distribution which reflects the interaction energy:
179 Typically, n2 is of the order of (esu) ~ [10-14 cm2w1 ], with a response time of the order of seconds. Note that if the optical field is circularly polarized instead of linear, the change in index of refraction is only one fourth as large. A.4 Electrostriction Electrostriction is the density change of an optical material due to the stress caused by intense electromagnetic waves. This change in density alters the index of refraction of the material. The magnitude of the steady state nonlinear refractive index due to electrostrictive process can be given by [72]: where p is the density and 13 is the bulk compressibility. The magnitude of n2 is typically large (~ cm2w"1). The speed of response is however very slow ( 10-9 s) [185], since the growth of the density change is governed by acoustic propagation. In deed, the response time is approximately given by the beam cross section divided by the speed of sound.
180 158 A.5 Thermal Effect Nonlinear index change can also result from thermal effect. There are two components to the thermal induced index change, one arising from purely thermal effect at constant volume (such as entropy change) and the other arising from thermal expansion. The two contributions can be represented by [72]: where T is temperature and p is the material density. The first term is due to change in entropy, and occurs very fast, but it is usually very small in magnitude. The last term represents the contribution form thermal expansion, which can be quite large, but has a slow response time. The relaxation of both contributions is determined by the diffusion of heat away from the optical beam, and it is generally slow (~ 10-3 to 1 s). Thermal induced n2 is usually not important for picosecond pulses except where the effect is integrated over the entire pulse train. Generally, thermal n 2 is negative and produces self-defocusing effect. A.6 Other Mechanisms J contribution from nonlinear index can also arise from several other mechanisms. For example, in gases composed of spherically symmetric molecules (such as argon. Krypton etc) molecular collisions can give rise to nonlinear index. Collision between two molecules can lead to a distortion in their electronic distributions such that the polarizability of the pair may have a small anisotropic component. The can result to a nonlinear index analogous to the molecular orientational Kerr effect. The relaxation time
181 159 Photorefractive effect can also produce a change in index of refraction in electrooptic materials under an applied optical field. The photorefractive effect often leads to a strong nonlinear response, which usually cannot be described in terms of the third order nonlinear susceptibility, because the nonlinear polarization does not depend on the applied field strength in the same manner as the other mechanisms listed. In addition, its response time depends on the intensity of the optical field. A contribution to n2 can also arise from an optically induced polarization in absorbing polar materials, in which the dipole moment of an excited state differs from the ground state [186].
182 APPENDIX B VARIOUS UNITS FOR EXPRESSING TILE CONCENTRATION OF DOPANTS IN OPTICAL FIBER In this appendix the author whishes to explain the different units that are used to specify the quantity of dopants in an optical fiber and how they are calculated. The concentration of dopants in optical fiber is usually expressed in various units [133], such as parts per million mole (ppm), percentage molar concentration (%M), ions/cm 3 etc. Most of these dopants are available in the form of the compounds of the oxides or chlorides. Silica itself consists of as silicon oxide (Si02). Table (B.l) shows these compounds with their molecular weight. 160
183 161 (i) Percentage molar concentration (%M): This indicates the molar fraction of a given dopant in relation to one mole of the total combination as contained in the glass fiber. Let x(d) be the fractional molar concentration of a given dopant (oxide or chloride) composing the glass and x(s) the fractional molar amount of silica, then If Z is the molecular mass (or atomic mass) of the constituents, the total weight of the composite glass is given by: (ii) Number of molecules per cc or ions per cc (cc = cubic centimeter). Let D be the density of the composite glass and Nay = Avogadro's number (N. = 6.02 x 10²³), the number of molecules per cubic centimeter for each dopant is given by:
184 (iii) Parts per millions in molar concentration (ppm): This is defined for a given 162
185 163 (iv) Density of molecules in grams per cc (g/cm 3): For each constituent compound or ion, one can obtain the concentration or density of the molecules in grams per cc as follow:
186 164 where the absorption is usually expressed in dbim and the absorption cross-section is in M-2. The overlap factor is a parameter that specifies the overlap between the mode intensity and erbium ion distribution in the fiber. It is a dimensionless number. Typical values of overlap parameter for Er-Ge-Al doped fibers are 0.64 at 980 nm pumping, 0.46 and 0.4 at 1480 nm and 1550 nm pumping respectively [134]. Example: For a Er-Al-Ge doped silica fiber with absorption a = 10dBim at 1530 Om. The erbium concentration in this fiber can be estimated as follow: Use published overlap value closet to 1064 nm. Published data on overlap parameter.
187 165...for 10dB/m, cc(np/m) = 10 x 0.23 = 2.3/m Use published cross-section for Ge02-Al203-Si02 fiber [135] ~ l.7 x m-1 ( at 980 pumping)...er3 concentration (m -3) = 2.3/(4.7 x 10.25) = 4.82 x 1024 M-3.

![The plot shows that An is directly proportional to Ge02 concentration [181] and can be used to estimate An](/docs-images/74/71432597/images/188-2.jpg "from known Ge02 concentration or to obtain Ge02 concentration when An is given.")
188 APPENDIX C DEPENDENCE OF An ON Ge02 CONCENTRATION In this appendix, the author displays a plot of refractive index difference between the core and cladding versus the germania concentration. The plot shows that An is directly proportional to Ge02 concentration [181] and can be used to estimate An from known Ge02 concentration or to obtain Ge02 concentration when An is given. The intercept represents the refractive index of silica glass. 166
189 APPENDIX D ESTIMATING FIBER MODE-FIELD DIAMETER (MAD) AT 1064 nm FROM MEASURED VALUES AT 1314 nm, 1450 nm AND 1552 nm In this appendix, the author discusses the process used for estimating the MFD at 1064 nm from measurements made at 1552 nm and 1314 nm. The MFD and J effs for the fibers were measured at 1314 nm and 1552 nm, at OFS laboratory (with the help of Dr. Bill Reed), because these are the operational wavelengths of the available equipment for the measurement (Section 5.2.l). Some MFD and J effs values at 1450 nm for some of the fibers were also supplied [157,165]. Since the n2 and gi measurements in this work were performed at 1064 nm (see Chapters 4 to 6), the MFD and J eff of these fibers need to be known at 1064 nm since these parameters (Jeff and MFD) have been observed to vary significantly with wavelength. Attempts made to obtained some few references that appeared to have discussed direct empirical formula for this was not successful within a reasonable time frame. The author has thus used the measured values of MFD at the above wavelengths to estimate its value at 1064 nm for each fiber. In doing this, a typical case where the Jeffs and MFD are known at 1552 nm, 1314 nm and 1064 nm [fiber #l(pure silica)] was used to determine the variation trend, which was found to fit well with a second-order polynomial of the form: where A is the intercept on y at x = 0 and B1 and BC are constants. Typical fitted results are shown in Figure (D.l). 167


190 168
Nonlinear Effects in Optical Fiber. Dr. Mohammad Faisal Assistant Professor Dept. of EEE, BUET
 Nonlinear Effects in Optical Fiber Dr. Mohammad Faisal Assistant Professor Dept. of EEE, BUET Fiber Nonlinearities The response of any dielectric material to the light becomes nonlinear for intense electromagnetic
Nonlinear effects in optical fibers - v1. Miguel A. Muriel UPM-ETSIT-MUIT-CFOP
 Nonlinear effects in optical fibers - v1 Miguel A. Muriel UPM-ETSIT-MUIT-CFOP Miguel A. Muriel-015/10-1 Nonlinear effects in optical fibers 1) Introduction ) Causes 3) Parameters 4) Fundamental processes
Nonlinear Fiber Optics and its Applications in Optical Signal Processing
 1/44 Nonlinear Fiber Optics and its Applications in Optical Signal Processing Govind P. Agrawal Institute of Optics University of Rochester Rochester, NY 14627 c 2007 G. P. Agrawal Outline Introduction
Decay of Higher Order Solitons in the presence of Dispersion, Self-steeping & Raman Scattering
 Decay of Higher Order Solitons in the presence of Dispersion, Self-steeping & Raman Scattering Thesis submitted in partial fulfillment of the requirement for the award of the degree of MASTER OF ENGINEERING
Propagation losses in optical fibers
 Chapter Dielectric Waveguides and Optical Fibers 1-Fev-017 Propagation losses in optical fibers Charles Kao, Nobel Laureate (009) Courtesy of the Chinese University of Hong Kong S.O. Kasap, Optoelectronics
OPTICAL COMMUNICATIONS S
 OPTICAL COMMUNICATIONS S-108.3110 1 Course program 1. Introduction and Optical Fibers 2. Nonlinear Effects in Optical Fibers 3. Fiber-Optic Components I 4. Transmitters and Receivers 5. Fiber-Optic Measurements
Nonlinear Photonics with Optical Waveguides
 1/44 Nonlinear Photonics with Optical Waveguides Govind P. Agrawal The Institute of Optics University of Rochester Rochester, New York, USA c 2015 G. P. Agrawal Outline Introduction Planar and Cylindrical
B 2 P 2, which implies that g B should be
 Enhanced Summary of G.P. Agrawal Nonlinear Fiber Optics (3rd ed) Chapter 9 on SBS Stimulated Brillouin scattering is a nonlinear three-wave interaction between a forward-going laser pump beam P, a forward-going
Impact of Nonlinearities on Fiber Optic Communications
 1 2 3 4 5 6 7 8 9 10 11 12 13 14 15 16 17 18 19 20 21 22 23 24 25 26 27 28 29 30 31 32 33 34 35 36 37 38 39 40 41 42 43 44 45 Review Impact of Nonlinearities on Fiber Optic Communications Mário Ferreira
Fiber Gratings p. 1 Basic Concepts p. 1 Bragg Diffraction p. 2 Photosensitivity p. 3 Fabrication Techniques p. 4 Single-Beam Internal Technique p.
 Preface p. xiii Fiber Gratings p. 1 Basic Concepts p. 1 Bragg Diffraction p. 2 Photosensitivity p. 3 Fabrication Techniques p. 4 Single-Beam Internal Technique p. 4 Dual-Beam Holographic Technique p. 5
Self-Phase Modulation in Optical Fiber Communications: Good or Bad?
 1/100 Self-Phase Modulation in Optical Fiber Communications: Good or Bad? Govind P. Agrawal Institute of Optics University of Rochester Rochester, NY 14627 c 2007 G. P. Agrawal Outline Historical Introduction
Raman Amplification for Telecom Optical Networks. Dominique Bayart Alcatel Lucent Bell Labs France, Research Center of Villarceaux
 Raman Amplification for Telecom Optical Networks Dominique Bayart Alcatel Lucent Bell Labs France, Research Center of Villarceaux Training day www.brighter.eu project Cork, June 20th 2008 Outline of the
Optical solitons and its applications
 Physics 568 (Nonlinear optics) 04/30/007 Final report Optical solitons and its applications 04/30/007 1 1 Introduction to optical soliton. (temporal soliton) The optical pulses which propagate in the lossless
Performance Limits of Delay Lines Based on "Slow" Light. Robert W. Boyd
 Performance Limits of Delay Lines Based on "Slow" Light Robert W. Boyd Institute of Optics and Department of Physics and Astronomy University of Rochester Representing the DARPA Slow-Light-in-Fibers Team:
Soliton Molecules. Fedor Mitschke Universität Rostock, Institut für Physik. Benasque, October
 Soliton Soliton Molecules Molecules and and Optical Optical Rogue Rogue Waves Waves Benasque, October 2014 Fedor Mitschke Universität Rostock, Institut für Physik fedor.mitschke@uni-rostock.de Part II
Laser Physics OXFORD UNIVERSITY PRESS SIMON HOOKER COLIN WEBB. and. Department of Physics, University of Oxford
 Laser Physics SIMON HOOKER and COLIN WEBB Department of Physics, University of Oxford OXFORD UNIVERSITY PRESS Contents 1 Introduction 1.1 The laser 1.2 Electromagnetic radiation in a closed cavity 1.2.1
Supplementary Figure 1 Schematics of an optical pulse in a nonlinear medium. A Gaussian optical pulse propagates along z-axis in a nonlinear medium
 Supplementary Figure 1 Schematics of an optical pulse in a nonlinear medium. A Gaussian optical pulse propagates along z-axis in a nonlinear medium with thickness L. Supplementary Figure Measurement of
Highly Nonlinear Fibers and Their Applications
 1/32 Highly Nonlinear Fibers and Their Applications Govind P. Agrawal Institute of Optics University of Rochester Rochester, NY 14627 c 2007 G. P. Agrawal Introduction Many nonlinear effects inside optical
OPTI510R: Photonics. Khanh Kieu College of Optical Sciences, University of Arizona Meinel building R.626
 OPTI510R: Photonics Khanh Kieu College of Optical Sciences, University of Arizona kkieu@optics.arizona.edu Meinel building R.626 Announcements Homework #4 is assigned, due March 25 th Start discussion
Liquid Crystals IAM-CHOON 1(1100 .,4 WILEY 2007 WILEY-INTERSCIENCE A JOHN WILEY & SONS, INC., PUBLICATION. 'i; Second Edition. n z
 Liquid Crystals Second Edition IAM-CHOON 1(1100.,4 z 'i; BICENTCNNIAL 1 8 0 7 WILEY 2007 DICENTENNIAL n z z r WILEY-INTERSCIENCE A JOHN WILEY & SONS, INC., PUBLICATION Contents Preface xiii Chapter 1.
Nonlinear Optics (NLO)
") Nonlinear Optics (NLO) (Manual in Progress) Most of the experiments performed during this course are perfectly described by the principles of linear optics. This assumes that interacting optical beams
Nonlinear Optics (NLO) (Manual in Progress) Most of the experiments performed during this course are perfectly described by the principles of linear optics. This assumes that interacting optical beams
Let us consider a typical Michelson interferometer, where a broadband source is used for illumination (Fig. 1a).
.") 7.1. Low-Coherence Interferometry (LCI) Let us consider a typical Michelson interferometer, where a broadband source is used for illumination (Fig. 1a). The light is split by the beam splitter (BS) and
7.1. Low-Coherence Interferometry (LCI) Let us consider a typical Michelson interferometer, where a broadband source is used for illumination (Fig. 1a). The light is split by the beam splitter (BS) and
Self-Phase-Modulation of Optical Pulses From Filaments to Solitons to Frequency Combs
 Self-Phase-Modulation of Optical Pulses From Filaments to Solitons to Frequency Combs P. L. Kelley Optical Society of America Washington, DC and T. K. Gustafson EECS University of California Berkeley,
Dmitriy Churin. Designing high power single frequency fiber lasers
 Dmitriy Churin Tutorial for: Designing high power single frequency fiber lasers Single frequency lasers with narrow linewidth have long coherence length and this is an essential property for many applications
Nonlinear Optical Effects in Fibers
 Nonlinear Optical Effects in Fibers NLO effects are manifested as attenuation, phase shifts, or wavelength conversion effects, and become stronger with increasing light intensity. The glass materials usually
Chapter-4 Stimulated emission devices LASERS
 Semiconductor Laser Diodes Chapter-4 Stimulated emission devices LASERS The Road Ahead Lasers Basic Principles Applications Gas Lasers Semiconductor Lasers Semiconductor Lasers in Optical Networks Improvement
Gain dependence of measured spectra in coherent Brillouin optical time-domain analysis sensors
 Gain dependence of measured spectra in coherent Brillouin optical time-domain analysis sensors Jon Mariñelarena, Javier Urricelqui, Alayn Loayssa Universidad Pública de Navarra, Campus Arrosadía s/n, 316,
Generation of supercontinuum light in photonic crystal bers
 Generation of supercontinuum light in photonic crystal bers Koji Masuda Nonlinear Optics, Fall 2008 Abstract. I summarize the recent studies on the supercontinuum generation (SC) in photonic crystal fibers
Observation of spectral enhancement in a soliton fiber laser with fiber Bragg grating
 Observation of spectral enhancement in a soliton fiber laser with fiber Bragg grating L. M. Zhao 1*, C. Lu 1, H. Y. Tam 2, D. Y. Tang 3, L. Xia 3, and P. Shum 3 1 Department of Electronic and Information
Nonlinear effects and pulse propagation in PCFs
 Nonlinear effects and pulse propagation in PCFs --Examples of nonlinear effects in small glass core photonic crystal fibers --Physics of nonlinear effects in fibers --Theoretical framework --Solitons and
Optical and Photonic Glasses. Lecture 30. Femtosecond Laser Irradiation and Acoustooptic. Professor Rui Almeida
 Optical and Photonic Glasses : Femtosecond Laser Irradiation and Acoustooptic Effects Professor Rui Almeida International Materials Institute For New Functionality in Glass Lehigh University Femto second
Optical Fiber Signal Degradation
 Optical Fiber Signal Degradation Effects Pulse Spreading Dispersion (Distortion) Causes the optical pulses to broaden as they travel along a fiber Overlap between neighboring pulses creates errors Resulting
requency generation spectroscopy Rahul N
 requency generation spectroscopy Rahul N 2-11-2013 Sum frequency generation spectroscopy Sum frequency generation spectroscopy (SFG) is a technique used to analyze surfaces and interfaces. SFG was first
Lecture 4 Fiber Optical Communication Lecture 4, Slide 1
 ecture 4 Dispersion in single-mode fibers Material dispersion Waveguide dispersion imitations from dispersion Propagation equations Gaussian pulse broadening Bit-rate limitations Fiber losses Fiber Optical
Applications of Nonlinear Fiber Optics. Second Edition
 Applications of Nonlinear Fiber Optics Second Edition Applications of Nonlinear Fiber Optics Second Edition GOVIND P. AGRAWAL The Institute of Optics University of Rochester Rochester, New York AMSTERDAM
Fiber-Optic Parametric Amplifiers for Lightwave Systems
 Fiber-Optic Parametric Amplifiers for Lightwave Systems F. Yaman, Q. Lin, and Govind P. Agrawal Institute of Optics, University of Rochester, Rochester, NY 14627 May 21, 2005 Abstract Fiber-optic parametric
4. The interaction of light with matter
 4. The interaction of light with matter The propagation of light through chemical materials is described by a wave equation similar to the one that describes light travel in a vacuum (free space). Again,
Optical Spectroscopy of Advanced Materials
 Phys 590B Condensed Matter Physics: Experimental Methods Optical Spectroscopy of Advanced Materials Basic optics, nonlinear and ultrafast optics Jigang Wang Department of Physics, Iowa State University
FIBER OPTICS. Prof. R.K. Shevgaonkar. Department of Electrical Engineering. Indian Institute of Technology, Bombay. Lecture: 07
 FIBER OPTICS Prof. R.K. Shevgaonkar Department of Electrical Engineering Indian Institute of Technology, Bombay Lecture: 07 Analysis of Wave-Model of Light Fiber Optics, Prof. R.K. Shevgaonkar, Dept. of
Module 4 : Third order nonlinear optical processes. Lecture 28 : Inelastic Scattering Processes. Objectives
 Module 4 : Third order nonlinear optical processes Lecture 28 : Inelastic Scattering Processes Objectives In this lecture you will learn the following Light scattering- elastic and inelastic-processes,
Multi-cycle THz pulse generation in poled lithium niobate crystals
 Laser Focus World April 2005 issue (pp. 67-72). Multi-cycle THz pulse generation in poled lithium niobate crystals Yun-Shik Lee and Theodore B. Norris Yun-Shik Lee is an assistant professor of physics
Doctor of Philosophy
 FEMTOSECOND TIME-DOMAIN SPECTROSCOPY AND NONLINEAR OPTICAL PROPERTIES OF IRON-PNICTIDE SUPERCONDUCTORS AND NANOSYSTEMS A Thesis Submitted for the degree of Doctor of Philosophy IN THE FACULTY OF SCIENCE
Tailorable stimulated Brillouin scattering in nanoscale silicon waveguides.
 Tailorable stimulated Brillouin scattering in nanoscale silicon waveguides. Heedeuk Shin 1, Wenjun Qiu 2, Robert Jarecki 1, Jonathan A. Cox 1, Roy H. Olsson III 1, Andrew Starbuck 1, Zheng Wang 3, and
Fiber-Optics Group Highlights of Micronova Department of Electrical and Communications Engineering Helsinki University of Technology
 Highlights of 2004 Micronova Department of Electrical and Communications Engineering Micronova Seminar 3 December 2004 Group Leader: Hanne Ludvigsen Postdoctoral researcher: Goëry Genty Postgraduate students:
Optics, Optoelectronics and Photonics
 Optics, Optoelectronics and Photonics Engineering Principles and Applications Alan Billings Emeritus Professor, University of Western Australia New York London Toronto Sydney Tokyo Singapore v Contents
Schemes to generate entangled photon pairs via spontaneous parametric down conversion
 Schemes to generate entangled photon pairs via spontaneous parametric down conversion Atsushi Yabushita Department of Electrophysics National Chiao-Tung University? Outline Introduction Optical parametric
CHAPTER 7 SUMMARY OF THE PRESENT WORK AND SUGGESTIONS FOR FUTURE WORK
 161 CHAPTER 7 SUMMARY OF THE PRESENT WORK AND SUGGESTIONS FOR FUTURE WORK 7.1 SUMMARY OF THE PRESENT WORK Nonlinear optical materials are required in a wide range of important applications, such as optical
Copyright Warning & Restrictions
 Copyright Warning & Restrictions The copyright law of the United States (Title 17, United States Code) governs the making of photocopies or other reproductions of copyrighted material. Under certain conditions
CHEM*3440. Photon Energy Units. Spectrum of Electromagnetic Radiation. Chemical Instrumentation. Spectroscopic Experimental Concept.
 Spectrum of Electromagnetic Radiation Electromagnetic radiation is light. Different energy light interacts with different motions in molecules. CHEM*344 Chemical Instrumentation Topic 7 Spectrometry Radiofrequency
Linear pulse propagation
 Ultrafast Laser Physics Ursula Keller / Lukas Gallmann ETH Zurich, Physics Department, Switzerland www.ulp.ethz.ch Linear pulse propagation Ultrafast Laser Physics ETH Zurich Superposition of many monochromatic
10. OPTICAL COHERENCE TOMOGRAPHY
 1. OPTICAL COHERENCE TOMOGRAPHY Optical coherence tomography (OCT) is a label-free (intrinsic contrast) technique that enables 3D imaging of tissues. The principle of its operation relies on low-coherence
Sources supercontinuum visibles à base de fibres optiques microstructurées
 Sources supercontinuum visibles à base de fibres optiques microstructurées P. Leproux XLIM - Université de Limoges Journées Thématiques CMDO+, Palaiseau, 24-25 nov. 2008 Palaiseau, 25/11/2008 - P. Leproux
Temporal modulation instabilities of counterpropagating waves in a finite dispersive Kerr medium. II. Application to Fabry Perot cavities
 Yu et al. Vol. 15, No. 2/February 1998/J. Opt. Soc. Am. B 617 Temporal modulation instabilities of counterpropagating waves in a finite dispersive Kerr medium. II. Application to Fabry Perot cavities M.
Supplementary Information. Temporal tweezing of light through the trapping and manipulation of temporal cavity solitons.
 Supplementary Information Temporal tweezing of light through the trapping and manipulation of temporal cavity solitons Jae K. Jang, Miro Erkintalo, Stéphane Coen, and Stuart G. Murdoch The Dodd-Walls Centre
Copyright Warning & Restrictions
 Copyright Warning & Restrictions The copyright law of the United States (Title 17, United States Code) governs the making of photocopies or other reproductions of copyrighted material. Under certain conditions
Performance Analysis of FWM Efficiency and Schrödinger Equation Solution
 Performance Analysis of FWM Efficiency and Schrödinger Equation Solution S Sugumaran 1, Rohit Bhura 2, Ujjwal Sagar 3,P Arulmozhivarman 4 # School of Electronics Engineering, VIT University, Vellore Tamil
Dark Soliton Fiber Laser
 Dark Soliton Fiber Laser H. Zhang, D. Y. Tang*, L. M. Zhao, and X. Wu School of Electrical and Electronic Engineering, Nanyang Technological University, Singapore 639798 *: edytang@ntu.edu.sg, corresponding
Nonlinear Optical Waves in Disordered Ferroelectrics
 PhD candidate: Nonlinear Optical Waves in Disordered Ferroelectrics Davide Pierangeli davide.pierangeli@roma1.infn.it Supervisor: Prof. Eugenio DelRe Physics Department, Unversity of Rome La Sapienza,
Time resolved optical spectroscopy methods for organic photovoltaics. Enrico Da Como. Department of Physics, University of Bath
 Time resolved optical spectroscopy methods for organic photovoltaics Enrico Da Como Department of Physics, University of Bath Outline Introduction Why do we need time resolved spectroscopy in OPV? Short
Dissipative soliton resonance in an all-normaldispersion erbium-doped fiber laser
 Dissipative soliton resonance in an all-normaldispersion erbium-doped fiber laser X. Wu, D. Y. Tang*, H. Zhang and L. M. Zhao School of Electrical and Electronic Engineering, Nanyang Technological University,
Simulation of Pulse propagation in optical fibers P. C. T. Munaweera, K.A.I.L. Wijewardena Gamalath
 International Letters of Chemistry, Physics and Astronomy Submitted: 6-- ISSN: 99-3843, Vol. 64, pp 59-7 Accepted: 6--5 doi:.85/www.scipress.com/ilcpa.64.59 Online: 6--5 6 SciPress Ltd., Switzerland Simulation
Effect of cross-phase modulation on supercontinuum generated in microstructured fibers with sub-30 fs pulses
 Effect of cross-phase modulation on supercontinuum generated in microstructured fibers with sub-30 fs pulses G. Genty, M. Lehtonen, and H. Ludvigsen Fiber-Optics Group, Department of Electrical and Communications
plasma optics Amplification of light pulses: non-ionised media
 Amplification of light pulses: non-ionised media since invention of laser: constant push towards increasing focused intensity of the light pulses Chirped pulse amplification D. Strickland, G. Mourou, Optics
Fiber Optics. Physics and Technology. Bearbeitet von Fedor Mitschke
 Fiber Optics Physics and Technology Bearbeitet von Fedor Mitschke 1. Auflage 2010. Buch. x, 288 S. Hardcover ISBN 978 3 642 03702 3 Format (B x L): 15,5 x 23,5 cm Gewicht: 1370 g Weitere Fachgebiete >
CROSS-PHASE modulation (XPM) is a nonlinear phenomenon
 is a nonlinear phenomenon") JOURNAL OF LIGHTWAVE TECHNOLOGY, VOL. 22, NO. 4, APRIL 2004 977 Effects of Polarization-Mode Dispersion on Cross-Phase Modulation in Dispersion-Managed Wavelength-Division-Multiplexed Systems Q. Lin and
JOURNAL OF LIGHTWAVE TECHNOLOGY, VOL. 22, NO. 4, APRIL 2004 977 Effects of Polarization-Mode Dispersion on Cross-Phase Modulation in Dispersion-Managed Wavelength-Division-Multiplexed Systems Q. Lin and
Lasers and Electro-optics
 Lasers and Electro-optics Second Edition CHRISTOPHER C. DAVIS University of Maryland III ^0 CAMBRIDGE UNIVERSITY PRESS Preface to the Second Edition page xv 1 Electromagnetic waves, light, and lasers 1
Answers to questions on exam in laser-based combustion diagnostics on March 10, 2006
 Answers to questions on exam in laser-based combustion diagnostics on March 10, 2006 1. Examples of advantages and disadvantages with laser-based combustion diagnostic techniques: + Nonintrusive + High
CROSS-PHASE modulation (XPM) is a nonlinear phenomenon
 is a nonlinear phenomenon") 958 IEEE JOURNAL OF QUANTUM ELECTRONICS, VOL. 40, NO. 7, JULY 2004 Vector Theory of Cross-Phase Modulation: Role of Nonlinear Polarization Rotation Qiang Lin and Govind P. Agrawal, Fellow, IEEE Abstract
958 IEEE JOURNAL OF QUANTUM ELECTRONICS, VOL. 40, NO. 7, JULY 2004 Vector Theory of Cross-Phase Modulation: Role of Nonlinear Polarization Rotation Qiang Lin and Govind P. Agrawal, Fellow, IEEE Abstract
Effects of self-steepening and self-frequency shifting on short-pulse splitting in dispersive nonlinear media
 PHYSICAL REVIEW A VOLUME 57, NUMBER 6 JUNE 1998 Effects of self-steepening and self-frequency shifting on short-pulse splitting in dispersive nonlinear media Marek Trippenbach and Y. B. Band Departments
Nuremberg, Paul-Gordan-Str. 6, Erlangen, Germany
 Numerical and Experimental Investigation of a Fiber-Optic Sensor Consisting of a Fiber Bragg Grating in a Two-Mode Fiber for Simultaneous Sensing of Temperature and Strain A. Siekiera 1,, R. Engelbrecht
Differential Brillouin gain for improving the temperature accuracy and spatial resolution in a long-distance distributed fiber sensor
 Differential Brillouin gain for improving the temperature accuracy and spatial resolution in a long-distance distributed fiber sensor Yongkang Dong, Xiaoyi Bao,* and Wenhai Li Fiber Optical Group, Department
Plasma Formation and Self-focusing in Continuum Generation
 Plasma Formation and Self-focusing in Continuum Generation Paper by Andrew Parkes Advisors: Jennifer Tate, Douglass Schumacher The Ohio State University REU 2003 Supported by NSF I. Abstract This summer
Quantum Electronics Prof. K. Thyagarajan Department of Physics Indian Institute of Technology, Delhi
 Quantum Electronics Prof. K. Thyagarajan Department of Physics Indian Institute of Technology, Delhi Module No. # 03 Second Order Effects Lecture No. # 11 Non - Linear Optic (Refer Slide Time: 00:36) Before
Gain-Flattening Filters with Autonomous Temperature Stabilization of EDFA Gain
 Gain-Flattening Filters with Autonomous Temperature Stabilization of A Gain by You Mimura *, Kazuyou Mizuno *, Syu Namiki *, Yoshio Tashiro * 2, Yoshihiro Emori * 2, Mariko Miyazawa *, Toshiaki Tsuda *
Optical and Photonic Glasses. Lecture 37. Non-Linear Optical Glasses I - Fundamentals. Professor Rui Almeida
 Optical and Photonic Glasses : Non-Linear Optical Glasses I - Fundamentals Professor Rui Almeida International Materials Institute For New Functionality in Glass Lehigh University Non-linear optical glasses
Supplementary Figure 1: SAW transducer equivalent circuit
 Supplementary Figure : SAW transducer equivalent circuit Supplementary Figure : Radiation conductance and susceptance of.6um IDT, experiment & calculation Supplementary Figure 3: Calculated z-displacement
Coherent Raman imaging with fibers: From sources to endoscopes
 Coherent Raman imaging with fibers: From sources to endoscopes Esben Ravn Andresen Institut Fresnel, CNRS, École Centrale, Aix-Marseille University, France Journées d'imagerie vibrationelle 1 Jul, 2014
Experimental studies of the coherence of microstructure-fiber supercontinuum
 Experimental studies of the coherence of microstructure-fiber supercontinuum Xun Gu, Mark Kimmel, Aparna P. Shreenath and Rick Trebino School of Physics, Georgia Institute of Technology, Atlanta, GA 30332-0430,
Lukas Gallmann. ETH Zurich, Physics Department, Switzerland Chapter 4b: χ (2) -nonlinearities with ultrashort pulses.
 -nonlinearities with ultrashort pulses.") Ultrafast Laser Physics Lukas Gallmann ETH Zurich, Physics Department, Switzerland www.ulp.ethz.ch Chapter 4b: χ (2) -nonlinearities with ultrashort pulses Ultrafast Laser Physics ETH Zurich Contents Second
Ultrafast Laser Physics Lukas Gallmann ETH Zurich, Physics Department, Switzerland www.ulp.ethz.ch Chapter 4b: χ (2) -nonlinearities with ultrashort pulses Ultrafast Laser Physics ETH Zurich Contents Second
Spatial Intensity Nonuniformities of an OMEGA Beam due to Nonlinear Beam Propagation
 Spatial Intensity Nonuniformities of an OMEGA Beam due to Nonlinear Beam Propagation Several applications require that a laser beam maintain a high degree of wavefront quality after propagating a long
The Interaction of Acoustic Phonons and Photons in the Solid State
 University of Tennessee, Knoxville Trace: Tennessee Research and Creative Exchange University of Tennessee Honors Thesis Projects University of Tennessee Honors Program Spring 5-2007 The Interaction of
Nonlinear Optics (WiSe 2017/18) Lecture 12: November 28, 2017
 Lecture 12: November 28, 2017") 7.6 Raman and Brillouin scattering 7.6.1 Focusing Nonlinear Optics (WiSe 2017/18) Lecture 12: November 28, 2017 7.6.2 Strong conversion 7.6.3 Stimulated Brillouin scattering (SBS) 8 Optical solitons 8.1
7.6 Raman and Brillouin scattering 7.6.1 Focusing Nonlinear Optics (WiSe 2017/18) Lecture 12: November 28, 2017 7.6.2 Strong conversion 7.6.3 Stimulated Brillouin scattering (SBS) 8 Optical solitons 8.1
Fiber Lasers. Chapter Basic Concepts
 Chapter 5 Fiber Lasers A fiber amplifier can be converted into a laser by placing it inside a cavity designed to provide optical feedback. Such lasers are called fiber lasers, and this chapter is devoted
R. L. Sharma*and Dr. Ranjit Singh*
 e t International Journal on Emerging echnologies (): 141-145(011) ISSN No (Print) : 0975-8364 ISSN No (Online) : 49-355 Solitons, its Evolution and Applications in High Speed Optical Communication R L
Vector dark domain wall solitons in a fiber ring laser
 Vector dark domain wall solitons in a fiber ring laser H. Zhang, D. Y. Tang*, L. M. Zhao and R. J. Knize 1 School of Electrical and Electronic Engineering, Nanyang Technological University, Singapore 639798
Group interactions of dissipative solitons in a laser cavity: the case of 2+1
 Group interactions of dissipative solitons in a laser cavity: the case of +1 Philippe Grelu and Nail Akhmediev * Laboratoire de Physique de l Université de Bourgogne, Unité Mixte de Recherche 507 du Centre
1 Mathematical description of ultrashort laser pulses
 1 Mathematical description of ultrashort laser pulses 1.1 We first perform the Fourier transform directly on the Gaussian electric field: E(ω) = F[E(t)] = A 0 e 4 ln ( t T FWHM ) e i(ω 0t+ϕ CE ) e iωt
An Efficient Method to Simulate the Pulse Propagation and Switching Effects of a Fiber Bragg Grating
 An Efficient Method to Simulate the Pulse Propagation and Switching Effects of a Fiber ragg Grating F. Emami, Member IAENG, A. H. Jafari, M. Hatami, and A. R. Keshavarz Abstract In this paper we investigated
System optimization of a long-range Brillouin-loss-based distributed fiber sensor
 System optimization of a long-range Brillouin-loss-based distributed fiber sensor Yongkang Dong, 1,2 Liang Chen, 1 and Xiaoyi Bao 1, * 1 Fiber Optics Group, Department of Physics, University of Ottawa,
Theory of optical pulse propagation, dispersive and nonlinear effects, pulse compression, solitons in optical fibers
 Theory of optical pulse propagation, dispersive and nonlinear effects, pulse compression, solitons in optical fibers General pulse propagation equation Optical pulse propagation just as any other optical
5.74 Introductory Quantum Mechanics II
 MIT OpenCourseWare http://ocw.mit.edu 5.74 Introductory Quantum Mechanics II Spring 2009 For information about citing these materials or our Terms of Use, visit: http://ocw.mit.edu/terms. p. 10-0 10..
Chapter 7: Optical Properties of Solids. Interaction of light with atoms. Insert Fig Allowed and forbidden electronic transitions
 Chapter 7: Optical Properties of Solids Interaction of light with atoms Insert Fig. 8.1 Allowed and forbidden electronic transitions 1 Insert Fig. 8.3 or equivalent Ti 3+ absorption: e g t 2g 2 Ruby Laser
Nonlinear Optics (WiSe 2016/17) Lecture 9: December 16, 2016 Continue 9 Optical Parametric Amplifiers and Oscillators
 Lecture 9: December 16, 2016 Continue 9 Optical Parametric Amplifiers and Oscillators") Nonlinear Optics (WiSe 2016/17) Lecture 9: December 16, 2016 Continue 9 Optical Parametric Amplifiers and Oscillators 9.10 Passive CEP-stabilization in parametric amplifiers 9.10.1 Active versus passive
Nonlinear Optics (WiSe 2016/17) Lecture 9: December 16, 2016 Continue 9 Optical Parametric Amplifiers and Oscillators 9.10 Passive CEP-stabilization in parametric amplifiers 9.10.1 Active versus passive
Folded digital backward propagation for dispersion-managed fiber-optic transmission
 Folded digital backward propagation for dispersion-managed fiber-optic transmission Likai Zhu 1, and Guifang Li 1,3 1 CREOL, The College of Optics and Photonics, University of Central Florida, 4000 Central
Copyright Warning & Restrictions
 Copyright Warning & Restrictions The copyright law of the United States (Title 17, United States Code) governs the making of photocopies or other reproductions of copyrighted material. Under certain conditions
Nonlinear Optics (WiSe 2018/19) Lecture 7: November 30, 2018
 Lecture 7: November 30, 2018") Nonlinear Optics (WiSe 2018/19) Lecture 7: November 30, 2018 7 Third-order nonlinear effects (continued) 7.6 Raman and Brillouin scattering 7.6.1 Focusing 7.6.2 Strong conversion 7.6.3 Stimulated Brillouin
Nonlinear Optics (WiSe 2018/19) Lecture 7: November 30, 2018 7 Third-order nonlinear effects (continued) 7.6 Raman and Brillouin scattering 7.6.1 Focusing 7.6.2 Strong conversion 7.6.3 Stimulated Brillouin
37. 3rd order nonlinearities
 37. 3rd order nonlinearities Characterizing 3rd order effects The nonlinear refractive index Self-lensing Self-phase modulation Solitons When the whole idea of χ (n) fails Attosecond pulses! χ () : New
37. 3rd order nonlinearities
 37. 3rd order nonlinearities Characterizing 3rd order effects The nonlinear refractive index Self-lensing Self-phase modulation Solitons When the whole idea of χ (n) fails Attosecond pulses! χ () : New
Solitons in optical fibers. by: Khanh Kieu
 Solitons in optical fibers by: Khanh Kieu Project 9: Observation of soliton PD (or autocorrelator) ML laser splitter Er-doped Fiber spool 980nm pump PD (or autocorrelator) P 0 is the free parameter What
Progress In Electromagnetics Research Letters, Vol. 33, 27 35, 2012
 Progress In Electromagnetics Research Letters, Vol. 33, 27 35, 2012 TUNABLE WAVELENGTH DEMULTIPLEXER FOR DWDM APPLICATION USING 1-D PHOTONIC CRYSTAL A. Kumar 1, B. Suthar 2, *, V. Kumar 3, Kh. S. Singh