The 2010 Medici Summer School in Management Studies. William Greene Department of Economics Stern School of Business
|
|
|
- Abraham O’Brien’
- 5 years ago
- Views:
Transcription
1 The 2010 Medici Summer School in Management Studies William Greene Department of Economics Stern School of Business
2 Econometric Models When There Are Unusual Events
3 Part 5: Binary Outcomes
4 Agenda General modeling for binary choices Problem of unbalanced data rare events A proposed statistical approach Application to credit card defaults
5 Model Framework Binary outcome: Default in time period [t,t+δ] is 0/1, yes or no Covariates: Economic conditions, individual characteristics Linear regression is inappropriate

6 Simple Binary Choice: Public Insurance

7 Censored Health Satisfaction Scale 0 = Not Healthy 1 = Healthy
8 Default by Credit Cardholders
9 Modeling the Event Discriminant analysis and Z scores Two populations Membership is unknown a priori Discriminant function Z = a + bx is used to classify: If Z > a, classify as group 1 (default) Binary choice analysis One population Membership is only probabilistic Random utility function, U* = a + bx + e Utility function implies a probability of group 1
10 A Random Utility Approach Underlying Preference Scale, U*(x 1 ) Revelation of Preferences: U*(x 1 ) < 0 ===> Choice 0 U*(x 1 ) > 0 ===> Choice 1
11 A Model for Binary Choice Yes or No decision (Buy/Not buy, Do/Not Do) Example, choose to visit physician or not Model: Net utility of visit at least once U visit = + 1 Age + 2 Income + Sex + Choose to visit if net utility is positive Net utility = U visit U not visit Data: X = [1,age,income,sex] y = 1 if choose visit, Uvisit > 0, 0 if not.
12 What Can Be Learned from the Data? (A Sample of Consumers, i = 1,,N) Are the characteristics relevant? Predicting behavior - Individual Will a person buy the add-on insurance? Will a particular bondholder default? - Aggregate What proportion of the population will buy the add-on insurance? What proportion of bonds will default? Analyze changes in behavior when attributes change E.g., how will changes in education change the proportion who buy the insurance?
13 Choosing Between the Two Alternatives Modeling the Binary Choice U visit = + 1 Age + 2 Income + 1 Sex + Chooses to visit: U visit > Age + 2 Income + 1 Sex + > 0 > -[ + 1 Age + 2 Income + 1 Sex ]

14 Probability Model for Choice Between Two Alternatives > -[ + 1 Age + 2 Income + 3 Sex ]
15 An Econometric Model Choose to visit iff Uvisit > 0 Uvisit = + 1 Age + 2 Income + 3 Sex + Uvisit > 0 > -( + 1 Age + 2 Income + 3 Sex) Probability model: For any person observed by the analyst, Prob(visit) = Prob[ > -( + 1 Age + 2 Income + 3 Sex) Note the relationship between the unobserved and the outcome

16 + 1 Age + 2 Income + 3 Sex
17 Modeling Approaches Nonparametric relationship Minimal Assumptions Minimal Conclusions Semiparametric index function Stronger assumptions Robust to model misspecification (heteroscedasticity) Still weak conclusions Parametric Probability function and index Strongest assumptions complete specification Strongest conclusions Possibly less robust. (Not necessarily)

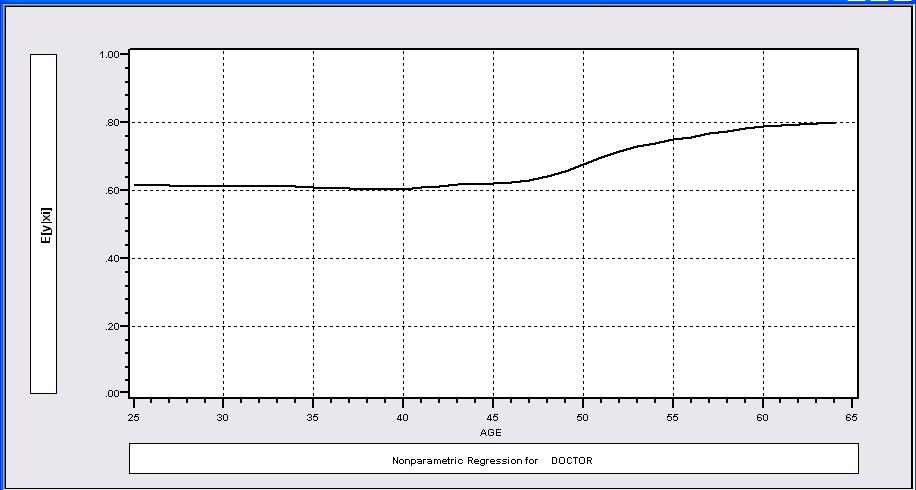
18 Nonparametric Regressions P(Visit)=f(Income) P(Visit)=f(Age)
19 Parametric Model Estimation How to estimate, 1, 2, 3? It s not regression The technique of maximum likelihood L Prob[ y 0] Prob[ y 1] Prob[y=1] = y 0 y 1 Prob[ > -( + 1 Age + 2 Income + 3 Sex)] Prob[y=0] = 1 - Prob[y=1] Requires a model for the probability
20 Estimated Binary Choice Models LOGIT PROBIT EXTREME VALUE Variable Estimate t-ratio Estimate t-ratio Estimate t-ratio Constant Age Income Sex Log-L Log-L(0)
 + 2 (Income) + 3 Sex ( 1 is")
21 Effect on Predicted Probability of an Increase in Age + 1 (Age+1) + 2 (Income) + 3 Sex ( 1 is positive)
22 Marginal Effects in Probability Models Prob[Outcome] = some F( + 1 Income ) Partial effect = F( + 1 Income ) / x (derivative) Partial effects are derivatives Result varies with model Logit: F( + 1 Income ) / x = Prob * (1-Prob) * Probit: F( + 1 Income )/ x = Normal density * Extreme Value: F( + 1 Income )/ x = Prob * (-log Prob) * Scaling usually erases model differences
23 Estimated Partial Effects
24 Marginal Effect for a Dummy Variable Prob[y i = 1 x i,d i ] = F( x i + d i ) = conditional mean Marginal effect of d Prob[y i = 1 x i,d i =1]- Prob[y i = 1 x i,d i =0] Probit: ( d ) ˆ x ˆ ˆ x i
25 Average Partial Effects Probability = P F( ' x ) i P F( ' x ) i i Partial Effect = f ( ' xi) = di xi xi 1 n Average Partial Effect = d i 1 i n are estimates of =E[d ] under certain assumptions. i i
26 P = F(age, age 2, income, female) Nonlinear Effect Binomial Probit Model Dependent variable DOCTOR Log likelihood function Restricted log likelihood Chi squared [ 4 d.f.] Significance level Variable Coefficient Standard Error b/st.er. P[ Z >z] Mean of X Index function for probability Constant *** AGE *** AGESQ.00091*** INCOME * FEMALE.39666*** Note: ***, **, * = Significance at 1%, 5%, 10% level

27 Nonlinear Effects
28 Partial Effect for Nonlinear Terms Prob [ Age Age Income Female] Prob Age [ Age Age Income Female] ( 2 Age) (1) Must be computed for a specific value of Age (2) Compute standard errors using delta method or Krinsky and Robb. (3) Compute confidence intervals for different values of Age. (4) Test of hypothesis that this equals zero is identical to a test that (β + 2β Age) = 0. Is this an interesting hypothesis? 1 2

29 Confidence Limits for Partial Effects
30 Model for Visit Doctor

31 Simple Partial Effects

32 Direct Effect of Age
33 A Problem of Unbalanced Samples Either 0 or 1 heavily dominates the sample Regression methods work poorly or not at all Estimates are imprecise and highly variable Meanings of probabilities and model estimates are questionable
34 Default by Cardholders

35 Add On Insurance Purchase
36 King and Zeng on Rare Events King, G. and Zeng, L., Logistic Regression in Rare Events Data (Available online) King, G. and Zeng, L., Explaining Rare Events in International Relations, International Organization, 55, 3, Summer 2001.
37 Bias correction Proposed Approaches Choice based sampling Sample is sweetened to increase proportion of events that occur Estimates and standard errors are corrected for the nonrandom sampling.

38 A Travel Application: Sydney/Melbourne Fly Ground
39 Choice Based Sample for a Travel Application Sample Population Weight Fly 27.62% 14% Ground 72.38% 86%
40 Choice Based Sampling Correction Maximize Weighted Log Likelihood Covariance Matrix Adjustment V = H -1 G H -1 (all three weighted) H = Hessian G = Outer products of gradients
41 Effect of Choice Based Sampling GC = a general measure of cost TTME = terminal time HINC = household income Unweighted Variable Coefficient Standard Error b/st.er. P[ Z >z] Constant GC TTME HINC Weighting variable CBWT Corrected for Choice Based Sampling Variable Coefficient Standard Error b/st.er. P[ Z >z] Constant GC TTME HINC
42 Modeling Default American Express Cardholders Applications: 13,444 Acceptances: 10,499 Not representative of the population Default Application Accepted Acceptances: 10,499 Default: 996 Not representative of the population

43 Artificially Proportioned Sample True Sample
44 Application
45 Application to Default
46 An Integrated Model With Default and Spending
47 Influence of the Crucial Variable
48 Implication for a Policy Rule
49 Binary Choice Model Problems with Unusual Events Sparse ones Constant term correction WESML Implications for estimation and inference
50 What Did We Learn? Frailty of the model Role of crucial parameters Consequence of biased estimation A possible model/sample based improvement of the calculation
51 Part 6: Models for Counts
52 Application: Major Derogatory Reports AmEx Credit Card Holders N = 13,777 Number of major derogatory reports in 1 year Issues: Nonrandom selection Excess zeros
53 Histogram for Credit Data Histogram for MAJORDRG NOBS= 13444, Too low: 0, Too high: 0 Bin Lower limit Upper limit Frequency Cumulative Frequency ======================================================================== (.8095) (.8095) (.0971) (.9066) (.0397) (.9464) (.0181) (.9645) (.0104) (.9749) (.0082) (.9831) (.0043) (.9874) (.0028) (.9903) (.0024) (.9926) (.0021) (.9947) (.0013) (.9960) (.0016) (.9976) (.0004) (.9980) (.0007) (.9987) (.0004) (.9991) (.0002) (.9993) (.0002) (.9996) (.0001) (.9997) (.0000) (.9997) (.0000) (.9997) (.0000) (.9997) (.0002) (.9999) (.0001) (1.0000)
54 Doctor Visits
55 Basic Modeling for Counts of Events E.g., Visits to site, number of purchases, number of doctor visits Regression approach Quantitative outcome measured Discrete variable, model probabilities Poisson probabilities loglinear model j exp(-λ i)λi Prob[Y i = j xi] = j! λ = exp( β'x ) = E[y i i i x ] i
56 Poisson Model for Doctor Visits Poisson Regression Dependent variable DOCVIS Log likelihood function Restricted log likelihood Chi squared [ 6 d.f.] Significance level McFadden Pseudo R-squared Estimation based on N = 27326, K = 7 Information Criteria: Normalization=1/N Normalized Unnormalized AIC Chi- squared = RsqP=.0818 G - squared = RsqD=.0601 Overdispersion tests: g=mu(i) : Overdispersion tests: g=mu(i)^2: Variable Coefficient Standard Error b/st.er. P[ Z >z] Mean of X Constant.77267*** AGE.01763*** EDUC *** FEMALE.29287*** MARRIED HHNINC *** HHKIDS ***
57 Partial Effects Partial derivatives of expected val. with respect to the vector of characteristics. Effects are averaged over individuals. Observations used for means are All Obs. Conditional Mean at Sample Point Scale Factor for Marginal Effects E[y x x Variable Coefficient Standard Error b/st.er. P[ Z >z] Mean of X AGE.05613*** EDUC *** FEMALE.93237*** MARRIED HHNINC *** HHKIDS *** i i i ] = λ β i
58 Poisson Model Specification Issues Equi-Dispersion: Var[y i x i ] = E[y i x i ]. Overdispersion: If i = exp[ x i + ε i ], E[y i x i ] = γexp[ x i ] Var[y i ] > E[y i ] (overdispersed) ε i ~ log-gamma Negative binomial model ε i ~ Normal[0, 2 ] Normal-mixture model ε i is viewed as unobserved heterogeneity ( frailty ). Normal model may be more natural. Estimation is a bit more complicated.
59 Negative Binomial Specification The Poisson estimator is consistent when there is unmeasured heterogeneity in the conditional mean.therefore, this is a case for the ROBUST covariance matrix estimator. (Neglected heterogeneity that is uncorrelated with x i.)
60 Negative Binomial Specification Prob(Y i =j x i ) has greater mass to the right and left of the mean Conditional mean function is the same as the Poisson: E[y i x i ] = λ i =Exp( x i ), so marginal effects have the same form. Variance is Var[y i x i ] = λ i (1 + α λ i ), α is the overdispersion parameter; α = 0 reverts to the Poisson. Poisson is consistent when NegBin is appropriate. Therefore, this is a case for the ROBUST covariance matrix estimator. (Neglected heterogeneity that is uncorrelated with x i.)
61 NegBin Model for Doctor Visits Negative Binomial Regression Dependent variable DOCVIS Log likelihood function NegBin LogL Restricted log likelihood Poisson LogL Chi squared [ 1 d.f.] Reject Poisson model Significance level McFadden Pseudo R-squared Estimation based on N = 27326, K = 8 Information Criteria: Normalization=1/N Normalized Unnormalized AIC NegBin form 2; Psi(i) = theta Variable Coefficient Standard Error b/st.er. P[ Z >z] Mean of X Constant.80825*** AGE.01806*** EDUC *** FEMALE.32596*** MARRIED HHNINC *** HHKIDS *** Dispersion parameter for count data model Alpha ***
62 Poisson exp( i) i Prob[ Y yi xi], (1 y ) exp( x ), y 0,1,..., i 1,..., N i i i E[ y x ] Var[ y x ] i i i Model Formulations i y i E[y i x i ]=λ i
63 NegBin-1 Model Negative Binomial Regression Dependent variable DOCVIS Log likelihood function Restricted log likelihood NegBin form 1; Psi(i) = theta*exp[bx(i)] Variable Coefficient Standard Error b/st.er. P[ Z >z] Mean of X Constant.62584*** AGE.01428*** EDUC *** FEMALE.33028*** MARRIED.04324** HHNINC *** HHKIDS *** Dispersion parameter for count data model Alpha ***


64 NegBin-P Model Negative Binomial (P) Model Dependent variable DOCVIS Log likelihood function Restricted log likelihood Chi squared [ 1 d.f.] NB-2 NB-1 Poisson Variable Coefficient Standard Error b/st.er Constant.60840*** AGE.01710*** EDUC *** FEMALE.36386*** MARRIED.03670* HHNINC *** HHKIDS *** Dispersion parameter for count data model Alpha *** Negative Binomial. General form, NegBin P P ***
65 Marginal Effects for Different Models Scale Factor for Marginal Effects POISSON Variable Coefficient Standard Error b/st.er. P[ Z >z] Mean of X AGE.05613*** EDUC *** FEMALE.93237*** MARRIED HHNINC *** HHKIDS *** Scale Factor for Marginal Effects NEGATIVE BINOMIAL - 2 AGE.05767*** EDUC *** FEMALE *** MARRIED HHNINC *** HHKIDS *** Scale Factor for Marginal Effects NEGATIVE BINOMIAL - 1 AGE.04547*** EDUC *** FEMALE *** MARRIED.13766** HHNINC *** HHKIDS *** Scale Factor for Marginal Effects NEGATIVE BINOMIAL - P AGE.05143*** EDUC *** FEMALE *** MARRIED.11038* HHNINC *** HHKIDS ***
66 Zero Inflation ZIP Models Two regimes: (Recreation site visits) Zero (with probability 1). (Never visit site) Poisson with Pr(0) = exp[- x i ]. (Number of visits, including zero visits this season.) Unconditional: Pr[0] = P(regime 0) + P(regime 1)*Pr[0 regime 1] Pr[j j >0] = P(regime 1)*Pr[j regime 1] Two inflation Number of children These are latent class models
67 Application: Major Derogatory Reports AmEx Credit Card Holders N = 13,777 Number of major derogatory reports in 1 year Issues: Nonrandom selection Excess zeros
68 Zero Inflation Models ZIP - tau = ZIP(τ) exp(-λ i)λi Prob(y i = j x i) =, λ i = exp( βxi) j! Prob(0 regime) = F( βx ) i j Zero Inflation = ZIP exp(-λ i)λi Prob(y i = j x i) =, λ i = exp( βxi) j! Prob(0 regime) = F( γz ) i j
69 Notes on Zero Inflation Models Poisson is not nested in ZIP. tau = 0 in ZIP(tau) or γ = 0 in ZIP does not produce Poisson; it produces ZIP with P(regime 0) = ½. Standard tests are not appropriate Use Vuong statistic. ZIP model almost always wins. Zero Inflation models extend to NB models ZINB(tau) and ZINB are standard models Creates two sources of overdispersion Generally difficult to estimate
70 ZIP(τ) Model Zero Altered Poisson Regression Model Logistic distribution used for splitting model. ZAP term in probability is F[tau x ln LAMBDA] Comparison of estimated models Pr[0 means] Number of zeros Log-likelihood Poisson Act.= Prd.= Z.I.Poisson Act.= Prd.= Note, the ZIP log-likelihood is not directly comparable. ZIP model with nonzero Q does not encompass the others. Vuong statistic for testing ZIP vs. unaltered model is Distributed as standard normal. A value greater than favors the zero altered Z.I.Poisson model. A value less than rejects the ZIP model Variable Coefficient Standard Error b/st.er. P[ Z >z] Mean of X Poisson/NB/Gamma regression model Constant *** AGE.01140*** EDUC *** FEMALE.13129*** MARRIED *** HHNINC *** HHKIDS *** Zero inflation model Tau ***
71 ZIP Model Zero Altered Poisson Regression Model Logistic distribution used for splitting model. ZAP term in probability is F[tau x Z(i) ] Comparison of estimated models Pr[0 means] Number of zeros Log-likelihood Poisson Act.= Prd.= Z.I.Poisson Act.= Prd.= Vuong statistic for testing ZIP vs. unaltered model is Distributed as standard normal. A value greater than favors the zero altered Z.I.Poisson model. A value less than rejects the ZIP model Variable Coefficient Standard Error b/st.er. P[ Z >z] Mean of X Poisson/NB/Gamma regression model Constant *** AGE.01100*** EDUC *** FEMALE.10943*** MARRIED *** HHNINC *** HHKIDS *** Zero inflation model Constant *** FEMALE *** EDUC.04114***
72 Marginal Effects for Different Models Scale Factor for Marginal Effects POISSON Variable Coefficient Standard Error b/st.er. P[ Z >z] Mean of X AGE.05613*** EDUC *** FEMALE.93237*** MARRIED HHNINC *** HHKIDS *** Scale Factor for Marginal Effects NEGATIVE BINOMIAL - 2 AGE.05767*** EDUC *** FEMALE *** MARRIED HHNINC *** HHKIDS *** Scale Factor for Marginal Effects ZERO INFLATED POISSON AGE.03427*** EDUC *** FEMALE.97958*** MARRIED *** HHNINC *** HHKIDS ***
73 Two part model: A Hurdle Model Model 1: Probability model for more than zero occurrences Model 2: Model for number of occurrences given that the number is greater than zero. Applications common in health economics Usage of health care facilities Use of drugs, alcohol, etc.
74 Hurdle Model Two Part Model Prob[y > 0] = F( γ'x) Prob[y=j] Prob[y=j] Prob[y = j y > 0] = = Prob[y>0] 1 Pr ob[y 0 x] A Poisson Hurdle Model with Logit Hurdle exp( γ'x) Prob[y>0]= 1+exp( γ'x ) j exp(- ) Prob[y=j y>0,x]=, =exp( β'x) j![1 exp(- )] F( γ'x)exp( β'x) E[y x] =0 Prob[y=0]+Prob[y>0] E[y y>0] = 1-exp[-exp( β'x )] Marginal effects involve both parts of the model.
75 Hurdle Model for Doctor Visits Poisson hurdle model for counts Dependent variable DOCVIS Log likelihood function Restricted log likelihood Chi squared [ 1 d.f.] Significance level McFadden Pseudo R-squared Estimation based on N = 27326, K = 10 LOGIT hurdle equation Variable Coefficient Standard Error b/st.er. P[ Z >z] Mean of X Parameters of count model equation Constant *** AGE.01088*** EDUC *** FEMALE.10244*** MARRIED *** HHNINC *** HHKIDS *** Parameters of binary hurdle equation Constant.77475*** FEMALE.59389*** EDUC ***
76 Partial Effects Partial derivatives of expected val. with respect to the vector of characteristics. Effects are averaged over individuals. Observations used for means are All Obs. Conditional Mean at Sample Point.0109 Scale Factor for Marginal Effects Variable Coefficient Standard Error b/st.er. P[ Z >z] Mean of X Effects in Count Model Equation Constant AGE EDUC FEMALE MARRIED HHNINC HHKIDS Effects in Binary Hurdle Equation Constant.86178*** FEMALE.66060*** EDUC *** Combined effect is the sum of the two parts Constant * EDUC *** FEMALE.96915***
77 Quantile Regression for Counts Machado, A. and J. Santos Silva, Quantiles for Counts, Journal of the American Statistical Association, 100, 472, 2005, pp
78 Quantile Regression for Counts Comparable to quantile regression for a continuous variable Sensitivity to outlying observations is less a problem for count data estimators than for regressions ML, not least squares Quantiles for counts may be more interestintg
79 Unusual Counts
80 Mean vs. Median Regression Poisson Regression LHS=MAJORDRG Mean = Standard deviation = Number of observs. = Standard Prob. Mean MAJORDRG Coefficient Error z z> Z of X Constant *** AGE.01388*** ACADMOS.00180*** OWNRENT *** HINC SELFEMPL Quantile Regression Model. Quantile = Minimum = t= quantile = Maximum = Constant *** AGE.01249*** ACADMOS.00248*** OWNRENT HINC.05112* SELFEMPL
81 Partial Effects Partial derivatives of expected val. with respect to the vector of characteristics. Effects are averaged over individuals. Observations used for means are All Obs. Conditional Mean at Sample Point.4628 Scale Factor for Marginal Effects Standard Prob. Mean MAJORDRG Coefficient Error z z> Z of X AGE.00642*** ACADMOS.00083***.9631D OWNRENT *** HINC SELFEMPL Partial Effects for Quantile Count Regression Variable Value Partial Effect Semi-Elasticity AGE ACADMOS *OWNRENT HINC *SELFEMPL * = Dummy variable. Other variables fixed at means
82 What Have We Learned? Models for Count Data Data sets contain unusual configurations Preponderance of zeros Unusually large observations For the preponderance of zeros case, build a richer specification Zero inflation models Two part or hurcle models For the unusually large observations, a quantile regression may be more interesting

83 Wild Observations Dialysis patients? Any broad model will assign infinitesimally small probabilities. These observations will not be explained by the model.
84 Part 7: What Have We Learned?
85 Rare Events vs. Unusual Events Assigning probabilities: What function do probabilities serve? Using information from experts a Bayesian approach Rare events are not merely events that have low probability in the context of the sampling frame. Rare events are essentially outside the realm of historical experience and therefore outside the reach of econometric models Events with low probability in that frame are unusual
86 Econometric Modeling Perhaps it is too ambitious to hope to build econometric models for rare events Models can be readily extended to accommodate unusual events within the context of the sampling frame.
87 Unusual Events and Outliers Outliers are unusual in the context of the model Outlier is a subjective term. Computers cannot appropriately determine that observations are outliers Models may be merely inadequate. Outliers may be a consequence of the specification.
88 A Poisson Model is Inappropriate Experiment: Pick an individual from the population and assign a probability to the observed outcome = number of visits. For the K = 51: 1/27326 = ? This will vastly overestimate the probability. Costly. By a Poisson model: K exp(-μ)μ P(K) =,μ =E[K] = K! P(51) = ???
89 Regression Modeling Outliers and unusual observations in the context of the linear regression model Quantile regression model A way to immunize least squares from extreme observations A tool to study different features of the population (other than the conditional mean function)
90 Binary Choice Standard methods of modeling for binary outcomes Nonstandard situations Preponderance of ones or zeros Adjusting binary choice analysis for unusual events An adjustment to standard inference procedures, not a new modeling framework
91 Models for Count Data Standard methods of analyzing counts Nonstandard data sets have preponderance of zeros Two part models that accommodate two decisions Zero inflation models that accommodate a richer data generating process Extreme values Standard count methods are less affected Quantile models for counts are useful in the same way that quantile regression for continuous data is.
92 Econometric Models for Rare Events Econometric models assume there is and has been order in the universe. Rare events are outside the realm of this modeling paradigm. An event, by its nature, is not a draw from a stable data generating process. Hence, we build econometric models that accommodate unusual events.
93 Thank You! William Greene Department of Economics Stern School of Business
Discrete Choice Modeling
 [Part 6] 1/55 0 Introduction 1 Summary 2 Binary Choice 3 Panel Data 4 Bivariate Probit 5 Ordered Choice 6 7 Multinomial Choice 8 Nested Logit 9 Heterogeneity 10 Latent Class 11 Mixed Logit 12 Stated Preference
Discrete Choice Modeling
 [Part 4] 1/43 Discrete Choice Modeling 0 Introduction 1 Summary 2 Binary Choice 3 Panel Data 4 Bivariate Probit 5 Ordered Choice 6 Count Data 7 Multinomial Choice 8 Nested Logit 9 Heterogeneity 10 Latent
Spatial Discrete Choice Models
 Spatial Discrete Choice Models Professor William Greene Stern School of Business, New York University SPATIAL ECONOMETRICS ADVANCED INSTITUTE University of Rome May 23, 2011 Spatial Correlation Spatially
Mohammed. Research in Pharmacoepidemiology National School of Pharmacy, University of Otago
 Mohammed Research in Pharmacoepidemiology (RIPE) @ National School of Pharmacy, University of Otago What is zero inflation? Suppose you want to study hippos and the effect of habitat variables on their
Lecture-19: Modeling Count Data II
 Lecture-19: Modeling Count Data II 1 In Today s Class Recap of Count data models Truncated count data models Zero-inflated models Panel count data models R-implementation 2 Count Data In many a phenomena
Parametric Modelling of Over-dispersed Count Data. Part III / MMath (Applied Statistics) 1
 1") Parametric Modelling of Over-dispersed Count Data Part III / MMath (Applied Statistics) 1 Introduction Poisson regression is the de facto approach for handling count data What happens then when Poisson
Parametric Modelling of Over-dispersed Count Data Part III / MMath (Applied Statistics) 1 Introduction Poisson regression is the de facto approach for handling count data What happens then when Poisson
MODELING COUNT DATA Joseph M. Hilbe
 MODELING COUNT DATA Joseph M. Hilbe Arizona State University Count models are a subset of discrete response regression models. Count data are distributed as non-negative integers, are intrinsically heteroskedastic,
Inference and Regression
 Name Inference and Regression Final Examination, 2015 Department of IOMS This course and this examination are governed by the Stern Honor Code. Instructions Please write your name at the top of this page.
NELS 88. Latent Response Variable Formulation Versus Probability Curve Formulation
 NELS 88 Table 2.3 Adjusted odds ratios of eighth-grade students in 988 performing below basic levels of reading and mathematics in 988 and dropping out of school, 988 to 990, by basic demographics Variable
Lab 3: Two levels Poisson models (taken from Multilevel and Longitudinal Modeling Using Stata, p )
") Lab 3: Two levels Poisson models (taken from Multilevel and Longitudinal Modeling Using Stata, p. 376-390) BIO656 2009 Goal: To see if a major health-care reform which took place in 1997 in Germany was
Lab 3: Two levels Poisson models (taken from Multilevel and Longitudinal Modeling Using Stata, p. 376-390) BIO656 2009 Goal: To see if a major health-care reform which took place in 1997 in Germany was
ECONOMETRICS I Take Home Final Examination
 Department of Economics ECONOMETRICS I Take Home Final Examination Fall 2016 Professor William Greene Phone: 212.998.0876 Office: KMC 7-90 URL: people.stern.nyu.edu/wgreene e-mail: wgreene@stern.nyu.edu
Poisson Regression. Ryan Godwin. ECON University of Manitoba
 Poisson Regression Ryan Godwin ECON 7010 - University of Manitoba Abstract. These lecture notes introduce Maximum Likelihood Estimation (MLE) of a Poisson regression model. 1 Motivating the Poisson Regression
Testing and Model Selection
 Testing and Model Selection This is another digression on general statistics: see PE App C.8.4. The EViews output for least squares, probit and logit includes some statistics relevant to testing hypotheses
DEEP, University of Lausanne Lectures on Econometric Analysis of Count Data Pravin K. Trivedi May 2005
 DEEP, University of Lausanne Lectures on Econometric Analysis of Count Data Pravin K. Trivedi May 2005 The lectures will survey the topic of count regression with emphasis on the role on unobserved heterogeneity.
Inference and Regression
 Name Inference and Regression Final Examination, 2016 Department of IOMS This course and this examination are governed by the Stern Honor Code. Instructions Please write your name at the top of this page.
Analysis of Count Data A Business Perspective. George J. Hurley Sr. Research Manager The Hershey Company Milwaukee June 2013
 Analysis of Count Data A Business Perspective George J. Hurley Sr. Research Manager The Hershey Company Milwaukee June 2013 Overview Count data Methods Conclusions 2 Count data Count data Anything with
Econometric Analysis of Panel Data. Final Examination: Spring 2018
 Department of Economics Econometric Analysis of Panel Data Professor William Greene Phone: 212.998.0876 Office: KMC 7-90 Home page: people.stern.nyu.edu/wgreene Email: wgreene@stern.nyu.edu URL for course
Chapter 11. Regression with a Binary Dependent Variable
 Chapter 11 Regression with a Binary Dependent Variable 2 Regression with a Binary Dependent Variable (SW Chapter 11) So far the dependent variable (Y) has been continuous: district-wide average test score
Instructions: Closed book, notes, and no electronic devices. Points (out of 200) in parentheses
 in parentheses") ISQS 5349 Final Spring 2011 Instructions: Closed book, notes, and no electronic devices. Points (out of 200) in parentheses 1. (10) What is the definition of a regression model that we have used throughout
ISQS 5349 Final Spring 2011 Instructions: Closed book, notes, and no electronic devices. Points (out of 200) in parentheses 1. (10) What is the definition of a regression model that we have used throughout
Binary Choice Models Probit & Logit. = 0 with Pr = 0 = 1. decision-making purchase of durable consumer products unemployment
 BINARY CHOICE MODELS Y ( Y ) ( Y ) 1 with Pr = 1 = P = 0 with Pr = 0 = 1 P Examples: decision-making purchase of durable consumer products unemployment Estimation with OLS? Yi = Xiβ + εi Problems: nonsense
Semiparametric Generalized Linear Models
 Semiparametric Generalized Linear Models North American Stata Users Group Meeting Chicago, Illinois Paul Rathouz Department of Health Studies University of Chicago prathouz@uchicago.edu Liping Gao MS Student
Review of Panel Data Model Types Next Steps. Panel GLMs. Department of Political Science and Government Aarhus University.
 Panel GLMs Department of Political Science and Government Aarhus University May 12, 2015 1 Review of Panel Data 2 Model Types 3 Review and Looking Forward 1 Review of Panel Data 2 Model Types 3 Review
ECON 594: Lecture #6
 ECON 594: Lecture #6 Thomas Lemieux Vancouver School of Economics, UBC May 2018 1 Limited dependent variables: introduction Up to now, we have been implicitly assuming that the dependent variable, y, was
Econometrics I. Professor William Greene Stern School of Business Department of Economics 1-1/40. Part 1: Introduction
 Econometrics I Professor William Greene Stern School of Business Department of Economics 1-1/40 http://people.stern.nyu.edu/wgreene/econometrics/econometrics.htm 1-2/40 Overview: This is an intermediate
Multilevel Statistical Models: 3 rd edition, 2003 Contents
 Multilevel Statistical Models: 3 rd edition, 2003 Contents Preface Acknowledgements Notation Two and three level models. A general classification notation and diagram Glossary Chapter 1 An introduction
Lecture 3.1 Basic Logistic LDA
 y Lecture.1 Basic Logistic LDA 0.2.4.6.8 1 Outline Quick Refresher on Ordinary Logistic Regression and Stata Women s employment example Cross-Over Trial LDA Example -100-50 0 50 100 -- Longitudinal Data
Introduction to Regression Analysis. Dr. Devlina Chatterjee 11 th August, 2017
 Introduction to Regression Analysis Dr. Devlina Chatterjee 11 th August, 2017 What is regression analysis? Regression analysis is a statistical technique for studying linear relationships. One dependent
Linear Regression With Special Variables
 Linear Regression With Special Variables Junhui Qian December 21, 2014 Outline Standardized Scores Quadratic Terms Interaction Terms Binary Explanatory Variables Binary Choice Models Standardized Scores:
Chapter 11 The COUNTREG Procedure (Experimental)
") Chapter 11 The COUNTREG Procedure (Experimental) Chapter Contents OVERVIEW................................... 419 GETTING STARTED.............................. 420 SYNTAX.....................................
Chapter 11 The COUNTREG Procedure (Experimental) Chapter Contents OVERVIEW................................... 419 GETTING STARTED.............................. 420 SYNTAX.....................................
Ninth ARTNeT Capacity Building Workshop for Trade Research "Trade Flows and Trade Policy Analysis"
 Ninth ARTNeT Capacity Building Workshop for Trade Research "Trade Flows and Trade Policy Analysis" June 2013 Bangkok, Thailand Cosimo Beverelli and Rainer Lanz (World Trade Organization) 1 Selected econometric
Generalized linear models
 Generalized linear models Douglas Bates November 01, 2010 Contents 1 Definition 1 2 Links 2 3 Estimating parameters 5 4 Example 6 5 Model building 8 6 Conclusions 8 7 Summary 9 1 Generalized Linear Models
Non-linear panel data modeling
 Non-linear panel data modeling Laura Magazzini University of Verona laura.magazzini@univr.it http://dse.univr.it/magazzini May 2010 Laura Magazzini (@univr.it) Non-linear panel data modeling May 2010 1
Comparing IRT with Other Models
 Comparing IRT with Other Models Lecture #14 ICPSR Item Response Theory Workshop Lecture #14: 1of 45 Lecture Overview The final set of slides will describe a parallel between IRT and another commonly used
Econometrics Lecture 5: Limited Dependent Variable Models: Logit and Probit
 Econometrics Lecture 5: Limited Dependent Variable Models: Logit and Probit R. G. Pierse 1 Introduction In lecture 5 of last semester s course, we looked at the reasons for including dichotomous variables
STAT 7030: Categorical Data Analysis
 STAT 7030: Categorical Data Analysis 5. Logistic Regression Peng Zeng Department of Mathematics and Statistics Auburn University Fall 2012 Peng Zeng (Auburn University) STAT 7030 Lecture Notes Fall 2012
Stat 5101 Lecture Notes
 Stat 5101 Lecture Notes Charles J. Geyer Copyright 1998, 1999, 2000, 2001 by Charles J. Geyer May 7, 2001 ii Stat 5101 (Geyer) Course Notes Contents 1 Random Variables and Change of Variables 1 1.1 Random
Econometric Analysis of Panel Data. Final Examination: Spring 2013
 Econometric Analysis of Panel Data Professor William Greene Phone: 212.998.0876 Office: KMC 7-90 Home page:www.stern.nyu.edu/~wgreene Email: wgreene@stern.nyu.edu URL for course web page: people.stern.nyu.edu/wgreene/econometrics/paneldataeconometrics.htm
Final Exam. Name: Solution:
 Final Exam. Name: Instructions. Answer all questions on the exam. Open books, open notes, but no electronic devices. The first 13 problems are worth 5 points each. The rest are worth 1 point each. HW1.
Generalized linear models
 Generalized linear models Christopher F Baum ECON 8823: Applied Econometrics Boston College, Spring 2016 Christopher F Baum (BC / DIW) Generalized linear models Boston College, Spring 2016 1 / 1 Introduction
ECONOMETRICS HONOR S EXAM REVIEW SESSION
 ECONOMETRICS HONOR S EXAM REVIEW SESSION Eunice Han ehan@fas.harvard.edu March 26 th, 2013 Harvard University Information 2 Exam: April 3 rd 3-6pm @ Emerson 105 Bring a calculator and extra pens. Notes
Class Notes: Week 8. Probit versus Logit Link Functions and Count Data
 Ronald Heck Class Notes: Week 8 1 Class Notes: Week 8 Probit versus Logit Link Functions and Count Data This week we ll take up a couple of issues. The first is working with a probit link function. While
Partial effects in fixed effects models
 1 Partial effects in fixed effects models J.M.C. Santos Silva School of Economics, University of Surrey Gordon C.R. Kemp Department of Economics, University of Essex 22 nd London Stata Users Group Meeting
Lecture 10: Alternatives to OLS with limited dependent variables. PEA vs APE Logit/Probit Poisson
 Lecture 10: Alternatives to OLS with limited dependent variables PEA vs APE Logit/Probit Poisson PEA vs APE PEA: partial effect at the average The effect of some x on y for a hypothetical case with sample
Binary Dependent Variable. Regression with a
 Beykent University Faculty of Business and Economics Department of Economics Econometrics II Yrd.Doç.Dr. Özgür Ömer Ersin Regression with a Binary Dependent Variable (SW Chapter 11) SW Ch. 11 1/59 Regression
Generalized Linear Models for Count, Skewed, and If and How Much Outcomes
 Generalized Linear Models for Count, Skewed, and If and How Much Outcomes Today s Class: Review of 3 parts of a generalized model Models for discrete count or continuous skewed outcomes Models for two-part
ST3241 Categorical Data Analysis I Generalized Linear Models. Introduction and Some Examples
 ST3241 Categorical Data Analysis I Generalized Linear Models Introduction and Some Examples 1 Introduction We have discussed methods for analyzing associations in two-way and three-way tables. Now we will
Truncation and Censoring
 Truncation and Censoring Laura Magazzini laura.magazzini@univr.it Laura Magazzini (@univr.it) Truncation and Censoring 1 / 35 Truncation and censoring Truncation: sample data are drawn from a subset of
Introduction to Statistical Analysis
 Introduction to Statistical Analysis Changyu Shen Richard A. and Susan F. Smith Center for Outcomes Research in Cardiology Beth Israel Deaconess Medical Center Harvard Medical School Objectives Descriptive
A Course in Applied Econometrics Lecture 14: Control Functions and Related Methods. Jeff Wooldridge IRP Lectures, UW Madison, August 2008
 A Course in Applied Econometrics Lecture 14: Control Functions and Related Methods Jeff Wooldridge IRP Lectures, UW Madison, August 2008 1. Linear-in-Parameters Models: IV versus Control Functions 2. Correlated
Generalized Linear Models for Non-Normal Data
 Generalized Linear Models for Non-Normal Data Today s Class: 3 parts of a generalized model Models for binary outcomes Complications for generalized multivariate or multilevel models SPLH 861: Lecture
Compare Predicted Counts between Groups of Zero Truncated Poisson Regression Model based on Recycled Predictions Method
 Compare Predicted Counts between Groups of Zero Truncated Poisson Regression Model based on Recycled Predictions Method Yan Wang 1, Michael Ong 2, Honghu Liu 1,2,3 1 Department of Biostatistics, UCLA School
Econometrics Honor s Exam Review Session. Spring 2012 Eunice Han
 Econometrics Honor s Exam Review Session Spring 2012 Eunice Han Topics 1. OLS The Assumptions Omitted Variable Bias Conditional Mean Independence Hypothesis Testing and Confidence Intervals Homoskedasticity
Applied Economics. Regression with a Binary Dependent Variable. Department of Economics Universidad Carlos III de Madrid
 Applied Economics Regression with a Binary Dependent Variable Department of Economics Universidad Carlos III de Madrid See Stock and Watson (chapter 11) 1 / 28 Binary Dependent Variables: What is Different?
Chapter 10 Nonlinear Models
 Chapter 10 Nonlinear Models Nonlinear models can be classified into two categories. In the first category are models that are nonlinear in the variables, but still linear in terms of the unknown parameters.
Marginal and Interaction Effects in Ordered Response Models
 MPRA Munich Personal RePEc Archive Marginal and Interaction Effects in Ordered Response Models Debdulal Mallick School of Accounting, Economics and Finance, Deakin University, Burwood, Victoria, Australia
Economics 671: Applied Econometrics Department of Economics, Finance and Legal Studies University of Alabama
 Problem Set #1 (Random Data Generation) 1. Generate =500random numbers from both the uniform 1 ( [0 1], uniformbetween zero and one) and exponential exp ( ) (set =2and let [0 1]) distributions. Plot the
Regression with a Single Regressor: Hypothesis Tests and Confidence Intervals
 Regression with a Single Regressor: Hypothesis Tests and Confidence Intervals (SW Chapter 5) Outline. The standard error of ˆ. Hypothesis tests concerning β 3. Confidence intervals for β 4. Regression
MULTIPLE REGRESSION AND ISSUES IN REGRESSION ANALYSIS
 MULTIPLE REGRESSION AND ISSUES IN REGRESSION ANALYSIS Page 1 MSR = Mean Regression Sum of Squares MSE = Mean Squared Error RSS = Regression Sum of Squares SSE = Sum of Squared Errors/Residuals α = Level
Models for Binary Outcomes
 Models for Binary Outcomes Introduction The simple or binary response (for example, success or failure) analysis models the relationship between a binary response variable and one or more explanatory variables.
You can specify the response in the form of a single variable or in the form of a ratio of two variables denoted events/trials.
 The GENMOD Procedure MODEL Statement MODEL response = < effects > < /options > ; MODEL events/trials = < effects > < /options > ; You can specify the response in the form of a single variable or in the
A CASE STUDY IN HANDLING OVER-DISPERSION IN NEMATODE COUNT DATA SCOTT EDWIN DOUGLAS KREIDER. B.S., The College of William & Mary, 2008 A THESIS
 A CASE STUDY IN HANDLING OVER-DISPERSION IN NEMATODE COUNT DATA by SCOTT EDWIN DOUGLAS KREIDER B.S., The College of William & Mary, 2008 A THESIS submitted in partial fulfillment of the requirements for
Causal Hazard Ratio Estimation By Instrumental Variables or Principal Stratification. Todd MacKenzie, PhD
 Causal Hazard Ratio Estimation By Instrumental Variables or Principal Stratification Todd MacKenzie, PhD Collaborators A. James O Malley Tor Tosteson Therese Stukel 2 Overview 1. Instrumental variable
Statistical Methods III Statistics 212. Problem Set 2 - Answer Key
 Statistical Methods III Statistics 212 Problem Set 2 - Answer Key 1. (Analysis to be turned in and discussed on Tuesday, April 24th) The data for this problem are taken from long-term followup of 1423
Applied Health Economics (for B.Sc.)
") Applied Health Economics (for B.Sc.) Helmut Farbmacher Department of Economics University of Mannheim Autumn Semester 2017 Outlook 1 Linear models (OLS, Omitted variables, 2SLS) 2 Limited and qualitative
Applied Health Economics (for B.Sc.) Helmut Farbmacher Department of Economics University of Mannheim Autumn Semester 2017 Outlook 1 Linear models (OLS, Omitted variables, 2SLS) 2 Limited and qualitative
Limited Dependent Variable Models II
 Limited Dependent Variable Models II Fall 2008 Environmental Econometrics (GR03) LDV Fall 2008 1 / 15 Models with Multiple Choices The binary response model was dealing with a decision problem with two
Lab 07 Introduction to Econometrics
 Lab 07 Introduction to Econometrics Learning outcomes for this lab: Introduce the different typologies of data and the econometric models that can be used Understand the rationale behind econometrics Understand
A simple bivariate count data regression model. Abstract
 A simple bivariate count data regression model Shiferaw Gurmu Georgia State University John Elder North Dakota State University Abstract This paper develops a simple bivariate count data regression model
8 Nominal and Ordinal Logistic Regression
 8 Nominal and Ordinal Logistic Regression 8.1 Introduction If the response variable is categorical, with more then two categories, then there are two options for generalized linear models. One relies on
What s New in Econometrics? Lecture 14 Quantile Methods
 What s New in Econometrics? Lecture 14 Quantile Methods Jeff Wooldridge NBER Summer Institute, 2007 1. Reminders About Means, Medians, and Quantiles 2. Some Useful Asymptotic Results 3. Quantile Regression
Introduction to GSEM in Stata
 Introduction to GSEM in Stata Christopher F Baum ECON 8823: Applied Econometrics Boston College, Spring 2016 Christopher F Baum (BC / DIW) Introduction to GSEM in Stata Boston College, Spring 2016 1 /
Lecture 12: Application of Maximum Likelihood Estimation:Truncation, Censoring, and Corner Solutions
 Econ 513, USC, Department of Economics Lecture 12: Application of Maximum Likelihood Estimation:Truncation, Censoring, and Corner Solutions I Introduction Here we look at a set of complications with the
Chapter 9 Regression with a Binary Dependent Variable. Multiple Choice. 1) The binary dependent variable model is an example of a
 The binary dependent variable model is an example of a") Chapter 9 Regression with a Binary Dependent Variable Multiple Choice ) The binary dependent variable model is an example of a a. regression model, which has as a regressor, among others, a binary variable.
Chapter 9 Regression with a Binary Dependent Variable Multiple Choice ) The binary dependent variable model is an example of a a. regression model, which has as a regressor, among others, a binary variable.
Logistic & Tobit Regression
 Logistic & Tobit Regression Different Types of Regression Binary Regression (D) Logistic transformation + e P( y x) = 1 + e! " x! + " x " P( y x) % ln$ ' = ( + ) x # 1! P( y x) & logit of P(y x){ P(y
Zero inflated negative binomial-generalized exponential distribution and its applications
 Songklanakarin J. Sci. Technol. 6 (4), 48-491, Jul. - Aug. 014 http://www.sst.psu.ac.th Original Article Zero inflated negative binomial-generalized eponential distribution and its applications Sirinapa
Econometric Analysis of Cross Section and Panel Data
 Econometric Analysis of Cross Section and Panel Data Jeffrey M. Wooldridge / The MIT Press Cambridge, Massachusetts London, England Contents Preface Acknowledgments xvii xxiii I INTRODUCTION AND BACKGROUND
Econ 673: Microeconometrics
 Econ 673: Microeconometrics Chapter 4: Properties of Discrete Choice Models Fall 2008 Herriges (ISU) Chapter 4: Discrete Choice Models Fall 2008 1 / 29 Outline 1 2 Deriving Choice Probabilities 3 Identification
Hierarchical Generalized Linear Models. ERSH 8990 REMS Seminar on HLM Last Lecture!
 Hierarchical Generalized Linear Models ERSH 8990 REMS Seminar on HLM Last Lecture! Hierarchical Generalized Linear Models Introduction to generalized models Models for binary outcomes Interpreting parameter
Applied Machine Learning Annalisa Marsico
 Applied Machine Learning Annalisa Marsico OWL RNA Bionformatics group Max Planck Institute for Molecular Genetics Free University of Berlin 22 April, SoSe 2015 Goals Feature Selection rather than Feature
Unit 11: Multiple Linear Regression
 Unit 11: Multiple Linear Regression Statistics 571: Statistical Methods Ramón V. León 7/13/2004 Unit 11 - Stat 571 - Ramón V. León 1 Main Application of Multiple Regression Isolating the effect of a variable
Longitudinal Data Analysis Using Stata Paul D. Allison, Ph.D. Upcoming Seminar: May 18-19, 2017, Chicago, Illinois
 Longitudinal Data Analysis Using Stata Paul D. Allison, Ph.D. Upcoming Seminar: May 18-19, 217, Chicago, Illinois Outline 1. Opportunities and challenges of panel data. a. Data requirements b. Control
Generalized Multilevel Models for Non-Normal Outcomes
 Generalized Multilevel Models for Non-Normal Outcomes Topics: 3 parts of a generalized (multilevel) model Models for binary, proportion, and categorical outcomes Complications for generalized multilevel
Generalized Linear. Mixed Models. Methods and Applications. Modern Concepts, Walter W. Stroup. Texts in Statistical Science.
 Texts in Statistical Science Generalized Linear Mixed Models Modern Concepts, Methods and Applications Walter W. Stroup CRC Press Taylor & Francis Croup Boca Raton London New York CRC Press is an imprint
Business Statistics. Lecture 9: Simple Regression
 Business Statistics Lecture 9: Simple Regression 1 On to Model Building! Up to now, class was about descriptive and inferential statistics Numerical and graphical summaries of data Confidence intervals
Introduction to Econometrics
 Introduction to Econometrics T H I R D E D I T I O N Global Edition James H. Stock Harvard University Mark W. Watson Princeton University Boston Columbus Indianapolis New York San Francisco Upper Saddle
Making sense of Econometrics: Basics
 Making sense of Econometrics: Basics Lecture 4: Qualitative influences and Heteroskedasticity Egypt Scholars Economic Society November 1, 2014 Assignment & feedback enter classroom at http://b.socrative.com/login/student/
Endogenous Treatment Effects for Count Data Models with Endogenous Participation or Sample Selection
 Endogenous Treatment Effects for Count Data Models with Endogenous Participation or Sample Selection Massimilano Bratti & Alfonso Miranda Institute of Education University of London c Bratti&Miranda (p.
Statistics: A review. Why statistics?
 Statistics: A review Why statistics? What statistical concepts should we know? Why statistics? To summarize, to explore, to look for relations, to predict What kinds of data exist? Nominal, Ordinal, Interval
Even Simpler Standard Errors for Two-Stage Optimization Estimators: Mata Implementation via the DERIV Command
 Even Simpler Standard Errors for Two-Stage Optimization Estimators: Mata Implementation via the DERIV Command by Joseph V. Terza Department of Economics Indiana University Purdue University Indianapolis
disc choice5.tex; April 11, ffl See: King - Unifying Political Methodology ffl See: King/Tomz/Wittenberg (1998, APSA Meeting). ffl See: Alvarez
. ffl See: Alvarez") disc choice5.tex; April 11, 2001 1 Lecture Notes on Discrete Choice Models Copyright, April 11, 2001 Jonathan Nagler 1 Topics 1. Review the Latent Varible Setup For Binary Choice ffl Logit ffl Likelihood
disc choice5.tex; April 11, 2001 1 Lecture Notes on Discrete Choice Models Copyright, April 11, 2001 Jonathan Nagler 1 Topics 1. Review the Latent Varible Setup For Binary Choice ffl Logit ffl Likelihood
Propensity Score Weighting with Multilevel Data
 Propensity Score Weighting with Multilevel Data Fan Li Department of Statistical Science Duke University October 25, 2012 Joint work with Alan Zaslavsky and Mary Beth Landrum Introduction In comparative
Binomial Model. Lecture 10: Introduction to Logistic Regression. Logistic Regression. Binomial Distribution. n independent trials
 Lecture : Introduction to Logistic Regression Ani Manichaikul amanicha@jhsph.edu 2 May 27 Binomial Model n independent trials (e.g., coin tosses) p = probability of success on each trial (e.g., p =! =
Identification and Estimation Using Heteroscedasticity Without Instruments: The Binary Endogenous Regressor Case
 Identification and Estimation Using Heteroscedasticity Without Instruments: The Binary Endogenous Regressor Case Arthur Lewbel Boston College December 2016 Abstract Lewbel (2012) provides an estimator
Institute of Actuaries of India
 Institute of Actuaries of India Subject CT3 Probability and Mathematical Statistics For 2018 Examinations Subject CT3 Probability and Mathematical Statistics Core Technical Syllabus 1 June 2017 Aim The
A Guide to Modern Econometric:
 A Guide to Modern Econometric: 4th edition Marno Verbeek Rotterdam School of Management, Erasmus University, Rotterdam B 379887 )WILEY A John Wiley & Sons, Ltd., Publication Contents Preface xiii 1 Introduction
A Joint Tour-Based Model of Vehicle Type Choice and Tour Length
 A Joint Tour-Based Model of Vehicle Type Choice and Tour Length Ram M. Pendyala School of Sustainable Engineering & the Built Environment Arizona State University Tempe, AZ Northwestern University, Evanston,
What s New in Econometrics. Lecture 1
 What s New in Econometrics Lecture 1 Estimation of Average Treatment Effects Under Unconfoundedness Guido Imbens NBER Summer Institute, 2007 Outline 1. Introduction 2. Potential Outcomes 3. Estimands and
Course Notes: Statistical and Econometric Methods
 Course Notes: Statistical and Econometric Methods h(t) 4 2 0 h 1 (t) h (t) 2 h (t) 3 1 2 3 4 5 t h (t) 4 1.0 0.5 0 1 2 3 4 t F(t) h(t) S(t) f(t) sn + + + + + + + + + + + + + + + + + + + + + + + + - - -
Lecture 10: Introduction to Logistic Regression
 Lecture 10: Introduction to Logistic Regression Ani Manichaikul amanicha@jhsph.edu 2 May 2007 Logistic Regression Regression for a response variable that follows a binomial distribution Recall the binomial
CARLETON ECONOMIC PAPERS
 CEP 16-01 The Role of Model Specification in Estimating Health Care Demand Hossein Kavand Carleton University Marcel-Cristian Voia Carleton University January 2016 CARLETON ECONOMIC PAPERS Department of
Lecture 2: Poisson and logistic regression
 Dankmar Böhning Southampton Statistical Sciences Research Institute University of Southampton, UK S 3 RI, 11-12 December 2014 introduction to Poisson regression application to the BELCAP study introduction