Binary Choice Models Probit & Logit. = 0 with Pr = 0 = 1. decision-making purchase of durable consumer products unemployment
|
|
|
- Tabitha Palmer
- 6 years ago
- Views:
Transcription
1 BINARY CHOICE MODELS Y ( Y ) ( Y ) 1 with Pr = 1 = P = 0 with Pr = 0 = 1 P Examples: decision-making purchase of durable consumer products unemployment Estimation with OLS? Yi = Xiβ + εi Problems: nonsense predictions ( < 0, > 1) functional form: linear parameters always have the same effect ε heteroskedastic 1
2 2
3 Binary Variables E( y ) = µ Var( y ) = µ (1 µ ) because: Var( y): E ( y µ ) = E( y 2 yµ + µ ) = 2 2 E( y ) 2 µ E( y) + µ 2 since y = 1 or 0 E( y ) = E( y ) = µ 2 2 Var (y) = µ 2 µ + µ = µ (1 µ ) Heteroskedasticity Variance increases with xβ... ( µ ) 3
4 LATENT VARIABLES e.g. employment decision (0 or 1) Must be based on a latent propensity to work Y i * : (based on labor supply) Y = X β + ε * i i i Y i 1 if Y * > 0 = i 0 if Y * 0 i other values are possible thresholds as well 4
5 ( ) ( ) P= Pr Y = 1 = F Xβ with F as symmetric cumulative probability density. F( Xβ ) X β + F( Xβ ) lim = 1 lim = 0 X β Therefore: Y = 1 if Y * > 0 X β + ε > 0 X β > ε ε > X β i i i i Pr ( Y = 1) = Pr ( ε > Xβ) = F( Xβ) Pr ( Y = 0) = 1 F( Xβ ) 5
6 6
7 MAXIMUM LIKELIHOOD ESTIMATION The likelihood of receiving a certain result Y i in the sample can be maximised via the choice of an adequate parameter β. ( ) L = Pr Y = y, Y = y,, Y = y = N i= ( β) F( X β) = 1 F X i = i Y = 0 Y = 1 i N = 1 F X i= 1 i 1 yi ( β) F( X β) i ( ) ( β) ( β) { } i i i i ln L = 1 y ln 1 F X + y ln F X MAX β Log-likelihood function is globally concave ==> unique global maximum N i N y i 7
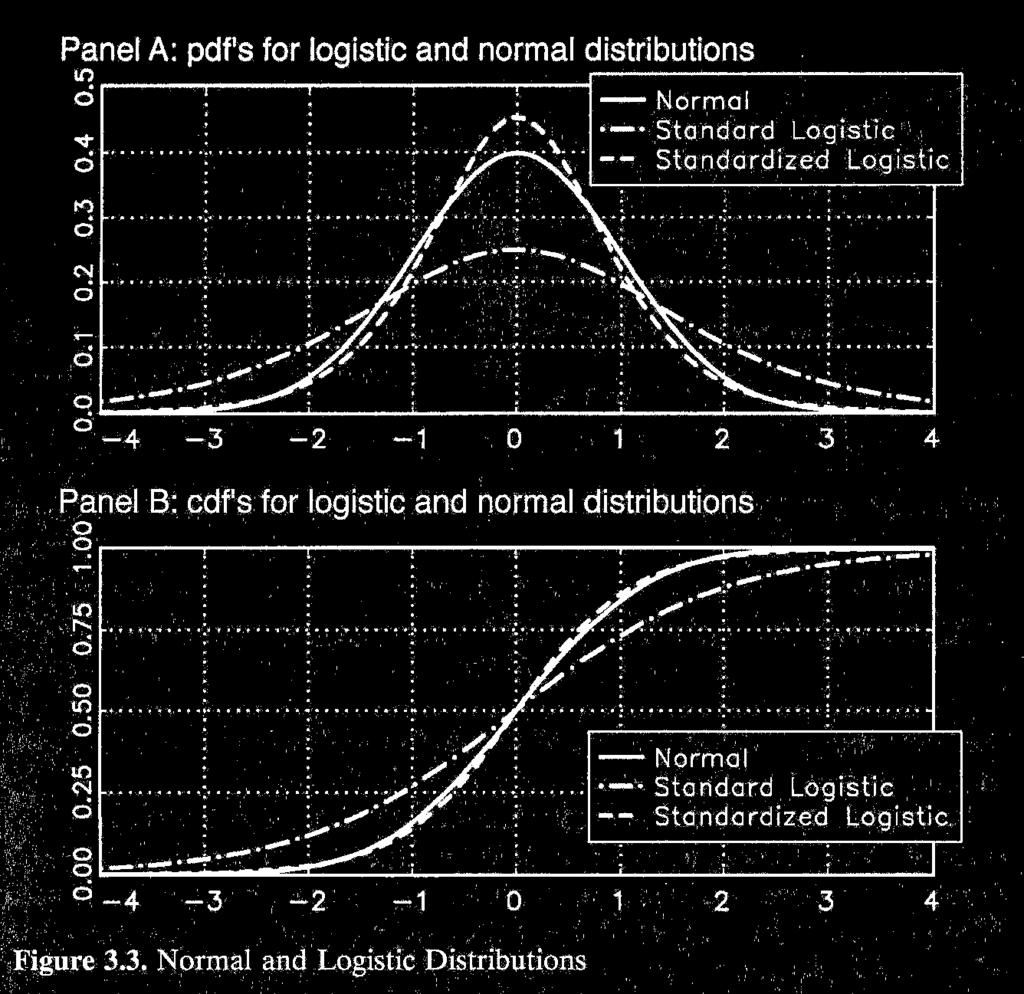
8 The form of F (.) Probit-Model normal distribution X β 2 1 t F ( X β) =F ( X β) = exp dt 2p 2 Logit-Model standard logistic distribution ( β ) F X exp = 1 + exp ( X β ) ( X β ) Both yield very similar results 8
9 GOODNESS OF FIT 2 ln L Pseudo R :1, ln L0 ln L value of log-likelihood in a model without covariates 0 + variations (McFadden, etc.) Problem: Pseudo 2 R is only 1 if X β ± Observed/predicted table (estat classification in STATA after Logit) Amount of Right Predictions : ˆ * Y i = 1 if Pˆi > P (usually 0.5), separately for each subgroup Comparison of Y ˆi and Y i Hosmer-Lemeshow-Test for misspecification: tests, for a number of subgroups, whether or not the mean predicted probability for P=1 is the same as in the sample. (mostly conducted for deciles; has to be the same for the whole sample) 9
10 ESTIMATION PROBLEMS Maximum Likelihood is o consistent, o asymptotic efficient and asymptotically normally distributed problems with small samples (should be >100) ln L is globally concave, nevertheless estimation problems (no convergence of the iteration procedure, singularity of the hessian matrix in the 2 nd derivative) multicollinearity of variables dummy-variable explains outcome entirely ( huge coefficients) + linear combinations 10
11 d i : if d i =1, then y i =1 i= 1 { i ( iβ d i) ( i) ( iβ d i) } N ln L = y ln F X + d + 1 y ln 1 F X + d MAX β i { } ( β d) ( β) ( ) ( β) = ln F X + + y ln F X + 1 yln 1 F X i i i i i d =1 d =0 i δ is only estimated in the first term, maximizing ln L means δ increases to maximum ==> + scaling of variables check standard errors 11
12 PROPERTIES OF THE ESTIMATOR only small troubles with OLS if some assumptions are violated. (e.g. still consistent estimates if error is heteroscedastic or suffers from autocorrelation) with Probit/Logit: only β is identified instead of β. σ General assumption: σ=1. heteroscedasticity: o if independent of RHS-variables, no problem but: 2 if σi = exp( γ1 + γ2x1 i), β cannot be consistently estimated o hetpro (STATA) as simple method to test heteroscedasticity; the general assumption is that errors correlate with one of the variables 12
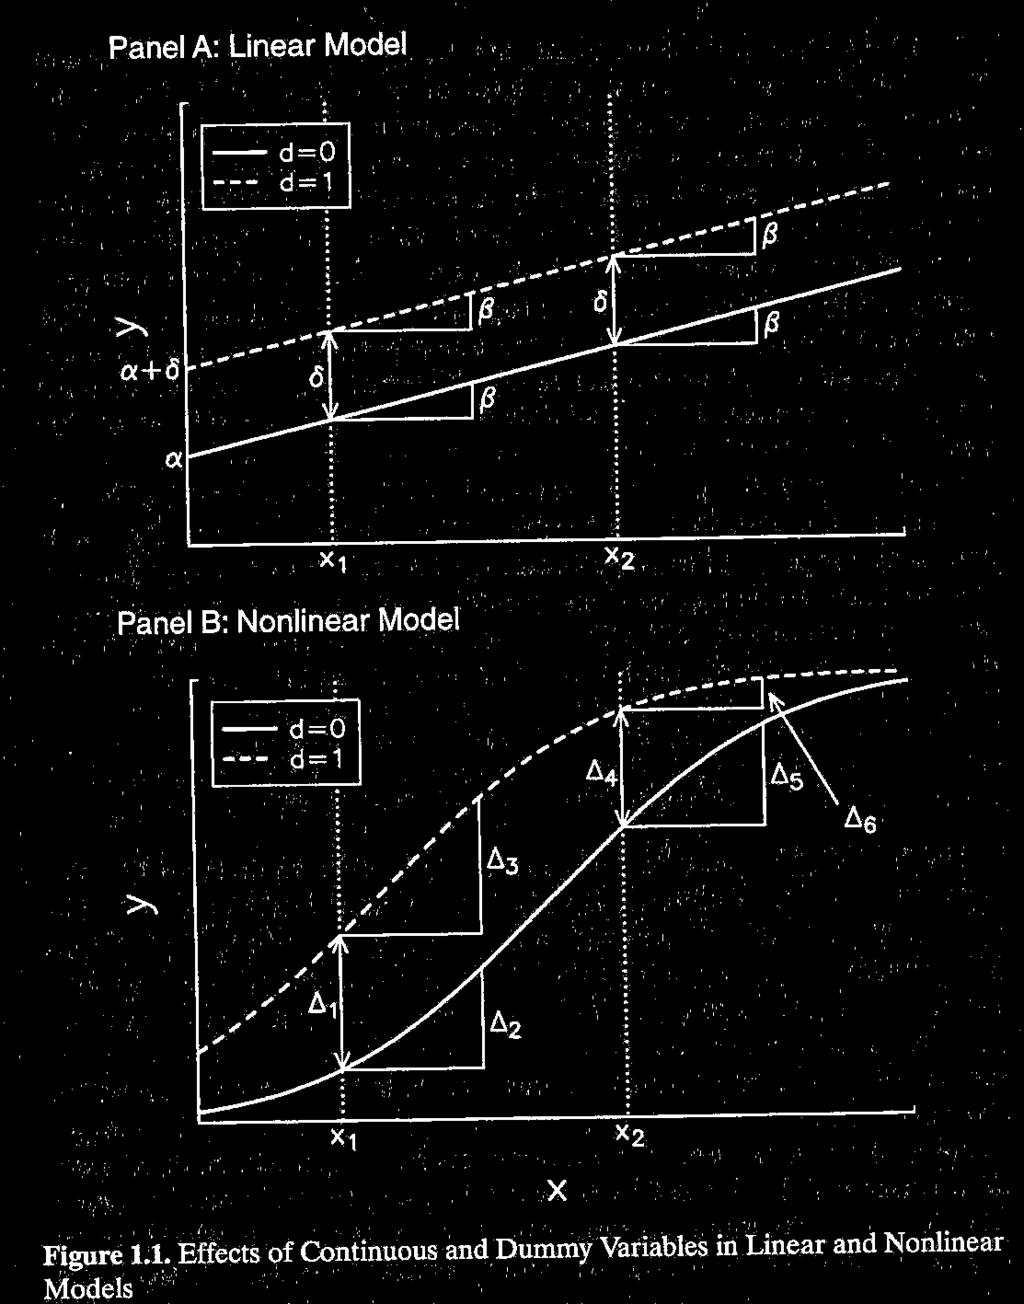
13 INTERPRETATION OF THE COEFFICIENT Non-linear procedure impact of variables depend on their position marginal effects are necessary dp dx 1 = β f 1 ( Xβ) Which position should be used to evaluate the marginal effect? all i, then 0 sample mean relevant combinations of variables 13
14 14
15 15
16 DUMMY-VARIABLES Discrete change X k ( Y X) Pr = 1 X k ( Y X X ) ( Y X X ) = Pr = 1, = 0 Pr = 1, = 1 k k STATA provides automated processes for marginal effects tables in marginal effects are always better Scott Long (Univ. of Indiana) developed own procedures for interpretations (see website) 16
17 ODDS RATIO FOR LOGIT Odds: ( ) ( ) ( ) ( ) Pr Y = 1 X Pr Y = 1 X = Pr Y = 0 X 1 Pr Y = 1 X how often happens 1, relative to 0, variation between 0 and ln(odds): variation between and : ( Y = X) ( Y X) Pr 1 ln 1 Pr = 1 = X β equivalent to logit: ( X β ) ( X β ) exp Pr ( Y = 1 X) = yields an interesting interpretation. 1 + exp 17
18 ODDS ( Ω ) P Ω ( X) = = 1 P e X β Two realisations of X are given: X 1 und X 0 Odds ratio: Ω Ω ( X1 ) ( X ) 0 = e ( X X ) 1 0 β If 1, ( 0) j e β > β j >, X j increases odds of observing Y = 1 18
19 PANEL MODELS For fixed T and N, the estimator is inconsistent. Incidental parameter problem, fixed effect α i not estimable. In linear model (OLS), it was possible to eliminate α i. Conditional maximum likelihood model: look for a sufficient statistic t i for α i, such that: conditional on t i, an individual likelihood s contribution no longer depends on α i, but on β. In linear models, a sufficient statistic for α i is y. This is not the case for a Probit model: Fixed Effects Probit is inconsistent. Fixed Effects Logit and Random Effects Probit is possible. 19
20 Ordered Probit/Logit Ordinal variable e.g. school grades * Latent variable Y (, ) is measured only in N values Yi = m if * τ m 1 Y < i τm, m 1 N τ threshold, cutpoints Thresholds are unknown must be estimated as well! 20
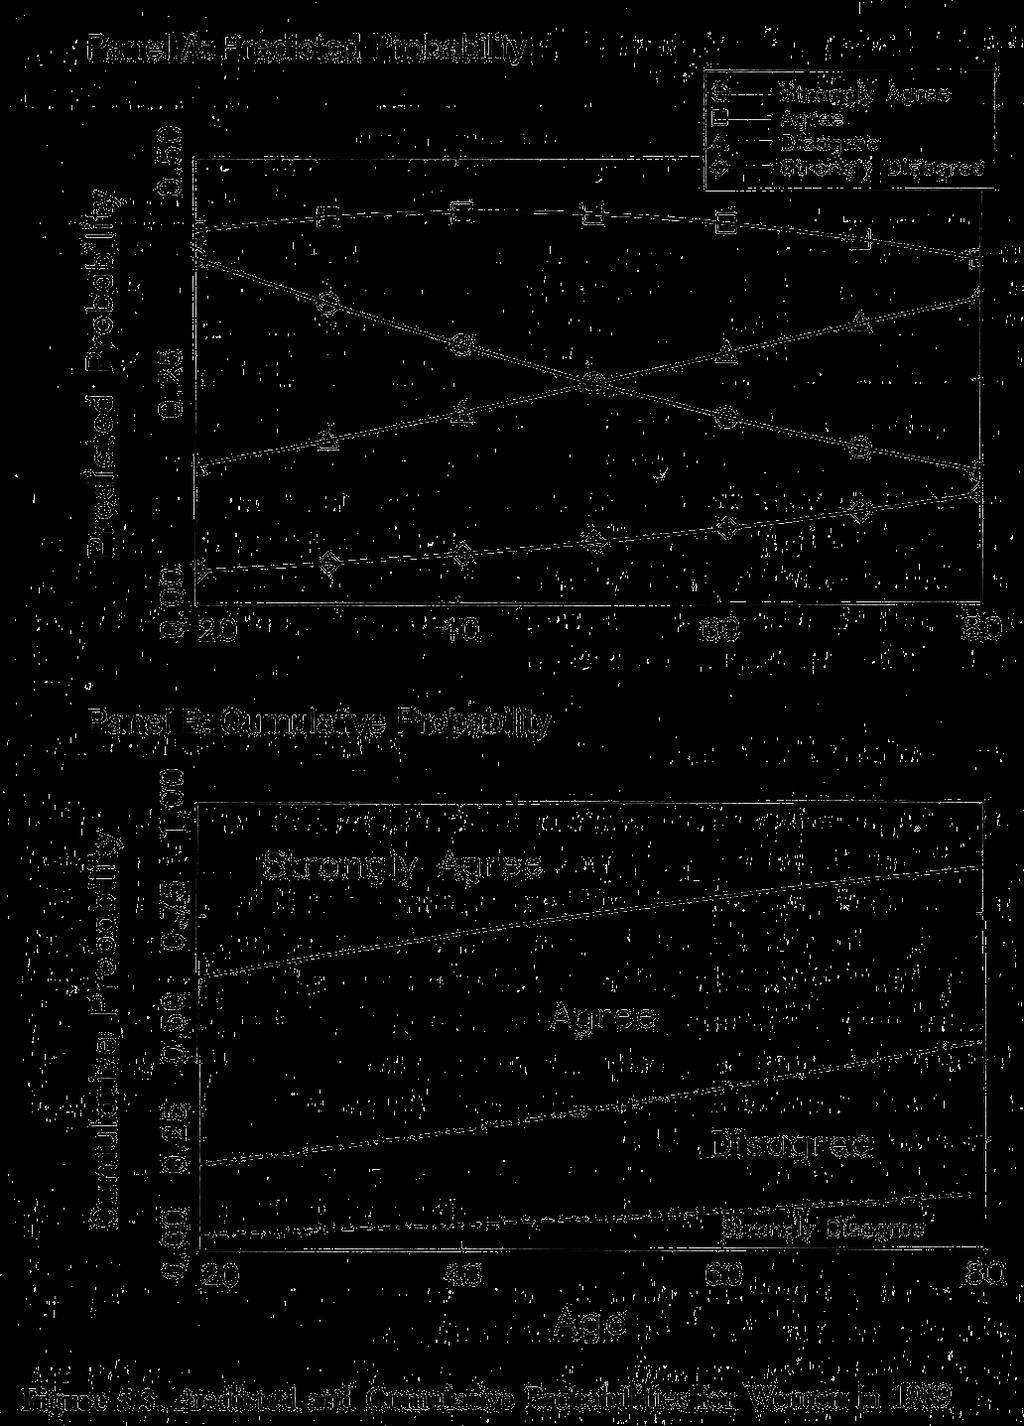
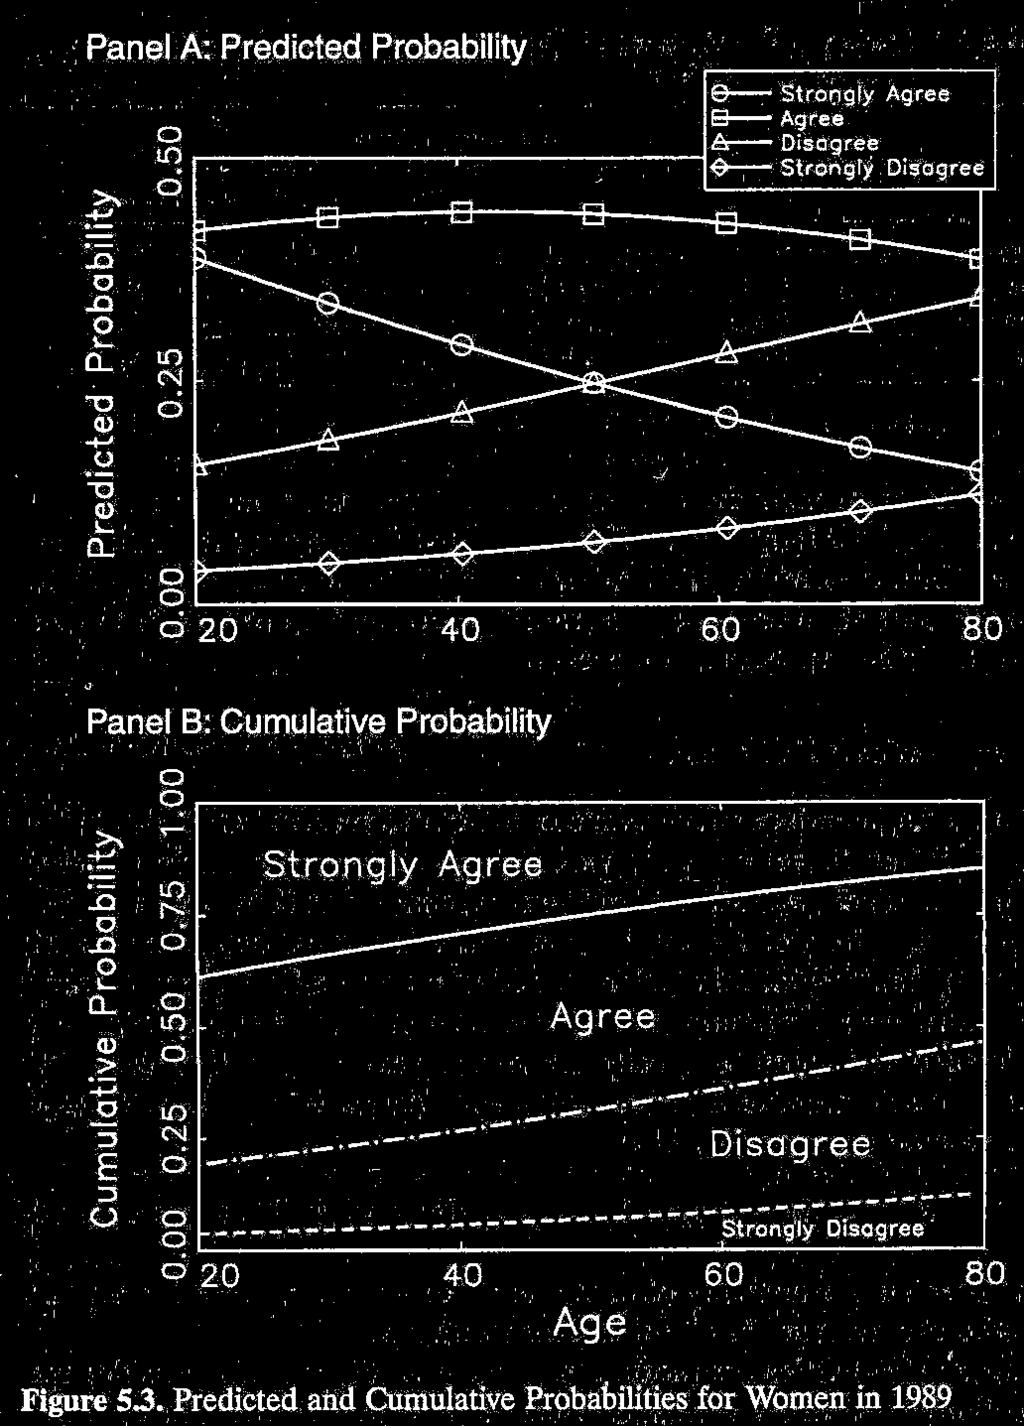
21 For ordered probit: ( Y = ) =Φ( Xβ ) ( Y = ) =Φ( τ1 Xβ) Φ( Xβ) ( Y = ) =Φ( τ Xβ) Φ( τ Xβ) Pr 0 0 Pr 1 Pr ( Y = N) = Φ( τ Xβ) Pr 1 N 1 a change in X shifts the entire probability density tot he left/right Attention: Interpretation is difficult and only explicit at the borders! 21
22 22

23 23
24 24
Ninth ARTNeT Capacity Building Workshop for Trade Research "Trade Flows and Trade Policy Analysis"
 Ninth ARTNeT Capacity Building Workshop for Trade Research "Trade Flows and Trade Policy Analysis" June 2013 Bangkok, Thailand Cosimo Beverelli and Rainer Lanz (World Trade Organization) 1 Selected econometric
Econometrics Lecture 5: Limited Dependent Variable Models: Logit and Probit
 Econometrics Lecture 5: Limited Dependent Variable Models: Logit and Probit R. G. Pierse 1 Introduction In lecture 5 of last semester s course, we looked at the reasons for including dichotomous variables
ECON 594: Lecture #6
 ECON 594: Lecture #6 Thomas Lemieux Vancouver School of Economics, UBC May 2018 1 Limited dependent variables: introduction Up to now, we have been implicitly assuming that the dependent variable, y, was
Using the Delta Method to Construct Confidence Intervals for Predicted Probabilities, Rates, and Discrete Changes 1
 Using the Delta Method to Construct Confidence Intervals for Predicted Probabilities, Rates, Discrete Changes 1 JunXuJ.ScottLong Indiana University 2005-02-03 1 General Formula The delta method is a general
Modeling Binary Outcomes: Logit and Probit Models
 Modeling Binary Outcomes: Logit and Probit Models Eric Zivot December 5, 2009 Motivating Example: Women s labor force participation y i = 1 if married woman is in labor force = 0 otherwise x i k 1 = observed
Limited Dependent Variable Models II
 Limited Dependent Variable Models II Fall 2008 Environmental Econometrics (GR03) LDV Fall 2008 1 / 15 Models with Multiple Choices The binary response model was dealing with a decision problem with two
Limited Dependent Variables and Panel Data
 and Panel Data June 24 th, 2009 Structure 1 2 Many economic questions involve the explanation of binary variables, e.g.: explaining the participation of women in the labor market explaining retirement
Binary Dependent Variables
 Binary Dependent Variables In some cases the outcome of interest rather than one of the right hand side variables - is discrete rather than continuous Binary Dependent Variables In some cases the outcome
Chapter 11. Regression with a Binary Dependent Variable
 Chapter 11 Regression with a Binary Dependent Variable 2 Regression with a Binary Dependent Variable (SW Chapter 11) So far the dependent variable (Y) has been continuous: district-wide average test score
Applied Economics. Regression with a Binary Dependent Variable. Department of Economics Universidad Carlos III de Madrid
 Applied Economics Regression with a Binary Dependent Variable Department of Economics Universidad Carlos III de Madrid See Stock and Watson (chapter 11) 1 / 28 Binary Dependent Variables: What is Different?
Maximum Likelihood and. Limited Dependent Variable Models
 Maximum Likelihood and Limited Dependent Variable Models Michele Pellizzari IGIER-Bocconi, IZA and frdb May 24, 2010 These notes are largely based on the textbook by Jeffrey M. Wooldridge. 2002. Econometric
Limited Dependent Variables and Panel Data
 Limited Dependent Variables and Panel Data Logit, Probit and Friends Benjamin Bittschi Sebastian Koch Outline Binary dependent variables Logit Fixed Effects Models Probit Random Effects Models Censored
Logistic Regression. Continued Psy 524 Ainsworth
 Logistic Regression Continued Psy 524 Ainsworth Equations Regression Equation Y e = 1 + A+ B X + B X + B X 1 1 2 2 3 3 i A+ B X + B X + B X e 1 1 2 2 3 3 Equations The linear part of the logistic regression
7. Assumes that there is little or no multicollinearity (however, SPSS will not assess this in the [binary] Logistic Regression procedure).
![7. Assumes that there is little or no multicollinearity (however, SPSS will not assess this in the [binary] Logistic Regression procedure).](/thumbs/78/76973644.jpg "7. Assumes that there is little or no multicollinearity (however, SPSS will not assess this in the [binary] Logistic Regression procedure).") 1 Neuendorf Logistic Regression The Model: Y Assumptions: 1. Metric (interval/ratio) data for 2+ IVs, and dichotomous (binomial; 2-value), categorical/nominal data for a single DV... bear in mind that
1 Neuendorf Logistic Regression The Model: Y Assumptions: 1. Metric (interval/ratio) data for 2+ IVs, and dichotomous (binomial; 2-value), categorical/nominal data for a single DV... bear in mind that
Statistical Modelling with Stata: Binary Outcomes
 Statistical Modelling with Stata: Binary Outcomes Mark Lunt Arthritis Research UK Epidemiology Unit University of Manchester 21/11/2017 Cross-tabulation Exposed Unexposed Total Cases a b a + b Controls
Lecture 3.1 Basic Logistic LDA
 y Lecture.1 Basic Logistic LDA 0.2.4.6.8 1 Outline Quick Refresher on Ordinary Logistic Regression and Stata Women s employment example Cross-Over Trial LDA Example -100-50 0 50 100 -- Longitudinal Data
Econometrics Honor s Exam Review Session. Spring 2012 Eunice Han
 Econometrics Honor s Exam Review Session Spring 2012 Eunice Han Topics 1. OLS The Assumptions Omitted Variable Bias Conditional Mean Independence Hypothesis Testing and Confidence Intervals Homoskedasticity
Chapter 9 Regression with a Binary Dependent Variable. Multiple Choice. 1) The binary dependent variable model is an example of a
 The binary dependent variable model is an example of a") Chapter 9 Regression with a Binary Dependent Variable Multiple Choice ) The binary dependent variable model is an example of a a. regression model, which has as a regressor, among others, a binary variable.
Chapter 9 Regression with a Binary Dependent Variable Multiple Choice ) The binary dependent variable model is an example of a a. regression model, which has as a regressor, among others, a binary variable.
Applied Health Economics (for B.Sc.)
") Applied Health Economics (for B.Sc.) Helmut Farbmacher Department of Economics University of Mannheim Autumn Semester 2017 Outlook 1 Linear models (OLS, Omitted variables, 2SLS) 2 Limited and qualitative
Applied Health Economics (for B.Sc.) Helmut Farbmacher Department of Economics University of Mannheim Autumn Semester 2017 Outlook 1 Linear models (OLS, Omitted variables, 2SLS) 2 Limited and qualitative
Recent Advances in the Field of Trade Theory and Policy Analysis Using Micro-Level Data
 Recent Advances in the Field of Trade Theory and Policy Analysis Using Micro-Level Data July 2012 Bangkok, Thailand Cosimo Beverelli (World Trade Organization) 1 Content a) Censoring and truncation b)
covariance between any two observations
 1 Ordinary Least Squares (OLS) 1.1 Single Linear Regression Model assumptions of Classical Linear Regression Model (CLRM) (i) true relationship y i = α + βx i + ε i, i = 1,..., N where α, β = population
Chap 2. Linear Classifiers (FTH, ) Yongdai Kim Seoul National University
 Yongdai Kim Seoul National University") Chap 2. Linear Classifiers (FTH, 4.1-4.4) Yongdai Kim Seoul National University Linear methods for classification 1. Linear classifiers For simplicity, we only consider two-class classification problems
Chap 2. Linear Classifiers (FTH, 4.1-4.4) Yongdai Kim Seoul National University Linear methods for classification 1. Linear classifiers For simplicity, we only consider two-class classification problems
Binary Outcomes. Objectives. Demonstrate the limitations of the Linear Probability Model (LPM) for binary outcomes
 for binary outcomes") Binary Outcomes Objectives Demonstrate the limitations of the Linear Probability Model (LPM) for binary outcomes Develop latent variable & transformational approach for binary outcomes Present several
Binary Outcomes Objectives Demonstrate the limitations of the Linear Probability Model (LPM) for binary outcomes Develop latent variable & transformational approach for binary outcomes Present several
h=1 exp (X : J h=1 Even the direction of the e ect is not determined by jk. A simpler interpretation of j is given by the odds-ratio
 Multivariate Response Models The response variable is unordered and takes more than two values. The term unordered refers to the fact that response 3 is not more favored than response 2. One choice from
LOGISTIC REGRESSION Joseph M. Hilbe
 LOGISTIC REGRESSION Joseph M. Hilbe Arizona State University Logistic regression is the most common method used to model binary response data. When the response is binary, it typically takes the form of
Ordered Response and Multinomial Logit Estimation
 Ordered Response and Multinomial Logit Estimation Quantitative Microeconomics R. Mora Department of Economics Universidad Carlos III de Madrid Outline Introduction 1 Introduction 2 3 Introduction The Ordered
Discrete Dependent Variable Models
 Discrete Dependent Variable Models James J. Heckman University of Chicago This draft, April 10, 2006 Here s the general approach of this lecture: Economic model Decision rule (e.g. utility maximization)
LOGISTIC REGRESSION. Lalmohan Bhar Indian Agricultural Statistics Research Institute, New Delhi
 LOGISTIC REGRESSION Lalmohan Bhar Indian Agricultural Statistics Research Institute, New Delhi- lmbhar@gmail.com. Introduction Regression analysis is a method for investigating functional relationships
Instructions: Closed book, notes, and no electronic devices. Points (out of 200) in parentheses
 in parentheses") ISQS 5349 Final Spring 2011 Instructions: Closed book, notes, and no electronic devices. Points (out of 200) in parentheses 1. (10) What is the definition of a regression model that we have used throughout
ISQS 5349 Final Spring 2011 Instructions: Closed book, notes, and no electronic devices. Points (out of 200) in parentheses 1. (10) What is the definition of a regression model that we have used throughout
Spring RMC Professional Development Series January 14, Generalized Linear Mixed Models (GLMMs): Concepts and some Demonstrations
: Concepts and some Demonstrations") Spring RMC Professional Development Series January 14, 2016 Generalized Linear Mixed Models (GLMMs): Concepts and some Demonstrations Ann A. O Connell, Ed.D. Professor, Educational Studies (QREM) Director,
Spring RMC Professional Development Series January 14, 2016 Generalized Linear Mixed Models (GLMMs): Concepts and some Demonstrations Ann A. O Connell, Ed.D. Professor, Educational Studies (QREM) Director,
ECONOMETRICS HONOR S EXAM REVIEW SESSION
 ECONOMETRICS HONOR S EXAM REVIEW SESSION Eunice Han ehan@fas.harvard.edu March 26 th, 2013 Harvard University Information 2 Exam: April 3 rd 3-6pm @ Emerson 105 Bring a calculator and extra pens. Notes
Statistics: A review. Why statistics?
 Statistics: A review Why statistics? What statistical concepts should we know? Why statistics? To summarize, to explore, to look for relations, to predict What kinds of data exist? Nominal, Ordinal, Interval
Lecture 4: Heteroskedasticity
 Lecture 4: Heteroskedasticity Econometric Methods Warsaw School of Economics (4) Heteroskedasticity 1 / 24 Outline 1 What is heteroskedasticity? 2 Testing for heteroskedasticity White Goldfeld-Quandt Breusch-Pagan
Lecture 12: Application of Maximum Likelihood Estimation:Truncation, Censoring, and Corner Solutions
 Econ 513, USC, Department of Economics Lecture 12: Application of Maximum Likelihood Estimation:Truncation, Censoring, and Corner Solutions I Introduction Here we look at a set of complications with the
Week 7: Binary Outcomes (Scott Long Chapter 3 Part 2)
") Week 7: (Scott Long Chapter 3 Part 2) Tsun-Feng Chiang* *School of Economics, Henan University, Kaifeng, China April 29, 2014 1 / 38 ML Estimation for Probit and Logit ML Estimation for Probit and Logit
Week 7: (Scott Long Chapter 3 Part 2) Tsun-Feng Chiang* *School of Economics, Henan University, Kaifeng, China April 29, 2014 1 / 38 ML Estimation for Probit and Logit ML Estimation for Probit and Logit
Lecture 6: Discrete Choice: Qualitative Response
 Lecture 6: Instructor: Department of Economics Stanford University 2011 Types of Discrete Choice Models Univariate Models Binary: Linear; Probit; Logit; Arctan, etc. Multinomial: Logit; Nested Logit; GEV;
2. We care about proportion for categorical variable, but average for numerical one.
 Probit Model 1. We apply Probit model to Bank data. The dependent variable is deny, a dummy variable equaling one if a mortgage application is denied, and equaling zero if accepted. The key regressor is
Econometrics II. Seppo Pynnönen. Spring Department of Mathematics and Statistics, University of Vaasa, Finland
 Department of Mathematics and Statistics, University of Vaasa, Finland Spring 2018 Part III Limited Dependent Variable Models As of Jan 30, 2017 1 Background 2 Binary Dependent Variable The Linear Probability
Discrete Choice Modeling
 [Part 6] 1/55 0 Introduction 1 Summary 2 Binary Choice 3 Panel Data 4 Bivariate Probit 5 Ordered Choice 6 7 Multinomial Choice 8 Nested Logit 9 Heterogeneity 10 Latent Class 11 Mixed Logit 12 Stated Preference
Truncation and Censoring
 Truncation and Censoring Laura Magazzini laura.magazzini@univr.it Laura Magazzini (@univr.it) Truncation and Censoring 1 / 35 Truncation and censoring Truncation: sample data are drawn from a subset of
STA 216, GLM, Lecture 16. October 29, 2007
 STA 216, GLM, Lecture 16 October 29, 2007 Efficient Posterior Computation in Factor Models Underlying Normal Models Generalized Latent Trait Models Formulation Genetic Epidemiology Illustration Structural
Density estimation Nonparametric conditional mean estimation Semiparametric conditional mean estimation. Nonparametrics. Gabriel Montes-Rojas
 0 0 5 Motivation: Regression discontinuity (Angrist&Pischke) Outcome.5 1 1.5 A. Linear E[Y 0i X i] 0.2.4.6.8 1 X Outcome.5 1 1.5 B. Nonlinear E[Y 0i X i] i 0.2.4.6.8 1 X utcome.5 1 1.5 C. Nonlinearity
Binary Logistic Regression
 The coefficients of the multiple regression model are estimated using sample data with k independent variables Estimated (or predicted) value of Y Estimated intercept Estimated slope coefficients Ŷ = b
Binary Models with Endogenous Explanatory Variables
 Binary Models with Endogenous Explanatory Variables Class otes Manuel Arellano ovember 7, 2007 Revised: January 21, 2008 1 Introduction In Part I we considered linear and non-linear models with additive
Introduction to Regression Analysis. Dr. Devlina Chatterjee 11 th August, 2017
 Introduction to Regression Analysis Dr. Devlina Chatterjee 11 th August, 2017 What is regression analysis? Regression analysis is a statistical technique for studying linear relationships. One dependent
Lecture 11/12. Roy Model, MTE, Structural Estimation
 Lecture 11/12. Roy Model, MTE, Structural Estimation Economics 2123 George Washington University Instructor: Prof. Ben Williams Roy model The Roy model is a model of comparative advantage: Potential earnings
Estimation in the Fixed Effects Ordered Logit Model. Chris Muris (SFU)
") Estimation in the Fixed Effects Ordered Logit Model Chris Muris (SFU) Outline Introduction Model and main result Cut points Estimation Simulations and illustration Conclusion Setting 1. Fixed-T panel.
Estimation in the Fixed Effects Ordered Logit Model Chris Muris (SFU) Outline Introduction Model and main result Cut points Estimation Simulations and illustration Conclusion Setting 1. Fixed-T panel.
POLI 618 Notes. Stuart Soroka, Department of Political Science, McGill University. March 2010
 POLI 618 Notes Stuart Soroka, Department of Political Science, McGill University March 2010 These pages were written originally as my own lecture notes, but are now designed to be distributed to students
Basic Medical Statistics Course
 Basic Medical Statistics Course S7 Logistic Regression November 2015 Wilma Heemsbergen w.heemsbergen@nki.nl Logistic Regression The concept of a relationship between the distribution of a dependent variable
Homework Solutions Applied Logistic Regression
 Homework Solutions Applied Logistic Regression WEEK 6 Exercise 1 From the ICU data, use as the outcome variable vital status (STA) and CPR prior to ICU admission (CPR) as a covariate. (a) Demonstrate that
I. Multinomial Logit Suppose we only have individual specific covariates. Then we can model the response probability as
 Econ 513, USC, Fall 2005 Lecture 15 Discrete Response Models: Multinomial, Conditional and Nested Logit Models Here we focus again on models for discrete choice with more than two outcomes We assume that
Non-maximum likelihood estimation and statistical inference for linear and nonlinear mixed models
 Optimum Design for Mixed Effects Non-Linear and generalized Linear Models Cambridge, August 9-12, 2011 Non-maximum likelihood estimation and statistical inference for linear and nonlinear mixed models
Introduction to Econometrics
 Introduction to Econometrics T H I R D E D I T I O N Global Edition James H. Stock Harvard University Mark W. Watson Princeton University Boston Columbus Indianapolis New York San Francisco Upper Saddle
Partial effects in fixed effects models
 1 Partial effects in fixed effects models J.M.C. Santos Silva School of Economics, University of Surrey Gordon C.R. Kemp Department of Economics, University of Essex 22 nd London Stata Users Group Meeting
Logistic Regression: Regression with a Binary Dependent Variable
 Logistic Regression: Regression with a Binary Dependent Variable LEARNING OBJECTIVES Upon completing this chapter, you should be able to do the following: State the circumstances under which logistic regression
Rewrap ECON November 18, () Rewrap ECON 4135 November 18, / 35
 Rewrap ECON 4135 November 18, / 35") Rewrap ECON 4135 November 18, 2011 () Rewrap ECON 4135 November 18, 2011 1 / 35 What should you now know? 1 What is econometrics? 2 Fundamental regression analysis 1 Bivariate regression 2 Multivariate
Rewrap ECON 4135 November 18, 2011 () Rewrap ECON 4135 November 18, 2011 1 / 35 What should you now know? 1 What is econometrics? 2 Fundamental regression analysis 1 Bivariate regression 2 Multivariate
EPSY 905: Fundamentals of Multivariate Modeling Online Lecture #7
 Introduction to Generalized Univariate Models: Models for Binary Outcomes EPSY 905: Fundamentals of Multivariate Modeling Online Lecture #7 EPSY 905: Intro to Generalized In This Lecture A short review
Logistic regression: Why we often can do what we think we can do. Maarten Buis 19 th UK Stata Users Group meeting, 10 Sept. 2015
 Logistic regression: Why we often can do what we think we can do Maarten Buis 19 th UK Stata Users Group meeting, 10 Sept. 2015 1 Introduction Introduction - In 2010 Carina Mood published an overview article
Logistic & Tobit Regression
 Logistic & Tobit Regression Different Types of Regression Binary Regression (D) Logistic transformation + e P( y x) = 1 + e! " x! + " x " P( y x) % ln$ ' = ( + ) x # 1! P( y x) & logit of P(y x){ P(y
Parametric identification of multiplicative exponential heteroskedasticity ALYSSA CARLSON
 Parametric identification of multiplicative exponential heteroskedasticity ALYSSA CARLSON Department of Economics, Michigan State University East Lansing, MI 48824-1038, United States (email: carls405@msu.edu)
Panel Models for Non-Continuous Dependent Variables
 Panel Models for Non-Continuous Dependent Variables Sessions 7-8: 18 June 2015 Steven Finkel, PhD Daniel Wallace Professor of Political Science University of Pittsburgh USA Non-Continuous DVs Last topic
CS6220: DATA MINING TECHNIQUES
 CS6220: DATA MINING TECHNIQUES Matrix Data: Prediction Instructor: Yizhou Sun yzsun@ccs.neu.edu September 14, 2014 Today s Schedule Course Project Introduction Linear Regression Model Decision Tree 2 Methods
Single-level Models for Binary Responses
 Single-level Models for Binary Responses Distribution of Binary Data y i response for individual i (i = 1,..., n), coded 0 or 1 Denote by r the number in the sample with y = 1 Mean and variance E(y) =
Double-Hurdle Models with Dependent Errors and Heteroscedasticity
 Double-Hurdle Models with Dependent Errors and Heteroscedasticity Heriot-Watt University and RWI-Essen Essen, April 2nd 2007 Tobit model Model Censoring of the dependent variable is traditionally dealt
Binary choice. Michel Bierlaire
 Binary choice Michel Bierlaire Transport and Mobility Laboratory School of Architecture, Civil and Environmental Engineering Ecole Polytechnique Fédérale de Lausanne M. Bierlaire (TRANSP-OR ENAC EPFL)
Non-linear panel data modeling
 Non-linear panel data modeling Laura Magazzini University of Verona laura.magazzini@univr.it http://dse.univr.it/magazzini May 2010 Laura Magazzini (@univr.it) Non-linear panel data modeling May 2010 1
Topic 5: Non-Linear Relationships and Non-Linear Least Squares
 Topic 5: Non-Linear Relationships and Non-Linear Least Squares Non-linear Relationships Many relationships between variables are non-linear. (Examples) OLS may not work (recall A.1). It may be biased and
Stat 642, Lecture notes for 04/12/05 96
 Stat 642, Lecture notes for 04/12/05 96 Hosmer-Lemeshow Statistic The Hosmer-Lemeshow Statistic is another measure of lack of fit. Hosmer and Lemeshow recommend partitioning the observations into 10 equal
Linear Classification: Probabilistic Generative Models
 Linear Classification: Probabilistic Generative Models Sargur N. University at Buffalo, State University of New York USA 1 Linear Classification using Probabilistic Generative Models Topics 1. Overview
Models with Limited Dependent Variables
 LECTURE 7 Models with Limited Dependent Variables In this lecture, we present two models with limited dependent variables. The first is a logistic regression model in which the dependent variable has a
Latent Variable Models for Binary Data. Suppose that for a given vector of explanatory variables x, the latent
 Latent Variable Models for Binary Data Suppose that for a given vector of explanatory variables x, the latent variable, U, has a continuous cumulative distribution function F (u; x) and that the binary
Comparing groups using predicted probabilities
 Comparing groups using predicted probabilities J. Scott Long Indiana University May 9, 2006 MAPSS - May 9, 2006 - Page 1 The problem Allison (1999): Di erences in the estimated coe cients tell us nothing
Using the same data as before, here is part of the output we get in Stata when we do a logistic regression of Grade on Gpa, Tuce and Psi.
 Logistic Regression, Part III: Hypothesis Testing, Comparisons to OLS Richard Williams, University of Notre Dame, https://www3.nd.edu/~rwilliam/ Last revised January 14, 2018 This handout steals heavily
Generalized Linear Models for Non-Normal Data
 Generalized Linear Models for Non-Normal Data Today s Class: 3 parts of a generalized model Models for binary outcomes Complications for generalized multivariate or multilevel models SPLH 861: Lecture
Lecture 1: intro. to regresions
 Lecture : intro. to regresions Class basics: Coach, Bro., Prof.,Not Dr.; grading (exams, HW, papers), Quizes Simple regression model (one X): Salary = b0 + b*experience + error Multiple regression model
Group comparisons in logit and probit using predicted probabilities 1
 Group comparisons in logit and probit using predicted probabilities 1 J. Scott Long Indiana University May 27, 2009 Abstract The comparison of groups in regression models for binary outcomes is complicated
Economics 671: Applied Econometrics Department of Economics, Finance and Legal Studies University of Alabama
 Problem Set #1 (Random Data Generation) 1. Generate =500random numbers from both the uniform 1 ( [0 1], uniformbetween zero and one) and exponential exp ( ) (set =2and let [0 1]) distributions. Plot the
ECON Introductory Econometrics. Lecture 11: Binary dependent variables
 ECON4150 - Introductory Econometrics Lecture 11: Binary dependent variables Monique de Haan (moniqued@econ.uio.no) Stock and Watson Chapter 11 Lecture Outline 2 The linear probability model Nonlinear probability
Panel Data Exercises Manuel Arellano. Using panel data, a researcher considers the estimation of the following system:
 Panel Data Exercises Manuel Arellano Exercise 1 Using panel data, a researcher considers the estimation of the following system: y 1t = α 1 + βx 1t + v 1t. (t =1,..., T ) y Nt = α N + βx Nt + v Nt where
Binomial Model. Lecture 10: Introduction to Logistic Regression. Logistic Regression. Binomial Distribution. n independent trials
 Lecture : Introduction to Logistic Regression Ani Manichaikul amanicha@jhsph.edu 2 May 27 Binomial Model n independent trials (e.g., coin tosses) p = probability of success on each trial (e.g., p =! =
MS&E 226: Small Data
 MS&E 226: Small Data Lecture 9: Logistic regression (v2) Ramesh Johari ramesh.johari@stanford.edu 1 / 28 Regression methods for binary outcomes 2 / 28 Binary outcomes For the duration of this lecture suppose
Lecture notes to Chapter 11, Regression with binary dependent variables - probit and logit regression
 Lecture notes to Chapter 11, Regression with binary dependent variables - probit and logit regression Tore Schweder October 28, 2011 Outline Examples of binary respons variables Probit and logit - examples
Goals. PSCI6000 Maximum Likelihood Estimation Multiple Response Model 2. Recap: MNL. Recap: MNL
 Goals PSCI6000 Maximum Likelihood Estimation Multiple Response Model 2 Tetsuya Matsubayashi University of North Texas November 9, 2010 Learn multiple responses models that do not require the assumption
disc choice5.tex; April 11, ffl See: King - Unifying Political Methodology ffl See: King/Tomz/Wittenberg (1998, APSA Meeting). ffl See: Alvarez
. ffl See: Alvarez") disc choice5.tex; April 11, 2001 1 Lecture Notes on Discrete Choice Models Copyright, April 11, 2001 Jonathan Nagler 1 Topics 1. Review the Latent Varible Setup For Binary Choice ffl Logit ffl Likelihood
disc choice5.tex; April 11, 2001 1 Lecture Notes on Discrete Choice Models Copyright, April 11, 2001 Jonathan Nagler 1 Topics 1. Review the Latent Varible Setup For Binary Choice ffl Logit ffl Likelihood
Probabilistic Choice Models
 Probabilistic Choice Models James J. Heckman University of Chicago Econ 312 This draft, March 29, 2006 This chapter examines dierent models commonly used to model probabilistic choice, such as eg the choice
Heteroscedasticity 1
 Heteroscedasticity 1 Pierre Nguimkeu BUEC 333 Summer 2011 1 Based on P. Lavergne, Lectures notes Outline Pure Versus Impure Heteroscedasticity Consequences and Detection Remedies Pure Heteroscedasticity
Lecture 10: Introduction to Logistic Regression
 Lecture 10: Introduction to Logistic Regression Ani Manichaikul amanicha@jhsph.edu 2 May 2007 Logistic Regression Regression for a response variable that follows a binomial distribution Recall the binomial
Parametric Identification of Multiplicative Exponential Heteroskedasticity
 Parametric Identification of Multiplicative Exponential Heteroskedasticity Alyssa Carlson Department of Economics, Michigan State University East Lansing, MI 48824-1038, United States Dated: October 5,
Extensions to the Basic Framework II
 Topic 7 Extensions to the Basic Framework II ARE/ECN 240 A Graduate Econometrics Professor: Òscar Jordà Outline of this topic Nonlinear regression Limited Dependent Variable regression Applications of
MS&E 226: Small Data
 MS&E 226: Small Data Lecture 12: Logistic regression (v1) Ramesh Johari ramesh.johari@stanford.edu Fall 2015 1 / 30 Regression methods for binary outcomes 2 / 30 Binary outcomes For the duration of this
Introductory Econometrics
 Introductory Econometrics Violation of basic assumptions Heteroskedasticity Barbara Pertold-Gebicka CERGE-EI 16 November 010 OLS assumptions 1. Disturbances are random variables drawn from a normal distribution.
MULTIPLE REGRESSION AND ISSUES IN REGRESSION ANALYSIS
 MULTIPLE REGRESSION AND ISSUES IN REGRESSION ANALYSIS Page 1 MSR = Mean Regression Sum of Squares MSE = Mean Squared Error RSS = Regression Sum of Squares SSE = Sum of Squared Errors/Residuals α = Level
Experimental Design and Statistical Methods. Workshop LOGISTIC REGRESSION. Jesús Piedrafita Arilla.
 Experimental Design and Statistical Methods Workshop LOGISTIC REGRESSION Jesús Piedrafita Arilla jesus.piedrafita@uab.cat Departament de Ciència Animal i dels Aliments Items Logistic regression model Logit
Logistic Regression. Sargur N. Srihari. University at Buffalo, State University of New York USA
 Logistic Regression Sargur N. University at Buffalo, State University of New York USA Topics in Linear Classification using Probabilistic Discriminative Models Generative vs Discriminative 1. Fixed basis
Comprehensive Examination Quantitative Methods Spring, 2018
 Comprehensive Examination Quantitative Methods Spring, 2018 Instruction: This exam consists of three parts. You are required to answer all the questions in all the parts. 1 Grading policy: 1. Each part
 STOCKHOLM UNIVERSITY Department of Economics Course name: Empirical Methods Course code: EC40 Examiner: Lena Nekby Number of credits: 7,5 credits Date of exam: Friday, June 5, 009 Examination time: 3 hours
26:010:557 / 26:620:557 Social Science Research Methods
 26:010:557 / 26:620:557 Social Science Research Methods Dr. Peter R. Gillett Associate Professor Department of Accounting & Information Systems Rutgers Business School Newark & New Brunswick 1 Overview
Assessing the Calibration of Dichotomous Outcome Models with the Calibration Belt
 Assessing the Calibration of Dichotomous Outcome Models with the Calibration Belt Giovanni Nattino The Ohio Colleges of Medicine Government Resource Center The Ohio State University Stata Conference -
Data-analysis and Retrieval Ordinal Classification
 Data-analysis and Retrieval Ordinal Classification Ad Feelders Universiteit Utrecht Data-analysis and Retrieval 1 / 30 Strongly disagree Ordinal Classification 1 2 3 4 5 0% (0) 10.5% (2) 21.1% (4) 42.1%
ECONOMETRICS II (ECO 2401S) University of Toronto. Department of Economics. Spring 2013 Instructor: Victor Aguirregabiria
 University of Toronto. Department of Economics. Spring 2013 Instructor: Victor Aguirregabiria") ECONOMETRICS II (ECO 2401S) University of Toronto. Department of Economics. Spring 2013 Instructor: Victor Aguirregabiria SOLUTION TO FINAL EXAM Friday, April 12, 2013. From 9:00-12:00 (3 hours) INSTRUCTIONS:
ECONOMETRICS II (ECO 2401S) University of Toronto. Department of Economics. Spring 2013 Instructor: Victor Aguirregabiria SOLUTION TO FINAL EXAM Friday, April 12, 2013. From 9:00-12:00 (3 hours) INSTRUCTIONS: