Econometrics I. Professor William Greene Stern School of Business Department of Economics 1-1/40. Part 1: Introduction
|
|
|
- Shana Hicks
- 6 years ago
- Views:
Transcription
1 Econometrics I Professor William Greene Stern School of Business Department of Economics 1-1/40
2 1-2/40
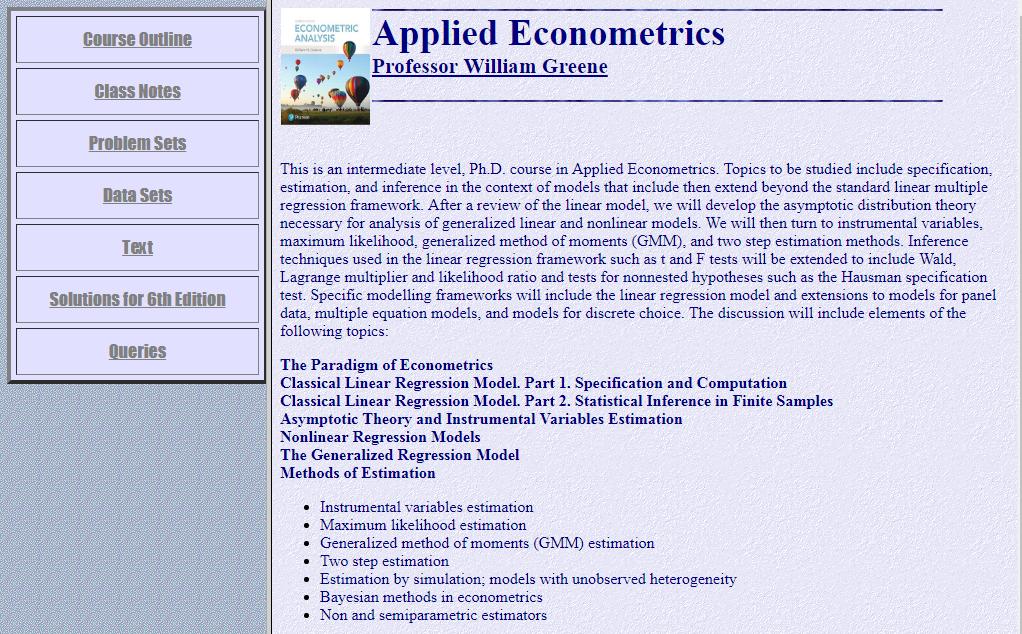
3 Overview: This is an intermediate level, Ph.D. course in Applied Econometrics. Topics to be studied include specification, estimation, and inference in the context of models that include then extend beyond the standard linear multiple regression framework. After a review of the linear model, we will develop the theory necessary for analysis of generalized linear and nonlinear models. Topics to be examined: Regression modeling Instrumental variables Robust estimation and inference Causal inference Nonlinear modeling Cross section, time series and panel data Objective: Abstract Preparation to read and carry out empirical social science research using modern econometric methods. 1-3/40
4 Prerequisites A previous course that used linear regression Mathematical statistics Matrix algebra 1-4/40
5 Main text: Greene, W., Econometric Analysis, 8 th Edition, Prentice Hall, Readings A few articles Notes and materials on the course website: 1-5/40

6 No class on: Thursday, September 21 *Tuesday, November 21 Thursday, November 23 *Tuesday, November 28 Added class on: Tuesday, December 12 Midterm: October 24 Course Schedule Final: Take home; posted December 7, due December /40
7 Software Practicals NLOGIT provided, supported SAS, Stata, EViews optional, your choice R, Matlab, Gauss, others Questions and review as requested Problem Sets: (more details later) 1-7/40
8 Course Requirements Problem sets: 5 (30%) Midterm, in class (30%) Final exam, take home (40%) 1-8/40
9 Econometrics I Part 1 - Paradigm 1-9/40
10 Econometrics: Paradigm Theoretical foundations Behavioral modeling: Optimization, labor supply, demand equations, etc. Microeconometrics and macroeconometrics Mathematical Elements Statistical foundations Model building the econometric model Mathematical elements The underlying truth is there one? 1-10/40
11 1-11/40 Objectives Understanding covariation: What is the income elasticity of the demand for health care in an economy? Understanding a relationship: How will drivers respond to the availability of a new toll road? Causal Inference: The search for causal effects Did an antitrust intervention that broke up a British boarding schools cartel have an impact on fees charged? Prediction of an outcome of interest Does internet buzz help to predict movie success?
12 Small structural models Trends in Econometrics Pervasiveness of an econometrics paradigm Non- and semiparametric methods vs. parametric Robust methods / Estimation and inference Nonlinear modeling (the role of software) Behavioral and structural modeling vs. reduced form, covariance analysis Identification and causal effects 1-12/40
13 Data Structures Observation mechanisms Passive, nonexperimental (the usual) Randomly assigned experiment (wishful) Active, experimental (occasional) The natural experiment (occasional, limited) Data types Cross section Pure time series Panel Longitudinal data NLS Country macro data Penn W.T. Financial data 1-13/40
14 Paradigm: Classical Inference Population Imprecise inference about the entire population sampling theory and asymptotics Econometrics Measurement Characteristics Behavior Patterns Choices 1-14/40
15 Paradigm: Bayesian Inference Population Econometrics Sharp, exact inference about only the sample the posterior density. Measurement Characteristics Behavior Patterns Choices 1-15/40
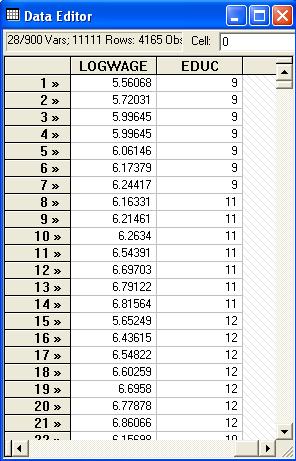
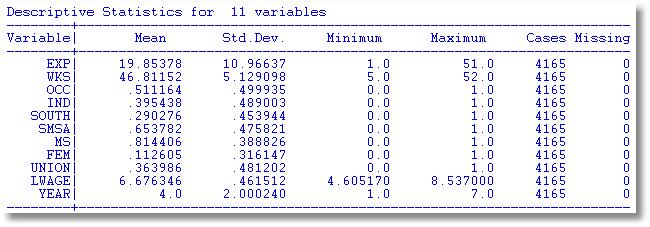
16 An Application: Cornwell and Rupert Labor Market Data Is Wage Related to Education? Cornwell and Rupert Returns to Schooling Data, 595 Individuals, 7 Years Variables in the file are EXP WKS OCC IND SOUTH SMSA MS FEM UNION ED LWAGE = work experience = weeks worked = occupation, 1 if blue collar, = 1 if manufacturing industry = 1 if resides in south = 1 if resides in a city (SMSA) = 1 if married = 1 if female = 1 if wage set by union contract = years of education = log of wage = dependent variable in regressions These data were analyzed in Cornwell, C. and Rupert, P., "Efficient Estimation with Panel Data: An Empirical Comparison of Instrumental Variable Estimators," Journal of Applied Econometrics, 3, 1988, pp /40
17 1-17/40
18 Model Building in Econometrics Role of the assumptions Parameterizing the model Nonparametric analysis Semiparametric analysis Parametric analysis Sharpness of inferences 1-18/40
 Wage and Education?")


19 Application: Is there a relationship between (log) Wage and Education? Nonparametric Regression Kernel regression of log wage on education Semiparametric Regression: Least absolute deviations regression Parametric Regression: Least squares maximum likelihood regression 1-19/40
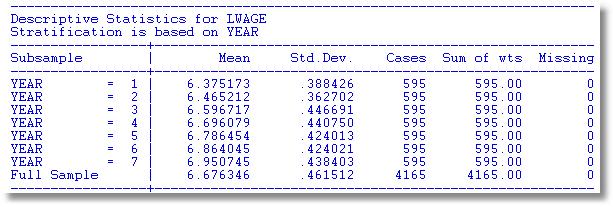
20 A First Look at the Data Descriptive Statistics Basic Measures of Location and Dispersion Graphical Devices Box Plots Histogram Kernel Density Estimator 1-20/40
21 1-21/40

22 Box Plots Shows upward trend in median log wage 1-22/40

23 Histogram: Pooled data obscure within person variation What is the source of the variance, variation across people or variation over time? 1-23/40
24 Kernel density estimator suggests the underlying distribution for a continuous variable * 1 n 1 x i xm ˆf(x m) K i 1 n B B 1 n Q(x x,b), for a set of points x i 1 n B "bandwidth" K the kernel function * * * i m m x* the point at which the density is approximated. ˆf(x*) is an estimator of f(x*) 1-24/40
 K i 1, for a set of points x n B B B \"bandwidth\" chosen by the analyst K the kernel function, such as the normal or logistic pdf (or one of several")
25 The kernel density estimator is a histogram (of sorts). * * * 1 n 1 xi xm ˆf(x m) K i 1, for a set of points x n B B B "bandwidth" chosen by the analyst K the kernel function, such as the normal or logistic pdf (or one of several others) x* the point at which the density is approximated. This is essentially a histogram with small bins. m 1-25/40
26 1-26/40
27 1-27/40
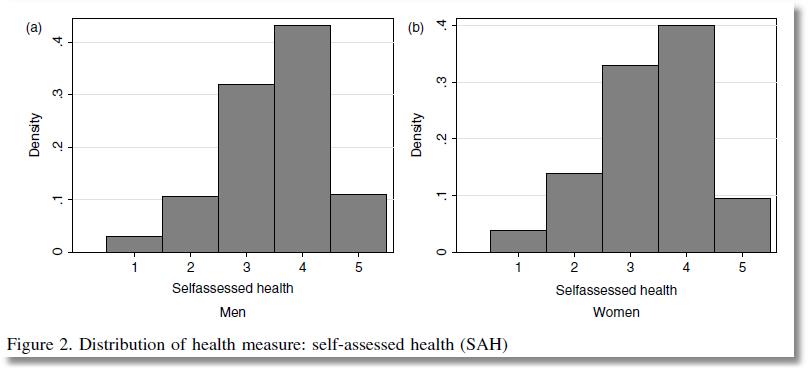
28 From Jones and Schurer (2011) Stylized Box Plot 1-28/40
29 From Jones and Schurer (2011) 1-29/40
30 Objective: Impact of Education on (log) Wage Specification: What is the right model to use to analyze this association? Estimation Inference Analysis 1-30/40

31 Simple Linear Regression LWAGE = *ED 1-31/40

32 Multiple Regression 1-32/40

33 Nonlinear Specification: Quadratic Effect of Experience 1-33/40
Wage to Gender and Education & Experience")
34 Model Building in Econometrics A Model Relating (Log)Wage to Gender and Education & Experience 1-34/40


35 Partial Effects Coefficients may not tell the story Education Experience *.00068*Exp FEM /40

36 Effect of Experience = *.00068*Exp Positive from 1 to 30, negative after. 1-36/40

37 Interaction Effect Gender Difference in Partial Effects 1-37/40
38 Partial Effect of a Year of Education E[logWage]/ ED = ED + ED*FEM *FEM = *FEM Note, the effect is positive. The effect 43% is larger for women. 1-38/40

39 Gender Effect Varies by Years of Education E[logWage]/ FEM = FEM + ED*FEM *ED = *ED 1-39/40


40 Analysts are interested in interaction effects in models. 1-40/40
Econometrics I. Professor William Greene Stern School of Business Department of Economics 12-1/54. Part 12: Endogeneity
 Econometrics I Professor William Greene Stern School of Business Department of Economics 12-1/54 Econometrics I Part 12 Endogeneity and IV Estimation 12-2/54 Sources of Endogeneity Omitted Variables Ignored
Inference and Regression
 Name Inference and Regression Final Examination, 2015 Department of IOMS This course and this examination are governed by the Stern Honor Code. Instructions Please write your name at the top of this page.
Introduction to Linear Regression Analysis
 Introduction to Linear Regression Analysis Samuel Nocito Lecture 1 March 2nd, 2018 Econometrics: What is it? Interaction of economic theory, observed data and statistical methods. The science of testing
Econometric Analysis of Panel Data Assignment 4 Parameter Heterogeneity in Linear Models: RPM and HLM
 Department of Economics Econometric Analysis of Panel Data Assignment 4 Parameter Heterogeneity in Linear Models: RPM and HLM The estimation parts of this assignment will be based on the Baltagi and Griffin
Economics 390 Economic Forecasting
 Economics 390 Economic Forecasting Prerequisite: Econ 410 or equivalent Course information is on website Office Hours Tuesdays & Thursdays 2:30 3:30 or by appointment Textbooks Forecasting for Economics
Econometrics I G (Part I) Fall 2004
 Fall 2004") Econometrics I G31.2100 (Part I) Fall 2004 Instructor: Time: Professor Christopher Flinn 269 Mercer Street, Room 302 Phone: 998 8925 E-mail: christopher.flinn@nyu.edu Homepage: http://www.econ.nyu.edu/user/flinnc
Econometrics I G31.2100 (Part I) Fall 2004 Instructor: Time: Professor Christopher Flinn 269 Mercer Street, Room 302 Phone: 998 8925 E-mail: christopher.flinn@nyu.edu Homepage: http://www.econ.nyu.edu/user/flinnc
LECTURE 1. Introduction to Econometrics
 LECTURE 1 Introduction to Econometrics Ján Palguta September 20, 2016 1 / 29 WHAT IS ECONOMETRICS? To beginning students, it may seem as if econometrics is an overly complex obstacle to an otherwise useful
Field Course Descriptions
 Field Course Descriptions Ph.D. Field Requirements 12 credit hours with 6 credit hours in each of two fields selected from the following fields. Each class can count towards only one field. Course descriptions
CURRICULUM VITAE. December Robert M. de Jong Tel: (614) Ohio State University Fax: (614)
 Ohio State University Fax: (614)") CURRICULUM VITAE December 2011 Robert M. de Jong Tel: (614) 292-2051 Ohio State University Fax: (614) 292-3906 Department of Economics Email: de-jong.8@osu.edu 444 Arps Hall Columbus, Ohio 43210, USA PERSONAL
CURRICULUM VITAE December 2011 Robert M. de Jong Tel: (614) 292-2051 Ohio State University Fax: (614) 292-3906 Department of Economics Email: de-jong.8@osu.edu 444 Arps Hall Columbus, Ohio 43210, USA PERSONAL
Econometric Analysis of Panel Data. Final Examination: Spring 2013
 Econometric Analysis of Panel Data Professor William Greene Phone: 212.998.0876 Office: KMC 7-90 Home page:www.stern.nyu.edu/~wgreene Email: wgreene@stern.nyu.edu URL for course web page: people.stern.nyu.edu/wgreene/econometrics/paneldataeconometrics.htm
Econometrics of Panel Data
 Econometrics of Panel Data Jakub Mućk Meeting # 4 Jakub Mućk Econometrics of Panel Data Meeting # 4 1 / 26 Outline 1 Two-way Error Component Model Fixed effects model Random effects model 2 Hausman-Taylor
Using EViews Vox Principles of Econometrics, Third Edition
 Using EViews Vox Principles of Econometrics, Third Edition WILLIAM E. GRIFFITHS University of Melbourne R. CARTER HILL Louisiana State University GUAY С LIM University of Melbourne JOHN WILEY & SONS, INC
Inference and Regression
 Name Inference and Regression Final Examination, 2016 Department of IOMS This course and this examination are governed by the Stern Honor Code. Instructions Please write your name at the top of this page.
Econometric Analysis of Panel Data. Final Examination: Spring 2018
 Department of Economics Econometric Analysis of Panel Data Professor William Greene Phone: 212.998.0876 Office: KMC 7-90 Home page: people.stern.nyu.edu/wgreene Email: wgreene@stern.nyu.edu URL for course
A Meta-Analysis of the Urban Wage Premium
 A Meta-Analysis of the Urban Wage Premium Ayoung Kim Dept. of Agricultural Economics, Purdue University kim1426@purdue.edu November 21, 2014 SHaPE seminar 2014 November 21, 2014 1 / 16 Urban Wage Premium
Simultaneous Equations with Error Components. Mike Bronner Marko Ledic Anja Breitwieser
 Simultaneous Equations with Error Components Mike Bronner Marko Ledic Anja Breitwieser PRESENTATION OUTLINE Part I: - Simultaneous equation models: overview - Empirical example Part II: - Hausman and Taylor
Econometrics of Panel Data
 Econometrics of Panel Data Jakub Mućk Meeting # 1 Jakub Mućk Econometrics of Panel Data Meeting # 1 1 / 31 Outline 1 Course outline 2 Panel data Advantages of Panel Data Limitations of Panel Data 3 Pooled
The Economics of European Regions: Theory, Empirics, and Policy
 The Economics of European Regions: Theory, Empirics, and Policy Dipartimento di Economia e Management Davide Fiaschi Angela Parenti 1 1 davide.fiaschi@unipi.it, and aparenti@ec.unipi.it. Fiaschi-Parenti
Applied Microeconometrics (L5): Panel Data-Basics
: Panel Data-Basics") Applied Microeconometrics (L5): Panel Data-Basics Nicholas Giannakopoulos University of Patras Department of Economics ngias@upatras.gr November 10, 2015 Nicholas Giannakopoulos (UPatras) MSc Applied Economics
Applied Microeconometrics (L5): Panel Data-Basics Nicholas Giannakopoulos University of Patras Department of Economics ngias@upatras.gr November 10, 2015 Nicholas Giannakopoulos (UPatras) MSc Applied Economics
ECONOMETRICS I Take Home Final Examination
 Department of Economics ECONOMETRICS I Take Home Final Examination Fall 2016 Professor William Greene Phone: 212.998.0876 Office: KMC 7-90 URL: people.stern.nyu.edu/wgreene e-mail: wgreene@stern.nyu.edu
Gibbs Sampling in Latent Variable Models #1
 Gibbs Sampling in Latent Variable Models #1 Econ 690 Purdue University Outline 1 Data augmentation 2 Probit Model Probit Application A Panel Probit Panel Probit 3 The Tobit Model Example: Female Labor
Nonparametric Identification of a Binary Random Factor in Cross Section Data - Supplemental Appendix
 Nonparametric Identification of a Binary Random Factor in Cross Section Data - Supplemental Appendix Yingying Dong and Arthur Lewbel California State University Fullerton and Boston College July 2010 Abstract
Regression #8: Loose Ends
 Regression #8: Loose Ends Econ 671 Purdue University Justin L. Tobias (Purdue) Regression #8 1 / 30 In this lecture we investigate a variety of topics that you are probably familiar with, but need to touch
5. Let W follow a normal distribution with mean of μ and the variance of 1. Then, the pdf of W is
 Practice Final Exam Last Name:, First Name:. Please write LEGIBLY. Answer all questions on this exam in the space provided (you may use the back of any page if you need more space). Show all work but do
Lecture 1. Introduction Statistics Statistical Methods II. Presented January 8, 2018
 Introduction Statistics 211 - Statistical Methods II Presented January 8, 2018 linear models Dan Gillen Department of Statistics University of California, Irvine 1.1 Logistics and Contact Information Lectures:
Econometrics in a nutshell: Variation and Identification Linear Regression Model in STATA. Research Methods. Carlos Noton.
 1/17 Research Methods Carlos Noton Term 2-2012 Outline 2/17 1 Econometrics in a nutshell: Variation and Identification 2 Main Assumptions 3/17 Dependent variable or outcome Y is the result of two forces:
Identification and Estimation Using Heteroscedasticity Without Instruments: The Binary Endogenous Regressor Case
 Identification and Estimation Using Heteroscedasticity Without Instruments: The Binary Endogenous Regressor Case Arthur Lewbel Boston College Original December 2016, revised July 2017 Abstract Lewbel (2012)
Problem Set 3: Bootstrap, Quantile Regression and MCMC Methods. MIT , Fall Due: Wednesday, 07 November 2007, 5:00 PM
 Problem Set 3: Bootstrap, Quantile Regression and MCMC Methods MIT 14.385, Fall 2007 Due: Wednesday, 07 November 2007, 5:00 PM 1 Applied Problems Instructions: The page indications given below give you
Warwick Economics Summer School Topics in Microeconometrics Instrumental Variables Estimation
 Warwick Economics Summer School Topics in Microeconometrics Instrumental Variables Estimation Michele Aquaro University of Warwick This version: July 21, 2016 1 / 31 Reading material Textbook: Introductory
MULTILEVEL MODELS WHERE THE RANDOM EFFECTS ARE CORRELATED WITH THE FIXED PREDICTORS
 MULTILEVEL MODELS WHERE THE RANDOM EFFECTS ARE CORRELATED WITH THE FIXED PREDICTORS Nigel Rice Centre for Health Economics University of York Heslington York Y01 5DD England and Institute of Education
Introduction. ECN 102: Analysis of Economic Data Winter, J. Parman (UC-Davis) Analysis of Economic Data, Winter 2011 January 4, / 51
 Analysis of Economic Data, Winter 2011 January 4, / 51") Introduction ECN 102: Analysis of Economic Data Winter, 2011 J. Parman (UC-Davis) Analysis of Economic Data, Winter 2011 January 4, 2011 1 / 51 Contact Information Instructor: John Parman Email: jmparman@ucdavis.edu
Introduction ECN 102: Analysis of Economic Data Winter, 2011 J. Parman (UC-Davis) Analysis of Economic Data, Winter 2011 January 4, 2011 1 / 51 Contact Information Instructor: John Parman Email: jmparman@ucdavis.edu
Master of Science in Statistics A Proposal
 1 Master of Science in Statistics A Proposal Rationale of the Program In order to cope up with the emerging complexity on the solutions of realistic problems involving several phenomena of nature it is
Exam D0M61A Advanced econometrics
 Exam D0M61A Advanced econometrics 19 January 2009, 9 12am Question 1 (5 pts.) Consider the wage function w i = β 0 + β 1 S i + β 2 E i + β 0 3h i + ε i, where w i is the log-wage of individual i, S i is
Applied Health Economics (for B.Sc.)
") Applied Health Economics (for B.Sc.) Helmut Farbmacher Department of Economics University of Mannheim Autumn Semester 2017 Outlook 1 Linear models (OLS, Omitted variables, 2SLS) 2 Limited and qualitative
Applied Health Economics (for B.Sc.) Helmut Farbmacher Department of Economics University of Mannheim Autumn Semester 2017 Outlook 1 Linear models (OLS, Omitted variables, 2SLS) 2 Limited and qualitative
ES103 Introduction to Econometrics
 Anita Staneva May 16, ES103 2015Introduction to Econometrics.. Lecture 1 ES103 Introduction to Econometrics Lecture 1: Basic Data Handling and Anita Staneva Egypt Scholars Economic Society Outline Introduction
Causal Inference Lecture Notes: Causal Inference with Repeated Measures in Observational Studies
 Causal Inference Lecture Notes: Causal Inference with Repeated Measures in Observational Studies Kosuke Imai Department of Politics Princeton University November 13, 2013 So far, we have essentially assumed
A Measure of Robustness to Misspecification
 A Measure of Robustness to Misspecification Susan Athey Guido W. Imbens December 2014 Graduate School of Business, Stanford University, and NBER. Electronic correspondence: athey@stanford.edu. Graduate
New York University Department of Economics. Applied Statistics and Econometrics G Spring 2013
 New York University Department of Economics Applied Statistics and Econometrics G31.1102 Spring 2013 Text: Econometric Analysis, 7 h Edition, by William Greene (Prentice Hall) Optional: A Guide to Modern
An Introduction to Causal Mediation Analysis. Xu Qin University of Chicago Presented at the Central Iowa R User Group Meetup Aug 10, 2016
 An Introduction to Causal Mediation Analysis Xu Qin University of Chicago Presented at the Central Iowa R User Group Meetup Aug 10, 2016 1 Causality In the applications of statistics, many central questions
Economics 113. Simple Regression Assumptions. Simple Regression Derivation. Changing Units of Measurement. Nonlinear effects
 Economics 113 Simple Regression Models Simple Regression Assumptions Simple Regression Derivation Changing Units of Measurement Nonlinear effects OLS and unbiased estimates Variance of the OLS estimates
Chapter 1 Introduction. What are longitudinal and panel data? Benefits and drawbacks of longitudinal data Longitudinal data models Historical notes
 Chapter 1 Introduction What are longitudinal and panel data? Benefits and drawbacks of longitudinal data Longitudinal data models Historical notes 1.1 What are longitudinal and panel data? With regression
Chapter 2 The Simple Linear Regression Model: Specification and Estimation
 Chapter The Simple Linear Regression Model: Specification and Estimation Page 1 Chapter Contents.1 An Economic Model. An Econometric Model.3 Estimating the Regression Parameters.4 Assessing the Least Squares
Kausalanalyse. Analysemöglichkeiten von Paneldaten
 Kausalanalyse Analysemöglichkeiten von Paneldaten Warum geht es in den folgenden Sitzungen? Sitzung Thema Paneldaten Einführung 1 2 3 4 5 6 7 8 9 10 11 12 13 14 09.04.2008 16.04.2008 23.04.2008 30.04.2008
Prerequisite: STATS 7 or STATS 8 or AP90 or (STATS 120A and STATS 120B and STATS 120C). AP90 with a minimum score of 3
. AP90 with a minimum score of 3") University of California, Irvine 2017-2018 1 Statistics (STATS) Courses STATS 5. Seminar in Data Science. 1 Unit. An introduction to the field of Data Science; intended for entering freshman and transfers.
University of California, Irvine 2017-2018 1 Statistics (STATS) Courses STATS 5. Seminar in Data Science. 1 Unit. An introduction to the field of Data Science; intended for entering freshman and transfers.
McGill University. Department of Epidemiology and Biostatistics. Bayesian Analysis for the Health Sciences. Course EPIB-682.
 McGill University Department of Epidemiology and Biostatistics Bayesian Analysis for the Health Sciences Course EPIB-682 Lawrence Joseph Intro to Bayesian Analysis for the Health Sciences EPIB-682 2 credits
Course Introduction and Overview Descriptive Statistics Conceptualizations of Variance Review of the General Linear Model
 Course Introduction and Overview Descriptive Statistics Conceptualizations of Variance Review of the General Linear Model PSYC 943 (930): Fundamentals of Multivariate Modeling Lecture 1: August 22, 2012
Identification and Estimation Using Heteroscedasticity Without Instruments: The Binary Endogenous Regressor Case
 Identification and Estimation Using Heteroscedasticity Without Instruments: The Binary Endogenous Regressor Case Arthur Lewbel Boston College December 2016 Abstract Lewbel (2012) provides an estimator
Statistical modelling: Theory and practice
 Statistical modelling: Theory and practice Introduction Gilles Guillot gigu@dtu.dk August 27, 2013 Gilles Guillot (gigu@dtu.dk) Stat. modelling August 27, 2013 1 / 6 Schedule 13 weeks weekly time slot:
APEC 8212: Econometric Analysis II
 APEC 8212: Econometric Analysis II Instructor: Paul Glewwe Spring, 2014 Office: 337a Ruttan Hall (formerly Classroom Office Building) Phone: 612-625-0225 E-Mail: pglewwe@umn.edu Class Website: http://faculty.apec.umn.edu/pglewwe/apec8212.html
Syllabus for MATHEMATICS FOR INTERNATIONAL RELATIONS
 Syllabus for MATHEMATICS FOR INTERNATIONAL RELATIONS Lecturers: Kirill Bukin, Nadezhda Shilova Class teachers: Pavel Zhukov, Nadezhda Shilova Course description Mathematics for international relations
ESTIMATING AVERAGE TREATMENT EFFECTS: REGRESSION DISCONTINUITY DESIGNS Jeff Wooldridge Michigan State University BGSE/IZA Course in Microeconometrics
 ESTIMATING AVERAGE TREATMENT EFFECTS: REGRESSION DISCONTINUITY DESIGNS Jeff Wooldridge Michigan State University BGSE/IZA Course in Microeconometrics July 2009 1. Introduction 2. The Sharp RD Design 3.
Chapter Fifteen. Frequency Distribution, Cross-Tabulation, and Hypothesis Testing
 Chapter Fifteen Frequency Distribution, Cross-Tabulation, and Hypothesis Testing Copyright 2010 Pearson Education, Inc. publishing as Prentice Hall 15-1 Internet Usage Data Table 15.1 Respondent Sex Familiarity
An Introduction to Econometrics. A Self-contained Approach. Frank Westhoff. The MIT Press Cambridge, Massachusetts London, England
 An Introduction to Econometrics A Self-contained Approach Frank Westhoff The MIT Press Cambridge, Massachusetts London, England How to Use This Book xvii 1 Descriptive Statistics 1 Chapter 1 Prep Questions
Marginal and Interaction Effects in Ordered Response Models
 MPRA Munich Personal RePEc Archive Marginal and Interaction Effects in Ordered Response Models Debdulal Mallick School of Accounting, Economics and Finance, Deakin University, Burwood, Victoria, Australia
Economics 671: Applied Econometrics Department of Economics, Finance and Legal Studies University of Alabama
 Problem Set #1 (Random Data Generation) 1. Generate =500random numbers from both the uniform 1 ( [0 1], uniformbetween zero and one) and exponential exp ( ) (set =2and let [0 1]) distributions. Plot the
12E016. Econometric Methods II 6 ECTS. Overview and Objectives
 Overview and Objectives This course builds on and further extends the econometric and statistical content studied in the first quarter, with a special focus on techniques relevant to the specific field
Johns Hopkins University Fall APPLIED ECONOMICS Regional Economics
 Johns Hopkins University Fall 2017 Applied Economics Sally Kwak APPLIED ECONOMICS 440.666 Regional Economics In this course, we will develop a coherent framework of theories and models in the field of
Econometrics of Policy Evaluation (Geneva summer school)
") Michael Lechner, Slide 1 Econometrics of Policy Evaluation (Geneva summer school) Michael Lechner Swiss Institute for Empirical Economic Research (SEW) University of St. Gallen Switzerland June 2016 Overview
Michael Lechner, Slide 1 Econometrics of Policy Evaluation (Geneva summer school) Michael Lechner Swiss Institute for Empirical Economic Research (SEW) University of St. Gallen Switzerland June 2016 Overview
MATH 450: Mathematical statistics
 Departments of Mathematical Sciences University of Delaware August 28th, 2018 General information Classes: Tuesday & Thursday 9:30-10:45 am, Gore Hall 115 Office hours: Tuesday Wednesday 1-2:30 pm, Ewing
Economics 326 Methods of Empirical Research in Economics. Lecture 1: Introduction
 Economics 326 Methods of Empirical Research in Economics Lecture 1: Introduction Hiro Kasahara University of British Columbia December 24, 2014 What is Econometrics? Econometrics is concerned with the
Eviews for Panel Data. George Chobanov
 Eviews for Panel Data George Chobanov Eviews for Panel Data The Genesis of Econometric Relationships Types of Data Advantages of Using Panel Data Limitations and Challenges in Applying Panel Data Panel
1. Regressions and Regression Models. 2. Model Example. EEP/IAS Introductory Applied Econometrics Fall Erin Kelley Section Handout 1
 1. Regressions and Regression Models Simply put, economists use regression models to study the relationship between two variables. If Y and X are two variables, representing some population, we are interested
A Monte Carlo Comparison of Various Semiparametric Type-3 Tobit Estimators
 ANNALS OF ECONOMICS AND FINANCE 4, 125 136 (2003) A Monte Carlo Comparison of Various Semiparametric Type-3 Tobit Estimators Insik Min Department of Economics, Texas A&M University E-mail: i0m5376@neo.tamu.edu
Empirical approaches in public economics
 Empirical approaches in public economics ECON4624 Empirical Public Economics Fall 2016 Gaute Torsvik Outline for today The canonical problem Basic concepts of causal inference Randomized experiments Non-experimental
Using Relative Distribution Software
 Michele L SHAFFER and Mark S HANDCOCK Using Relative Distribution Software Relative distribution methods are a nonparametric statistical approach to the comparison of distribution These methods combine
Important Dates. Non-instructional days. No classes. College offices closed.
 Instructor: Dr. Alexander Krantsberg Email: akrantsberg@nvcc.edu Phone: 703-845-6548 Office: Bisdorf, Room AA 352 Class Time: Mondays and Wednesdays 12:30 PM - 1:45 PM. Classroom: Bisdorf / AA 354 Office
Longitudinal Data Analysis Using SAS Paul D. Allison, Ph.D. Upcoming Seminar: October 13-14, 2017, Boston, Massachusetts
 Longitudinal Data Analysis Using SAS Paul D. Allison, Ph.D. Upcoming Seminar: October 13-14, 217, Boston, Massachusetts Outline 1. Opportunities and challenges of panel data. a. Data requirements b. Control
Longitudinal and Panel Data: Analysis and Applications for the Social Sciences. Table of Contents
 Longitudinal and Panel Data Preface / i Longitudinal and Panel Data: Analysis and Applications for the Social Sciences Table of Contents August, 2003 Table of Contents Preface i vi 1. Introduction 1.1
WISE MA/PhD Programs Econometrics Instructor: Brett Graham Spring Semester, Academic Year Exam Version: A
 WISE MA/PhD Programs Econometrics Instructor: Brett Graham Spring Semester, 2015-16 Academic Year Exam Version: A INSTRUCTIONS TO STUDENTS 1 The time allowed for this examination paper is 2 hours. 2 This
DOCUMENTS DE TRAVAIL CEMOI / CEMOI WORKING PAPERS. A SAS macro to estimate Average Treatment Effects with Matching Estimators
 DOCUMENTS DE TRAVAIL CEMOI / CEMOI WORKING PAPERS A SAS macro to estimate Average Treatment Effects with Matching Estimators Nicolas Moreau 1 http://cemoi.univ-reunion.fr/publications/ Centre d'economie
Math 200D - Linear Algebra Fall Term 2017 Course Description
 Math 200D - Linear Algebra Fall Term 2017 Course Description September 6, 2017 Instructor: John Schmitt Office: Warner 311, Tel: Ext. 5952 E-mail: jschmitt@middlebury.edu Office Hours: Monday 1:30pm-2:30pm,
This article appeared in a journal published by Elsevier. The attached copy is furnished to the author for internal non-commercial research and
 This article appeared in a journal published by Elsevier. The attached copy is furnished to the author for internal non-commercial research and education use, including for instruction at the authors institution
Introduction to GSEM in Stata
 Introduction to GSEM in Stata Christopher F Baum ECON 8823: Applied Econometrics Boston College, Spring 2016 Christopher F Baum (BC / DIW) Introduction to GSEM in Stata Boston College, Spring 2016 1 /
Nonparametric Density Estimation
 Nonparametric Density Estimation Advanced Econometrics Douglas G. Steigerwald UC Santa Barbara D. Steigerwald (UCSB) Density Estimation 1 / 20 Overview Question of interest has wage inequality among women
ESTIMATION OF TREATMENT EFFECTS VIA MATCHING
 ESTIMATION OF TREATMENT EFFECTS VIA MATCHING AAEC 56 INSTRUCTOR: KLAUS MOELTNER Textbooks: R scripts: Wooldridge (00), Ch.; Greene (0), Ch.9; Angrist and Pischke (00), Ch. 3 mod5s3 General Approach The
2) For a normal distribution, the skewness and kurtosis measures are as follows: A) 1.96 and 4 B) 1 and 2 C) 0 and 3 D) 0 and 0
 For a normal distribution, the skewness and kurtosis measures are as follows: A) 1.96 and 4 B) 1 and 2 C) 0 and 3 D) 0 and 0") Introduction to Econometrics Midterm April 26, 2011 Name Student ID MULTIPLE CHOICE. Choose the one alternative that best completes the statement or answers the question. (5,000 credit for each correct
Introduction to Econometrics Midterm April 26, 2011 Name Student ID MULTIPLE CHOICE. Choose the one alternative that best completes the statement or answers the question. (5,000 credit for each correct
Do Markov-Switching Models Capture Nonlinearities in the Data? Tests using Nonparametric Methods
 Do Markov-Switching Models Capture Nonlinearities in the Data? Tests using Nonparametric Methods Robert V. Breunig Centre for Economic Policy Research, Research School of Social Sciences and School of
Regression Discontinuity Designs.
 Regression Discontinuity Designs. Department of Economics and Management Irene Brunetti ireneb@ec.unipi.it 31/10/2017 I. Brunetti Labour Economics in an European Perspective 31/10/2017 1 / 36 Introduction
Labor-Supply Shifts and Economic Fluctuations. Technical Appendix
 Labor-Supply Shifts and Economic Fluctuations Technical Appendix Yongsung Chang Department of Economics University of Pennsylvania Frank Schorfheide Department of Economics University of Pennsylvania January
Economics 270c Graduate Development Economics. Professor Ted Miguel Department of Economics University of California, Berkeley
 Economics 270c Graduate Development Economics Professor Ted Miguel Department of Economics University of California, Berkeley Economics 270c Graduate Development Economics Lecture 2 January 27, 2009 Lecture
A Course on Advanced Econometrics
 A Course on Advanced Econometrics Yongmiao Hong The Ernest S. Liu Professor of Economics & International Studies Cornell University Course Introduction: Modern economies are full of uncertainties and risk.
Causal Inference with Big Data Sets
 Causal Inference with Big Data Sets Marcelo Coca Perraillon University of Colorado AMC November 2016 1 / 1 Outlone Outline Big data Causal inference in economics and statistics Regression discontinuity
Applied Econometrics (MSc.) Lecture 3 Instrumental Variables
 Lecture 3 Instrumental Variables") Applied Econometrics (MSc.) Lecture 3 Instrumental Variables Estimation - Theory Department of Economics University of Gothenburg December 4, 2014 1/28 Why IV estimation? So far, in OLS, we assumed independence.
Applied Econometrics (MSc.) Lecture 3 Instrumental Variables Estimation - Theory Department of Economics University of Gothenburg December 4, 2014 1/28 Why IV estimation? So far, in OLS, we assumed independence.
Sources of Inequality: Additive Decomposition of the Gini Coefficient.
 Sources of Inequality: Additive Decomposition of the Gini Coefficient. Carlos Hurtado Econometrics Seminar Department of Economics University of Illinois at Urbana-Champaign hrtdmrt2@illinois.edu Feb 24th,
Calibration Estimation of Semiparametric Copula Models with Data Missing at Random
 Calibration Estimation of Semiparametric Copula Models with Data Missing at Random Shigeyuki Hamori 1 Kaiji Motegi 1 Zheng Zhang 2 1 Kobe University 2 Renmin University of China Econometrics Workshop UNC
Quantile methods. Class Notes Manuel Arellano December 1, Let F (r) =Pr(Y r). Forτ (0, 1), theτth population quantile of Y is defined to be
 =Pr(Y r). Forτ (0, 1), theτth population quantile of Y is defined to be") Quantile methods Class Notes Manuel Arellano December 1, 2009 1 Unconditional quantiles Let F (r) =Pr(Y r). Forτ (0, 1), theτth population quantile of Y is defined to be Q τ (Y ) q τ F 1 (τ) =inf{r : F
Quantile methods Class Notes Manuel Arellano December 1, 2009 1 Unconditional quantiles Let F (r) =Pr(Y r). Forτ (0, 1), theτth population quantile of Y is defined to be Q τ (Y ) q τ F 1 (τ) =inf{r : F
Independent and conditionally independent counterfactual distributions
 Independent and conditionally independent counterfactual distributions Marcin Wolski European Investment Bank M.Wolski@eib.org Society for Nonlinear Dynamics and Econometrics Tokyo March 19, 2018 Views
Truncation and Censoring
 Truncation and Censoring Laura Magazzini laura.magazzini@univr.it Laura Magazzini (@univr.it) Truncation and Censoring 1 / 35 Truncation and censoring Truncation: sample data are drawn from a subset of
Stat 5101 Lecture Notes
 Stat 5101 Lecture Notes Charles J. Geyer Copyright 1998, 1999, 2000, 2001 by Charles J. Geyer May 7, 2001 ii Stat 5101 (Geyer) Course Notes Contents 1 Random Variables and Change of Variables 1 1.1 Random
Homework Set 3, ECO 311, Spring 2014
 Homework Set 3, ECO 311, Spring 2014 Due Date: At the beginning of class on May 7, 2014 Instruction: There are eleven questions. Each question is worth 2 points. You need to submit the answers of only
WISE International Masters
 WISE International Masters ECONOMETRICS Instructor: Brett Graham INSTRUCTIONS TO STUDENTS 1 The time allowed for this examination paper is 2 hours. 2 This examination paper contains 32 questions. You are
Analysis of travel-to-work patterns and the identification and classification of REDZs
 Analysis of travel-to-work patterns and the identification and classification of REDZs Dr David Meredith, Teagasc, Spatial Analysis Unit, Rural Economy Development Programme, Ashtown, Dublin 15. david.meredith@teagasc.ie
GROWING APART: THE CHANGING FIRM-SIZE WAGE PREMIUM AND ITS INEQUALITY CONSEQUENCES ONLINE APPENDIX
 GROWING APART: THE CHANGING FIRM-SIZE WAGE PREMIUM AND ITS INEQUALITY CONSEQUENCES ONLINE APPENDIX The following document is the online appendix for the paper, Growing Apart: The Changing Firm-Size Wage
Economics 308: Econometrics Professor Moody
 Economics 308: Econometrics Professor Moody References on reserve: Text Moody, Basic Econometrics with Stata (BES) Pindyck and Rubinfeld, Econometric Models and Economic Forecasts (PR) Wooldridge, Jeffrey
Syllabus. By Joan Llull. Microeconometrics. IDEA PhD Program. Fall Chapter 1: Introduction and a Brief Review of Relevant Tools
 Syllabus By Joan Llull Microeconometrics. IDEA PhD Program. Fall 2017 Chapter 1: Introduction and a Brief Review of Relevant Tools I. Overview II. Maximum Likelihood A. The Likelihood Principle B. The
Internal vs. external validity. External validity. This section is based on Stock and Watson s Chapter 9.
 Section 7 Model Assessment This section is based on Stock and Watson s Chapter 9. Internal vs. external validity Internal validity refers to whether the analysis is valid for the population and sample
E c o n o m e t r i c s
 H:/Lehre/Econometrics Master/Lecture slides/chap 0.tex (October 7, 2015) E c o n o m e t r i c s This course 1 People Instructor: Professor Dr. Roman Liesenfeld SSC-Gebäude, Universitätsstr. 22, Room 4.309
THE DESIGN (VERSUS THE ANALYSIS) OF EVALUATIONS FROM OBSERVATIONAL STUDIES: PARALLELS WITH THE DESIGN OF RANDOMIZED EXPERIMENTS DONALD B.
 OF EVALUATIONS FROM OBSERVATIONAL STUDIES: PARALLELS WITH THE DESIGN OF RANDOMIZED EXPERIMENTS DONALD B.") THE DESIGN (VERSUS THE ANALYSIS) OF EVALUATIONS FROM OBSERVATIONAL STUDIES: PARALLELS WITH THE DESIGN OF RANDOMIZED EXPERIMENTS DONALD B. RUBIN My perspective on inference for causal effects: In randomized
THE DESIGN (VERSUS THE ANALYSIS) OF EVALUATIONS FROM OBSERVATIONAL STUDIES: PARALLELS WITH THE DESIGN OF RANDOMIZED EXPERIMENTS DONALD B. RUBIN My perspective on inference for causal effects: In randomized
Introduction to Econometrics
 Introduction to Econometrics T H I R D E D I T I O N Global Edition James H. Stock Harvard University Mark W. Watson Princeton University Boston Columbus Indianapolis New York San Francisco Upper Saddle
STATISTICS 3A03. Applied Regression Analysis with SAS. Angelo J. Canty
 STATISTICS 3A03 Applied Regression Analysis with SAS Angelo J. Canty Office : Hamilton Hall 209 Phone : (905) 525-9140 extn 27079 E-mail : cantya@mcmaster.ca SAS Labs : L1 Friday 11:30 in BSB 249 L2 Tuesday