12 slots, 2 hours each. A homework: visualization, simple testing, and simple classification algorithms.
|
|
|
- Clinton Garrett
- 5 years ago
- Views:
Transcription
1
2 12 slots, 2 hours each. A homework: visualization, simple testing, and simple classification algorithms.
3 Approximate Syllabus: Organization and structure. Intro to R. Set operations. Venn diagramms. De Morgan s laws. Probability. Tutorial in R. Descriptive statistics. Plots in R. Conditional probability and Bayes theorem. Random variables and their distributions. Expectations, moments and transformations. Markov s inequality. Chebyshev s inequality. Some univariate discrete and continuous distributions. Sampling distributions and main large scale sample theorems. Normal distribution. Central Limit Theorem. T-distributions, F-distribution. Testing the significance. p<0.05. One sample Z-test. One sided and two sided tests. The p-value. Testing miu with unknown sigma. The t- test. Testing the variance. Type I and II Errors. The power of a test. Hypothesis testing for two and more samples. ANOVA testing. Other tests. Correlation and association analysis. Chi-square test. Entropy. Mutual information. Linear correlation. Intraclass correlation.
4 Approximate Syllabus (ctd): Modelling of data. Linear regression. Maximum likehood estimation. Model diagnostics. Logistic regression and odds ratio. Stepwise regression and finding the best model. Rigid and lasso algorithms. Classification. LDA. Nearest centroid. knn. Artificial Neural Network. SVM. Dimension reduction. Cross validation. Assess performance of the classifier. Accuracy. Sensitivity. Specificity. Matthews correlation coefficient. Introduction to Perceptron. Multilayer NN. PCA vs LDA. Unsupervised learning. K-means algorithm. Hierarchical clustering. Nearest-Neighbour algorithm. Parenclitical Network Analysis. Integrated Information. Genetic intelligence. Alexey Zaikin/Oleg Blyuss. Approximate Bayesian Calculations. Importance sampling. MCMC - Markov Chain Monte Carlo. Case study: serial oncomarkes. Thomas Bartlett: Sparse Statistical Modelling
5 , SAS, Stata
6
7

8 Install R-studio!
9 1.6 First look at probability A first look at Probability vs Statistics: Probability: deals with formalizing the mechanism that generated the data. Given a model written in terms of probability we can then study its mathematical properties and understand or predict which events are likely to happen in the future or under different scenarios Statistics: involves the analysis of the frequency of past events. Historical data can be used to test whether a probability model a suitable or not. If it is, the probability model will help us to understand the situation and guide us in making decisions. Probability Ideal world of the model Real world Statistics

10 1.8 Stochasticity Description of the real world as probabilistic world is actually natural Thermodynamics: to describe the impact of huge number of molecules Quantum dynamics: the Heisenberg uncertainty principle. Is stochasticity a fundamental property of our world? Deterministic chaos. The Lorenz attractor:
11 1.7 Sample space Any process of observation is referred to as an experiment. The results of an experiment are its outcomes Probability is a way of expressing knowledge or belief that an event will occur or has occurred. To define the probability we will need to define a set S consisting of all possible outcomes of the experiment. The sample space S is the set of all possible outcomes of a random experiment An element s of S is a sample point A sample space S is said to be discrete if it consists of a finite number of sample points countable if its elements can be placed in a one-to-one correspondence with positive integers continuous if the sample points consitute a continuum The set containing no element is called the null or empty set and is denoted by ø. This is the unique set that contains no elements.
12
13 ?
14 4}
15
16 1.14 Diagramms
17 1.15 More on diagramms
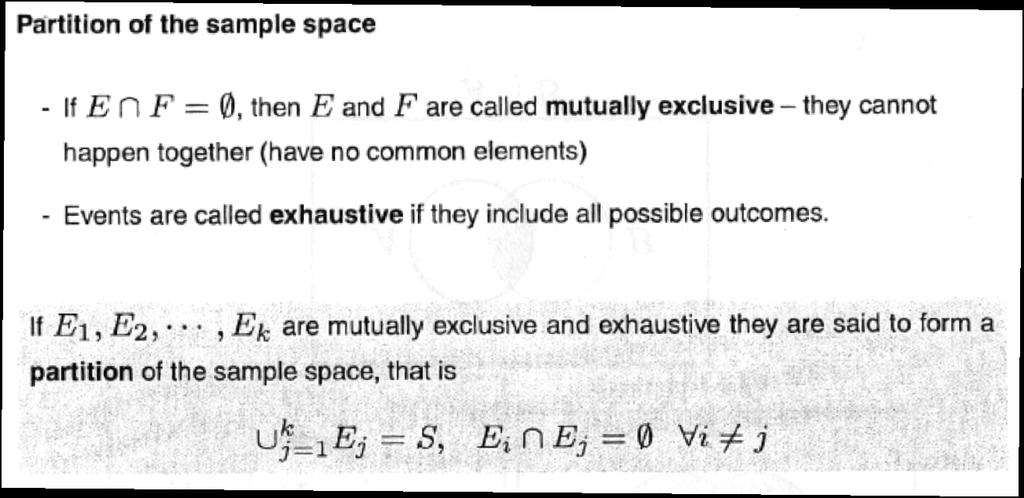
18 1.16 Partitions
19 1.19 Summary
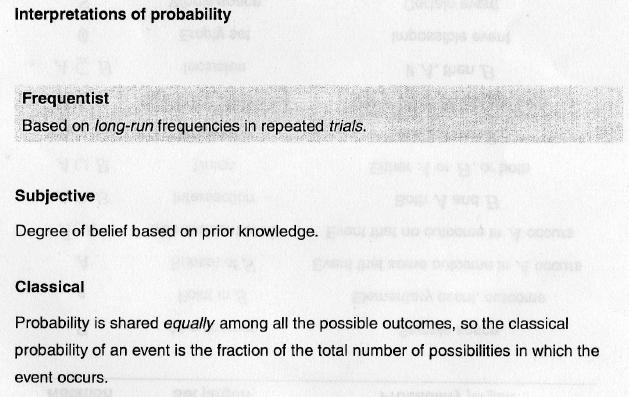
20 1.21 Interpretations
21
22
23
24
25
26 1.27 Lifetime of cells
27 Tutorial In R

28 1.27 Data structures in R 1.28 Data Structure in R
29 1.29 Data Structure in R
30 1.30 Data Structure in R
31 1.31 Data Structure in R
32 1.32 Data Structure in R
33 1.33 Data Structure in R
34 1.33 Data Structure in R
35 1.34 Data Structure in R
36 1.35 Data Structure in R
37 1.36 Data Structure in R > attributes(d) $names [1] "x" "y" $row.names [1] $class [1] "data.frame"
38 1.37 Operations with matrix elements

39 1.38 Getting data in R There are different opportunities to get data in R: 1.Read them from file, txt file or Excel file

40 1.39 Getting data in R 2. Generate data inside R

41 2. Download data from R databank 1.40 Getting data in R
42 Descriptive statistics
43 1.43 Phases of a statistical analysis
44 1.44 Random sample and parametric modelling
45 1.45 Phases on a data analysis
46 1.46
47 1.47 Initial stage
48 1.48
49 1.49 measurements of central tendency
50 1.50 Quantiles and range
51 1.51 Skewness
52 1.52
53 1.53 Mean, mode and median in skewed sample distributions
54 x11(width=5,height=4) par(mar=c(1,1,1,1)*5) layout(matrix(1:1,1,1)) x=seq(0,10,by=0.1) plot(x,sin(x),type="l",col="red") dev.copy2eps(file="sin.ps") OR dev.copy2pdf(file="sin.pdf") 1.54 Writing the plot in the file
55 library(usingr) simple.hist.and.boxplot(rnorm(100,mean=1,sd=1)) 1.55 Histogramms
56 boxplot(case[,7],case[,8],col=c("red","blue"),notch=t) 1.59 Boxplots with notches are plotted using the following numbers: 0.25, 0.5 and 0.75 quartiles standing for box bottom, horizontal line and box top, samples extremes for whiskers, and 95% median confidence interval for notches. The confidence interval for the median is calculated as +/- 1.58IQR / n where IQR is the interquartile interval and n is the sample size.
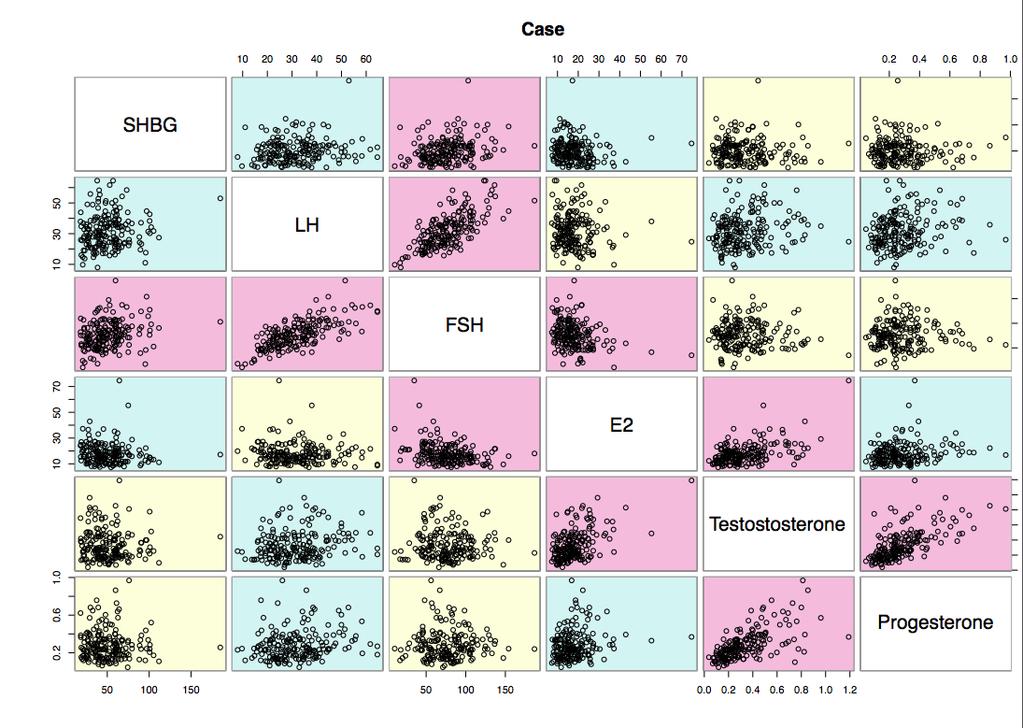
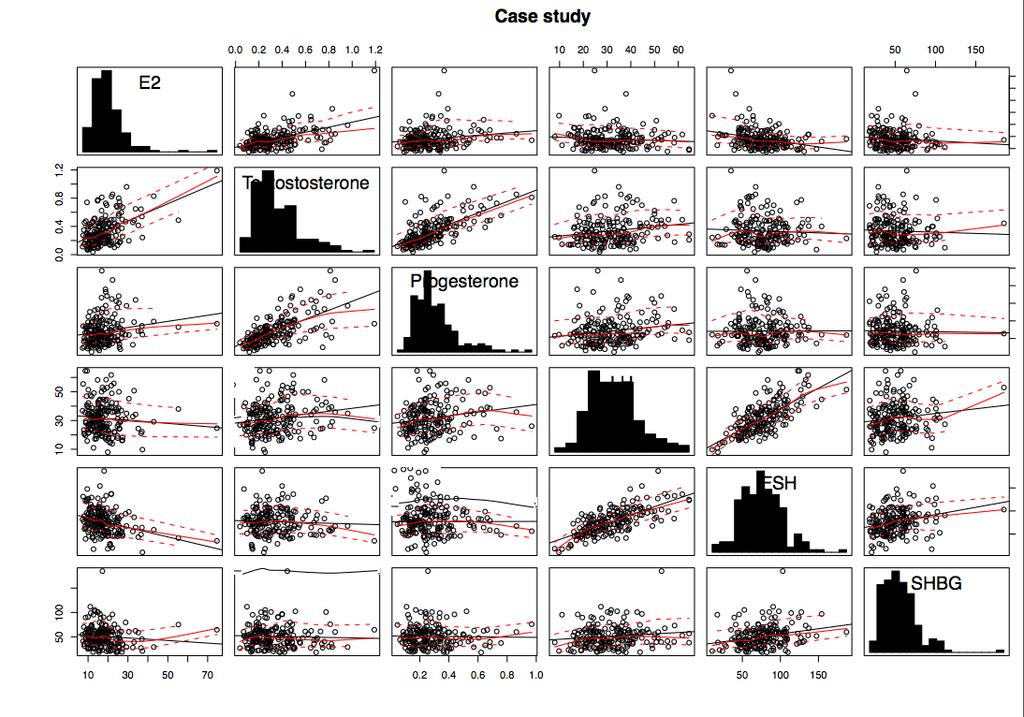
57 # ##################################################### case<-read.csv("case_wo_outlier.txt", header=t,sep="\t") ############################################## Scatterplot Matrices from the glus Package ############################################## postscript('casescatterplots2.ps') library(gclus) dta <-case[,2:7] dta.r <- abs(cor(dta)) # get correlations dta.col <- dmat.color(dta.r) # get colors # reorder variables so those with highest correlation # are closest to the diagonal dta.o <- order.single(dta.r) cpairs(dta, dta.o, panel.colors=dta.col, gap=.5, main="case" ) dev.off() cor(case[,2:7]) ############################################## Scatterplot Matrices from the car Package ############################################## library(car) postscript('casescatterplots.ps') scatterplot.matrix(case[,2:7], data=null, diagonal=c("histogram"), main="case study",dev.off()) 1.56 Sophisticated scatter plots
58 5.12
59 5.12
60 Try by yourself: x=rnorm(200,mean=1,sd=1) x1=rnorm(200,mean=2,sd=1) x4=rnorm(200,mean=4,sd=1) x2=rnorm(200,mean=2,sd=1) x3=rnorm(200,mean=1.5,sd=1) library(gclus) dta=cbind(x,x1,x2,x3,x4) dta=cbind(x,x1,x2,x3) dta.r <- abs(cor(dta)) # get correlations dta.col <- dmat.color(dta.r) # get colors dta.o <- order.single(dta.r) cpairs(dta, dta.o, panel.colors=dta.col, gap=.5, main="case" ) library(car) scatterplot.matrix(dta, data=null, diagonal=c("histogram"), main="case study") 60
 x2=rnorm(300,mean=10,sd=3) x3=rnorm(300,mean=1,sd=3) x4=rnorm(300,mean=1,sd=3) library(rggobi)")
61 x=rnorm(300,mean=1,sd=3) y=rnorm(300,mean=1,sd=3) z=rnorm(300,mean=1,sd=3) t=rnorm(300,mean=1,sd=3) 1.60 multidimensional vizualization x1=rnorm(300,mean=10,sd=3) x2=rnorm(300,mean=10,sd=3) x3=rnorm(300,mean=1,sd=3) x4=rnorm(300,mean=1,sd=3) library(rggobi) data=rbind(cbind(x,y,z,t),cbind(x1,x2,x3,x4)) c = ggobi(data) glyph_colour(c[1])<-c(rep(3,300),rep(4,300)) Allows visualization in multi (>3D) dimensional space!
62 Suppose we have data0x and data12x data files. Plot densities of columns 1 maxi=max(c(data0x[,1],data12x[,1]),na.rm =T) mini=min(c(data0x[,1],data12x[,1]),na.rm =T) 1.61 plotting densities plot(density(data0x[,1],adjust=0.7,na.rm=t), xlab=names(data0x)[1],ylab="probability", main="", col="blue",type="l",xlim=c(mini,maxi),ylim=c(0,ylim),lwd=2 ) points(density(data12x[,1],adjust=0.7,na.rm=t), col="red",type="l",lwd=2) points(c(mean(data0x[,1],na.rm=t),mean(data0x[,1],na.rm=t)),c(0,1.0),type="l",col="blue",lwd=0.6) points(c(mean(data12x[,1],na.rm=t),mean(data12x[,1],na.rm=t)),c(0,1.0),type="l",col="red",lwd=0.6)
63 layout(matrix(c(1:6),3,2)) for(i in 1:6){ maxi=max(c(data0x[,i],data12x[,i]),na.rm =T) mini=min(c(data0x[,i],data12x[,i]),na.rm =T) v=c(0:20)*(maxi-mini)/20.0+mini h1=hist(data0x[,i],plot=f,breaks=v) h2=hist(data12x[,i],plot=f,breaks=v) maxi2=max(c(h1$density,h2$density)) 1.62 array of plots if(i==3) {ylim=1.4; maxi=10 } else if(i==4) {ylim=2.5; maxi=4 }else if(i==5) {ylim=1.2; maxi=4 }else if(i==6) {ylim=1.; maxi=7 } else ylim=maxi2 plot(density(data0x[,i],adjust=0.7,na.rm=t), xlab=names(data0x)[i],ylab="probability", main="", col="blue",type="l",xlim=c(mini,maxi),ylim=c(0,ylim),lwd=2 ) points(density(data12x[,i],adjust=0.7,na.rm=t), col="red",type="l",lwd=2) points(c(mean(data0x[,i],na.rm=t),mean(data0x[,i],na.rm=t)),c(0,1.0),type="l",col="blue",lwd=0.6) points(c(mean(data12x[,i],na.rm=t),mean(data12x[,i],na.rm=t)),c(0,1.0),type="l",col="red",lwd=0.6) } dev.copy2eps(file=paste("densities_0_12",".ps",sep=""))
64 layout(matrix(c(1:4),2,2)) a=0 page=0 for(i in 1:5){ for(j in (i+1):6){ if(a>=4){ a=0 page=page+1 dev.copy2eps(file=paste("scatterplots_",page,".ps",sep="")) } a=a+1 max_x=max(c(data0xx[,i],data12x[,i]),na.rm =T) min_x=min(c(data0xx[,i],data12x[,i]),na.rm =T) max_y=max(c(data0xx[,j],data12x[,j]),na.rm =T) min_y=min(c(data0xx[,j],data12x[,j]),na.rm =T) 1.63 plotting on several pages plot(data0xx[,i],data0xx[,j],col="blue",main="scatter plots", xlab=names(data0xx)[i],ylab=names(data0xx) [j],xlim=c(min_x,max_x),ylim=c(min_y,max_y),cex=0.2) points(data12x[,i],data12x[,j],col="red",cex=0.2) } } page=page+1 dev.copy2eps(file=paste("scatterplots_",page,".ps",sep=""))
Course in Data Science
 Course in Data Science About the Course: In this course you will get an introduction to the main tools and ideas which are required for Data Scientist/Business Analyst/Data Analyst. The course gives an
Fundamentals to Biostatistics. Prof. Chandan Chakraborty Associate Professor School of Medical Science & Technology IIT Kharagpur
 Fundamentals to Biostatistics Prof. Chandan Chakraborty Associate Professor School of Medical Science & Technology IIT Kharagpur Statistics collection, analysis, interpretation of data development of new
Pattern Recognition and Machine Learning
 Christopher M. Bishop Pattern Recognition and Machine Learning ÖSpri inger Contents Preface Mathematical notation Contents vii xi xiii 1 Introduction 1 1.1 Example: Polynomial Curve Fitting 4 1.2 Probability
PATTERN CLASSIFICATION
 PATTERN CLASSIFICATION Second Edition Richard O. Duda Peter E. Hart David G. Stork A Wiley-lnterscience Publication JOHN WILEY & SONS, INC. New York Chichester Weinheim Brisbane Singapore Toronto CONTENTS
Information Dynamics Foundations and Applications
 Gustavo Deco Bernd Schürmann Information Dynamics Foundations and Applications With 89 Illustrations Springer PREFACE vii CHAPTER 1 Introduction 1 CHAPTER 2 Dynamical Systems: An Overview 7 2.1 Deterministic
Machine Learning Linear Classification. Prof. Matteo Matteucci
 Machine Learning Linear Classification Prof. Matteo Matteucci Recall from the first lecture 2 X R p Regression Y R Continuous Output X R p Y {Ω 0, Ω 1,, Ω K } Classification Discrete Output X R p Y (X)
Glossary for the Triola Statistics Series
 Glossary for the Triola Statistics Series Absolute deviation The measure of variation equal to the sum of the deviations of each value from the mean, divided by the number of values Acceptance sampling
Statistics Toolbox 6. Apply statistical algorithms and probability models
 Statistics Toolbox 6 Apply statistical algorithms and probability models Statistics Toolbox provides engineers, scientists, researchers, financial analysts, and statisticians with a comprehensive set of
Descriptive Statistics
 Descriptive Statistics DS GA 1002 Probability and Statistics for Data Science http://www.cims.nyu.edu/~cfgranda/pages/dsga1002_fall17 Carlos Fernandez-Granda Descriptive statistics Techniques to visualize
Introduction to Signal Detection and Classification. Phani Chavali
 Introduction to Signal Detection and Classification Phani Chavali Outline Detection Problem Performance Measures Receiver Operating Characteristics (ROC) F-Test - Test Linear Discriminant Analysis (LDA)
1. Exploratory Data Analysis
 1. Exploratory Data Analysis 1.1 Methods of Displaying Data A visual display aids understanding and can highlight features which may be worth exploring more formally. Displays should have impact and be
The connection of dropout and Bayesian statistics
 The connection of dropout and Bayesian statistics Interpretation of dropout as approximate Bayesian modelling of NN http://mlg.eng.cam.ac.uk/yarin/thesis/thesis.pdf Dropout Geoffrey Hinton Google, University
BNG 495 Capstone Design. Descriptive Statistics
 BNG 495 Capstone Design Descriptive Statistics Overview The overall goal of this short course in statistics is to provide an introduction to descriptive and inferential statistical methods, with a focus
STA 4273H: Statistical Machine Learning
 STA 4273H: Statistical Machine Learning Russ Salakhutdinov Department of Statistics! rsalakhu@utstat.toronto.edu! http://www.utstat.utoronto.ca/~rsalakhu/ Sidney Smith Hall, Room 6002 Lecture 3 Linear
L11: Pattern recognition principles
 L11: Pattern recognition principles Bayesian decision theory Statistical classifiers Dimensionality reduction Clustering This lecture is partly based on [Huang, Acero and Hon, 2001, ch. 4] Introduction
ECE 521. Lecture 11 (not on midterm material) 13 February K-means clustering, Dimensionality reduction
 13 February K-means clustering, Dimensionality reduction") ECE 521 Lecture 11 (not on midterm material) 13 February 2017 K-means clustering, Dimensionality reduction With thanks to Ruslan Salakhutdinov for an earlier version of the slides Overview K-means clustering
ECE 521 Lecture 11 (not on midterm material) 13 February 2017 K-means clustering, Dimensionality reduction With thanks to Ruslan Salakhutdinov for an earlier version of the slides Overview K-means clustering
Computational Genomics
 Computational Genomics http://www.cs.cmu.edu/~02710 Introduction to probability, statistics and algorithms (brief) intro to probability Basic notations Random variable - referring to an element / event
Master of Science in Statistics A Proposal
 1 Master of Science in Statistics A Proposal Rationale of the Program In order to cope up with the emerging complexity on the solutions of realistic problems involving several phenomena of nature it is
9/12/17. Types of learning. Modeling data. Supervised learning: Classification. Supervised learning: Regression. Unsupervised learning: Clustering
 Types of learning Modeling data Supervised: we know input and targets Goal is to learn a model that, given input data, accurately predicts target data Unsupervised: we know the input only and want to make
Prerequisite: STATS 7 or STATS 8 or AP90 or (STATS 120A and STATS 120B and STATS 120C). AP90 with a minimum score of 3
. AP90 with a minimum score of 3") University of California, Irvine 2017-2018 1 Statistics (STATS) Courses STATS 5. Seminar in Data Science. 1 Unit. An introduction to the field of Data Science; intended for entering freshman and transfers.
University of California, Irvine 2017-2018 1 Statistics (STATS) Courses STATS 5. Seminar in Data Science. 1 Unit. An introduction to the field of Data Science; intended for entering freshman and transfers.
Transition Passage to Descriptive Statistics 28
 viii Preface xiv chapter 1 Introduction 1 Disciplines That Use Quantitative Data 5 What Do You Mean, Statistics? 6 Statistics: A Dynamic Discipline 8 Some Terminology 9 Problems and Answers 12 Scales of
BAYESIAN METHODS FOR VARIABLE SELECTION WITH APPLICATIONS TO HIGH-DIMENSIONAL DATA
 BAYESIAN METHODS FOR VARIABLE SELECTION WITH APPLICATIONS TO HIGH-DIMENSIONAL DATA Intro: Course Outline and Brief Intro to Marina Vannucci Rice University, USA PASI-CIMAT 04/28-30/2010 Marina Vannucci
Turning a research question into a statistical question.
 Turning a research question into a statistical question. IGINAL QUESTION: Concept Concept Concept ABOUT ONE CONCEPT ABOUT RELATIONSHIPS BETWEEN CONCEPTS TYPE OF QUESTION: DESCRIBE what s going on? DECIDE
STATISTICS ANCILLARY SYLLABUS. (W.E.F. the session ) Semester Paper Code Marks Credits Topic
 Semester Paper Code Marks Credits Topic") STATISTICS ANCILLARY SYLLABUS (W.E.F. the session 2014-15) Semester Paper Code Marks Credits Topic 1 ST21012T 70 4 Descriptive Statistics 1 & Probability Theory 1 ST21012P 30 1 Practical- Using Minitab
STATISTICS ANCILLARY SYLLABUS (W.E.F. the session 2014-15) Semester Paper Code Marks Credits Topic 1 ST21012T 70 4 Descriptive Statistics 1 & Probability Theory 1 ST21012P 30 1 Practical- Using Minitab
Contents. Preface to Second Edition Preface to First Edition Abbreviations PART I PRINCIPLES OF STATISTICAL THINKING AND ANALYSIS 1
 Contents Preface to Second Edition Preface to First Edition Abbreviations xv xvii xix PART I PRINCIPLES OF STATISTICAL THINKING AND ANALYSIS 1 1 The Role of Statistical Methods in Modern Industry and Services
Bayesian Regression Linear and Logistic Regression
 When we want more than point estimates Bayesian Regression Linear and Logistic Regression Nicole Beckage Ordinary Least Squares Regression and Lasso Regression return only point estimates But what if we
TABLE OF CONTENTS CHAPTER 1 COMBINATORIAL PROBABILITY 1
 TABLE OF CONTENTS CHAPTER 1 COMBINATORIAL PROBABILITY 1 1.1 The Probability Model...1 1.2 Finite Discrete Models with Equally Likely Outcomes...5 1.2.1 Tree Diagrams...6 1.2.2 The Multiplication Principle...8
Subject CS1 Actuarial Statistics 1 Core Principles
 Institute of Actuaries of India Subject CS1 Actuarial Statistics 1 Core Principles For 2019 Examinations Aim The aim of the Actuarial Statistics 1 subject is to provide a grounding in mathematical and
SUPERVISED LEARNING: INTRODUCTION TO CLASSIFICATION
 SUPERVISED LEARNING: INTRODUCTION TO CLASSIFICATION 1 Outline Basic terminology Features Training and validation Model selection Error and loss measures Statistical comparison Evaluation measures 2 Terminology
PART I INTRODUCTION The meaning of probability Basic definitions for frequentist statistics and Bayesian inference Bayesian inference Combinatorics
 Table of Preface page xi PART I INTRODUCTION 1 1 The meaning of probability 3 1.1 Classical definition of probability 3 1.2 Statistical definition of probability 9 1.3 Bayesian understanding of probability
Class 4: Classification. Quaid Morris February 11 th, 2011 ML4Bio
 Class 4: Classification Quaid Morris February 11 th, 211 ML4Bio Overview Basic concepts in classification: overfitting, cross-validation, evaluation. Linear Discriminant Analysis and Quadratic Discriminant
Linear Algebra and Probability
 Linear Algebra and Probability for Computer Science Applications Ernest Davis CRC Press Taylor!* Francis Group Boca Raton London New York CRC Press is an imprint of the Taylor Sc Francis Croup, an informa
Machine learning for pervasive systems Classification in high-dimensional spaces
 Machine learning for pervasive systems Classification in high-dimensional spaces Department of Communications and Networking Aalto University, School of Electrical Engineering stephan.sigg@aalto.fi Version
Probabilistic Energy Forecasting
 Probabilistic Energy Forecasting Moritz Schmid Seminar Energieinformatik WS 2015/16 ^ KIT The Research University in the Helmholtz Association www.kit.edu Agenda Forecasting challenges Renewable energy
Bayesian Phylogenetics:
 Bayesian Phylogenetics: an introduction Marc A. Suchard msuchard@ucla.edu UCLA Who is this man? How sure are you? The one true tree? Methods we ve learned so far try to find a single tree that best describes
Mathematical Formulation of Our Example
 Mathematical Formulation of Our Example We define two binary random variables: open and, where is light on or light off. Our question is: What is? Computer Vision 1 Combining Evidence Suppose our robot
Contents. Acknowledgments. xix
 Table of Preface Acknowledgments page xv xix 1 Introduction 1 The Role of the Computer in Data Analysis 1 Statistics: Descriptive and Inferential 2 Variables and Constants 3 The Measurement of Variables
The entire data set consists of n = 32 widgets, 8 of which were made from each of q = 4 different materials.
 One-Way ANOVA Summary The One-Way ANOVA procedure is designed to construct a statistical model describing the impact of a single categorical factor X on a dependent variable Y. Tests are run to determine
Probabilistic Machine Learning
 Probabilistic Machine Learning Bayesian Nets, MCMC, and more Marek Petrik 4/18/2017 Based on: P. Murphy, K. (2012). Machine Learning: A Probabilistic Perspective. Chapter 10. Conditional Independence Independent
Lecture Slides. Elementary Statistics Tenth Edition. by Mario F. Triola. and the Triola Statistics Series. Slide 1
 Lecture Slides Elementary Statistics Tenth Edition and the Triola Statistics Series by Mario F. Triola Slide 1 Chapter 3 Statistics for Describing, Exploring, and Comparing Data 3-1 Overview 3-2 Measures
Statistical Machine Learning Theory. From Multi-class Classification to Structured Output Prediction. Hisashi Kashima.
 http://goo.gl/jv7vj9 Course website KYOTO UNIVERSITY Statistical Machine Learning Theory From Multi-class Classification to Structured Output Prediction Hisashi Kashima kashima@i.kyoto-u.ac.jp DEPARTMENT
Randomized Algorithms
 Randomized Algorithms Prof. Tapio Elomaa tapio.elomaa@tut.fi Course Basics A new 4 credit unit course Part of Theoretical Computer Science courses at the Department of Mathematics There will be 4 hours
Classification for High Dimensional Problems Using Bayesian Neural Networks and Dirichlet Diffusion Trees
 Classification for High Dimensional Problems Using Bayesian Neural Networks and Dirichlet Diffusion Trees Rafdord M. Neal and Jianguo Zhang Presented by Jiwen Li Feb 2, 2006 Outline Bayesian view of feature
Lecture 6: Methods for high-dimensional problems
 Lecture 6: Methods for high-dimensional problems Hector Corrada Bravo and Rafael A. Irizarry March, 2010 In this Section we will discuss methods where data lies on high-dimensional spaces. In particular,
1-1. Chapter 1. Sampling and Descriptive Statistics by The McGraw-Hill Companies, Inc. All rights reserved.
 1-1 Chapter 1 Sampling and Descriptive Statistics 1-2 Why Statistics? Deal with uncertainty in repeated scientific measurements Draw conclusions from data Design valid experiments and draw reliable conclusions
* Tuesday 17 January :30-16:30 (2 hours) Recored on ESSE3 General introduction to the course.
 Recored on ESSE3 General introduction to the course.") Name of the course Statistical methods and data analysis Audience The course is intended for students of the first or second year of the Graduate School in Materials Engineering. The aim of the course
Name of the course Statistical methods and data analysis Audience The course is intended for students of the first or second year of the Graduate School in Materials Engineering. The aim of the course
Final Overview. Introduction to ML. Marek Petrik 4/25/2017
 Final Overview Introduction to ML Marek Petrik 4/25/2017 This Course: Introduction to Machine Learning Build a foundation for practice and research in ML Basic machine learning concepts: max likelihood,
Machine Learning. Nonparametric Methods. Space of ML Problems. Todo. Histograms. Instance-Based Learning (aka non-parametric methods)
") Machine Learning InstanceBased Learning (aka nonparametric methods) Supervised Learning Unsupervised Learning Reinforcement Learning Parametric Non parametric CSE 446 Machine Learning Daniel Weld March
Machine Learning InstanceBased Learning (aka nonparametric methods) Supervised Learning Unsupervised Learning Reinforcement Learning Parametric Non parametric CSE 446 Machine Learning Daniel Weld March
Learning From Data Lecture 15 Reflecting on Our Path - Epilogue to Part I
 Learning From Data Lecture 15 Reflecting on Our Path - Epilogue to Part I What We Did The Machine Learning Zoo Moving Forward M Magdon-Ismail CSCI 4100/6100 recap: Three Learning Principles Scientist 2
Neural Networks. Single-layer neural network. CSE 446: Machine Learning Emily Fox University of Washington March 10, /9/17
 3/9/7 Neural Networks Emily Fox University of Washington March 0, 207 Slides adapted from Ali Farhadi (via Carlos Guestrin and Luke Zettlemoyer) Single-layer neural network 3/9/7 Perceptron as a neural
Machine learning comes from Bayesian decision theory in statistics. There we want to minimize the expected value of the loss function.
 Bayesian learning: Machine learning comes from Bayesian decision theory in statistics. There we want to minimize the expected value of the loss function. Let y be the true label and y be the predicted
Introduction to Statistical Analysis
 Introduction to Statistical Analysis Changyu Shen Richard A. and Susan F. Smith Center for Outcomes Research in Cardiology Beth Israel Deaconess Medical Center Harvard Medical School Objectives Descriptive
Part I. Linear Discriminant Analysis. Discriminant analysis. Discriminant analysis
 Week 5 Based in part on slides from textbook, slides of Susan Holmes Part I Linear Discriminant Analysis October 29, 2012 1 / 1 2 / 1 Nearest centroid rule Suppose we break down our data matrix as by the
Data Mining and Data Warehousing. Henryk Maciejewski. Data Mining Predictive modelling: regression
 Data Mining and Data Warehousing Henryk Maciejewski Data Mining Predictive modelling: regression Algorithms for Predictive Modelling Contents Regression Classification Auxiliary topics: Estimation of prediction
Ch. 1: Data and Distributions
 Ch. 1: Data and Distributions Populations vs. Samples How to graphically display data Histograms, dot plots, stem plots, etc Helps to show how samples are distributed Distributions of both continuous and
Introduction to Statistical Hypothesis Testing
 Introduction to Statistical Hypothesis Testing Arun K. Tangirala Statistics for Hypothesis Testing - Part 1 Arun K. Tangirala, IIT Madras Intro to Statistical Hypothesis Testing 1 Learning objectives I
Statistical Machine Learning Theory. From Multi-class Classification to Structured Output Prediction. Hisashi Kashima.
 http://goo.gl/xilnmn Course website KYOTO UNIVERSITY Statistical Machine Learning Theory From Multi-class Classification to Structured Output Prediction Hisashi Kashima kashima@i.kyoto-u.ac.jp DEPARTMENT
Part I. Linear regression & LASSO. Linear Regression. Linear Regression. Week 10 Based in part on slides from textbook, slides of Susan Holmes
 Week 10 Based in part on slides from textbook, slides of Susan Holmes Part I Linear regression & December 5, 2012 1 / 1 2 / 1 We ve talked mostly about classification, where the outcome categorical. If
UNIVERSITY of PENNSYLVANIA CIS 520: Machine Learning Final, Fall 2013
 UNIVERSITY of PENNSYLVANIA CIS 520: Machine Learning Final, Fall 2013 Exam policy: This exam allows two one-page, two-sided cheat sheets; No other materials. Time: 2 hours. Be sure to write your name and
Statistics for Managers using Microsoft Excel 6 th Edition
 Statistics for Managers using Microsoft Excel 6 th Edition Chapter 3 Numerical Descriptive Measures 3-1 Learning Objectives In this chapter, you learn: To describe the properties of central tendency, variation,
Appendix F. Computational Statistics Toolbox. The Computational Statistics Toolbox can be downloaded from:
 Appendix F Computational Statistics Toolbox The Computational Statistics Toolbox can be downloaded from: http://www.infinityassociates.com http://lib.stat.cmu.edu. Please review the readme file for installation
Machine Learning (CS 567) Lecture 2
 Lecture 2") Machine Learning (CS 567) Lecture 2 Time: T-Th 5:00pm - 6:20pm Location: GFS118 Instructor: Sofus A. Macskassy (macskass@usc.edu) Office: SAL 216 Office hours: by appointment Teaching assistant: Cheol
Machine Learning (CS 567) Lecture 2 Time: T-Th 5:00pm - 6:20pm Location: GFS118 Instructor: Sofus A. Macskassy (macskass@usc.edu) Office: SAL 216 Office hours: by appointment Teaching assistant: Cheol
Sets and Set notation. Algebra 2 Unit 8 Notes
 Sets and Set notation Section 11-2 Probability Experimental Probability experimental probability of an event: Theoretical Probability number of time the event occurs P(event) = number of trials Sample
CS145: INTRODUCTION TO DATA MINING
 CS145: INTRODUCTION TO DATA MINING 2: Vector Data: Prediction Instructor: Yizhou Sun yzsun@cs.ucla.edu October 8, 2018 TA Office Hour Time Change Junheng Hao: Tuesday 1-3pm Yunsheng Bai: Thursday 1-3pm
Stat 5101 Lecture Notes
 Stat 5101 Lecture Notes Charles J. Geyer Copyright 1998, 1999, 2000, 2001 by Charles J. Geyer May 7, 2001 ii Stat 5101 (Geyer) Course Notes Contents 1 Random Variables and Change of Variables 1 1.1 Random
Switch Mechanism Diagnosis using a Pattern Recognition Approach
 The 4th IET International Conference on Railway Condition Monitoring RCM 2008 Switch Mechanism Diagnosis using a Pattern Recognition Approach F. Chamroukhi, A. Samé, P. Aknin The French National Institute
Statistical Methods in Particle Physics Lecture 1: Bayesian methods
 Statistical Methods in Particle Physics Lecture 1: Bayesian methods SUSSP65 St Andrews 16 29 August 2009 Glen Cowan Physics Department Royal Holloway, University of London g.cowan@rhul.ac.uk www.pp.rhul.ac.uk/~cowan
EE562 ARTIFICIAL INTELLIGENCE FOR ENGINEERS
 EE562 ARTIFICIAL INTELLIGENCE FOR ENGINEERS Lecture 16, 6/1/2005 University of Washington, Department of Electrical Engineering Spring 2005 Instructor: Professor Jeff A. Bilmes Uncertainty & Bayesian Networks
Experimental Design and Data Analysis for Biologists
 Experimental Design and Data Analysis for Biologists Gerry P. Quinn Monash University Michael J. Keough University of Melbourne CAMBRIDGE UNIVERSITY PRESS Contents Preface page xv I I Introduction 1 1.1
Objective A: Mean, Median and Mode Three measures of central of tendency: the mean, the median, and the mode.
 Chapter 3 Numerically Summarizing Data Chapter 3.1 Measures of Central Tendency Objective A: Mean, Median and Mode Three measures of central of tendency: the mean, the median, and the mode. A1. Mean The
Keller: Stats for Mgmt & Econ, 7th Ed July 17, 2006
 Chapter 17 Simple Linear Regression and Correlation 17.1 Regression Analysis Our problem objective is to analyze the relationship between interval variables; regression analysis is the first tool we will
7.1. Correlation analysis. Regression.
 7.1 Correlation analysis. Regression. 7.12 7.13 7.13 7.33 7.15 Values from the same group tend to be similar. There is no tendency for values from the same group to be similar. 7.14 Modelling of data:
5.5.3 Statistical Innovative Trend Test Application Crossing Trend Analysis Methodology Rational Concept...
 Contents 1 Introduction.... 1 1.1 General... 1 1.2 Trend Definition and Analysis... 3 1.2.1 Conceptual and Visual Trends.... 4 1.2.2 Mathematical Trend.... 7 1.2.3 Statistical Trend.... 9 1.3 Trend in
Review. DS GA 1002 Statistical and Mathematical Models. Carlos Fernandez-Granda
 Review DS GA 1002 Statistical and Mathematical Models http://www.cims.nyu.edu/~cfgranda/pages/dsga1002_fall16 Carlos Fernandez-Granda Probability and statistics Probability: Framework for dealing with
ECE-271B. Nuno Vasconcelos ECE Department, UCSD
 ECE-271B Statistical ti ti Learning II Nuno Vasconcelos ECE Department, UCSD The course the course is a graduate level course in statistical learning in SLI we covered the foundations of Bayesian or generative
Chapter 1 Statistical Inference
 Chapter 1 Statistical Inference causal inference To infer causality, you need a randomized experiment (or a huge observational study and lots of outside information). inference to populations Generalizations
Final Examination CS 540-2: Introduction to Artificial Intelligence
 Final Examination CS 540-2: Introduction to Artificial Intelligence May 7, 2017 LAST NAME: SOLUTIONS FIRST NAME: Problem Score Max Score 1 14 2 10 3 6 4 10 5 11 6 9 7 8 9 10 8 12 12 8 Total 100 1 of 11
Bioeng 3070/5070. App Math/Stats for Bioengineer Lecture 3
 Bioeng 3070/5070 App Math/Stats for Bioengineer Lecture 3 Five number summary Five-number summary of a data set consists of: the minimum (smallest observation) the first quartile (which cuts off the lowest
STATISTICS-STAT (STAT)
") Statistics-STAT (STAT) 1 STATISTICS-STAT (STAT) Courses STAT 158 Introduction to R Programming Credit: 1 (1-0-0) Programming using the R Project for the Statistical Computing. Data objects, for loops,
Statistics-STAT (STAT) 1 STATISTICS-STAT (STAT) Courses STAT 158 Introduction to R Programming Credit: 1 (1-0-0) Programming using the R Project for the Statistical Computing. Data objects, for loops,
Review of some concepts in predictive modeling
 Harvard-MIT Division of Health Sciences and Technology HST.951J: Medical Decision Support, Fall 2005 Instructors: Professor Lucila Ohno-Machado and Professor Staal Vinterbo Review of some concepts in predictive
VCMC: Variational Consensus Monte Carlo
 VCMC: Variational Consensus Monte Carlo Maxim Rabinovich, Elaine Angelino, Michael I. Jordan Berkeley Vision and Learning Center September 22, 2015 probabilistic models! sky fog bridge water grass object
MATH4427 Notebook 4 Fall Semester 2017/2018
 MATH4427 Notebook 4 Fall Semester 2017/2018 prepared by Professor Jenny Baglivo c Copyright 2009-2018 by Jenny A. Baglivo. All Rights Reserved. 4 MATH4427 Notebook 4 3 4.1 K th Order Statistics and Their
Unit 2. Describing Data: Numerical
 Unit 2 Describing Data: Numerical Describing Data Numerically Describing Data Numerically Central Tendency Arithmetic Mean Median Mode Variation Range Interquartile Range Variance Standard Deviation Coefficient
Business Analytics and Data Mining Modeling Using R Prof. Gaurav Dixit Department of Management Studies Indian Institute of Technology, Roorkee
 Business Analytics and Data Mining Modeling Using R Prof. Gaurav Dixit Department of Management Studies Indian Institute of Technology, Roorkee Lecture - 04 Basic Statistics Part-1 (Refer Slide Time: 00:33)
Descriptive Univariate Statistics and Bivariate Correlation
 ESC 100 Exploring Engineering Descriptive Univariate Statistics and Bivariate Correlation Instructor: Sudhir Khetan, Ph.D. Wednesday/Friday, October 17/19, 2012 The Central Dogma of Statistics used to
Bayesian Networks Inference with Probabilistic Graphical Models
 4190.408 2016-Spring Bayesian Networks Inference with Probabilistic Graphical Models Byoung-Tak Zhang intelligence Lab Seoul National University 4190.408 Artificial (2016-Spring) 1 Machine Learning? Learning
Statistical Data Analysis
 DS-GA 0 Lecture notes 8 Fall 016 1 Descriptive statistics Statistical Data Analysis In this section we consider the problem of analyzing a set of data. We describe several techniques for visualizing the
Learning from Data. Amos Storkey, School of Informatics. Semester 1. amos/lfd/
 Semester 1 http://www.anc.ed.ac.uk/ amos/lfd/ Introduction Welcome Administration Online notes Books: See website Assignments Tutorials Exams Acknowledgement: I would like to that David Barber and Chris
Glossary. The ISI glossary of statistical terms provides definitions in a number of different languages:
 Glossary The ISI glossary of statistical terms provides definitions in a number of different languages: http://isi.cbs.nl/glossary/index.htm Adjusted r 2 Adjusted R squared measures the proportion of the
Assignment 3. Introduction to Machine Learning Prof. B. Ravindran
 Assignment 3 Introduction to Machine Learning Prof. B. Ravindran 1. In building a linear regression model for a particular data set, you observe the coefficient of one of the features having a relatively
Statistical. Psychology
 SEVENTH у *i km m it* & П SB Й EDITION Statistical M e t h o d s for Psychology D a v i d C. Howell University of Vermont ; \ WADSWORTH f% CENGAGE Learning* Australia Biaall apan Korea Меяко Singapore
Predictive analysis on Multivariate, Time Series datasets using Shapelets
 1 Predictive analysis on Multivariate, Time Series datasets using Shapelets Hemal Thakkar Department of Computer Science, Stanford University hemal@stanford.edu hemal.tt@gmail.com Abstract Multivariate,
Numerical Learning Algorithms
 Numerical Learning Algorithms Example SVM for Separable Examples.......................... Example SVM for Nonseparable Examples....................... 4 Example Gaussian Kernel SVM...............................
Logistic Regression. Machine Learning Fall 2018
 Logistic Regression Machine Learning Fall 2018 1 Where are e? We have seen the folloing ideas Linear models Learning as loss minimization Bayesian learning criteria (MAP and MLE estimation) The Naïve Bayes
Table of Contents. Multivariate methods. Introduction II. Introduction I
 Table of Contents Introduction Antti Penttilä Department of Physics University of Helsinki Exactum summer school, 04 Construction of multinormal distribution Test of multinormality with 3 Interpretation
Fundamentals of Applied Probability and Random Processes
 Fundamentals of Applied Probability and Random Processes,nd 2 na Edition Oliver C. Ibe University of Massachusetts, LoweLL, Massachusetts ip^ W >!^ AMSTERDAM BOSTON HEIDELBERG LONDON NEW YORK OXFORD PARIS
STAT 302 Introduction to Probability Learning Outcomes. Textbook: A First Course in Probability by Sheldon Ross, 8 th ed.
 STAT 302 Introduction to Probability Learning Outcomes Textbook: A First Course in Probability by Sheldon Ross, 8 th ed. Chapter 1: Combinatorial Analysis Demonstrate the ability to solve combinatorial
Performance Evaluation
 Performance Evaluation David S. Rosenberg Bloomberg ML EDU October 26, 2017 David S. Rosenberg (Bloomberg ML EDU) October 26, 2017 1 / 36 Baseline Models David S. Rosenberg (Bloomberg ML EDU) October 26,
Overview. Overview. Overview. Specific Examples. General Examples. Bivariate Regression & Correlation
 Bivariate Regression & Correlation Overview The Scatter Diagram Two Examples: Education & Prestige Correlation Coefficient Bivariate Linear Regression Line SPSS Output Interpretation Covariance ou already
Naive Bayes classification
 Naive Bayes classification Christos Dimitrakakis December 4, 2015 1 Introduction One of the most important methods in machine learning and statistics is that of Bayesian inference. This is the most fundamental