Data fusion for ecological studies
|
|
|
- Sharon Cunningham
- 5 years ago
- Views:
Transcription

1 Data fusion for ecological studies Jaime Collazo, Beth Gardner, Dorit Hammerling, Andrea Kostura, David Miller, Krishna Pacifici, Brian Reich, Susheela Singh, Glenn Stauffer SAMSI working group Data fusion for ecological studies 1
2 Motivation Our group focused on developing methods to combine multiple data sources to estimate species distribution maps. These maps are fundamental to ecology, e.g., to study effects of land use and climate change. We apply the methods to jointly model 1. ebirds and SE US breeding-bird survey (BBS) data. 2. ebirds and PA Bird Atlas data. 3. ship and areal surveys of seabirds. SAMSI working group Data fusion for ecological studies 2
3 ebird effort (c) ebirds sqrt effort SAMSI working group Data fusion for ecological studies 3
4 ebird number of observations (d) ebirds sqrt sample rates SAMSI working group Data fusion for ecological studies 4
5 BBS effort (a) BBS effort SAMSI working group Data fusion for ecological studies 5
6 BBS sample proportion (b) BBS sample proportions SAMSI working group Data fusion for ecological studies 6
7 Models We considered four models: 1. BBS-only 2. Using EB as a covariate to predict BBS 3. Joint model for EB and BBS with shared occupancy 4. Joint model for EB and BBS with multivariate random effects SAMSI working group Data fusion for ecological studies 7
8 Spatial occupancy model for the BBS data Let N i and Y i be the number of sampling occasions and sightings, respectively, in grid cell i. Y i Binomial(N i, p i Z i ), where Z i = 1 indicates that the species occupies cell i Z i = 0 indicates that the species doesn t occupy cell i. pi is the detection probability. Our objective to estimate Z i in all grid cells. SAMSI working group Data fusion for ecological studies 8
9 Spatial occupancy model for the BBS data We use a bivariate spatial model for occupancy and detection. Let θ i = (θ 0i, θ 1i ) T be a random effect for site i, with Z i = I (θ 0i > 0) and p i = Φ(θ 1i ). To model spatial variation in occupancy and detection, and their relationship use a multivariate CAR model Given the random effects at all other sites, θ i Normal(ρ θ i, 1 m i Σ) θi is the mean of θ j over the m i neighboring sites ρ controls spatial dependence Σ is the 2 2 covariance between occupancy and detection. SAMSI working group Data fusion for ecological studies 9
10 Estimated occupancy (posterior mean of Z i ) (a) Single SAMSI working group Data fusion for ecological studies 10
11 Estimated detection (posterior mean of p i ) (a) Single SAMSI working group Data fusion for ecological studies 11
12 Using EB as a covariate for BBS The simplest data fusion method is to use BBS as a covariate in the prior mean for θ i That is, let X i be an initial estimate of EB abundance or occupancy at site i. E(θ ji ) = X i β j. We included six constructed covariates. SAMSI working group Data fusion for ecological studies 12
13 Estimated EB abundance (X i ) ebirds Abundance SAMSI working group Data fusion for ecological studies 13
14 Estimated occupancy (posterior mean of Z i ) (b) Covariate SAMSI working group Data fusion for ecological studies 14
15 Estimated detection (posterior mean of p i ) (b) Covariate SAMSI working group Data fusion for ecological studies 15
16 Shared-occupancy model for EB and BBS data Let W i and E i be the number of sightings and hours of effort for the EB data in cell i. We assume the joint model Y i Binomial(N i, p i Z i ) and W i Poisson[E i (Z i exp(θ i2 )+q)]. Z i = I (θ 0i > 0) is the shared occupancy indicator. θ i2 controls abundance q > 0 is the false positive rate θ i = (θ 0i, θ 1i, θ 2i ) T is modeled with an MCAR. SAMSI working group Data fusion for ecological studies 16
17 Estimated occupancy (posterior mean of Z i ) (c) Shared SAMSI working group Data fusion for ecological studies 17
18 Correlation model for EB and BBS data To be more robust against bias in EB data, we also tried removing the occupancy indicator from the EB model. We assume the joint model Y i Binomial(N i, p i Z i ) and W i Poisson[E i exp(θ i2 )]. θ i = (θ 0i, θ 1i, θ 2i ) T is modeled with an MCAR. Only the correlation of θ 2i and θ 0i links the data sources. SAMSI working group Data fusion for ecological studies 18
19 Estimated occupancy (posterior mean of Z i ) (d) Correlation SAMSI working group Data fusion for ecological studies 19
20 Model comparisons Mean squared error and deviance comparing estimates based on 2012 BBS and EB data to the observed BBS data. Single Covariate Shared Correlation MSE Deviance SAMSI working group Data fusion for ecological studies 20


21 Application PA Bird Atlas

22 breeding bird atlas point counts
 p P(detection present) Y j,i ~ binomial(z j,i *p,5) z j,i ~ Bernouli(ψ j ) logit(ψ j ) = α 2 + θ 2,j Θ ~")
23 Blocks: j = 1,, J Points: i = 1,, I ebird block level counts (W j ) and effort (E j ) W j ~ Poisson(E j* λ j ) log(λ j ) = α 1 + θ 1,j BBA number of occasions seen at a point (Y j,i ) p P(detection present) Y j,i ~ binomial(z j,i *p,5) z j,i ~ Bernouli(ψ j ) logit(ψ j ) = α 2 + θ 2,j Θ ~ MCAR


24 black-throated blue warbler

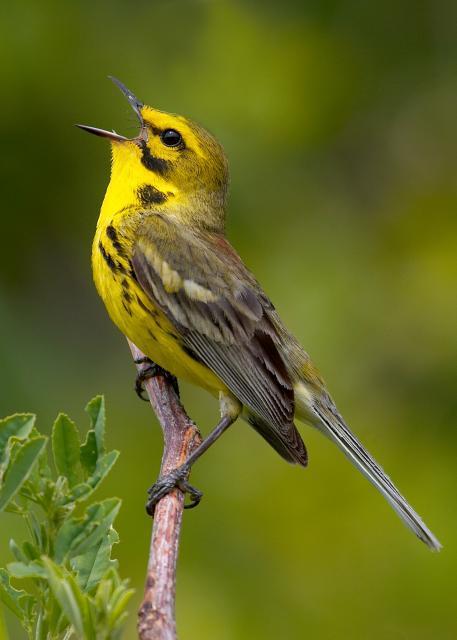
25 prairie warbler
 From April 2012 - April 2014 Ship board distance sampling surveys 656 km green lines High definition aerial surveys 3500 km -")
26 Distribution and abundance of seabirds in the Northwestern mid-atlantic Project funded by DOE in preparation for energy development Coast off Delaware/Maryland/ Virginia: three Wind Energy Areas (WEA) From April April 2014 Ship board distance sampling surveys 656 km green lines High definition aerial surveys 3500 km - red lines
27 Distance sampling Observation model Detection probability p is declining function of distance to observer, pp = ff(dd) Detection on transect line is perfect Half-normal : ff dd = exp( dd2 2σσ 2)

28 Application/Example: Loons Loons are common in the study area during the winter and frequently observed in both survey methods. Loons Boat Aerial

29
Introduction to Part III Examining wildlife distributions and abundance using boat surveys
 Baseline Wildlife Studies in Atlantic Waters Offshore of Maryland: Final Report to the Maryland Department of Natural Resources and Maryland Energy Administration, 2015 Introduction to Part III Examining
Bayesian Model Diagnostics and Checking
 Earvin Balderama Quantitative Ecology Lab Department of Forestry and Environmental Resources North Carolina State University April 12, 2013 1 / 34 Introduction MCMCMC 2 / 34 Introduction MCMCMC Steps in
Incorporating Boosted Regression Trees into Ecological Latent Variable Models
 Incorporating Boosted Regression Trees into Ecological Latent Variable Models Rebecca A. Hutchinson, Li-Ping Liu, Thomas G. Dietterich School of EECS, Oregon State University Motivation Species Distribution
Represent processes and observations that span multiple levels (aka multi level models) R 2
 R 2") Hierarchical models Hierarchical models Represent processes and observations that span multiple levels (aka multi level models) R 1 R 2 R 3 N 1 N 2 N 3 N 4 N 5 N 6 N 7 N 8 N 9 N i = true abundance on a
Hierarchical models Hierarchical models Represent processes and observations that span multiple levels (aka multi level models) R 1 R 2 R 3 N 1 N 2 N 3 N 4 N 5 N 6 N 7 N 8 N 9 N i = true abundance on a
Model-based geostatistics for wildlife population monitoring :
 Context Model Mapping Abundance Conclusion Ref. Model-based geostatistics for wildlife population monitoring : Northwestern Mediterranean fin whale population and other case studies Pascal Monestiez Biostatistique
Using Estimating Equations for Spatially Correlated A
 Using Estimating Equations for Spatially Correlated Areal Data December 8, 2009 Introduction GEEs Spatial Estimating Equations Implementation Simulation Conclusion Typical Problem Assess the relationship
Alex Zerbini. National Marine Mammal Laboratory Alaska Fisheries Science Center, NOAA Fisheries
 Alex Zerbini National Marine Mammal Laboratory Alaska Fisheries Science Center, NOAA Fisheries Introduction Abundance Estimation Methods (Line Transect Sampling) Survey Design Data collection Why do we
A Conditional Approach to Modeling Multivariate Extremes
 A Approach to ing Multivariate Extremes By Heffernan & Tawn Department of Statistics Purdue University s April 30, 2014 Outline s s Multivariate Extremes s A central aim of multivariate extremes is trying
Approaches for Multiple Disease Mapping: MCAR and SANOVA
 Approaches for Multiple Disease Mapping: MCAR and SANOVA Dipankar Bandyopadhyay Division of Biostatistics, University of Minnesota SPH April 22, 2015 1 Adapted from Sudipto Banerjee s notes SANOVA vs MCAR
(3) Review of Probability. ST440/540: Applied Bayesian Statistics
 Review of Probability. ST440/540: Applied Bayesian Statistics") Review of probability The crux of Bayesian statistics is to compute the posterior distribution, i.e., the uncertainty distribution of the parameters (θ) after observing the data (Y) This is the conditional
Review of probability The crux of Bayesian statistics is to compute the posterior distribution, i.e., the uncertainty distribution of the parameters (θ) after observing the data (Y) This is the conditional
Multiple Random Variables
 Multiple Random Variables This Version: July 30, 2015 Multiple Random Variables 2 Now we consider models with more than one r.v. These are called multivariate models For instance: height and weight An
Multivariate spatial modeling
 Multivariate spatial modeling Point-referenced spatial data often come as multivariate measurements at each location Chapter 7: Multivariate Spatial Modeling p. 1/21 Multivariate spatial modeling Point-referenced
Bayesian SAE using Complex Survey Data Lecture 4A: Hierarchical Spatial Bayes Modeling
 Bayesian SAE using Complex Survey Data Lecture 4A: Hierarchical Spatial Bayes Modeling Jon Wakefield Departments of Statistics and Biostatistics University of Washington 1 / 37 Lecture Content Motivation
Spatial Smoothing in Stan: Conditional Auto-Regressive Models
 Spatial Smoothing in Stan: Conditional Auto-Regressive Models Charles DiMaggio, PhD, NYU School of Medicine Stephen J. Mooney, PhD, University of Washington Mitzi Morris, Columbia University Dan Simpson,
Classical and Bayesian inference
 Classical and Bayesian inference AMS 132 Claudia Wehrhahn (UCSC) Classical and Bayesian inference January 8 1 / 8 Probability and Statistical Models Motivating ideas AMS 131: Suppose that the random variable
Remote Sensing Techniques for Renewable Energy Projects. Dr Stuart Clough APEM Ltd
 Remote Sensing Techniques for Renewable Energy Projects Dr Stuart Clough APEM Ltd What is Remote Sensing? The use of aerial sensors to detect and classify objects on Earth Remote sensing for ecological
MATH c UNIVERSITY OF LEEDS Examination for the Module MATH2715 (January 2015) STATISTICAL METHODS. Time allowed: 2 hours
 STATISTICAL METHODS. Time allowed: 2 hours") MATH2750 This question paper consists of 8 printed pages, each of which is identified by the reference MATH275. All calculators must carry an approval sticker issued by the School of Mathematics. c UNIVERSITY
MATH2750 This question paper consists of 8 printed pages, each of which is identified by the reference MATH275. All calculators must carry an approval sticker issued by the School of Mathematics. c UNIVERSITY
Areal Unit Data Regular or Irregular Grids or Lattices Large Point-referenced Datasets
 Areal Unit Data Regular or Irregular Grids or Lattices Large Point-referenced Datasets Is there spatial pattern? Chapter 3: Basics of Areal Data Models p. 1/18 Areal Unit Data Regular or Irregular Grids
Chapter 5. Chapter 5 sections
 1 / 43 sections Discrete univariate distributions: 5.2 Bernoulli and Binomial distributions Just skim 5.3 Hypergeometric distributions 5.4 Poisson distributions Just skim 5.5 Negative Binomial distributions
A spatial causal analysis of wildfire-contributed PM 2.5 using numerical model output. Brian Reich, NC State
 A spatial causal analysis of wildfire-contributed PM 2.5 using numerical model output Brian Reich, NC State Workshop on Causal Adjustment in the Presence of Spatial Dependence June 11-13, 2018 Brian Reich,
Spatial Misalignment
 November 4, 2009 Objectives Land use in Madagascar Example with WinBUGS code Objectives Learn how to realign nonnested block level data Become familiar with ways to deal with misaligned data which are
Bayesian Learning in Undirected Graphical Models
 Bayesian Learning in Undirected Graphical Models Zoubin Ghahramani Gatsby Computational Neuroscience Unit University College London, UK http://www.gatsby.ucl.ac.uk/ Work with: Iain Murray and Hyun-Chul
Brett Skelly, Katharine Lewis, Reina Tyl, Gordon Dimmig & Christopher Rota West Virginia University
 CHAPTER 22 Occupancy models multi-species Brett Skelly, Katharine Lewis, Reina Tyl, Gordon Dimmig & Christopher Rota West Virginia University Ecological communities are composed of multiple interacting
Bayesian hierarchical modelling for data assimilation of past observations and numerical model forecasts
 Bayesian hierarchical modelling for data assimilation of past observations and numerical model forecasts Stan Yip Exeter Climate Systems, University of Exeter c.y.yip@ex.ac.uk Joint work with Sujit Sahu
Bayesian nonparametric models of sparse and exchangeable random graphs
 Bayesian nonparametric models of sparse and exchangeable random graphs F. Caron & E. Fox Technical Report Discussion led by Esther Salazar Duke University May 16, 2014 (Reading group) May 16, 2014 1 /
Modeling bird migration by combining weather radar and citizen science data
 Modeling bird migration by combining weather radar and citizen science data Tom Dietterich 77 Oregon State University In collaboration with Postdocs: Dan Sheldon (now at UMass, Amherst) Graduate Students:
Likelihood-Based Methods
 Likelihood-Based Methods Handbook of Spatial Statistics, Chapter 4 Susheela Singh September 22, 2016 OVERVIEW INTRODUCTION MAXIMUM LIKELIHOOD ESTIMATION (ML) RESTRICTED MAXIMUM LIKELIHOOD ESTIMATION (REML)
Probability and Stochastic Processes
 Probability and Stochastic Processes A Friendly Introduction Electrical and Computer Engineers Third Edition Roy D. Yates Rutgers, The State University of New Jersey David J. Goodman New York University
Intro to Probability. Andrei Barbu
 Intro to Probability Andrei Barbu Some problems Some problems A means to capture uncertainty Some problems A means to capture uncertainty You have data from two sources, are they different? Some problems
Spatial Autocorrelation and Interactions between Surface Temperature Trends and Socioeconomic Changes
 Spatial Autocorrelation and Interactions between Surface Temperature Trends and Socioeconomic Changes Ross McKitrick Department of Economics University of Guelph December, 00 1 1 1 1 Spatial Autocorrelation
Bayesian spatial quantile regression
 Brian J. Reich and Montserrat Fuentes North Carolina State University and David B. Dunson Duke University E-mail:reich@stat.ncsu.edu Tropospheric ozone Tropospheric ozone has been linked with several adverse
Occupancy models. Gurutzeta Guillera-Arroita University of Kent, UK National Centre for Statistical Ecology
 Occupancy models Gurutzeta Guillera-Arroita University of Kent, UK National Centre for Statistical Ecology Advances in Species distribution modelling in ecological studies and conservation Pavia and Gran
Introduction to Occupancy Models. Jan 8, 2016 AEC 501 Nathan J. Hostetter
 Introduction to Occupancy Models Jan 8, 2016 AEC 501 Nathan J. Hostetter njhostet@ncsu.edu 1 Occupancy Abundance often most interesting variable when analyzing a population Occupancy probability that a
Final Report to the Department of Energy Wind and Water Power Technologies Office, 2015
 Chapter 19: Developing an integrated model of marine bird distributions with environmental covariates using boat and digital video aerial survey data *This chapter is in draft form Final Report to the
Climate Change: the Uncertainty of Certainty
 Climate Change: the Uncertainty of Certainty Reinhard Furrer, UZH JSS, Geneva Oct. 30, 2009 Collaboration with: Stephan Sain - NCAR Reto Knutti - ETHZ Claudia Tebaldi - Climate Central Ryan Ford, Doug
Fall 2017 STAT 532 Homework Peter Hoff. 1. Let P be a probability measure on a collection of sets A.
 1. Let P be a probability measure on a collection of sets A. (a) For each n N, let H n be a set in A such that H n H n+1. Show that P (H n ) monotonically converges to P ( k=1 H k) as n. (b) For each n
CHAPTER 1 INTRODUCTION
 CHAPTER 1 INTRODUCTION 1.0 Discrete distributions in statistical analysis Discrete models play an extremely important role in probability theory and statistics for modeling count data. The use of discrete
Statistics Introduction to Probability
 Statistics 110 - Introduction to Probability Mark E. Irwin Department of Statistics Harvard University Summer Term Monday, June 28, 2004 - Wednesday, August 18, 2004 Personnel Instructor: Mark Irwin Office:
Conjugate Priors: Beta and Normal Spring 2018
 Conjugate Priors: Beta and Normal 18.05 Spring 018 Review: Continuous priors, discrete data Bent coin: unknown probability θ of heads. Prior f (θ) = θ on [0,1]. Data: heads on one toss. Question: Find
Statistics Introduction to Probability
 Statistics 110 - Introduction to Probability Mark E. Irwin Department of Statistics Harvard University Summer Term Monday, June 26, 2006 - Wednesday, August 16, 2006 Copyright 2006 by Mark E. Irwin Personnel
Chapter 3: Maximum-Likelihood & Bayesian Parameter Estimation (part 1)
") HW 1 due today Parameter Estimation Biometrics CSE 190 Lecture 7 Today s lecture was on the blackboard. These slides are an alternative presentation of the material. CSE190, Winter10 CSE190, Winter10 Chapter
HW 1 due today Parameter Estimation Biometrics CSE 190 Lecture 7 Today s lecture was on the blackboard. These slides are an alternative presentation of the material. CSE190, Winter10 CSE190, Winter10 Chapter
STATISTICS OF CLIMATE EXTREMES// TRENDS IN CLIMATE DATASETS
 STATISTICS OF CLIMATE EXTREMES// TRENDS IN CLIMATE DATASETS Richard L Smith Departments of STOR and Biostatistics, University of North Carolina at Chapel Hill and Statistical and Applied Mathematical Sciences
Robustness to Parametric Assumptions in Missing Data Models
 Robustness to Parametric Assumptions in Missing Data Models Bryan Graham NYU Keisuke Hirano University of Arizona April 2011 Motivation Motivation We consider the classic missing data problem. In practice
Joint modelling of data from multiples sources
 Joint modelling of data from multiples sources An application to abundance indexes of woodcock wintering in France Kévin Le Rest, Office National de la Chasse et de la Faune Sauvage Population monitoring
Janson s Inequality and Poisson Heuristic
 Janson s Inequality and Poisson Heuristic Dinesh K CS11M019 IIT Madras April 30, 2012 Dinesh (IITM) Janson s Inequality April 30, 2012 1 / 11 Outline 1 Motivation Dinesh (IITM) Janson s Inequality April
Spatial bias modeling with application to assessing remotely-sensed aerosol as a proxy for particulate matter
 Spatial bias modeling with application to assessing remotely-sensed aerosol as a proxy for particulate matter Chris Paciorek Department of Biostatistics Harvard School of Public Health application joint
Spatio-temporal dynamics of Marbled Murrelet hotspots during nesting in nearshore waters along the Washington to California coast
 Western Washington University Western CEDAR Salish Sea Ecosystem Conference 2014 Salish Sea Ecosystem Conference (Seattle, Wash.) May 1st, 10:30 AM - 12:00 PM Spatio-temporal dynamics of Marbled Murrelet
arxiv: v3 [stat.me] 12 Jul 2015
![arxiv: v3 [stat.me] 12 Jul 2015](/thumbs/74/71040819.jpg "arxiv: v3 [stat.me] 12 Jul 2015") Derivative-Free Estimation of the Score Vector and Observed Information Matrix with Application to State-Space Models Arnaud Doucet 1, Pierre E. Jacob and Sylvain Rubenthaler 3 1 Department of Statistics,
Derivative-Free Estimation of the Score Vector and Observed Information Matrix with Application to State-Space Models Arnaud Doucet 1, Pierre E. Jacob and Sylvain Rubenthaler 3 1 Department of Statistics,
A spatio-temporal model for extreme precipitation simulated by a climate model
 A spatio-temporal model for extreme precipitation simulated by a climate model Jonathan Jalbert Postdoctoral fellow at McGill University, Montréal Anne-Catherine Favre, Claude Bélisle and Jean-François
Exam 2. Jeremy Morris. March 23, 2006
 Exam Jeremy Morris March 3, 006 4. Consider a bivariate normal population with µ 0, µ, σ, σ and ρ.5. a Write out the bivariate normal density. The multivariate normal density is defined by the following
The 21st century decline in damaging European windstorms David Stephenson & Laura Dawkins Exeter Climate Systems
 The 21st century decline in damaging European windstorms David Stephenson & Laura Dawkins Exeter Climate Systems Acknowledgements: Julia Lockwood, Paul Maisey 6 th European Windstorm workshop, Reading,
Multivariate Normal & Wishart
 Multivariate Normal & Wishart Hoff Chapter 7 October 21, 2010 Reading Comprehesion Example Twenty-two children are given a reading comprehsion test before and after receiving a particular instruction method.
9 September N-mixture models. Emily Dennis, Byron Morgan and Martin Ridout. The N-mixture model. Data. Model. Multivariate Poisson model
 The Poisson 9 September 2015 Exeter 1 Stats Lab, Cambridge, 1973 The Poisson Exeter 2 The Poisson What the does can estimate animal abundance from a set of counts with both spatial and temporal replication
Gauge Plots. Gauge Plots JAPANESE BEETLE DATA MAXIMUM LIKELIHOOD FOR SPATIALLY CORRELATED DISCRETE DATA JAPANESE BEETLE DATA
 JAPANESE BEETLE DATA 6 MAXIMUM LIKELIHOOD FOR SPATIALLY CORRELATED DISCRETE DATA Gauge Plots TuscaroraLisa Central Madsen Fairways, 996 January 9, 7 Grubs Adult Activity Grub Counts 6 8 Organic Matter
Fusing point and areal level space-time data. data with application to wet deposition
 Fusing point and areal level space-time data with application to wet deposition Alan Gelfand Duke University Joint work with Sujit Sahu and David Holland Chemical Deposition Combustion of fossil fuel produces
A Few Notes on Fisher Information (WIP)
") A Few Notes on Fisher Information (WIP) David Meyer dmm@{-4-5.net,uoregon.edu} Last update: April 30, 208 Definitions There are so many interesting things about Fisher Information and its theoretical properties
A Few Notes on Fisher Information (WIP) David Meyer dmm@{-4-5.net,uoregon.edu} Last update: April 30, 208 Definitions There are so many interesting things about Fisher Information and its theoretical properties
EEL 5544 Noise in Linear Systems Lecture 30. X (s) = E [ e sx] f X (x)e sx dx. Moments can be found from the Laplace transform as
![EEL 5544 Noise in Linear Systems Lecture 30. X (s) = E [ e sx] f X (x)e sx dx. Moments can be found from the Laplace transform as](/thumbs/85/92409620.jpg "EEL 5544 Noise in Linear Systems Lecture 30. X (s) = E [ e sx] f X (x)e sx dx. Moments can be found from the Laplace transform as") L30-1 EEL 5544 Noise in Linear Systems Lecture 30 OTHER TRANSFORMS For a continuous, nonnegative RV X, the Laplace transform of X is X (s) = E [ e sx] = 0 f X (x)e sx dx. For a nonnegative RV, the Laplace
L30-1 EEL 5544 Noise in Linear Systems Lecture 30 OTHER TRANSFORMS For a continuous, nonnegative RV X, the Laplace transform of X is X (s) = E [ e sx] = 0 f X (x)e sx dx. For a nonnegative RV, the Laplace
STT 843 Key to Homework 1 Spring 2018
 STT 843 Key to Homework Spring 208 Due date: Feb 4, 208 42 (a Because σ = 2, σ 22 = and ρ 2 = 05, we have σ 2 = ρ 2 σ σ22 = 2/2 Then, the mean and covariance of the bivariate normal is µ = ( 0 2 and Σ
Ensemble Consistency Testing for CESM: A new form of Quality Assurance
 Ensemble Consistency Testing for CESM: A new form of Quality Assurance Dorit Hammerling Institute for Mathematics Applied to Geosciences National Center for Atmospheric Research (NCAR) Joint work with
Ecological applications of hidden Markov models and related doubly stochastic processes
 . Ecological applications of hidden Markov models and related doubly stochastic processes Roland Langrock School of Mathematics and Statistics & CREEM Motivating example HMM machinery Some ecological applications
Technical Vignette 5: Understanding intrinsic Gaussian Markov random field spatial models, including intrinsic conditional autoregressive models
 Technical Vignette 5: Understanding intrinsic Gaussian Markov random field spatial models, including intrinsic conditional autoregressive models Christopher Paciorek, Department of Statistics, University
MULTIDIMENSIONAL COVARIATE EFFECTS IN SPATIAL AND JOINT EXTREMES
 MULTIDIMENSIONAL COVARIATE EFFECTS IN SPATIAL AND JOINT EXTREMES Philip Jonathan, Kevin Ewans, David Randell, Yanyun Wu philip.jonathan@shell.com www.lancs.ac.uk/ jonathan Wave Hindcasting & Forecasting
Occupancy models. Gurutzeta Guillera-Arroita University of Kent, UK National Centre for Statistical Ecology
 Occupancy models Gurutzeta Guillera-Arroita University of Kent, UK National Centre for Statistical Ecology Advances in Species distribution modelling in ecological studies and conservation Pavia and Gran
A simple method for seamless verification applied to precipitation hindcasts from two global models
 A simple method for seamless verification applied to precipitation hindcasts from two global models Matthew Wheeler 1, Hongyan Zhu 1, Adam Sobel 2, Debra Hudson 1 and Frederic Vitart 3 1 Bureau of Meteorology,
Chapter 9 : Hierarchical modeling with environmental covariates: Marine Mammals and Turtles
 Chapter 9 : Hierarchical modeling with environmental covariates: Marine Mammals and Turtles Logan Pallin Duke University Introduction The conservation and management of large marine vertebrates requires
Notes on the Multivariate Normal and Related Topics
 Version: July 10, 2013 Notes on the Multivariate Normal and Related Topics Let me refresh your memory about the distinctions between population and sample; parameters and statistics; population distributions
Problem Selected Scores
 Statistics Ph.D. Qualifying Exam: Part II November 20, 2010 Student Name: 1. Answer 8 out of 12 problems. Mark the problems you selected in the following table. Problem 1 2 3 4 5 6 7 8 9 10 11 12 Selected
What are you doing in my ocean? Sea animals get strange new neighbors
 What are you doing in my ocean? Sea animals get strange new neighbors By Washington Post, adapted by Newsela staff on 12.21.15 Word Count 795 A research paper argues that climate change has led to more
Bayesian variable selection via. Penalized credible regions. Brian Reich, NCSU. Joint work with. Howard Bondell and Ander Wilson
 Bayesian variable selection via penalized credible regions Brian Reich, NC State Joint work with Howard Bondell and Ander Wilson Brian Reich, NCSU Penalized credible regions 1 Motivation big p, small n
CMPE 58K Bayesian Statistics and Machine Learning Lecture 5
 CMPE 58K Bayesian Statistics and Machine Learning Lecture 5 Multivariate distributions: Gaussian, Bernoulli, Probability tables Department of Computer Engineering, Boğaziçi University, Istanbul, Turkey
Random Vectors. 1 Joint distribution of a random vector. 1 Joint distribution of a random vector
 Random Vectors Joint distribution of a random vector Joint distributionof of a random vector Marginal and conditional distributions Previousl, we studied probabilit distributions of a random variable.
Statistics for extreme & sparse data
 Statistics for extreme & sparse data University of Bath December 6, 2018 Plan 1 2 3 4 5 6 The Problem Climate Change = Bad! 4 key problems Volcanic eruptions/catastrophic event prediction. Windstorms
EXERCISE 8: REPEATED COUNT MODEL (ROYLE) In collaboration with Heather McKenney
 In collaboration with Heather McKenney") EXERCISE 8: REPEATED COUNT MODEL (ROYLE) In collaboration with Heather McKenney University of Vermont, Rubenstein School of Environment and Natural Resources Please cite this work as: Donovan, T. M. and
EXERCISE 8: REPEATED COUNT MODEL (ROYLE) In collaboration with Heather McKenney University of Vermont, Rubenstein School of Environment and Natural Resources Please cite this work as: Donovan, T. M. and
Monitoring tigers: Any monitoring program is a compromise between science and logistic constraints - Hutto & Young ! Vast landscape low density,
 Any monitoring program is a compromise between science and logistic constraints - Hutto & Young 2003 Monitoring tigers:! Vast landscape low density,! Cryptic species, wide ranging! Limitation of professional
EE/CpE 345. Modeling and Simulation. Fall Class 10 November 18, 2002
 EE/CpE 345 Modeling and Simulation Class 0 November 8, 2002 Input Modeling Inputs(t) Actual System Outputs(t) Parameters? Simulated System Outputs(t) The input data is the driving force for the simulation
Integrating mark-resight, count, and photograph data to more effectively monitor non-breeding American oystercatcher populations
 Integrating mark-resight, count, and photograph data to more effectively monitor non-breeding American oystercatcher populations Gibson, Daniel, Thomas V. Riecke, Tim Keyes, Chris Depkin, Jim Fraser, and
The priority program SPP1167 Quantitative Precipitation Forecast PQP and the stochastic view of weather forecasting
 The priority program SPP1167 Quantitative Precipitation Forecast PQP and the stochastic view of weather forecasting Andreas Hense 9. November 2007 Overview The priority program SPP1167: mission and structure
Non-stationary Gaussian models with physical barriers
 Non-stationary Gaussian models with physical barriers Haakon Bakka; in collaboration with Jarno Vanhatalo, Janine Illian, Daniel Simpson and Håvard Rue King Abdullah University of Science and Technology
Bayesian Learning in Undirected Graphical Models
 Bayesian Learning in Undirected Graphical Models Zoubin Ghahramani Gatsby Computational Neuroscience Unit University College London, UK http://www.gatsby.ucl.ac.uk/ and Center for Automated Learning and
Analysis of Marked Point Patterns with Spatial and Non-spatial Covariate Information
 Analysis of Marked Point Patterns with Spatial and Non-spatial Covariate Information p. 1/27 Analysis of Marked Point Patterns with Spatial and Non-spatial Covariate Information Shengde Liang, Bradley
Bayesian Areal Wombling for Geographic Boundary Analysis
 Bayesian Areal Wombling for Geographic Boundary Analysis Haolan Lu, Haijun Ma, and Bradley P. Carlin haolanl@biostat.umn.edu, haijunma@biostat.umn.edu, and brad@biostat.umn.edu Division of Biostatistics
BTRY 4090: Spring 2009 Theory of Statistics
 BTRY 4090: Spring 2009 Theory of Statistics Guozhang Wang September 25, 2010 1 Review of Probability We begin with a real example of using probability to solve computationally intensive (or infeasible)
Fast Dimension-Reduced Climate Model Calibration and the Effect of Data Aggregation
 Fast Dimension-Reduced Climate Model Calibration and the Effect of Data Aggregation Won Chang Post Doctoral Scholar, Department of Statistics, University of Chicago Oct 15, 2014 Thesis Advisors: Murali
Stat 315c: Transposable Data Rasch model and friends
 Stat 315c: Transposable Data Rasch model and friends Art B. Owen Stanford Statistics Art B. Owen (Stanford Statistics) Rasch and friends 1 / 14 Categorical data analysis Anova has a problem with too much
Mapping the Arctic. ERMA Training University of New Hampshire April 16-19, Erika Knight Audubon Alaska. image: Milo Burcham
 Mapping the Arctic ERMA Training University of New Hampshire April 16-19, 2018 image: Milo Burcham Erika Knight Audubon Alaska Audubon Alaska is a science-based conservation organization that works to
Threshold estimation in marginal modelling of spatially-dependent non-stationary extremes
 Threshold estimation in marginal modelling of spatially-dependent non-stationary extremes Philip Jonathan Shell Technology Centre Thornton, Chester philip.jonathan@shell.com Paul Northrop University College
Disentangling spatial structure in ecological communities. Dan McGlinn & Allen Hurlbert.
 Disentangling spatial structure in ecological communities Dan McGlinn & Allen Hurlbert http://mcglinn.web.unc.edu daniel.mcglinn@usu.edu The Unified Theories of Biodiversity 6 unified theories of diversity
Challenges in modelling air pollution and understanding its impact on human health
 Challenges in modelling air pollution and understanding its impact on human health Alastair Rushworth Joint Statistical Meeting, Seattle Wednesday August 12 th, 2015 Acknowledgements Work in this talk
Final Report to the Maryland Department of Natural Resources and the Maryland Energy Administration, 2015
 Chapter 14: Developing an integrated model of marine bird distributions with environmental covariates using boat and digital video aerial survey data *This chapter is in draft form Final Report to the
Probabilistic Graphical Models
 Probabilistic Graphical Models Brown University CSCI 2950-P, Spring 2013 Prof. Erik Sudderth Lecture 12: Gaussian Belief Propagation, State Space Models and Kalman Filters Guest Kalman Filter Lecture by
Primal-dual Covariate Balance and Minimal Double Robustness via Entropy Balancing
 Primal-dual Covariate Balance and Minimal Double Robustness via (Joint work with Daniel Percival) Department of Statistics, Stanford University JSM, August 9, 2015 Outline 1 2 3 1/18 Setting Rubin s causal
Sub-kilometer-scale space-time stochastic rainfall simulation
 Picture: Huw Alexander Ogilvie Sub-kilometer-scale space-time stochastic rainfall simulation Lionel Benoit (University of Lausanne) Gregoire Mariethoz (University of Lausanne) Denis Allard (INRA Avignon)
TCs within Reanalyses: Evolving representation, trends, potential misuse, and intriguing questions
 TCs within Reanalyses: Evolving representation, trends, potential misuse, and intriguing questions Robert Hart (rhart@met.fsu.edu) Danielle Manning, Ryan Maue Florida State University Mike Fiorino National
Bridging the two cultures: Latent variable statistical modeling with boosted regression trees
 Bridging the two cultures: Latent variable statistical modeling with boosted regression trees Thomas G. Dietterich and Rebecca Hutchinson Oregon State University Corvallis, Oregon, USA 1 A Species Distribution
SIGNAL STRENGTH LOCALIZATION BOUNDS IN AD HOC & SENSOR NETWORKS WHEN TRANSMIT POWERS ARE RANDOM. Neal Patwari and Alfred O.
 SIGNAL STRENGTH LOCALIZATION BOUNDS IN AD HOC & SENSOR NETWORKS WHEN TRANSMIT POWERS ARE RANDOM Neal Patwari and Alfred O. Hero III Department of Electrical Engineering & Computer Science University of
Areal data models. Spatial smoothers. Brook s Lemma and Gibbs distribution. CAR models Gaussian case Non-Gaussian case
 Areal data models Spatial smoothers Brook s Lemma and Gibbs distribution CAR models Gaussian case Non-Gaussian case SAR models Gaussian case Non-Gaussian case CAR vs. SAR STAR models Inference for areal
COMPUTATIONAL MULTI-POINT BME AND BME CONFIDENCE SETS
 VII. COMPUTATIONAL MULTI-POINT BME AND BME CONFIDENCE SETS Until now we have considered the estimation of the value of a S/TRF at one point at the time, independently of the estimated values at other estimation
Jacqueline M. Grebmeier Chesapeake Biological Laboratory University of Maryland Center for Environmental Science, Solomons, MD, USA
 Update on the Pacific Arctic Region Synthesis Activity as part of the ICES/PICES/PAME Working Group on Integrated Ecosystem Assessment of the Central Arctic Ocean (WGICA) Jacqueline M. Grebmeier Chesapeake
MAS3301 Bayesian Statistics
 MAS3301 Bayesian Statistics M. Farrow School of Mathematics and Statistics Newcastle University Semester 2, 2008-9 1 11 Conjugate Priors IV: The Dirichlet distribution and multinomial observations 11.1
PPAML Challenge Problem: Bird Migration
 PPAML Challenge Problem: Bird Migration Version 6 August 30, 2014 Authors: Tom Dietterich (tgd@cs.orst.edu) and Shahed Sorower (sorower@eecs.oregonstate.edu) Credits: Simulator developed by Tao Sun (UMass,