Using Genomic Structural Equation Modeling to Model Joint Genetic Architecture of Complex Traits
|
|
|
- Cecily Shields
- 5 years ago
- Views:
Transcription
.")
1 Using Genomic Structural Equation Modeling to Model Joint Genetic Architecture of Complex Traits Presented by: Andrew D. Grotzinger & Elliot M. Tucker-Drob Paper: Grotzinger, A. D., Rhemtulla, M., de Vlaming, R., Ritchie, S. J., Mallard, T. T., Hill, W. D, Ip, H. F., McIntosh, A. M., Deary, I. J., Koellinger, P. D., Harden, K. P., Nivard, M. G., & Tucker-Drob, E. M. (2018). Genomic SEM provides insights into the multivariate genetic architecture of complex traits. biorχiv.


2 Pervasive (Statistical) Pleiotropy Necessitates Methods for Analyzing Joint Genetic Architecture
3 We have a genetic Atlas. Now what? Genetic correlations as data to be modeled, not simply results by themselves What data-generating process gave rise to the correlations? Are some more plausible than others? Can a high dimensional matrix of genetic correlations among phenotypes be closely approximated with low dimensional representation? Incorporate joint genetic architecture into multivariate GWAS Discovery on latent factors, or residuals of phenotypes after controlling for other phenotypes Derive novel phenotypes for use in polygenic score analyses Polygenic Scores for internalizing psychopathology (e.g. depression, anxiety, neuroticism) Polygenic scores for anxiety unique of depression
4 Genomic Structural Equation Modeling Flexible method for modeling the joint genetic architecture of many traits Only requires conventional GWAS summary statistics Accommodates varying and unknown amounts of sample overlap Can incorporate models of joint genetic architecture into GWAS to aid in multivariate discovery to create polygenic scores for derived phenotypes Can be used to formalize Mendelian randomization across large constellations of SNPs and phenotypes Free, open source, self-contained R package
5 A Primer: How does SEM model covariances? Structural Equation Modeling = structured covariance modeling
6 Imagine we knew the generating causal process x y u y.84 y =.40 x + u y x ~ (0,1), u y ~ (0,.84)
7 Imagine we knew the generating causal process x y u y z 1 u z.64 y =.40 x + u y x ~ (0,1), u y ~ (0,.84) z =.60 y + u z u z ~ (0,.64)
8 Imagine we knew the generating causal process 1 x.40 y 1 u y cov(x,y,z) pop = Implied covariance matrix in the population z 1 u z y =.40 x + u y x ~ (0,1), u y ~ (0,.84) z =.60 y + u z u z ~ (0,.64)
9 In practice, we only observe the sample data, and we propose a model observed covariance matrix in a sample covariance matrix in population
10 For the proposed model, estimate parameters from the data, and evaluate model fit to the data.94 cov(x,y,z) sample = σ 2 x x b xy y 1 σ 2 uy u y b yz z 1 u z σ 2 uz 6 unique elements in the covariance matrix being modeled 5 free model parameters 1 df
11 For the proposed model, estimate parameters from the data, and evaluate model fit to the data x.35 y 1 u y cov(x,y,z) sample = z 1 u z.63 cov(x,y,z) implied =
12 The model that we fit may include some variables for which we do not observe data σ 2 F (= 1 for scaling) F y k = λ k F + u k F ~ (0, σ 2 F), u yk ~ (0, σ 2 uk) y 1 λ 1 λ 2 λ 3 λ 4 λ 5 Parameters are estimated from, F is unobserved. and fit is evaluated relative to, the sample covariance matrix for y 1 -y k. y 2 y 3 y 4 y 5 u y1 u y2 u y3 u y4 u y5 σ 2 u1 σ 2 u2 σ 2 u3 σ 2 u4 σ 2 u5
13 The model that we fit may include some variables for which we do not observe data σ 2 F1 F 1 b 12 F 2 1 u σ 2 uf1 F1 λ 11 λ 12 λ 13 λ 14 λ 15 λ 21 λ 22 λ 23 λ 24 λ 25 y 1 y 2 y 3 y 4 y 5 z 1 z 2 z 3 z 4 z 5 u y1 u y2 u y3 u y4 u y5 u z1 u z2 u z3 u z4 u z5 σ 2 uy1 σ 2 uy2 σ 2 uy3 σ 2 uy4 σ 2 uy5 σ 2 uz1 σ 2 uz2 σ 2 uz3 σ 2 uz4 σ 2 uz5
14 Genomic SEM uses these principles to fit structural equation models to genetic covariance matrices derived from GWAS summary statistics using 2 Stage Estimation Stage 1: Estimate Genetic Covariance Matrix and associated matrix of standard errors and their codependencies We use LD Score Regression, but any method for estimating this matrix (e.g. GREML) and its sampling distribution can be used Stage 2: Fit a Structural Equation Model to the Matrices from Stage 1
15 Fitting Structural Equation Models to GWAS-Derived Genetic Covariance Matrices R package: GenomicSEM install.packages("devtools") library(devtools) install_github("michelnivard/genomicsem") library(genomicsem)

16 Start with GWAS Summary Statistics for the Phenotypes of Interest No need for raw data No need to conduct a primary GWAS yourself: Download them online! sumstats for over 3700 phenotypes have been helpfully indexed at sumstats for over 4000 UK Biobank phenotypes are downloadable at
17 Prepare the data for LDSC: Munge Aligns allele sign across sumstats for all traits Computes z-statistics needed for LDSC Restricts to common SNPs (MAF>.01) on reference panel Function requires: 1. names of the summary statistics files 2. name of the reference file. Hapmap 3 SNPs (downloadable on our wiki) with the MHC region removed is standard (well-imputed and well-known LD structure) 3. trait names that will be used to name the saved files munge(c("scz.txt", "bip.txt", mdd.txt", "ptsd.txt","anx.txt"), "w_hm3.nomhc.snplist",trait.names=c("scz", "bip","mdd","ptsd","anx"))
18 Stage 1 Estimation: Multivariable LDSC Create a genetic covariance matrix, S: an atlas of genetic correlations sumstats <- c("scz.sumstats.gz", "bip.sumstats.gz", EA.sumstats.gz") Diagonal elements are (heritabilities) #for case control phenotypes sample.prev <- c(.39,.45,na) population.prev <- c(.01,.01,na) ld <- "eur_w_ld_chr/" trait.names<-c("scz","bip", EA") Off-diagonal elements are coheritabilities LDSCoutput <- ldsc(sumstats, sample.prev, population.prev, ld, ld, trait.names)
19 Stage 1 Estimation: Multivariable LDSC Also produced is a second matrix, V, of squared standard errors and the dependencies between estimation errors Diagonal elements are squared standard errors of genetic variances and covariances Off-diagonal elements are dependencies between estimation errors used to directly model dependencies that occur due to sample overlap from contributing GWASs
20 Stage 2 Estimation: Specify the SEM Example: Genetic multiple regression S = SCZ.57 BIP EA g = b 1 SCZ g + b 2 BIP g + u SCZ g EA ρ BIP,SCZ EA g 1 u EA BIP g (df = 0, model parameters are a simply a transformation of the matrix)
21 Stage 2 Estimation: Specify the SEM REGmodel <- 'EA ~ SCZ + BIP SCZ~~BIP' #run the model using the user defined function REGoutput<-usermodel(LDSCoutput, model = REGmodel) #print the output REGoutput
22 EA g = SCZ g BIP g + u RESULTS
 #print the results")
23 Example 2: Genetic Factor Analysis of Anthropometric Traits TwoFactor <- 'F1 =~ NA*BMI + WHR + CO + Waist + Hip F2 =~ NA*Hip + Height + IHC + BL + BW F1~~1*F1 F2~~1*F2 F1~~F2' #run the model Anthro<-usermodel(anthro, model = TwoFactor) #print the results Anthro
24 Example 2: Genetic Factor Analysis of Anthropometric Traits df = 25, CFI =.951, SRMR =.089 BMI = body mass index; WHR = waist-hip ratio; CO = childhood obesity; IHC = infant head circumference; BL = birth length; BW = birth weight. sumstats from EGG and GIANT Consortia
25 Example 2: Genetic Factor Analysis of Anthropometric Traits df = 25, CFI =.951, SRMR =.089 BMI = body mass index; WHR = waist-hip ratio; CO = childhood obesity; IHC = infant head circumference; BL = birth length; BW = birth weight.


26 Example 2: Genetic Factor Analysis of Anthropometric Traits df = 25, CFI =.951, SRMR =.089 BMI = body mass index; WHR = waist-hip ratio; CO = childhood obesity; IHC = infant head circumference; BL = birth length; BW = birth weight.
27 Incorporating Genetic Covariance Structure into Multivariate GWAS Discovery Andrew

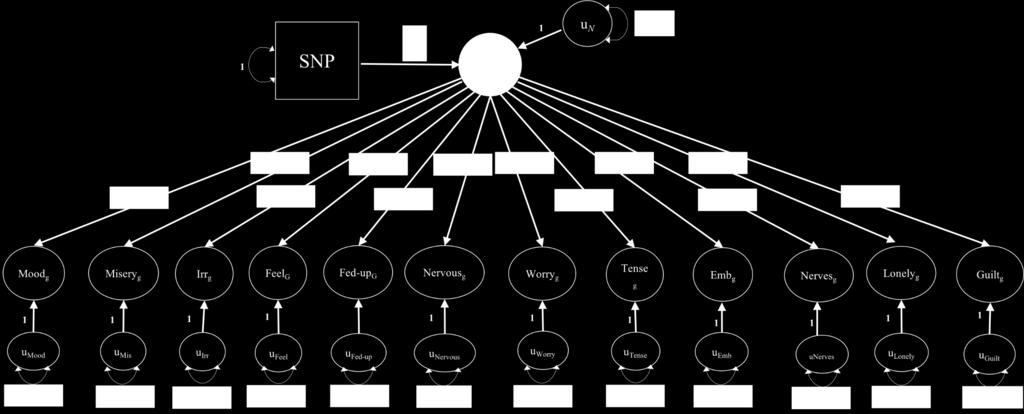
28 Example: Item level analysis of Neuroticism Univariate summary statistics for each of 12 individual items in UKB downloaded from Neale lab website.
29 Prepare Summary Statistics: Aligns allele sign across sumstats for all traits Converts odds ratios and linear probability model coefficients into logistic regression coefficients Converts corresponding standard errors Standardizes effect sizes to phenotypic variance = 1 ss=c("item1.txt","item2.txt","item3.txt", "item4.txt", "item5.txt", "item6.txt", "item7.txt", "item8.txt", "item9.txt", "item10.txt", "item11.txt", "item12.txt") refpan="reference.1000g.maf txt" items=c("n1","n2","n3","n4","n5","n6","n7","n8","n9",n10","n11","n12") se.l=c(f,f,f,f,f,f,f,f,f,f,f,f) lp=c(t,t,t,t,t,t,t,t,t,t,t,t) propor<-c(.451,.427,.280,.556,.406,.237,.568,.171,.478,.213,.177,.283) processed_sumstats <- sumstats(files=ss,ref=refpan,trait.names=items,se.logit=se.l,linprob=lp,prop=propor)
30 Add SNP Effects to the Atlas Expand S to include SNP Effects Genetic Covariances From LDSC SNPcov<addSNPs(LDSCoutput,processed_sumstats) Betas from GWAS sumstats scaled to covariances using MAFs

31 Run the model NeurModel<-commonfactorGWAS(SNPcov)
32 118 lead SNPs 38 unique loci not previously identified in any of the 12 univariate sum stats ( ) 60 previously significant in univariate sum stats, but not for neuroticism ( ) 69 significant Q SNP estimates ( * )
33
34 Relative Power
35 Genomic SEM is a broad framework not just one model Genomic SEM is a statistical framework (and freely available standalone software package) for estimating a nearly limitless number of user specified models to multivariate GWAS summary statistics Lots of other possibilities, e.g.: Deriving Polygenic Scores for Residual Phenotypes Mendelian-Randomization within Multivariate Networks
36 Empirical example Are the socioeconomic sequelae of ADHD mediated by educational attainment? Relevant because if true, staying in school may become a treatment goal for ADHD.
37 Creating sumstats (and computing polygenic scores) for a derived phenotype, e.g. a residual a SNP b* Model1 <- 'EA ~ SNP Income ~ EA SNP' #run the model EA_Inc<-userGWAS(SNPcov, model = Model1) EA g c Income g 1 u i 1 u EA
38 Genetic Mediation in Latent Genetic Space 1 ADHD g Model2 <- 'EA ~ ADHD Income ~ EA ADHD' #run the model ADHD_EA_Inc<-usermodel(LDSCoutput, model = Model2) EA g.72 Income g 1 u i.33 1 u EA.72 Summary Statistics: ADHD (Demontis et al., 2017) Educational Attainment (Okbay et al. 2016) Income (Hill et al., 2016)
39 But not distinguishable from other models 1 ADHD g Model3 <- 'EA ~ ADHD Income ~ ADHD EA ~~ Income' #run the model ADHD_EA_Inc<-usermodel(LDSCoutput, model = Model2) EA g Income g 1 1 u EA u i Summary Statistics: ADHD (Demontis et al., 2017) Educational Attainment (Okbay et al. 2016) Income (Hill et al., 2016)
40 Identifying Plausible Causal Pathways: Mendelian Randomization in Multivariate Networks Genomic SEM models genetic covariance structure Genomic SEM allows for SNPs in the model These can be combined to perform Mendelian Randomization (MR)
41 MR in Genomic SEM Mendelian randomization using GWAS summary data Instrumental Variable (e.g. SNP) Heritable Phenotypes y1 g y2 g
42 MR in Genomic SEM Mendelian randomization using GWAS summary data y1 g y2 g = 0 the Exclusion Restriction
43 MR in Genomic SEM Mendelian randomization using GWAS summary data residual genetic confounding (e.g. pleiotropy from other variants) u 1 u 1 Causal Pathway y1 g y2 g = 0
44 MR in Genomic SEM Networks EA r See also: Burgess & Thompson (2015) ADHD r r Income Summary Statistics: Educational Attainment (Okbay et al. 2016) 160 hits (Sample 8 hits for this example) ADHD (Demontis et al., 2017) 11 hits, 4 present in al Income (Hill et al., 2016) Used as outcome in this example
45 MR in Genomic SEM Networks.82 EA r r r Income.30 ADHD -.15 Summary Statistics: Educational Attainment (Okbay et al. 2016) 160 hits (Sample 8 hits for this example) ADHD (Demontis et al., 2017) 11 hits, 4 present in al Income (Hill et al., 2016) Used as outcome in this example
46 MR in Genomic SEM Networks.82 Allow for reciprocal causation and pleiotropic SNPs (that violate exclusion restriction) -.37 EA -.20 r r.56 r Income.32 ADHD Summary Statistics: Educational Attainment (Okbay et al. 2016) 160 hits (Sample 8 hits for this example) ADHD (Demontis et al., 2017) 11 hits, 4 present in al Income (Hill et al., 2016) Used as outcome in this example
47 MR in Genomic SEM Networks.82 Allow for reciprocal causation and pleiotropic SNPs (that violate exclusion restriction) -.37 EA -.20 r r.56 r Income.32 ADHD Summary Statistics: Educational Attainment (Okbay et al. 2016) 160 hits (Sample 8 hits for this example) ADHD (Demontis et al., 2017) 11 hits, 4 present in al Income (Hill et al., 2016) Used as outcome in this example
48 Overview Genomic SEM is ready for use today! Work through examples and tutorials on our wiki ( Ask questions on our google forum Lots can be done using existing, openly available GWAS summary statistics Models are flexible and up to the user Modeling language is very straightforward Regression: y ~ x Covariance: x1 ~~ x2 Use Genomic SEM to derive sumstats for novel phenotypes for use in PGS analyses
49 Acknowledgements NIH grants R01HD083613, R01AG054628, R21HD081437, R24HD Jacobs Foundation Royal Netherlands Academy of Science Professor Award PAH/6635 ZonMw grants , European Union Seventh Framework Program (FP7/ ) ACTION Project MRC grant MR/K026992/1 AgeUK Disconnected Mind Project
50
51 extras
52 Stage 2 Estimation We specify a Structural Equation Model that implies a genetic covariance matrix Σ(θ) as a function of a set of model parameters θ. Parameters are estimated such that they minimize the discrepancy between the model implied genetic covariance matrix Σ(θ) and the S genetic covariance matrix estimated in Stage 1, weighted by the inverse of diagonal elements of the V matrix. Asymptotic Distribution Free (Brown, 1984; Muthen, 1993)
53 Stage 2 Estimation Standard errors are obtained with a sandwich correction using the full V s matrix where Δ is the matrix of model derivatives evaluated at the parameter estimates, Γ is the naïve weight matrix, diag(v s ), used in paramemeter estimation, and V s is the full sampling covariance matrix of the genetic variances and covariances. Model Fit Statistics (model χ 2, AIC, CFI) are derived using S and V matrices, rather than the usual formulas that only apply to raw data-based estimates of covariance matrices
54 MTAG builds off the LDSC framework φ k = X β k + ϵ k β k are random effects φ k is an N 1 vector of scores on phenotype k X is an N M matrix of standardized genotypes β k is an M 1 vector of genotype effect sizes for phenotype k E(β k )= 0 and cov(β k )= Ω Σ is the sampling covariance matrix of GWAS estimates of β k In other words: ϵ k is an N 1 vector of residuals for phenotype k Ω MTAG = 1 MM S GSEM and Σ MTAG V SNP GSEM
55 How Does Genomic SEM Relate to Other Multivariate Methods for GWAS Discovery? e.g. MTAG (Turley et al., 2018)
56 MTAG is a Specific Model in Genomic SEM MTAG Moment Condition MTAG as a Genomic SEM σ 2 ut u t 1 σ 2 SNPj SNPj β MTAG j,t t β LDSC t,s s 1 u σ 2 us s β GWAS j,s = cov(t,s) LDSC var(t) LDSC i.e., β MTAG j,t = β GWAS j,s β LDSC t,s and β MTAG j,t = β GWAS j,t β MTAG j,t σ GWAS j,s σ 2 SNPj = β MTAG j,t β LDSC t,s i.e., β MTAG j,t = β GWAS j,s β LDSC t,s and σ GWAS j,t = σ 2 SNPj β MTAG j,t ( Ω MTAG = 1 MM S GSEM and Σ MTAG V SNP GSEM ) i.e, β MTAG j,t = β GWAS j,t
57 Classic MTAG vs. Genomic SEM MTAG (Simulation Data: 2 phenotypes, 40% sample overlap) R 2 > 99% Slope =.9979 Intercept = R 2 > 99% Slope =.9996 Intercept =.0003
58
59 Chi Square Statistic Null Distribution Chi Square (SumStat) vs. Chi Square (Raw)
60
61
62
Multi-trait analysis of genome-wide association summary statistics using MTAG
 SUPPLEMENTARY INFORMATION Articles https://doi.org/0.038/s4588-07-0009-4 In the format provided by the authors and unedited. Multi-trait analysis of genome-wide association summary statistics using MTAG
(Genome-wide) association analysis
 association analysis") (Genome-wide) association analysis 1 Key concepts Mapping QTL by association relies on linkage disequilibrium in the population; LD can be caused by close linkage between a QTL and marker (= good) or by
(Genome-wide) association analysis 1 Key concepts Mapping QTL by association relies on linkage disequilibrium in the population; LD can be caused by close linkage between a QTL and marker (= good) or by
Structural Equation Modeling and Confirmatory Factor Analysis. Types of Variables
 /4/04 Structural Equation Modeling and Confirmatory Factor Analysis Advanced Statistics for Researchers Session 3 Dr. Chris Rakes Website: http://csrakes.yolasite.com Email: Rakes@umbc.edu Twitter: @RakesChris
Introduction to Structural Equation Modeling Dominique Zephyr Applied Statistics Lab
 Applied Statistics Lab Introduction to Structural Equation Modeling Dominique Zephyr Applied Statistics Lab SEM Model 3.64 7.32 Education 2.6 Income 2.1.6.83 Charac. of Individuals 1 5.2e-06 -.62 2.62
Causal inference in biomedical sciences: causal models involving genotypes. Mendelian randomization genes as Instrumental Variables
 Causal inference in biomedical sciences: causal models involving genotypes Causal models for observational data Instrumental variables estimation and Mendelian randomization Krista Fischer Estonian Genome
Efficient Bayesian mixed model analysis increases association power in large cohorts
 Linear regression Existing mixed model methods New method: BOLT-LMM Time O(MM) O(MN 2 ) O MN 1.5 Corrects for confounding? Power Efficient Bayesian mixed model analysis increases association power in large
Extending the MR-Egger method for multivariable Mendelian randomization to correct for both measured and unmeasured pleiotropy
 Received: 20 October 2016 Revised: 15 August 2017 Accepted: 23 August 2017 DOI: 10.1002/sim.7492 RESEARCH ARTICLE Extending the MR-Egger method for multivariable Mendelian randomization to correct for
Computational Systems Biology: Biology X
 Bud Mishra Room 1002, 715 Broadway, Courant Institute, NYU, New York, USA L#7:(Mar-23-2010) Genome Wide Association Studies 1 The law of causality... is a relic of a bygone age, surviving, like the monarchy,
Association Testing with Quantitative Traits: Common and Rare Variants. Summer Institute in Statistical Genetics 2014 Module 10 Lecture 5
 Association Testing with Quantitative Traits: Common and Rare Variants Timothy Thornton and Katie Kerr Summer Institute in Statistical Genetics 2014 Module 10 Lecture 5 1 / 41 Introduction to Quantitative
Proportional Variance Explained by QLT and Statistical Power. Proportional Variance Explained by QTL and Statistical Power
 Proportional Variance Explained by QTL and Statistical Power Partitioning the Genetic Variance We previously focused on obtaining variance components of a quantitative trait to determine the proportion
Power and sample size calculations for designing rare variant sequencing association studies.
 Power and sample size calculations for designing rare variant sequencing association studies. Seunggeun Lee 1, Michael C. Wu 2, Tianxi Cai 1, Yun Li 2,3, Michael Boehnke 4 and Xihong Lin 1 1 Department
Genotype Imputation. Biostatistics 666
 Genotype Imputation Biostatistics 666 Previously Hidden Markov Models for Relative Pairs Linkage analysis using affected sibling pairs Estimation of pairwise relationships Identity-by-Descent Relatives
Lecture 2: Genetic Association Testing with Quantitative Traits. Summer Institute in Statistical Genetics 2017
 Lecture 2: Genetic Association Testing with Quantitative Traits Instructors: Timothy Thornton and Michael Wu Summer Institute in Statistical Genetics 2017 1 / 29 Introduction to Quantitative Trait Mapping
Introduction to Structural Equation Modeling
 Introduction to Structural Equation Modeling Notes Prepared by: Lisa Lix, PhD Manitoba Centre for Health Policy Topics Section I: Introduction Section II: Review of Statistical Concepts and Regression
An Introduction to Path Analysis
 An Introduction to Path Analysis PRE 905: Multivariate Analysis Lecture 10: April 15, 2014 PRE 905: Lecture 10 Path Analysis Today s Lecture Path analysis starting with multivariate regression then arriving
A Comparison of Robust Methods for Mendelian Randomization Using Multiple Genetic Variants
 8 A Comparison of Robust Methods for Mendelian Randomization Using Multiple Genetic Variants Yanchun Bao ISER, University of Essex Paul Clarke ISER, University of Essex Melissa C Smart ISER, University
Nature Genetics: doi: /ng Supplementary Figure 1. Number of cases and proxy cases required to detect association at designs.
 Supplementary Figure 1 Number of cases and proxy cases required to detect association at designs. = 5 10 8 for case control and proxy case control The ratio of controls to cases (or proxy cases) is 1.
Robust instrumental variable methods using multiple candidate instruments with application to Mendelian randomization
 Robust instrumental variable methods using multiple candidate instruments with application to Mendelian randomization arxiv:1606.03729v1 [stat.me] 12 Jun 2016 Stephen Burgess 1, Jack Bowden 2 Frank Dudbridge
Lecture 7: Interaction Analysis. Summer Institute in Statistical Genetics 2017
 Lecture 7: Interaction Analysis Timothy Thornton and Michael Wu Summer Institute in Statistical Genetics 2017 1 / 39 Lecture Outline Beyond main SNP effects Introduction to Concept of Statistical Interaction
Variance Components: Phenotypic, Environmental and Genetic
 Variance Components: Phenotypic, Environmental and Genetic You should keep in mind that the Simplified Model for Polygenic Traits presented above is very simplified. In many cases, polygenic or quantitative
Lecture WS Evolutionary Genetics Part I 1
 Quantitative genetics Quantitative genetics is the study of the inheritance of quantitative/continuous phenotypic traits, like human height and body size, grain colour in winter wheat or beak depth in
What is Latent Class Analysis. Tarani Chandola
 What is Latent Class Analysis Tarani Chandola methods@manchester Many names similar methods (Finite) Mixture Modeling Latent Class Analysis Latent Profile Analysis Latent class analysis (LCA) LCA is a
1 Springer. Nan M. Laird Christoph Lange. The Fundamentals of Modern Statistical Genetics
 1 Springer Nan M. Laird Christoph Lange The Fundamentals of Modern Statistical Genetics 1 Introduction to Statistical Genetics and Background in Molecular Genetics 0 0 1 0 0 0 0 0 0 0 0 0 0 0 0 0 0 0 0
MODEL-FREE LINKAGE AND ASSOCIATION MAPPING OF COMPLEX TRAITS USING QUANTITATIVE ENDOPHENOTYPES
 MODEL-FREE LINKAGE AND ASSOCIATION MAPPING OF COMPLEX TRAITS USING QUANTITATIVE ENDOPHENOTYPES Saurabh Ghosh Human Genetics Unit Indian Statistical Institute, Kolkata Most common diseases are caused by
Factor Analysis & Structural Equation Models. CS185 Human Computer Interaction
 Factor Analysis & Structural Equation Models CS185 Human Computer Interaction MoodPlay Recommender (Andjelkovic et al, UMAP 2016) Online system available here: http://ugallery.pythonanywhere.com/ 2 3 Structural
arxiv: v1 [stat.me] 21 Nov 2018
![arxiv: v1 [stat.me] 21 Nov 2018](/thumbs/90/104090774.jpg "arxiv: v1 [stat.me] 21 Nov 2018") Distinguishing correlation from causation using genome-wide association studies arxiv:8.883v [stat.me] 2 Nov 28 Luke J. O Connor Department of Epidemiology Harvard T.H. Chan School of Public Health Boston,
Distinguishing correlation from causation using genome-wide association studies arxiv:8.883v [stat.me] 2 Nov 28 Luke J. O Connor Department of Epidemiology Harvard T.H. Chan School of Public Health Boston,
An Introduction to Mplus and Path Analysis
 An Introduction to Mplus and Path Analysis PSYC 943: Fundamentals of Multivariate Modeling Lecture 10: October 30, 2013 PSYC 943: Lecture 10 Today s Lecture Path analysis starting with multivariate regression
Friday Harbor From Genetics to GWAS (Genome-wide Association Study) Sept David Fardo
 Sept David Fardo") Friday Harbor 2017 From Genetics to GWAS (Genome-wide Association Study) Sept 7 2017 David Fardo Purpose: prepare for tomorrow s tutorial Genetic Variants Quality Control Imputation Association Visualization
Friday Harbor 2017 From Genetics to GWAS (Genome-wide Association Study) Sept 7 2017 David Fardo Purpose: prepare for tomorrow s tutorial Genetic Variants Quality Control Imputation Association Visualization
Using Structural Equation Modeling to Conduct Confirmatory Factor Analysis
 Using Structural Equation Modeling to Conduct Confirmatory Factor Analysis Advanced Statistics for Researchers Session 3 Dr. Chris Rakes Website: http://csrakes.yolasite.com Email: Rakes@umbc.edu Twitter:
Advanced Structural Equations Models I
 This work is licensed under a Creative Commons Attribution-NonCommercial-ShareAlike License. Your use of this material constitutes acceptance of that license and the conditions of use of materials on this
NIH Public Access Author Manuscript Stat Sin. Author manuscript; available in PMC 2013 August 15.
 NIH Public Access Author Manuscript Published in final edited form as: Stat Sin. 2012 ; 22: 1041 1074. ON MODEL SELECTION STRATEGIES TO IDENTIFY GENES UNDERLYING BINARY TRAITS USING GENOME-WIDE ASSOCIATION
STA441: Spring Multiple Regression. This slide show is a free open source document. See the last slide for copyright information.
 STA441: Spring 2018 Multiple Regression This slide show is a free open source document. See the last slide for copyright information. 1 Least Squares Plane 2 Statistical MODEL There are p-1 explanatory
Quantitative Genomics and Genetics BTRY 4830/6830; PBSB
 Quantitative Genomics and Genetics BTRY 4830/6830; PBSB.5201.01 Lecture 18: Introduction to covariates, the QQ plot, and population structure II + minimal GWAS steps Jason Mezey jgm45@cornell.edu April
Binomial Mixture Model-based Association Tests under Genetic Heterogeneity
 Binomial Mixture Model-based Association Tests under Genetic Heterogeneity Hui Zhou, Wei Pan Division of Biostatistics, School of Public Health, University of Minnesota, Minneapolis, MN 55455 April 30,
I Have the Power in QTL linkage: single and multilocus analysis
 I Have the Power in QTL linkage: single and multilocus analysis Benjamin Neale 1, Sir Shaun Purcell 2 & Pak Sham 13 1 SGDP, IoP, London, UK 2 Harvard School of Public Health, Cambridge, MA, USA 3 Department
Correlation. A statistics method to measure the relationship between two variables. Three characteristics
 Correlation Correlation A statistics method to measure the relationship between two variables Three characteristics Direction of the relationship Form of the relationship Strength/Consistency Direction
Confirmatory Factor Analysis. Psych 818 DeShon
 Confirmatory Factor Analysis Psych 818 DeShon Purpose Takes factor analysis a few steps further. Impose theoretically interesting constraints on the model and examine the resulting fit of the model with
Psychology 454: Latent Variable Modeling How do you know if a model works?
 Psychology 454: Latent Variable Modeling How do you know if a model works? William Revelle Department of Psychology Northwestern University Evanston, Illinois USA November, 2012 1 / 18 Outline 1 Goodness
Lecture 24: Multivariate Response: Changes in G. Bruce Walsh lecture notes Synbreed course version 10 July 2013
 Lecture 24: Multivariate Response: Changes in G Bruce Walsh lecture notes Synbreed course version 10 July 2013 1 Overview Changes in G from disequilibrium (generalized Bulmer Equation) Fragility of covariances
BTRY 4830/6830: Quantitative Genomics and Genetics
 BTRY 4830/6830: Quantitative Genomics and Genetics Lecture 23: Alternative tests in GWAS / (Brief) Introduction to Bayesian Inference Jason Mezey jgm45@cornell.edu Nov. 13, 2014 (Th) 8:40-9:55 Announcements
Phenotypic factor analysis
 1 Phenotypic factor analysis Conor V. Dolan & Michel Nivard VU, Amsterdam Boulder Workshop - March 2018 2 Phenotypic factor analysis A statistical technique to investigate the dimensionality of correlated
BTRY 4830/6830: Quantitative Genomics and Genetics Fall 2014
 BTRY 4830/6830: Quantitative Genomics and Genetics Fall 2014 Homework 4 (version 3) - posted October 3 Assigned October 2; Due 11:59PM October 9 Problem 1 (Easy) a. For the genetic regression model: Y
The Generalized Higher Criticism for Testing SNP-sets in Genetic Association Studies
 The Generalized Higher Criticism for Testing SNP-sets in Genetic Association Studies Ian Barnett, Rajarshi Mukherjee & Xihong Lin Harvard University ibarnett@hsph.harvard.edu August 5, 2014 Ian Barnett
Combining SEM & GREML in OpenMx. Rob Kirkpatrick 3/11/16
 Combining SEM & GREML in OpenMx Rob Kirkpatrick 3/11/16 1 Overview I. Introduction. II. mxgreml Design. III. mxgreml Implementation. IV. Applications. V. Miscellany. 2 G V A A 1 1 F E 1 VA 1 2 3 Y₁ Y₂
Introduction to Confirmatory Factor Analysis
 Introduction to Confirmatory Factor Analysis Multivariate Methods in Education ERSH 8350 Lecture #12 November 16, 2011 ERSH 8350: Lecture 12 Today s Class An Introduction to: Confirmatory Factor Analysis
Supplementary Information for: Detection and interpretation of shared genetic influences on 42 human traits
 Supplementary Information for: Detection and interpretation of shared genetic influences on 42 human traits Joseph K. Pickrell 1,2,, Tomaz Berisa 1, Jimmy Z. Liu 1, Laure Segurel 3, Joyce Y. Tung 4, David
Causal Graphical Models in Quantitative Genetics and Genomics
 Causal Graphical Models in Quantitative Genetics and Genomics Guilherme J. M. Rosa Department of Animal Sciences Department of Biostatistics & Medical Informatics OUTLINE Introduction: Correlation and
The Generalized Higher Criticism for Testing SNP-sets in Genetic Association Studies
 The Generalized Higher Criticism for Testing SNP-sets in Genetic Association Studies Ian Barnett, Rajarshi Mukherjee & Xihong Lin Harvard University ibarnett@hsph.harvard.edu June 24, 2014 Ian Barnett
Can you tell the relationship between students SAT scores and their college grades?
 Correlation One Challenge Can you tell the relationship between students SAT scores and their college grades? A: The higher SAT scores are, the better GPA may be. B: The higher SAT scores are, the lower
Quantitative Genomics and Genetics BTRY 4830/6830; PBSB
 Quantitative Genomics and Genetics BTRY 4830/6830; PBSB.5201.01 Lecture 20: Epistasis and Alternative Tests in GWAS Jason Mezey jgm45@cornell.edu April 16, 2016 (Th) 8:40-9:55 None Announcements Summary
SUPPLEMENTARY INFORMATION
 doi:10.1038/nature25973 Power Simulations We performed extensive power simulations to demonstrate that the analyses carried out in our study are well powered. Our simulations indicate very high power for
Specifying Latent Curve and Other Growth Models Using Mplus. (Revised )
") Ronald H. Heck 1 University of Hawai i at Mānoa Handout #20 Specifying Latent Curve and Other Growth Models Using Mplus (Revised 12-1-2014) The SEM approach offers a contrasting framework for use in analyzing
Ronald H. Heck 1 University of Hawai i at Mānoa Handout #20 Specifying Latent Curve and Other Growth Models Using Mplus (Revised 12-1-2014) The SEM approach offers a contrasting framework for use in analyzing
Software for genome-wide association studies having multivariate responses: Introducing MAGWAS
 Software for genome-wide association studies having multivariate responses: Introducing MAGWAS Chad C. Brown 1 and Alison A. Motsinger-Reif 1,2 1 Department of Statistics, 2 Bioinformatics Research Center
ANOVA, ANCOVA and MANOVA as sem
 ANOVA, ANCOVA and MANOVA as sem Robin Beaumont 2017 Hoyle Chapter 24 Handbook of Structural Equation Modeling (2015 paperback), Examples converted to R and Onyx SEM diagrams. This workbook duplicates some
Structural Equation Modelling
 Slide Email: jkanglim@unimelb.edu.au Office: Room 0 Redmond Barry Building Website: http://jeromyanglim.googlepages.com/ Appointments: For appointments regarding course or with the application of statistics
. Also, in this case, p i = N1 ) T, (2) where. I γ C N(N 2 2 F + N1 2 Q)
 T, (2) where. I γ C N(N 2 2 F + N1 2 Q)") Supplementary information S7 Testing for association at imputed SPs puted SPs Score tests A Score Test needs calculations of the observed data score and information matrix only under the null hypothesis,
Supplementary information S7 Testing for association at imputed SPs puted SPs Score tests A Score Test needs calculations of the observed data score and information matrix only under the null hypothesis,
Correlation and Linear Regression
 Correlation and Linear Regression Correlation: Relationships between Variables So far, nearly all of our discussion of inferential statistics has focused on testing for differences between group means
SC705: Advanced Statistics Instructor: Natasha Sarkisian Class notes: Introduction to Structural Equation Modeling (SEM)
") SC705: Advanced Statistics Instructor: Natasha Sarkisian Class notes: Introduction to Structural Equation Modeling (SEM) SEM is a family of statistical techniques which builds upon multiple regression,
SC705: Advanced Statistics Instructor: Natasha Sarkisian Class notes: Introduction to Structural Equation Modeling (SEM) SEM is a family of statistical techniques which builds upon multiple regression,
STA 431s17 Assignment Eight 1
 STA 43s7 Assignment Eight The first three questions of this assignment are about how instrumental variables can help with measurement error and omitted variables at the same time; see Lecture slide set
,..., θ(2),..., θ(n)
,..., θ(n)") Likelihoods for Multivariate Binary Data Log-Linear Model We have 2 n 1 distinct probabilities, but we wish to consider formulations that allow more parsimonious descriptions as a function of covariates.
Likelihoods for Multivariate Binary Data Log-Linear Model We have 2 n 1 distinct probabilities, but we wish to consider formulations that allow more parsimonious descriptions as a function of covariates.
Multilevel Structural Equation Modeling
 Multilevel Structural Equation Modeling Joop Hox Utrecht University j.hox@uu.nl http://www.joophox.net 14_15_mlevsem Multilevel Regression Three level data structure Groups at different levels may have
Association studies and regression
 Association studies and regression CM226: Machine Learning for Bioinformatics. Fall 2016 Sriram Sankararaman Acknowledgments: Fei Sha, Ameet Talwalkar Association studies and regression 1 / 104 Administration
Quantitative Genomics and Genetics BTRY 4830/6830; PBSB
 Quantitative Genomics and Genetics BTRY 4830/6830; PBSB.5201.01 Lecture16: Population structure and logistic regression I Jason Mezey jgm45@cornell.edu April 11, 2017 (T) 8:40-9:55 Announcements I April
STA442/2101: Assignment 5
 STA442/2101: Assignment 5 Craig Burkett Quiz on: Oct 23 rd, 2015 The questions are practice for the quiz next week, and are not to be handed in. I would like you to bring in all of the code you used to
Lecture 11: Multiple trait models for QTL analysis
 Lecture 11: Multiple trait models for QTL analysis Julius van der Werf Multiple trait mapping of QTL...99 Increased power of QTL detection...99 Testing for linked QTL vs pleiotropic QTL...100 Multiple
The supplementary document of LLR: A latent low-rank approach to colocalizing genetic risk variants in multiple GWAS
 The supplementary document of LLR: A latent low-rank approach to colocalizing genetic risk variants in multiple GWAS Jin Liu 1, Xiang Wan 2, Chaolong Wang 3, Chao Yang 4, Xiaowei Zhou 5, and Can Yang 6
Overview. Background
 Overview Implementation of robust methods for locating quantitative trait loci in R Introduction to QTL mapping Andreas Baierl and Andreas Futschik Institute of Statistics and Decision Support Systems
Plausible Values for Latent Variables Using Mplus
 Plausible Values for Latent Variables Using Mplus Tihomir Asparouhov and Bengt Muthén August 21, 2010 1 1 Introduction Plausible values are imputed values for latent variables. All latent variables can
13.1 Causal effects with continuous mediator and. predictors in their equations. The definitions for the direct, total indirect,
 13 Appendix 13.1 Causal effects with continuous mediator and continuous outcome Consider the model of Section 3, y i = β 0 + β 1 m i + β 2 x i + β 3 x i m i + β 4 c i + ɛ 1i, (49) m i = γ 0 + γ 1 x i +
Data Analyses in Multivariate Regression Chii-Dean Joey Lin, SDSU, San Diego, CA
 Data Analyses in Multivariate Regression Chii-Dean Joey Lin, SDSU, San Diego, CA ABSTRACT Regression analysis is one of the most used statistical methodologies. It can be used to describe or predict causal
The Cholesky Approach: A Cautionary Note
 Behavior Genetics, Vol. 26, No. 1, 1996 The Cholesky Approach: A Cautionary Note John C. Loehlin I Received 18 Jan. 1995--Final 27 July 1995 Attention is called to a common misinterpretation of a bivariate
Latent random variables
 Latent random variables Imagine that you have collected egg size data on a fish called Austrolebias elongatus, and the graph of egg size on body size of the mother looks as follows: Egg size (Area) 4.6
Dropping Your Genes. A Simulation of Meiosis and Fertilization and An Introduction to Probability
 Dropping Your Genes A Simulation of Meiosis and Fertilization and An Introduction to To fully understand Mendelian genetics (and, eventually, population genetics), you need to understand certain aspects
Maximum Likelihood Estimation; Robust Maximum Likelihood; Missing Data with Maximum Likelihood
 Maximum Likelihood Estimation; Robust Maximum Likelihood; Missing Data with Maximum Likelihood PRE 906: Structural Equation Modeling Lecture #3 February 4, 2015 PRE 906, SEM: Estimation Today s Class An
STRUCTURAL EQUATION MODELING. Khaled Bedair Statistics Department Virginia Tech LISA, Summer 2013
 STRUCTURAL EQUATION MODELING Khaled Bedair Statistics Department Virginia Tech LISA, Summer 2013 Introduction: Path analysis Path Analysis is used to estimate a system of equations in which all of the
Statistical inference in Mendelian randomization: From genetic association to epidemiological causation
 Statistical inference in Mendelian randomization: From genetic association to epidemiological causation Department of Statistics, The Wharton School, University of Pennsylvania March 1st, 2018 @ UMN Based
Linear Regression (1/1/17)
") STA613/CBB540: Statistical methods in computational biology Linear Regression (1/1/17) Lecturer: Barbara Engelhardt Scribe: Ethan Hada 1. Linear regression 1.1. Linear regression basics. Linear regression
STA613/CBB540: Statistical methods in computational biology Linear Regression (1/1/17) Lecturer: Barbara Engelhardt Scribe: Ethan Hada 1. Linear regression 1.1. Linear regression basics. Linear regression
Bayesian Regression (1/31/13)
") STA613/CBB540: Statistical methods in computational biology Bayesian Regression (1/31/13) Lecturer: Barbara Engelhardt Scribe: Amanda Lea 1 Bayesian Paradigm Bayesian methods ask: given that I have observed
STA613/CBB540: Statistical methods in computational biology Bayesian Regression (1/31/13) Lecturer: Barbara Engelhardt Scribe: Amanda Lea 1 Bayesian Paradigm Bayesian methods ask: given that I have observed
The Common Factor Model. Measurement Methods Lecture 15 Chapter 9
 The Common Factor Model Measurement Methods Lecture 15 Chapter 9 Today s Class Common Factor Model Multiple factors with a single test ML Estimation Methods New fit indices because of ML Estimation method
Nesting and Equivalence Testing
 Nesting and Equivalence Testing Tihomir Asparouhov and Bengt Muthén August 13, 2018 Abstract In this note, we discuss the nesting and equivalence testing (NET) methodology developed in Bentler and Satorra
Research Design - - Topic 15a Introduction to Multivariate Analyses 2009 R.C. Gardner, Ph.D.
 Research Design - - Topic 15a Introduction to Multivariate Analses 009 R.C. Gardner, Ph.D. Major Characteristics of Multivariate Procedures Overview of Multivariate Techniques Bivariate Regression and
SEM Day 1 Lab Exercises SPIDA 2007 Dave Flora
 SEM Day 1 Lab Exercises SPIDA 2007 Dave Flora 1 Today we will see how to estimate CFA models and interpret output using both SAS and LISREL. In SAS, commands for specifying SEMs are given using linear
Relationship between Genomic Distance-Based Regression and Kernel Machine Regression for Multi-marker Association Testing
 Relationship between Genomic Distance-Based Regression and Kernel Machine Regression for Multi-marker Association Testing Wei Pan Division of Biostatistics, School of Public Health, University of Minnesota,
MACAU 2.0 User Manual
 MACAU 2.0 User Manual Shiquan Sun, Jiaqiang Zhu, and Xiang Zhou Department of Biostatistics, University of Michigan shiquans@umich.edu and xzhousph@umich.edu April 9, 2017 Copyright 2016 by Xiang Zhou
Distinctive aspects of non-parametric fitting
 5. Introduction to nonparametric curve fitting: Loess, kernel regression, reproducing kernel methods, neural networks Distinctive aspects of non-parametric fitting Objectives: investigate patterns free
Previous lecture. Single variant association. Use genome-wide SNPs to account for confounding (population substructure)
") Previous lecture Single variant association Use genome-wide SNPs to account for confounding (population substructure) Estimation of effect size and winner s curse Meta-Analysis Today s outline P-value
Previous lecture Single variant association Use genome-wide SNPs to account for confounding (population substructure) Estimation of effect size and winner s curse Meta-Analysis Today s outline P-value
STAT 730 Chapter 9: Factor analysis
 STAT 730 Chapter 9: Factor analysis Timothy Hanson Department of Statistics, University of South Carolina Stat 730: Multivariate Data Analysis 1 / 15 Basic idea Factor analysis attempts to explain the
Path Analysis. PRE 906: Structural Equation Modeling Lecture #5 February 18, PRE 906, SEM: Lecture 5 - Path Analysis
 Path Analysis PRE 906: Structural Equation Modeling Lecture #5 February 18, 2015 PRE 906, SEM: Lecture 5 - Path Analysis Key Questions for Today s Lecture What distinguishes path models from multivariate
Variance Component Models for Quantitative Traits. Biostatistics 666
 Variance Component Models for Quantitative Traits Biostatistics 666 Today Analysis of quantitative traits Modeling covariance for pairs of individuals estimating heritability Extending the model beyond
WHAT IS STRUCTURAL EQUATION MODELING (SEM)?
?") WHAT IS STRUCTURAL EQUATION MODELING (SEM)? 1 LINEAR STRUCTURAL RELATIONS 2 Terminología LINEAR LATENT VARIABLE MODELS T.W. Anderson (1989), Journal of Econometrics MULTIVARIATE LINEAR RELATIONS T.W. Anderson
WHAT IS STRUCTURAL EQUATION MODELING (SEM)? 1 LINEAR STRUCTURAL RELATIONS 2 Terminología LINEAR LATENT VARIABLE MODELS T.W. Anderson (1989), Journal of Econometrics MULTIVARIATE LINEAR RELATIONS T.W. Anderson
Statistics in medicine
 Statistics in medicine Lecture 4: and multivariable regression Fatma Shebl, MD, MS, MPH, PhD Assistant Professor Chronic Disease Epidemiology Department Yale School of Public Health Fatma.shebl@yale.edu
Lecture 9. QTL Mapping 2: Outbred Populations
 Lecture 9 QTL Mapping 2: Outbred Populations Bruce Walsh. Aug 2004. Royal Veterinary and Agricultural University, Denmark The major difference between QTL analysis using inbred-line crosses vs. outbred
Using Mplus individual residual plots for. diagnostics and model evaluation in SEM
 Using Mplus individual residual plots for diagnostics and model evaluation in SEM Tihomir Asparouhov and Bengt Muthén Mplus Web Notes: No. 20 October 31, 2017 1 Introduction A variety of plots are available
Latent Growth Models 1
 1 We will use the dataset bp3, which has diastolic blood pressure measurements at four time points for 256 patients undergoing three types of blood pressure medication. These are our observed variables:
Statistical Distribution Assumptions of General Linear Models
 Statistical Distribution Assumptions of General Linear Models Applied Multilevel Models for Cross Sectional Data Lecture 4 ICPSR Summer Workshop University of Colorado Boulder Lecture 4: Statistical Distributions
STA 216, GLM, Lecture 16. October 29, 2007
 STA 216, GLM, Lecture 16 October 29, 2007 Efficient Posterior Computation in Factor Models Underlying Normal Models Generalized Latent Trait Models Formulation Genetic Epidemiology Illustration Structural
Model-Free Knockoffs: High-Dimensional Variable Selection that Controls the False Discovery Rate
 Model-Free Knockoffs: High-Dimensional Variable Selection that Controls the False Discovery Rate Lucas Janson, Stanford Department of Statistics WADAPT Workshop, NIPS, December 2016 Collaborators: Emmanuel
UNIVERSITY OF TORONTO Faculty of Arts and Science
 UNIVERSITY OF TORONTO Faculty of Arts and Science December 2013 Final Examination STA442H1F/2101HF Methods of Applied Statistics Jerry Brunner Duration - 3 hours Aids: Calculator Model(s): Any calculator
ECON 5350 Class Notes Functional Form and Structural Change
 ECON 5350 Class Notes Functional Form and Structural Change 1 Introduction Although OLS is considered a linear estimator, it does not mean that the relationship between Y and X needs to be linear. In this
EFFICIENT COMPUTATION WITH A LINEAR MIXED MODEL ON LARGE-SCALE DATA SETS WITH APPLICATIONS TO GENETIC STUDIES
 Submitted to the Annals of Applied Statistics EFFICIENT COMPUTATION WITH A LINEAR MIXED MODEL ON LARGE-SCALE DATA SETS WITH APPLICATIONS TO GENETIC STUDIES By Matti Pirinen, Peter Donnelly and Chris C.A.