Lampiran 1. Hasil Determinasi Tanaman Umbi Singkong
|
|
|
- Rosalyn Blankenship
- 5 years ago
- Views:
Transcription
1 Lampiran 1. Hasil Determinasi Tanaman Umbi Singkong 1
2 Lampiram 1. (Lanjutan) 2
")
3 Lampiran 1. (Lanjutan) 3
4 Lampiran 2. Certificate Of Analisis Dimenhidrinat 4
5 Lampiran 2. (Lanjutan) 5
6 Lampiran 2. (Lanjutan) 6
7 Lampiran 2. (Lanjutan) 7
8 8 Lampiran 3. Perhitungan konsentrasi pati umbi singkong F I 6% = = = 300 mg/5 ml =0,3 gram F II 8% = = = 400 mg/5 ml = 0,4 gram F III 10% = = = 500 mg/5 ml = 0,5 gram
9 9 Lampiran 4. Tabel Perhitungan Ukuran Partikel Suspensi Dimenhidrinat FORMULA UKURAN PARTIKEL (µm) replikasi 1 replikasi 2 replikasi 3 TOTAL RATA- RATA I 5,98 6,7 8,45 18,09 6,03 II 6,02 8,88 10,16 24,84 8,28 III 6,09 9,26 11,15 29,76 9,92 Keterangan : Formula I Formula II Formula III : Ukuran partikel suspensi dimenhidrinat dengan suspending agent pati umbi singkong 6 (%b/b) : Ukuran partikel suspensi dimenhidrinat dengan Suspending agent pati umbi singkong 8 (%b/b) : Ukuran partikel suspensi dimenhidrinat dengan Suspending agent pati umbi singkong 10 (% b/b)
10 10 Lampiran 5. Tabel Perhitungan Viskositas Suspensi Dimenhidrinat FORMULA replikasi 1 VISKOSITAS (dpas) replikasi 2 replikasi 3 TOTAL RATA- RATA I 2,08 5,01 3,02 10,11 3,37 II 5,03 2,97 4,03 12,03 4,01 III 4,01 3,67 4,53 12,21 4,07 Keterangan : Formula I Formula II Formula III : Viskositas suspensi dimenhidrinat dengan suspending agent pati umbi singkong 6 (%b/b) : Viskositas suspensi dimenhidrinat dengan Suspending agent pati umbi singkong 8 (%b/b) : Viskositas suspensi dimenhidrinat dengan Suspending agent pati umbi singkong 10 (% b/b)
11 11 Lampiran 6. Tabel Perhitungan Volume Sedimentasi Suspensi Dimenhidrinat FORMULA VOLUME SEDIMENTASI (ml) replikasi 1 replikasi 2 replikasi 3 TOTAL RATA- RATA I 0,98 0,94 0,92 2,84 0,95 II 0,96 0,98 0,98 2,92 0,97 III 0,99 0,97 0,98 2,94 0,98 Keterangan : Formula I Formula II Formula III : Volume sedimentasi suspensi dimenhidrinat dengan suspending agent pati umbi singkong 6 (%b/b) : Volume sedimentasi suspensi dimenhidrinat dengan Suspending agent pati umbi singkong 8 (%b/b) : Volume sedimentasi dimenhidrinat dengan Suspending agent pati umbi singkong 10 (% b/b)
12 12 Lampiran 7. Tabel Perhitungan Redispersibilitas Suspensi Dimenhidrinat FORMULA REDISPERSIBILITAS (DETIK) replikasi 1 replikasi 2 replikasi 3 TOTAL RATA- RATA I 18,95 16,03 17,98 52,96 17,65 II 19,03 20,51 18,52 58,06 19,35 III 21,21 18,92 20,63 60,76 20,25 Keterangan : Formula I Formula II Formula III : Redispersibilitas suspensi dimenhidrinat dengan suspending agent pati umbi singkong 6 (%b/b) : Redispersibilitas suspensi dimenhidrinat dengan Suspending agent pati umbi singkong 8 (%b/b) : Redispersibilitas dimenhidrinat dengan Suspending agent pati umbi singkong 10 (% b/b)
13 13 Lampiran 8. Tabel Perhitungan Mudah Tidaknya dituang Suspensi FORMULA Dimenhidrinat MUDAH TIDAKNYA DITUANG (DETIK) replikasi 1 replikasi 2 replikasi 3 I 8,53 5,87 7,57 TOTAL 21,97 RATA- RATA 7,32 II 11,81 8,95 10,79 31,55 10,52 III 31,15 38,32 40,35 109,82 36,61 Keterangan : Formula I : Mudah tidaknya dituang suspensi dimenhidrinat dengan suspending agent pati umbi singkong 6 (%b/b) Formula II : Mudah tidaknya dituang suspensi dimenhidrinat dengan Suspending agent pati umbi singkong 8 (%b/b) Formula III : Mudah tidaknya dituang dimenhidrinat dengan Suspending agent pati umbi singkong 10 (% b/b)
14 14 Lampiran 9. Hasil Analisis Regresi Linear Ukuran Partikel Suspensi Dimenhidrinat Model Summary b Change Statistics Model R R Square Adjusted R Square Std. Error of the Estimate R Square Change F Change df1 df2 Sig. F Change a a. Predictors: (Constant), Ukuran Partikel b. Dependent Variable: Konsentrasi ANOVA b Model Sum of Squares Df Mean Square F Sig. 1 Regression a Residual Total a. Predictors: (Constant), Ukuran Partikel b. Dependent Variable: Konsentrasi Coefficients a Unstandardized Coefficients Standardized Coefficients Model B Std. Error Beta T Sig. 1 (Constant) Ukuran Partikel a. Dependent Variable: Konsentrasi
15 15 Lampiran 10. Hasil Analisis Regresi Linear Viskositas Suspensi Dimenhidrinat Model Summary b Change Statistics Model R R Square Adjusted R Square Std. Error of the Estimate R Square Change F Change df1 df2 Sig. F Change a a. Predictors: (Constant), Viskositas b. Dependent Variable: Konsentrasi ANOVA b Model Sum of Squares Df Mean Square F Sig. 1 Regression a Residual Total a. Predictors: (Constant), Viskositas b. Dependent Variable: Konsentrasi Coefficients a Unstandardized Coefficients Standardized Coefficients Model B Std. Error Beta t Sig. 1 (Constant) Viskositas a. Dependent Variable: Konsentrasi
16 16 Lampiran 11. Hasil Analisis Regresi Linear Volume Sedimentasi Suspensi Mode l R R Square Dimenhidrinat Adjusted R Square Model Summary b Std. Error of the Estimate Change Statistics R Square Change F Change df1 df2 Sig. F Change a a. Predictors: (Constant), Sedimentasi b. Dependent Variable: Konsentrasi ANOVA b Model Sum of Squares Df Mean Square F Sig. 1 Regression a Residual Total a. Predictors: (Constant), Sedimentasi b. Dependent Variable: Konsentrasi Model Coefficients a Unstandardized Coefficients Standardized Coefficients B Std. Error Beta 1 (Constant) Sedimentasi a. Dependent Variable: Konsentrasi t Sig.
17 17 Lampiran 12. Hasil Analisis Regresi Linear Redispersibilitas Suspensi Dimenhidrinat Model Summary b Mod el R R Square Adjusted R Square Std. Error of the Estimate R Square Change Change Statistics F Change df1 df2 Sig. F Change a a. Predictors: (Constant), Redispresibilitas b. Dependent Variable: Konsentrasi ANOVA b Model Sum of Squares Df Mean Square F Sig. 1 Regression a Residual Total a. Predictors: (Constant), Redispresibilitas b. Dependent Variable: Konsentrasi Model Coefficients a Unstandardized Coefficients Standardized Coefficients B Std. Error Beta 1 (Constant) Redispresibilitas a. Dependent Variable: Konsentrasi t Sig.
18 18 Lampiran 13. Hasil Analisis Regresi Mudah Tidaknya Dituang Suspensi Mod el R Dimenhidrinat R Square Adjusted R Square Model Summary b Std. Error of the Estimate R Square Change Change Statistics F Change df1 df2 Sig. F Change a a. Predictors: (Constant), Mudah tidaknya dituang b. Dependent Variable: Konsentrasi ANOVA b Model Sum of Squares df Mean Square F Sig. 1 Regression a Residual Total a. Predictors: (Constant), Mudah tidaknya dituang b. Dependent Variable: Konsentrasi Model Unstandardized Coefficients Standardized Coefficients B Std. Error Beta 1 (Constant) Mudah tidaknya dituang a. Dependent Variable: Konsentrasi t Sig


19 19 Lampiran 14. Gambar Dokumentasi Penelitian Pati umbi singkong Pengeringan pati umbi singkong Pengukuran kadar air pati umbi singkong Pembuatan mucilago pati umbi singkong suspensi dimenhidrinat


20 20 Pembuatan suspensi dimenhidrinat Suspensi dimenhidrinat Pengukuran partikel suspensi dimenhidrinat Ukuran partikel suspensi dimenhidrinat


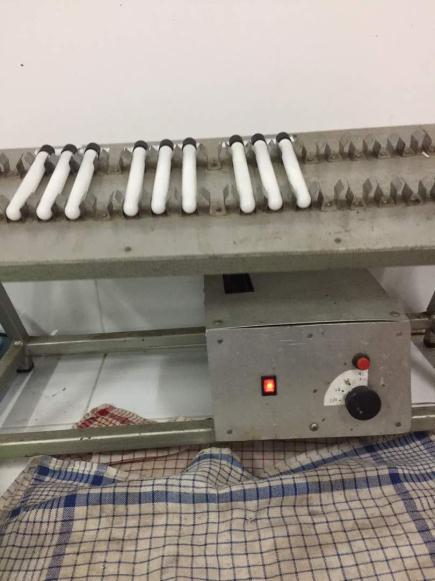

21 21 Uji redispersibilitas Mudah tidaknya dituang Uji viskositas Uji sedimentasi
Lampiran 1 Perhitungan debit lapang menggunakan koefisien Manning
 LAMPIRAN 48 48 Lampiran 1 Perhitungan debit lapang menggunakan koefisien Manning No Tanggal Hujan S (m) waktu rata-rata V air (m/s) TMA (m) A (m²) P (m) R Q (m³/s) N S V Manning Q Manning (m³/s) 1 23-Sep-11
LAMPIRAN. NO Kode Perusahaan Nama Perusahaan. 1 ADRO Adaro Energy Tbk. 2 BSSR Baramulti Suksessarana Tbk. 3 GEMS Golden Energy Mines Tbk
 110 LAMPIRAN Lampiran 1 Daftar Perusahaan Sub Sektor Batubara NO Kode Perusahaan Nama Perusahaan 1 ADRO Adaro Energy Tbk 2 BSSR Baramulti Suksessarana Tbk 3 GEMS Golden Energy Mines Tbk 4 KKGI Resource
kurva standar betakaroten
 7. LAMPIRA Lampiran 1. Kurva Standar Betakaroten (ppm) absorbansi 5 0,1761 2,5 0,0996 1,25 0,0511 0,625 0,0268 0,3125 0,0133 0,15625 0,0056 0,078125 0,0030 kurva standar absorbansi 0.2 0.15 0.1 0.05 0
Item-Total Statistics. Corrected Item- Cronbach's Item Deleted. Total
 45 Lampiran 3 : Uji Validitas dan Reliabilitas Reliability Case Processing Summary N % Valid 75 00.0 Cases Excluded a 0.0 Total 75 00.0 a. Listwise deletion based on all variables in the procedure. Reliability
MLBI
 Lampiran 1 : Pengolahan Data ROA Variabel bebas Variabel terikat : VAIC, Ukuran, dan Leverage : ROA EMITEN TAHUN ROA (%) VAIC (%) UKURAN CEKA DLTA INDF MYOR LEVERAGE (Rp) LnROA LnVAIC LnLEVERAGE 2007 0.04
Area1 Scaled Score (NAPLEX) .535 ** **.000 N. Sig. (2-tailed)
 .535 ** **.000 N. Sig. (2-tailed)") Institutional Assessment Report Texas Southern University College of Pharmacy and Health Sciences "An Analysis of 2013 NAPLEX, P4-Comp. Exams and P3 courses The following analysis illustrates relationships
Institutional Assessment Report Texas Southern University College of Pharmacy and Health Sciences "An Analysis of 2013 NAPLEX, P4-Comp. Exams and P3 courses The following analysis illustrates relationships
Descriptive Statistics
 Lampiran STATISTIK DESKRIPTIF MODEL REGRESI Descriptive Statistics IR Valid N (listwise) N Minimum Maximum Mean Std. Dev iation 30,02222,98000,2595358,2555370 30,050 6,5334,354584,2806794 30-3,44268 6,38392,8378998,87505435
ANALISIS BIVARIAT DATA NUMERIK DAN NUMERIK Uji Korelasi dan Regresi
 ANALISIS BIVARIAT DATA NUMERIK DAN NUMERIK Uji Korelasi dan Regresi Sebagai contoh kita akan melakukan analisis korelasi dan regresi menggunakan data yang sudah dibagikan (ASI Ekslusif) dengan mengambil
Multiple Regression. More Hypothesis Testing. More Hypothesis Testing The big question: What we really want to know: What we actually know: We know:
 Multiple Regression Ψ320 Ainsworth More Hypothesis Testing What we really want to know: Is the relationship in the population we have selected between X & Y strong enough that we can use the relationship
Regression ( Kemampuan Individu, Lingkungan kerja dan Motivasi)
") Regression (, Lingkungan kerja dan ) Descriptive Statistics Mean Std. Deviation N 3.87.333 32 3.47.672 32 3.78.585 32 s Pearson Sig. (-tailed) N Kemampuan Lingkungan Individu Kerja.000.432.49.432.000.3.49.3.000..000.000.000..000.000.000.
Regression (, Lingkungan kerja dan ) Descriptive Statistics Mean Std. Deviation N 3.87.333 32 3.47.672 32 3.78.585 32 s Pearson Sig. (-tailed) N Kemampuan Lingkungan Individu Kerja.000.432.49.432.000.3.49.3.000..000.000.000..000.000.000.
LAMPIRAN 1. Daftar Nilai SIZE, KAP, ARL, dan PERF.SIZE pada Perusahaan yang Dijadikan Sampel
 LAMPIRAN 1 Daftar Nilai SIZE, KAP, ARL, dan PERF.SIZE pada Perusahaan yang Dijadikan Sampel No. Kode Perusahaan Tahun SIZE KAP ARL PERF.SIZE 1. ADES 2011 26,47915994 0 1 0,081848327 2012 26,6870868 0 1
Regression. Notes. Page 1. Output Created Comments 25-JAN :29:55
 REGRESSION /MISSING LISTWISE /STATISTICS COEFF OUTS CI(95) BCOV R ANOVA /CRITERIA=PIN(.05) POUT(.10) /NOORIGIN /DEPENDENT favorability /METHOD=ENTER Zcontemp ZAnxious6 zallcontact. Regression Notes Output
The inductive effect in nitridosilicates and oxysilicates and its effects on 5d energy levels of Ce 3+
 The inductive effect in nitridosilicates and oxysilicates and its effects on 5d energy levels of Ce 3+ Yuwei Kong, Zhen Song, Shuxin Wang, Zhiguo Xia and Quanlin Liu* The Beijing Municipal Key Laboratory
Lampiran. Lampiran 1 Data Penelitian TAHUN Y X1 X2 X3 X4_AS X4_JPG X4_INDH 1995
 Lampiran Lampiran 1 Data Penelitian TAHUN Y X1 X2 X3 X4_AS X4_JPG X4_INDH 1995 1996 1997 1998 1999 2000 2001 2002 2003 2004 2005 2006 2007 2008 2009 2010 2011 2012 2013 2014 3,107,163 3,102,431 3,443,555
*************NO YOGA!!!!!!!************************************.
 *************NO YOGA!!!!!!!************************************. temporary. select if human gt 1 and Q_TotalDuration gt 239 and subjectnum ne 672 and subj ectnum ne 115 and subjectnum ne 104 and subjectnum
Simple Linear Regression
 Simple Linear Regression 1 Correlation indicates the magnitude and direction of the linear relationship between two variables. Linear Regression: variable Y (criterion) is predicted by variable X (predictor)
Perpustakaan Unika LAMPIRAN
 LAMPIRAN LAMPIRAN DATA VARIABEL PENELITIAN No Kode Tahun ROA DER LOG_ASSET AGE OPAD KULAD OUTSIDER EXTRA OPERA AUDIT DELAY ADES 2004 -.26 2.40.03 0 0.694 0 90 2 AISA 2004 0.00 2.60.53 7 0 0 0.2736 0 88
ESP 178 Applied Research Methods. 2/23: Quantitative Analysis
 ESP 178 Applied Research Methods 2/23: Quantitative Analysis Data Preparation Data coding create codebook that defines each variable, its response scale, how it was coded Data entry for mail surveys and
( ), which of the coefficients would end
, which of the coefficients would end") Discussion Sheet 29.7.9 Qualitative Variables We have devoted most of our attention in multiple regression to quantitative or numerical variables. MR models can become more useful and complex when we consider
Discussion Sheet 29.7.9 Qualitative Variables We have devoted most of our attention in multiple regression to quantitative or numerical variables. MR models can become more useful and complex when we consider
( ) *
 *") : * ** : 189.. (r.m.moghadam@gmail.com) ( ) * ** (kemami@hotmail.com) 1391/1/20 : 1390/6/27 :.189-216 1391 . ( ) ( ).... :. 1391 4 190 : 191...... (1)... . (2).. 43 41 34 1379. :. (3). 38/7 28 50 15 8206
: * ** : 189.. (r.m.moghadam@gmail.com) ( ) * ** (kemami@hotmail.com) 1391/1/20 : 1390/6/27 :.189-216 1391 . ( ) ( ).... :. 1391 4 190 : 191...... (1)... . (2).. 43 41 34 1379. :. (3). 38/7 28 50 15 8206
SPSS Output. ANOVA a b Residual Coefficients a Standardized Coefficients
 SPSS Output Homework 1-1e ANOVA a Sum of Squares df Mean Square F Sig. 1 Regression 351.056 1 351.056 11.295.002 b Residual 932.412 30 31.080 Total 1283.469 31 a. Dependent Variable: Sexual Harassment
KUESIONER PENELITIAN. No. Responden: Kepada Yth. Saudara/i di tempat. Dengan hormat,
 LAMPIRAN 50 No. Atribut 4 5 9. Pegawai di counter penjualan Starbucks Coffee PVJ memahami kebutuhan Saya secara spesifik 10. Merek Starbucks Coffee PVJ dapat dipercaya 11. Starbucks Coffee PVJ dapat diandalkan
Interactions between Binary & Quantitative Predictors
 Interactions between Binary & Quantitative Predictors The purpose of the study was to examine the possible joint effects of the difficulty of the practice task and the amount of practice, upon the performance
Regression: Main Ideas Setting: Quantitative outcome with a quantitative explanatory variable. Example, cont.
 TCELL 9/4/205 36-309/749 Experimental Design for Behavioral and Social Sciences Simple Regression Example Male black wheatear birds carry stones to the nest as a form of sexual display. Soler et al. wanted
Multiple OLS Regression
 Multiple OLS Regression Ronet Bachman, Ph.D. Presented by Justice Research and Statistics Association 12/8/2016 Justice Research and Statistics Association 720 7 th Street, NW, Third Floor Washington,
36-309/749 Experimental Design for Behavioral and Social Sciences. Sep. 22, 2015 Lecture 4: Linear Regression
 36-309/749 Experimental Design for Behavioral and Social Sciences Sep. 22, 2015 Lecture 4: Linear Regression TCELL Simple Regression Example Male black wheatear birds carry stones to the nest as a form
4/22/2010. Test 3 Review ANOVA
 Test 3 Review ANOVA 1 School recruiter wants to examine if there are difference between students at different class ranks in their reported intensity of school spirit. What is the factor? How many levels
STATISTICS. Multiple regression
 STATISTICS Multiple regression Problem : Explain the price of a ski pass. 2 3 4 Model (Constant) nb pistes SPSS results Unstandardized Coefficients a. Dependent Variable: prix forfait jour Coefficients
Multivariate Correlational Analysis: An Introduction
 Assignment. Multivariate Correlational Analysis: An Introduction Mertler & Vanetta, Chapter 7 Kachigan, Chapter 4, pps 180-193 Terms you should know. Multiple Regression Linear Equations Least Squares
Practical Biostatistics
 Practical Biostatistics Clinical Epidemiology, Biostatistics and Bioinformatics AMC Multivariable regression Day 5 Recap Describing association: Correlation Parametric technique: Pearson (PMCC) Non-parametric:
Ordinary Least Squares Regression Explained: Vartanian
 Ordinary Least Squares Regression Eplained: Vartanian When to Use Ordinary Least Squares Regression Analysis A. Variable types. When you have an interval/ratio scale dependent variable.. When your independent
III BAHAN DAN METODE PENELITIAN. sudah mencapai umur dewasa tubuh dengan jumlah 31 ekor dengan rata
 III BAHAN DAN METODE PENELITIAN 3.1 Bahan dan Alat penelitian 3.1.1 Bahan Penelitian Penelitian ini menggunakan sapi Peranakan Ongole jantan yang sudah mencapai umur dewasa tubuh dengan jumlah 31 ekor
Multiple Regression and Model Building Lecture 20 1 May 2006 R. Ryznar
 Multiple Regression and Model Building 11.220 Lecture 20 1 May 2006 R. Ryznar Building Models: Making Sure the Assumptions Hold 1. There is a linear relationship between the explanatory (independent) variable(s)
Univariate analysis. Simple and Multiple Regression. Univariate analysis. Simple Regression How best to summarise the data?
 Univariate analysis Example - linear regression equation: y = ax + c Least squares criteria ( yobs ycalc ) = yobs ( ax + c) = minimum Simple and + = xa xc xy xa + nc = y Solve for a and c Univariate analysis
Self-Assessment Weeks 6 and 7: Multiple Regression with a Qualitative Predictor; Multiple Comparisons
 Self-Assessment Weeks 6 and 7: Multiple Regression with a Qualitative Predictor; Multiple Comparisons 1. Suppose we wish to assess the impact of five treatments on an outcome Y. How would these five treatments
STAT 3900/4950 MIDTERM TWO Name: Spring, 2015 (print: first last ) Covered topics: Two-way ANOVA, ANCOVA, SLR, MLR and correlation analysis
 Covered topics: Two-way ANOVA, ANCOVA, SLR, MLR and correlation analysis") STAT 3900/4950 MIDTERM TWO Name: Spring, 205 (print: first last ) Covered topics: Two-way ANOVA, ANCOVA, SLR, MLR and correlation analysis Instructions: You may use your books, notes, and SPSS/SAS. NO
STAT 3900/4950 MIDTERM TWO Name: Spring, 205 (print: first last ) Covered topics: Two-way ANOVA, ANCOVA, SLR, MLR and correlation analysis Instructions: You may use your books, notes, and SPSS/SAS. NO
: The model hypothesizes a relationship between the variables. The simplest probabilistic model: or.
 Chapter Simple Linear Regression : comparing means across groups : presenting relationships among numeric variables. Probabilistic Model : The model hypothesizes an relationship between the variables.
Chapter 4 Regression with Categorical Predictor Variables Page 1. Overview of regression with categorical predictors
 Chapter 4 Regression with Categorical Predictor Variables Page. Overview of regression with categorical predictors 4-. Dummy coding 4-3 4-5 A. Karpinski Regression with Categorical Predictor Variables.
Review of Multiple Regression
 Ronald H. Heck 1 Let s begin with a little review of multiple regression this week. Linear models [e.g., correlation, t-tests, analysis of variance (ANOVA), multiple regression, path analysis, multivariate
Advanced Quantitative Data Analysis
 Chapter 24 Advanced Quantitative Data Analysis Daniel Muijs Doing Regression Analysis in SPSS When we want to do regression analysis in SPSS, we have to go through the following steps: 1 As usual, we choose
Correlation and simple linear regression S5
 Basic medical statistics for clinical and eperimental research Correlation and simple linear regression S5 Katarzyna Jóźwiak k.jozwiak@nki.nl November 15, 2017 1/41 Introduction Eample: Brain size and
Multiple Regression and Model Building (cont d) + GIS Lecture 21 3 May 2006 R. Ryznar
 + GIS Lecture 21 3 May 2006 R. Ryznar") Multiple Regression and Model Building (cont d) + GIS 11.220 Lecture 21 3 May 2006 R. Ryznar Model Summary b 1-[(SSE/n-k+1)/(SST/n-1)] Model 1 Adjusted Std. Error of R R Square R Square the Estimate.991
Multiple Regression and Model Building (cont d) + GIS 11.220 Lecture 21 3 May 2006 R. Ryznar Model Summary b 1-[(SSE/n-k+1)/(SST/n-1)] Model 1 Adjusted Std. Error of R R Square R Square the Estimate.991
SPSS LAB FILE 1
 SPSS LAB FILE www.mcdtu.wordpress.com 1 www.mcdtu.wordpress.com 2 www.mcdtu.wordpress.com 3 OBJECTIVE 1: Transporation of Data Set to SPSS Editor INPUTS: Files: group1.xlsx, group1.txt PROCEDURE FOLLOWED:
TOPIC 9 SIMPLE REGRESSION & CORRELATION
 TOPIC 9 SIMPLE REGRESSION & CORRELATION Basic Linear Relationships Mathematical representation: Y = a + bx X is the independent variable [the variable whose value we can choose, or the input variable].
Chapter 9 - Correlation and Regression
 Chapter 9 - Correlation and Regression 9. Scatter diagram of percentage of LBW infants (Y) and high-risk fertility rate (X ) in Vermont Health Planning Districts. 9.3 Correlation between percentage of
Inter Item Correlation Matrix (R )
") 7 1. I have the ability to influence my child s well-being. 2. Whether my child avoids injury is just a matter of luck. 3. Luck plays a big part in determining how healthy my child is. 4. I can do a lot
7 1. I have the ability to influence my child s well-being. 2. Whether my child avoids injury is just a matter of luck. 3. Luck plays a big part in determining how healthy my child is. 4. I can do a lot
Bivariate Regression Analysis. The most useful means of discerning causality and significance of variables
 Bivariate Regression Analysis The most useful means of discerning causality and significance of variables Purpose of Regression Analysis Test causal hypotheses Make predictions from samples of data Derive
A discussion on multiple regression models
 A discussion on multiple regression models In our previous discussion of simple linear regression, we focused on a model in which one independent or explanatory variable X was used to predict the value
Research Design - - Topic 19 Multiple regression: Applications 2009 R.C. Gardner, Ph.D.
 Research Design - - Topic 19 Multiple regression: Applications 2009 R.C. Gardner, Ph.D. Curve Fitting Mediation analysis Moderation Analysis 1 Curve Fitting The investigation of non-linear functions using
\One-Sample Kolmogorov-Smirnov Test Unstandardiz ed Residual N 222 Normal Parameters a,b Mean, Std. Deviation
 LAMPIRAN \One-Sample Kolmogorov-Smirnov Test Unstandardiz ed Residual N 222 Normal Parameters a,b Mean,0000000 Std. Deviation 1,67035216 Most Extreme Differences Absolute,182 Positive,182 Negative -,117
Sociology 593 Exam 1 February 14, 1997
 Sociology 9 Exam February, 997 I. True-False. ( points) Indicate whether the following statements are true or false. If false, briefly explain why.. There are IVs in a multiple regression model. If the
Multiple linear regression
 Multiple linear regression Course MF 930: Introduction to statistics June 0 Tron Anders Moger Department of biostatistics, IMB University of Oslo Aims for this lecture: Continue where we left off. Repeat
Topic 1. Definitions
 S Topic. Definitions. Scalar A scalar is a number. 2. Vector A vector is a column of numbers. 3. Linear combination A scalar times a vector plus a scalar times a vector, plus a scalar times a vector...
Parametric Test. Multiple Linear Regression Spatial Application I: State Homicide Rates Equations taken from Zar, 1984.
 Multiple Linear Regression Spatial Application I: State Homicide Rates Equations taken from Zar, 984. y ˆ = a + b x + b 2 x 2K + b n x n where n is the number of variables Example: In an earlier bivariate
EDF 7405 Advanced Quantitative Methods in Educational Research MULTR.SAS
 EDF 7405 Advanced Quantitative Methods in Educational Research MULTR.SAS The data used in this example describe teacher and student behavior in 8 classrooms. The variables are: Y percentage of interventions
LAMPIRAN. Lampiran 1. Contoh Laporan Auditor Dengan Opini Audit Going Concern
 68 LAMPIRAN Lampiran 1 Contoh Laporan Auditor Dengan Opini Audit Going Concern 69 Lampiran 2 Daftar Sampel Perusahaan NO KODE NAMA PERUSAHAAN 1 ADES PT Akasha Wira International Tbk 2 AKKU PT Alam Karya
IT 403 Practice Problems (2-2) Answers
 Answers") IT 403 Practice Problems (2-2) Answers #1. Which of the following is correct with respect to the correlation coefficient (r) and the slope of the leastsquares regression line (Choose one)? a. They will
IT 403 Practice Problems (2-2) Answers #1. Which of the following is correct with respect to the correlation coefficient (r) and the slope of the leastsquares regression line (Choose one)? a. They will
Example. Multiple Regression. Review of ANOVA & Simple Regression /749 Experimental Design for Behavioral and Social Sciences
 36-309/749 Experimental Design for Behavioral and Social Sciences Sep. 29, 2015 Lecture 5: Multiple Regression Review of ANOVA & Simple Regression Both Quantitative outcome Independent, Gaussian errors
Sociology 593 Exam 2 March 28, 2002
 Sociology 59 Exam March 8, 00 I. True-False. (0 points) Indicate whether the following statements are true or false. If false, briefly explain why.. A variable is called CATHOLIC. This probably means that
WORKSHOP 3 Measuring Association
 WORKSHOP 3 Measuring Association Concepts Analysing Categorical Data o Testing of Proportions o Contingency Tables & Tests o Odds Ratios Linear Association Measures o Correlation o Simple Linear Regression
ECONOMETRIC ANALYSIS OF THE COMPANY ON STOCK EXCHANGE
 ECONOMETRIC ANALYSIS OF THE COMPANY ON STOCK EXCHANGE Macovei Anamaria Geanina Ştefan cel Mare of University Suceava,Faculty of Economics and Public Administration street Universității, no. 3, city Suceava,
x3,..., Multiple Regression β q α, β 1, β 2, β 3,..., β q in the model can all be estimated by least square estimators
 Multiple Regression Relating a response (dependent, input) y to a set of explanatory (independent, output, predictor) variables x, x 2, x 3,, x q. A technique for modeling the relationship between variables.
McGill University. Faculty of Science MATH 204 PRINCIPLES OF STATISTICS II. Final Examination
 McGill University Faculty of Science MATH 204 PRINCIPLES OF STATISTICS II Final Examination Date: 20th April 2009 Time: 9am-2pm Examiner: Dr David A Stephens Associate Examiner: Dr Russell Steele Please
Correlations. Notes. Output Created Comments 04-OCT :34:52
 Correlations Output Created Comments Input Missing Value Handling Syntax Resources Notes Data Active Dataset Filter Weight Split File N of Rows in Working Data File Definition of Missing Cases Used Processor
Regresi Logistik II. (Peubah Bebas : Kategorik) Dr. Kusman Sadik, M.Si Program Studi Pascasarjana Departemen Statistika IPB, 2018/2019
 Dr. Kusman Sadik, M.Si Program Studi Pascasarjana Departemen Statistika IPB, 2018/2019") Regresi Logistik II (Peubah Bebas : Kategorik) Dr. Kusman Sadik, M.Si Program Studi Pascasarjana Departemen Statistika IPB, 2018/2019 In the case of logistic regression, the response variable is a binary
Regresi Logistik II (Peubah Bebas : Kategorik) Dr. Kusman Sadik, M.Si Program Studi Pascasarjana Departemen Statistika IPB, 2018/2019 In the case of logistic regression, the response variable is a binary
Multiple linear regression S6
 Basic medical statistics for clinical and experimental research Multiple linear regression S6 Katarzyna Jóźwiak k.jozwiak@nki.nl November 15, 2017 1/42 Introduction Two main motivations for doing multiple
Chapter Goals. To understand the methods for displaying and describing relationship among variables. Formulate Theories.
 Chapter Goals To understand the methods for displaying and describing relationship among variables. Formulate Theories Interpret Results/Make Decisions Collect Data Summarize Results Chapter 7: Is There
4:3 LEC - PLANNED COMPARISONS AND REGRESSION ANALYSES
 4:3 LEC - PLANNED COMPARISONS AND REGRESSION ANALYSES FOR SINGLE FACTOR BETWEEN-S DESIGNS Planned or A Priori Comparisons We previously showed various ways to test all possible pairwise comparisons for
Multiple Regression Analysis
 Multiple Regression Analysis Where as simple linear regression has 2 variables (1 dependent, 1 independent): y ˆ = a + bx Multiple linear regression has >2 variables (1 dependent, many independent): ˆ
Lampiran 1 Analisis ragam bobot realif bursa Fabricius, timus, dan limpa 20 hari p.i
 Lampiran 1 Analisis ragam bobot realif bursa Fabricius, timus, dan limpa 20 hari p.i ANOVA Rasio B Fab Rasio timus Rasio limpa Squares df Square F Sig. 5.180E-06 3 1.727E-06 4.504.039 3.067E-06 8 3.833E-07
ECON 497 Midterm Spring
 ECON 497 Midterm Spring 2009 1 ECON 497: Economic Research and Forecasting Name: Spring 2009 Bellas Midterm You have three hours and twenty minutes to complete this exam. Answer all questions and explain
In Class Review Exercises Vartanian: SW 540
 In Class Review Exercises Vartanian: SW 540 1. Given the following output from an OLS model looking at income, what is the slope and intercept for those who are black and those who are not black? b SE
Self-Assessment Weeks 8: Multiple Regression with Qualitative Predictors; Multiple Comparisons
 Self-Assessment Weeks 8: Multiple Regression with Qualitative Predictors; Multiple Comparisons 1. Suppose we wish to assess the impact of five treatments while blocking for study participant race (Black,
1.) Fit the full model, i.e., allow for separate regression lines (different slopes and intercepts) for each species
 Fit the full model, i.e., allow for separate regression lines (different slopes and intercepts) for each species") Lecture notes 2/22/2000 Dummy variables and extra SS F-test Page 1 Crab claw size and closing force. Problem 7.25, 10.9, and 10.10 Regression for all species at once, i.e., include dummy variables for
Lecture notes 2/22/2000 Dummy variables and extra SS F-test Page 1 Crab claw size and closing force. Problem 7.25, 10.9, and 10.10 Regression for all species at once, i.e., include dummy variables for
Sociology 593 Exam 2 Answer Key March 28, 2002
 Sociology 59 Exam Answer Key March 8, 00 I. True-False. (0 points) Indicate whether the following statements are true or false. If false, briefly explain why.. A variable is called CATHOLIC. This probably
Example: Forced Expiratory Volume (FEV) Program L13. Example: Forced Expiratory Volume (FEV) Example: Forced Expiratory Volume (FEV)
 Program L13. Example: Forced Expiratory Volume (FEV) Example: Forced Expiratory Volume (FEV)") Program L13 Relationships between two variables Correlation, cont d Regression Relationships between more than two variables Multiple linear regression Two numerical variables Linear or curved relationship?
Program L13 Relationships between two variables Correlation, cont d Regression Relationships between more than two variables Multiple linear regression Two numerical variables Linear or curved relationship?
FIN822 project 2 Project 2 contains part I and part II. (Due on November 10, 2008)
") FIN822 project 2 Project 2 contains part I and part II. (Due on November 10, 2008) Part I Logit Model in Bankruptcy Prediction You do not believe in Altman and you decide to estimate the bankruptcy prediction
FIN822 project 2 Project 2 contains part I and part II. (Due on November 10, 2008) Part I Logit Model in Bankruptcy Prediction You do not believe in Altman and you decide to estimate the bankruptcy prediction
Lampiran 1. Data Keuangan Perusahaan Yang Menjadi Sampel Penelitian
 Lampiran 1 Data Keuangan Perusahaan Yang Menjadi Sampel Penelitian Perusahaan Tahun DPR FCF ROE DER 2009 82.40 691404 40.16 18 2010 64.81 1701008 41.10 19 Astra Agro Lestari (AALI) 2011 65.14 1141111 39.55
VARIANCE ANALYSIS OF WOOL WOVEN FABRICS TENSILE STRENGTH USING ANCOVA MODEL
 ANNALS OF THE UNIVERSITY OF ORADEA FASCICLE OF TEXTILES, LEATHERWORK VARIANCE ANALYSIS OF WOOL WOVEN FABRICS TENSILE STRENGTH USING ANCOVA MODEL VÎLCU Adrian 1, HRISTIAN Liliana 2, BORDEIANU Demetra Lăcrămioara
SPSS Guide For MMI 409
 SPSS Guide For MMI 409 by John Wong March 2012 Preface Hopefully, this document can provide some guidance to MMI 409 students on how to use SPSS to solve many of the problems covered in the D Agostino
MATH ASSIGNMENT 2: SOLUTIONS
 MATH 204 - ASSIGNMENT 2: SOLUTIONS (a) Fitting the simple linear regression model to each of the variables in turn yields the following results: we look at t-tests for the individual coefficients, and
Overview. 1. Terms and Definitions. 2. Model Identification. 3. Path Coefficients
 2. The Basics Overview 1. Terms and Definitions 2. Model Identification 3. Path Coefficients 2.1 Terms and Definitions 2.1 Terms & Definitions. Structural equation model = observed, latent, composite Direct
Analysis of Covariance
 Analysis of Covariance Using categorical and continuous predictor variables Example An experiment is set up to look at the effects of watering on Oak Seedling establishment Three levels of watering: (no
EDF 7405 Advanced Quantitative Methods in Educational Research. Data are available on IQ of the child and seven potential predictors.
 EDF 7405 Advanced Quantitative Methods in Educational Research Data are available on IQ of the child and seven potential predictors. Four are medical variables available at the birth of the child: Birthweight
Difference in two or more average scores in different groups
 ANOVAs Analysis of Variance (ANOVA) Difference in two or more average scores in different groups Each participant tested once Same outcome tested in each group Simplest is one-way ANOVA (one variable as
ST430 Exam 2 Solutions
 ST430 Exam 2 Solutions Date: November 9, 2015 Name: Guideline: You may use one-page (front and back of a standard A4 paper) of notes. No laptop or textbook are permitted but you may use a calculator. Giving
Daftar Pustaka. Baker, R.W., (2004), Membrane Technology and Application, 4 th edition, John Willey&Sons, Ltd, California, 1-125
, Membrane Technology and Application, 4 th edition, John Willey&Sons, Ltd, California, 1-125") Daftar Pustaka Baker, R.W., (2004), Membrane Technology and Application, 4 th edition, John Willey&Sons, Ltd, California, 1-125 Bausa, J., Marquard, W., (2000), Shortcut Design Methods for Hybrid Membrane/Distillation
Daftar Pustaka Baker, R.W., (2004), Membrane Technology and Application, 4 th edition, John Willey&Sons, Ltd, California, 1-125 Bausa, J., Marquard, W., (2000), Shortcut Design Methods for Hybrid Membrane/Distillation
Pelatihan Statistika. Jonathan Sarwono
 Pelatihan Statistika Jonathan Sarwono Model - Model Penelitian dalam Riset Lanjutan 1. Model Dasar Hubungan Antar Variabel 2. Model Dasa dalam Analisis Jalur 3. Model dalam Structural Equiation Modeling
Sociology 593 Exam 1 February 17, 1995
 Sociology 593 Exam 1 February 17, 1995 I. True-False. (25 points) Indicate whether the following statements are true or false. If false, briefly explain why. 1. A researcher regressed Y on. When he plotted
LAMPIRAN 3 KUESIONER PENELITIAN
 LAMPIRAN 3 KUESIONER PENELITIAN HUBUNGAN KADAR KADMIUM (Cd) PADA AIR SUMUR DENGAN TEKANAN DARAH MASYARAKAT DI DESA NAMO BINTANG KABUPATEN DELI SERDANG TAHUN 2016 A. KARAKTERISTIK RESPONDEN Nomor Urut :
Interactions, Dummies, and Outliers
 Interactions, Dummies, and Outliers Modeling Interactive Relationships in Regression Income=b 1 (sex)+b 2 (education)+c Income=b 1 (sex)+b 2 (education)+b 3 (sex x education)+c In both cases, b 1 gives
Example: 1982 State SAT Scores (First year state by state data available)
") Lecture 11 Review Section 3.5 from last Monday (on board) Overview of today s example (on board) Section 3.6, Continued: Nested F tests, review on board first Section 3.4: Interaction for quantitative
Lecture 11 Review Section 3.5 from last Monday (on board) Overview of today s example (on board) Section 3.6, Continued: Nested F tests, review on board first Section 3.4: Interaction for quantitative
DAFTAR PUSTAKA. 1. Acharya AB, Sivapathasundharam B. Forensic Odontology. In: Rajendran R,
 DAFTAR PUSTAKA 1. Acharya AB, Sivapathasundharam B. Forensic Odontology. In: Rajendran R, Sivapathasundharam B. Eds. Shafer s Textbook of Oral Pathology 5 th. New Delhi: Elsevier2006;1199-1227. 2. Caldas
LAMPIRAN SPSS STATISTIK DESKRIPTIF
 LAMPIRAN SPSS STATISTIK DESKRIPTIF Descriptive Statistics N Minimum Maximum Mean Std. Deviation CSRI 351,11538,32051,2091460,05046756 CR 351,01013 6,98537 1,7706300 1,16569827 Valid N (listwise) 351 Descriptive
The 1905 Einstein equation in a general mathematical analysis model of Quasars
 DePaul University From the SelectedWorks of Byron E. Bell Spring May 3, 2010 The 1905 Einstein equation in a general mathematical analysis model of Quasars Byron E. Bell Available at: https://works.bepress.com/byron_bell/2/
Correlation, linear regression
 Correlation, linear regression 1 Scatterplot Relationship between two continouous variables Student Hours studied Grade Jane 8 70 Joe 10 80 Sue 12 75 Pat 19 90 Bob 20 85 Tom 25 95 2 Scatterplot Relationship
MORE ON SIMPLE REGRESSION: OVERVIEW
 FI=NOT0106 NOTICE. Unless otherwise indicated, all materials on this page and linked pages at the blue.temple.edu address and at the astro.temple.edu address are the sole property of Ralph B. Taylor and
Comparing Nested Models
 Comparing Nested Models ST 370 Two regression models are called nested if one contains all the predictors of the other, and some additional predictors. For example, the first-order model in two independent
Multiple Regression. Peerapat Wongchaiwat, Ph.D.
 Peerapat Wongchaiwat, Ph.D. wongchaiwat@hotmail.com The Multiple Regression Model Examine the linear relationship between 1 dependent (Y) & 2 or more independent variables (X i ) Multiple Regression Model
1 Correlation and Inference from Regression
 1 Correlation and Inference from Regression Reading: Kennedy (1998) A Guide to Econometrics, Chapters 4 and 6 Maddala, G.S. (1992) Introduction to Econometrics p. 170-177 Moore and McCabe, chapter 12 is