Correlation, linear regression
|
|
|
- Brittany McDowell
- 6 years ago
- Views:
Transcription

1 Correlation, linear regression 1
2 Scatterplot Relationship between two continouous variables Student Hours studied Grade Jane 8 70 Joe Sue Pat Bob Tom
3 Scatterplot Relationship between two continouous variables Student Hours studied Grade Jane 8 70 Joe Sue Pat Bob Tom
4 Scatterplot Other examples 4
5 Example II. Imagine that 6 students are given a battery of tests by a vocational guidance counsellor with the results shown in the following table: Variables measured on the same individuals are often related to each other. 5

6 Let us draw a graph called scattergram to investigate relationships. Scatterplots show the relationship between two quantitative variables measured on the same cases. In a scatterplot, we look for the direction, form, and strength of the relationship between the variables. The simplest relationship is linear in form and reasonably strong. Scatterplots also reveal deviations from the overall pattern. 6
7 Creating a scatterplot When one variable in a scatterplot explains or predicts the other, place it on the x-axis. Place the variable that responds to the predictor on the y-axis. If neither variable explains or responds to the other, it does not matter which axes you assign them to. 7
8 Possible relationships language retailing math score math score positive correlation theater math score negative correlation no correlation 8
9 r Describing linear relationship with number: the coefficient of correlation (r). Also called Pearson coefficient of correlation Correlation is a numerical measure of the strength of a linear association. The formula for coefficient of correlation treats x and y identically. There is no distinction between explanatory and response variable. Let us denote the two samples by x 1,x 2, x n and y 1,y 2, y n, the coefficient of correlation can be computed according to the following formula = n n x y x y i i i i= 1 i= 1 i= 1 n n n n 2 2 n xi xi n yi yi 2 ( ) ( ) i= 1 i= 1 i= 1 i= 1 n n i 2 = n n i= 1 ( x x)( y y) i 2 ( x x) ( y y) n i i= 1 i= 1 i i 2 9

10 Karl Pearson (27 March April 1936) established the discipline of mathematical statistics. /wiki/karl_pearson Karl Pearson 10
11 Properties of r Correlations are between -1 and +1; the value 100 of r is always 90 between -1 and 1, either extreme indicates a perfect 80 linear 70 association r a) If r is near +1 or -1 we say that we have high 30 20correlation. b) If r=1, we say that there is perfect positive correlation. If r= -1, then we say that there is a perfect negative correlation. c) A correlation of zero indicates the absence of linear association. When there is no tendency for the points to lie in a straight line, we say that there is no correlation (r=0) or we have low correlation (r is near 0 ). theater math score language retailing math score math score 11
12 Calculated values of r language retailing math score math score positive correlation, r= negative correlation, r= theater math score no correlation, r=
13 Scatterplot Other examples r=0.018 r=
14 Correlation and causation a correlation between two variables does not show that one causes the other. 14


15 Correlation by eye This applet lets you estimate the regression line and to guess the value of Pearson's correlation. Five possible values of Pearson's correlation are listed. One of them is the correlation for the data displayed in the scatterplot. Guess which one it is. To see the correct value, click on the "Show r" button. 15
16 Effect of outliers Even a single outlier can change the correlation substantially. Outliers can create an apparently strong correlation where none would be found otherwise, or hide a strong correlation by making it appear to be weak. theater language r=-0.21 math score math score r=0.998 theater language r=0.74 math score math score r=
17 Correlation and linearity Two variables may be closely related and still have a small correlation if the form of the relationship is not linear. y r=2.8 E-15 (= ) y r=
18 Correlation and linearity Four sets of data with the same correlation of
19 Coefficient of determination The square of the correlation coefficient multiplied by 100 is called the coefficient of determination. It shows the percentages of the total variation explained by the linear regression. Example. The correlation between math aptitude and language aptitude was found r =0,9989. The coefficient of determination, r 2 = So 91.7% of the total variation of Y is caused by its linear relationship with X. 19
20 When is a correlation high? What is considered to be high correlation varies with the field of application. The statistician must decide when a sample value of r is far enough from zero, that is, when it is sufficiently far from zero to reflect the correlation in the population. 20
21 Testing the significance of the coefficient of correlation The statistician must decide when a sample value of r is far enough from zero to be significant, that is, when it is sufficiently far from zero to reflect the correlation in the population. (details: lecture 8.) 21
22 Prediction based on linear correlation: the linear regression When the form of the relationship in a scatterplot is linear, we usually want to describe that linear form more precisely with numbers. We can rarely hope to find data values lined up perfectly, so we fit lines to scatterplots with a method that compromises among the data values. This method is called the method of least squares. The key to finding, understanding, and using least squares lines is an understanding of their failures to fit the data; the residuals. 22
23 Residuals, example Scatterplot (corr 5v*6c) LANGUAGE = *x LANGUAGE MATH:LANGUAGE: r = ; p = MATH 23
24 Residuals, example Scatterplot (corr 5v*6c) RETAIL = *x RETAIL MATH:RETAIL: r = ; p = MATH 24
25 100 Residuals, example 3. Scatterplot (corr 5v*6c) THEATER = *x THEATER MATH:THEATER: r = ; p = MATH 25
26 Prediction based on linear correlation: the linear regression A straight line that best fits the data: y=bx + a or y= a + bx is called regression line Geometrical meaning of a and b. b: is called regression coefficient, slope of the best-fitting line or regression line; a: y-intercept of the regression line. The principle of finding the values a and b, given x 1,x 2, x n and y 1,y 2, y n. Minimising the sum of squared residuals, i.e. Σ( y i -(a+bx i ) ) 2 min 26
27 100 Residuals, example 3. Scatterplot (corr 5v*6c) THEATER = *x (x 1,y 1 ) 90 b*x 1 +a THEATER y 1 -(b*x 1 +a) y 2 -(b*x 2 +a) y 6 -(b*x 6 +a)
28 The general equation of a line is y = a + b x. We would like to find the values of a and b in such a way that the resulting line be the best fitting line. Let's suppose we have n pairs of (x i, y i ) measurements. We would like to approximate y i by values of a line. If x i is the independent variable, the value of the line is a + b x i. We will approximate y i by the value of the line at x i, that is, by a + b x i. The approximation is good if the differences yi ( a+ b xi) are small. These differences can be positive or negative, so let's take its square and summarize: n 2 ( yi ( a+ b xi)) = S( a, b) i= 1 This is a function of the unknown parameters a and b, called also the sum of squared residuals. To determine a and b: we have to find the minimum of S(a,b). In order to find the minimum, we have to find the derivatives of S, and solve the equations S a S = 0, = 0 b The solution of the equation-system gives the formulas for b and a: n n xiyi xi yi i= 1 i= 1 i= 1 b = n n 2 2 n x ( x ) n i i= 1 i= 1 n i = n i= 1 ( x x)( y y) n i i= 1 ( x x) i i 2 and a = y b x It can be shown, using the 2nd derivatives, that these are really minimum places. 28
29 Equation of regression line for the data of Example 1. y=1.016 x+15.5 the slope of the line is Prediction based on the 520 equation: what is the predicted score for language for a student 460 having 400 points in math? y predicted = =421.9 LANGUAGE 560 Scatterplot (corr 5v*6c) LANGUAGE = *x MATH:LANGUAGE: r = ; p = MATH 29
30 Computation of the correlation coefficient from the regression coefficient. There is a relationship between the correlation and the regression coefficient: r = b s sx where s x, s y are the standard deviations of the samples. From this relationship it can be seen that the sign of r and b is the same: if there exist a negative correlation between variables, the slope of the regression line is also negative. y 30
 Unstandardized Standardized Coefficients Coefficients B Std. Error Beta t Sig..078.372.018.211.833 66.040 7.834 8.430.")
31 SPSS output for the relationship between age and body mass Model Summary R R Square Adjusted R Square Std. Error of the Estimate The independent variable is Age Age in years. Coefficient of correlation, r=0.018 Coefficients Age Age in years (Constant) Unstandardized Standardized Coefficients Coefficients B Std. Error Beta t Sig Equation of the regression line: y=0.078x
. Coefficient of correlation, r=0.873 Coefficients Mass Body mass (kg) (Constant) Unstandardized Standardized Coefficients Coefficients B Std.")
32 SPSS output for the relationship between body mass at present and 3 years ago Model Summary R R Square Adjusted R Square Std. Error of the Estimate The independent variable is Mass Body mass (kg). Coefficient of correlation, r=0.873 Coefficients Mass Body mass (kg) (Constant) Unstandardized Standardized Coefficients Coefficients B Std. Error Beta t Sig Equation of the regression line: y=0.795x
33 Regression using transformations Sometimes, useful models are not linear in parameters. Examining the scatterplot of the data shows a functional, but not linear relationship between data. 33
 and y (number of Steakhouses) (first plot) Taking the logarithm of y, we")
34 Example A fast food chain opened in Each year from 1974 to 1988 the number of steakhouses in operation is recorded. The scatterplot of the original data suggests an exponential relationship between x (year) and y (number of Steakhouses) (first plot) Taking the logarithm of y, we get linear relationship (plot at the bottom) 34
35 Performing the linear regression procedure to x and log (y) we get the equation log y = x that is y = e x =e e x = 1.293e x is the equation of the best fitting curve to the original data. 35

36 y = 1.293e x log y = x 36
37 Types of transformations Some non-linear models can be transformed into a linear model by taking the logarithms on either or both sides. Either 10 base logarithm (denoted log) or natural (base e) logarithm (denoted ln) can be used. If a>0 and b>0, applying a logarithmic transformation to the model 37
38 Exponential relationship ->take log y x y lg y Model: y=a*10 bx Take the logarithm of both sides: lg y =lga+bx so lg y is linear in x log y y x x 38
39 Logarithm relationship ->take log x 5 4 x y log x y x Model: y=a+lgx 5 4 so y is linear in lg x y log10 x 39
40 Power relationship ->take log x and log y x y log x log y y x Model: y=ax b Take the logarithm of both sides: lg y =lga+b lgx so lgy is linear in lg x log y log x 40
41 Log10 base logarithmic scale log10 x

42 Logarithmic papers Semilogarithmic paper log-log paper 42
43 Reciprocal relationship ->take reciprocal of x x y 1/x Model: y=a +b/x y=a +b*1/x so y is linear in 1/x y y x /x 43

44 Example from the literature 44
45 45
46 Example 2. EL HADJ OTHMANE TAHA és mtsai: Osteoprotegerin: a regulátor, a protektor és a marker. Orvosi Hetilap évfolyam, 42. szám
47 Useful WEB pages =related ear/logarithmiccurve.htm 47


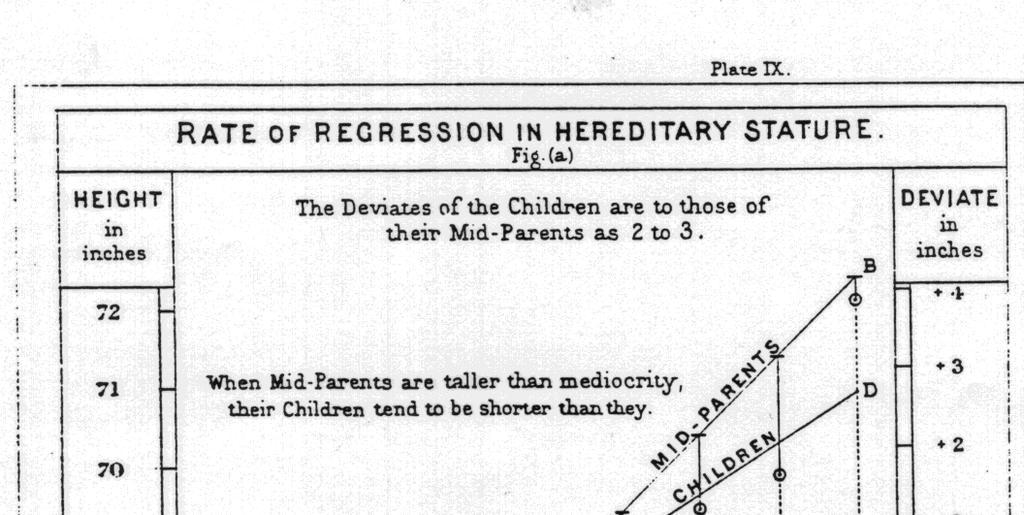
48 The origin of the word regression. Galton: Regression towards mediocrity in hereditary stature. Journal of the Anthropological Institute 1886 Vol.15,
49 49
Review of Multiple Regression
 Ronald H. Heck 1 Let s begin with a little review of multiple regression this week. Linear models [e.g., correlation, t-tests, analysis of variance (ANOVA), multiple regression, path analysis, multivariate
Multiple Regression. More Hypothesis Testing. More Hypothesis Testing The big question: What we really want to know: What we actually know: We know:
 Multiple Regression Ψ320 Ainsworth More Hypothesis Testing What we really want to know: Is the relationship in the population we have selected between X & Y strong enough that we can use the relationship
Simple Linear Regression
 Simple Linear Regression 1 Correlation indicates the magnitude and direction of the linear relationship between two variables. Linear Regression: variable Y (criterion) is predicted by variable X (predictor)
THE PEARSON CORRELATION COEFFICIENT
 CORRELATION Two variables are said to have a relation if knowing the value of one variable gives you information about the likely value of the second variable this is known as a bivariate relation There
IT 403 Practice Problems (2-2) Answers
 Answers") IT 403 Practice Problems (2-2) Answers #1. Which of the following is correct with respect to the correlation coefficient (r) and the slope of the leastsquares regression line (Choose one)? a. They will
IT 403 Practice Problems (2-2) Answers #1. Which of the following is correct with respect to the correlation coefficient (r) and the slope of the leastsquares regression line (Choose one)? a. They will
Correlation and simple linear regression S5
 Basic medical statistics for clinical and eperimental research Correlation and simple linear regression S5 Katarzyna Jóźwiak k.jozwiak@nki.nl November 15, 2017 1/41 Introduction Eample: Brain size and
AP Statistics Bivariate Data Analysis Test Review. Multiple-Choice
 Name Period AP Statistics Bivariate Data Analysis Test Review Multiple-Choice 1. The correlation coefficient measures: (a) Whether there is a relationship between two variables (b) The strength of the
Chapter Goals. To understand the methods for displaying and describing relationship among variables. Formulate Theories.
 Chapter Goals To understand the methods for displaying and describing relationship among variables. Formulate Theories Interpret Results/Make Decisions Collect Data Summarize Results Chapter 7: Is There
Unit 6 - Simple linear regression
 Sta 101: Data Analysis and Statistical Inference Dr. Çetinkaya-Rundel Unit 6 - Simple linear regression LO 1. Define the explanatory variable as the independent variable (predictor), and the response variable
1 Correlation and Inference from Regression
 1 Correlation and Inference from Regression Reading: Kennedy (1998) A Guide to Econometrics, Chapters 4 and 6 Maddala, G.S. (1992) Introduction to Econometrics p. 170-177 Moore and McCabe, chapter 12 is
Chapter 6: Exploring Data: Relationships Lesson Plan
 Chapter 6: Exploring Data: Relationships Lesson Plan For All Practical Purposes Displaying Relationships: Scatterplots Mathematical Literacy in Today s World, 9th ed. Making Predictions: Regression Line
Chapter 3: Examining Relationships
 Chapter 3: Examining Relationships Most statistical studies involve more than one variable. Often in the AP Statistics exam, you will be asked to compare two data sets by using side by side boxplots or
Chapter 5 Friday, May 21st
 Chapter 5 Friday, May 21 st Overview In this Chapter we will see three different methods we can use to describe a relationship between two quantitative variables. These methods are: Scatterplot Correlation
Chapter 7. Scatterplots, Association, and Correlation
 Chapter 7 Scatterplots, Association, and Correlation Bin Zou (bzou@ualberta.ca) STAT 141 University of Alberta Winter 2015 1 / 29 Objective In this chapter, we study relationships! Instead, we investigate
Chapter 12 Summarizing Bivariate Data Linear Regression and Correlation
 Chapter 1 Summarizing Bivariate Data Linear Regression and Correlation This chapter introduces an important method for making inferences about a linear correlation (or relationship) between two variables,
AMS 7 Correlation and Regression Lecture 8
 AMS 7 Correlation and Regression Lecture 8 Department of Applied Mathematics and Statistics, University of California, Santa Cruz Suumer 2014 1 / 18 Correlation pairs of continuous observations. Correlation
Any of 27 linear and nonlinear models may be fit. The output parallels that of the Simple Regression procedure.
 STATGRAPHICS Rev. 9/13/213 Calibration Models Summary... 1 Data Input... 3 Analysis Summary... 5 Analysis Options... 7 Plot of Fitted Model... 9 Predicted Values... 1 Confidence Intervals... 11 Observed
Business Statistics. Lecture 10: Correlation and Linear Regression
 Business Statistics Lecture 10: Correlation and Linear Regression Scatterplot A scatterplot shows the relationship between two quantitative variables measured on the same individuals. It displays the Form
The following formulas related to this topic are provided on the formula sheet:
 Student Notes Prep Session Topic: Exploring Content The AP Statistics topic outline contains a long list of items in the category titled Exploring Data. Section D topics will be reviewed in this session.
Unit 6 - Introduction to linear regression
 Unit 6 - Introduction to linear regression Suggested reading: OpenIntro Statistics, Chapter 7 Suggested exercises: Part 1 - Relationship between two numerical variables: 7.7, 7.9, 7.11, 7.13, 7.15, 7.25,
Chapter 3: Examining Relationships
 Chapter 3: Examining Relationships 3.1 Scatterplots 3.2 Correlation 3.3 Least-Squares Regression Fabric Tenacity, lb/oz/yd^2 26 25 24 23 22 21 20 19 18 y = 3.9951x + 4.5711 R 2 = 0.9454 3.5 4.0 4.5 5.0
Scatterplots. 3.1: Scatterplots & Correlation. Scatterplots. Explanatory & Response Variables. Section 3.1 Scatterplots and Correlation
 3.1: Scatterplots & Correlation Scatterplots A scatterplot shows the relationship between two quantitative variables measured on the same individuals. The values of one variable appear on the horizontal
Ordinary Least Squares Regression Explained: Vartanian
 Ordinary Least Squares Regression Eplained: Vartanian When to Use Ordinary Least Squares Regression Analysis A. Variable types. When you have an interval/ratio scale dependent variable.. When your independent
Chapter 9 - Correlation and Regression
 Chapter 9 - Correlation and Regression 9. Scatter diagram of percentage of LBW infants (Y) and high-risk fertility rate (X ) in Vermont Health Planning Districts. 9.3 Correlation between percentage of
AP Statistics Unit 2 (Chapters 7-10) Warm-Ups: Part 1
 Warm-Ups: Part 1") AP Statistics Unit 2 (Chapters 7-10) Warm-Ups: Part 1 2. A researcher is interested in determining if one could predict the score on a statistics exam from the amount of time spent studying for the exam.
AP Statistics Unit 2 (Chapters 7-10) Warm-Ups: Part 1 2. A researcher is interested in determining if one could predict the score on a statistics exam from the amount of time spent studying for the exam.
AP Statistics. Chapter 6 Scatterplots, Association, and Correlation
 AP Statistics Chapter 6 Scatterplots, Association, and Correlation Objectives: Scatterplots Association Outliers Response Variable Explanatory Variable Correlation Correlation Coefficient Lurking Variables
Can you tell the relationship between students SAT scores and their college grades?
 Correlation One Challenge Can you tell the relationship between students SAT scores and their college grades? A: The higher SAT scores are, the better GPA may be. B: The higher SAT scores are, the lower
Statistical View of Least Squares
 Basic Ideas Some Examples Least Squares May 22, 2007 Basic Ideas Simple Linear Regression Basic Ideas Some Examples Least Squares Suppose we have two variables x and y Basic Ideas Simple Linear Regression
Area1 Scaled Score (NAPLEX) .535 ** **.000 N. Sig. (2-tailed)
 .535 ** **.000 N. Sig. (2-tailed)") Institutional Assessment Report Texas Southern University College of Pharmacy and Health Sciences "An Analysis of 2013 NAPLEX, P4-Comp. Exams and P3 courses The following analysis illustrates relationships
Institutional Assessment Report Texas Southern University College of Pharmacy and Health Sciences "An Analysis of 2013 NAPLEX, P4-Comp. Exams and P3 courses The following analysis illustrates relationships
Slide 7.1. Theme 7. Correlation
 Slide 7.1 Theme 7 Correlation Slide 7.2 Overview Researchers are often interested in exploring whether or not two variables are associated This lecture will consider Scatter plots Pearson correlation coefficient
Lecture Slides. Elementary Statistics Tenth Edition. by Mario F. Triola. and the Triola Statistics Series. Slide 1
 Lecture Slides Elementary Statistics Tenth Edition and the Triola Statistics Series by Mario F. Triola Slide 1 Chapter 10 Correlation and Regression 10-1 Overview 10-2 Correlation 10-3 Regression 10-4
Correlation and Regression Theory 1) Multivariate Statistics
 Multivariate Statistics") Correlation and Regression Theory 1) Multivariate Statistics What is a multivariate data set? How to statistically analyze this data set? Is there any kind of relationship between different variables in
Correlation and Regression Theory 1) Multivariate Statistics What is a multivariate data set? How to statistically analyze this data set? Is there any kind of relationship between different variables in
Intro to Linear Regression
 Intro to Linear Regression Introduction to Regression Regression is a statistical procedure for modeling the relationship among variables to predict the value of a dependent variable from one or more predictor
Example: Forced Expiratory Volume (FEV) Program L13. Example: Forced Expiratory Volume (FEV) Example: Forced Expiratory Volume (FEV)
 Program L13. Example: Forced Expiratory Volume (FEV) Example: Forced Expiratory Volume (FEV)") Program L13 Relationships between two variables Correlation, cont d Regression Relationships between more than two variables Multiple linear regression Two numerical variables Linear or curved relationship?
Program L13 Relationships between two variables Correlation, cont d Regression Relationships between more than two variables Multiple linear regression Two numerical variables Linear or curved relationship?
1. Use Scenario 3-1. In this study, the response variable is
 Chapter 8 Bell Work Scenario 3-1 The height (in feet) and volume (in cubic feet) of usable lumber of 32 cherry trees are measured by a researcher. The goal is to determine if volume of usable lumber can
Describing Bivariate Relationships
 Describing Bivariate Relationships Bivariate Relationships What is Bivariate data? When exploring/describing a bivariate (x,y) relationship: Determine the Explanatory and Response variables Plot the data
CHAPTER 4 DESCRIPTIVE MEASURES IN REGRESSION AND CORRELATION
 STP 226 ELEMENTARY STATISTICS CHAPTER 4 DESCRIPTIVE MEASURES IN REGRESSION AND CORRELATION Linear Regression and correlation allows us to examine the relationship between two or more quantitative variables.
Wed, June 26, (Lecture 8-2). Nonlinearity. Significance test for correlation R-squared, SSE, and SST. Correlation in SPSS.
. Nonlinearity. Significance test for correlation R-squared, SSE, and SST. Correlation in SPSS.") Wed, June 26, (Lecture 8-2). Nonlinearity. Significance test for correlation R-squared, SSE, and SST. Correlation in SPSS. Last time, we looked at scatterplots, which show the interaction between two variables,
Wed, June 26, (Lecture 8-2). Nonlinearity. Significance test for correlation R-squared, SSE, and SST. Correlation in SPSS. Last time, we looked at scatterplots, which show the interaction between two variables,
August 2018 ALGEBRA 1
 August 0 ALGEBRA 3 0 3 Access to Algebra course :00 Algebra Orientation Course Introduction and Reading Checkpoint 0.0 Expressions.03 Variables.0 3.0 Translate Words into Variable Expressions DAY.0 Translate
Introduction and Single Predictor Regression. Correlation
 Introduction and Single Predictor Regression Dr. J. Kyle Roberts Southern Methodist University Simmons School of Education and Human Development Department of Teaching and Learning Correlation A correlation
REVIEW 8/2/2017 陈芳华东师大英语系
 REVIEW Hypothesis testing starts with a null hypothesis and a null distribution. We compare what we have to the null distribution, if the result is too extreme to belong to the null distribution (p
ECON 497 Midterm Spring
 ECON 497 Midterm Spring 2009 1 ECON 497: Economic Research and Forecasting Name: Spring 2009 Bellas Midterm You have three hours and twenty minutes to complete this exam. Answer all questions and explain
5.1 Bivariate Relationships
 Chapter 5 Summarizing Bivariate Data Source: TPS 5.1 Bivariate Relationships What is Bivariate data? When exploring/describing a bivariate (x,y) relationship: Determine the Explanatory and Response variables
CHAPTER 3 Describing Relationships
 CHAPTER 3 Describing Relationships 3.1 Scatterplots and Correlation The Practice of Statistics, 5th Edition Starnes, Tabor, Yates, Moore Bedford Freeman Worth Publishers Scatterplots and Correlation Learning
Statistiek II. John Nerbonne. March 17, Dept of Information Science incl. important reworkings by Harmut Fitz
 Dept of Information Science j.nerbonne@rug.nl incl. important reworkings by Harmut Fitz March 17, 2015 Review: regression compares result on two distinct tests, e.g., geographic and phonetic distance of
AP Statistics L I N E A R R E G R E S S I O N C H A P 7
 AP Statistics 1 L I N E A R R E G R E S S I O N C H A P 7 The object [of statistics] is to discover methods of condensing information concerning large groups of allied facts into brief and compendious
Correlation. A statistics method to measure the relationship between two variables. Three characteristics
 Correlation Correlation A statistics method to measure the relationship between two variables Three characteristics Direction of the relationship Form of the relationship Strength/Consistency Direction
3.2: Least Squares Regressions
 3.2: Least Squares Regressions Section 3.2 Least-Squares Regression After this section, you should be able to INTERPRET a regression line CALCULATE the equation of the least-squares regression line CALCULATE
9. Linear Regression and Correlation
 9. Linear Regression and Correlation Data: y a quantitative response variable x a quantitative explanatory variable (Chap. 8: Recall that both variables were categorical) For example, y = annual income,
HUDM4122 Probability and Statistical Inference. February 2, 2015
 HUDM4122 Probability and Statistical Inference February 2, 2015 Special Session on SPSS Thursday, April 23 4pm-6pm As of when I closed the poll, every student except one could make it to this I am happy
Lecture 3. The Population Variance. The population variance, denoted σ 2, is the sum. of the squared deviations about the population
 Lecture 5 1 Lecture 3 The Population Variance The population variance, denoted σ 2, is the sum of the squared deviations about the population mean divided by the number of observations in the population,
Fault Tolerant Computing CS 530DL
 Fault Tolerant Computing CS 530DL Additional Lecture Notes Modeling Yashwant K. Malaiya Colorado State University March 8, 2017 1 Quantitative models Derived from first principles: Arguments are actual
Statistical View of Least Squares
 May 23, 2006 Purpose of Regression Some Examples Least Squares Purpose of Regression Purpose of Regression Some Examples Least Squares Suppose we have two variables x and y Purpose of Regression Some Examples
Algebra 1. Correlated to the Texas Essential Knowledge and Skills. TEKS Units Lessons
 Algebra 1 Correlated to the Texas Essential Knowledge and Skills TEKS Units Lessons A1.1 Mathematical Process Standards The student uses mathematical processes to acquire and demonstrate mathematical understanding.
Calculus first semester exam information and practice problems
 Calculus first semester exam information and practice problems As I ve been promising for the past year, the first semester exam in this course encompasses all three semesters of Math SL thus far. It is
Chapter 12 - Part I: Correlation Analysis
 ST coursework due Friday, April - Chapter - Part I: Correlation Analysis Textbook Assignment Page - # Page - #, Page - # Lab Assignment # (available on ST webpage) GOALS When you have completed this lecture,
EDF 7405 Advanced Quantitative Methods in Educational Research MULTR.SAS
 EDF 7405 Advanced Quantitative Methods in Educational Research MULTR.SAS The data used in this example describe teacher and student behavior in 8 classrooms. The variables are: Y percentage of interventions
Scatterplots and Correlation
 Chapter 4 Scatterplots and Correlation 2/15/2019 Chapter 4 1 Explanatory Variable and Response Variable Correlation describes linear relationships between quantitative variables X is the quantitative explanatory
Advanced Quantitative Data Analysis
 Chapter 24 Advanced Quantitative Data Analysis Daniel Muijs Doing Regression Analysis in SPSS When we want to do regression analysis in SPSS, we have to go through the following steps: 1 As usual, we choose
6.1.1 How can I make predictions?
 CCA Ch 6: Modeling Two-Variable Data Name: Team: 6.1.1 How can I make predictions? Line of Best Fit 6-1. a. Length of tube: Diameter of tube: Distance from the wall (in) Width of field of view (in) b.
Bivariate Regression Analysis. The most useful means of discerning causality and significance of variables
 Bivariate Regression Analysis The most useful means of discerning causality and significance of variables Purpose of Regression Analysis Test causal hypotheses Make predictions from samples of data Derive
MATH 1070 Introductory Statistics Lecture notes Relationships: Correlation and Simple Regression
 MATH 1070 Introductory Statistics Lecture notes Relationships: Correlation and Simple Regression Objectives: 1. Learn the concepts of independent and dependent variables 2. Learn the concept of a scatterplot
Regression and Nonlinear Axes
 Introduction to Chemical Engineering Calculations Lecture 2. What is regression analysis? A technique for modeling and analyzing the relationship between 2 or more variables. Usually, 1 variable is designated
1: Translating Expressions
 Algebra I 2017-2018 1: Translating Expressions Translate between words and math symbols, such as: The sum of twice a number and 3 Answer: 2n + 3 Also translate math symbols into verbal language. 5(x +
Multiple linear regression S6
 Basic medical statistics for clinical and experimental research Multiple linear regression S6 Katarzyna Jóźwiak k.jozwiak@nki.nl November 15, 2017 1/42 Introduction Two main motivations for doing multiple
Practical Biostatistics
 Practical Biostatistics Clinical Epidemiology, Biostatistics and Bioinformatics AMC Multivariable regression Day 5 Recap Describing association: Correlation Parametric technique: Pearson (PMCC) Non-parametric:
Prerequisite: Qualification by assessment process or completion of Mathematics 1050 or one year of high school algebra with a grade of "C" or higher.
 Reviewed by: D. Jones Reviewed by: B. Jean Reviewed by: M. Martinez Text update: Spring 2017 Date reviewed: February 2014 C&GE Approved: March 10, 2014 Board Approved: April 9, 2014 Mathematics (MATH)
appstats8.notebook October 11, 2016
 Chapter 8 Linear Regression Objective: Students will construct and analyze a linear model for a given set of data. Fat Versus Protein: An Example pg 168 The following is a scatterplot of total fat versus
STAT 3900/4950 MIDTERM TWO Name: Spring, 2015 (print: first last ) Covered topics: Two-way ANOVA, ANCOVA, SLR, MLR and correlation analysis
 Covered topics: Two-way ANOVA, ANCOVA, SLR, MLR and correlation analysis") STAT 3900/4950 MIDTERM TWO Name: Spring, 205 (print: first last ) Covered topics: Two-way ANOVA, ANCOVA, SLR, MLR and correlation analysis Instructions: You may use your books, notes, and SPSS/SAS. NO
STAT 3900/4950 MIDTERM TWO Name: Spring, 205 (print: first last ) Covered topics: Two-way ANOVA, ANCOVA, SLR, MLR and correlation analysis Instructions: You may use your books, notes, and SPSS/SAS. NO
Scatterplots and Correlation
 Bivariate Data Page 1 Scatterplots and Correlation Essential Question: What is the correlation coefficient and what does it tell you? Most statistical studies examine data on more than one variable. Fortunately,
Parametric Test. Multiple Linear Regression Spatial Application I: State Homicide Rates Equations taken from Zar, 1984.
 Multiple Linear Regression Spatial Application I: State Homicide Rates Equations taken from Zar, 984. y ˆ = a + b x + b 2 x 2K + b n x n where n is the number of variables Example: In an earlier bivariate
Chapter 6. September 17, Please pick up a calculator and take out paper and something to write with. Association and Correlation.
 Please pick up a calculator and take out paper and something to write with. Sep 17 8:08 AM Chapter 6 Scatterplots, Association and Correlation Copyright 2015, 2010, 2007 Pearson Education, Inc. Chapter
Lecture 18: Simple Linear Regression
 Lecture 18: Simple Linear Regression BIOS 553 Department of Biostatistics University of Michigan Fall 2004 The Correlation Coefficient: r The correlation coefficient (r) is a number that measures the strength
Chapter 10 Correlation and Regression
 Chapter 10 Correlation and Regression 10-1 Review and Preview 10-2 Correlation 10-3 Regression 10-4 Variation and Prediction Intervals 10-5 Multiple Regression 10-6 Modeling Copyright 2010, 2007, 2004
Regression Modelling. Dr. Michael Schulzer. Centre for Clinical Epidemiology and Evaluation
 Regression Modelling Dr. Michael Schulzer Centre for Clinical Epidemiology and Evaluation REGRESSION Origins: a historical note. Sir Francis Galton: Natural inheritance (1889) Macmillan, London. Regression
Regression analysis is a tool for building mathematical and statistical models that characterize relationships between variables Finds a linear
 Regression analysis is a tool for building mathematical and statistical models that characterize relationships between variables Finds a linear relationship between: - one independent variable X and -
Chapter 1. Linear Regression with One Predictor Variable
 Chapter 1. Linear Regression with One Predictor Variable 1.1 Statistical Relation Between Two Variables To motivate statistical relationships, let us consider a mathematical relation between two mathematical
Is a measure of the strength and direction of a linear relationship
 More statistics: Correlation and Regression Coefficients Elie Gurarie Biol 799 - Lecture 2 January 2, 2017 January 2, 2017 Correlation (r) Is a measure of the strength and direction of a linear relationship
Overview. Overview. Overview. Specific Examples. General Examples. Bivariate Regression & Correlation
 Bivariate Regression & Correlation Overview The Scatter Diagram Two Examples: Education & Prestige Correlation Coefficient Bivariate Linear Regression Line SPSS Output Interpretation Covariance ou already
Regression: Main Ideas Setting: Quantitative outcome with a quantitative explanatory variable. Example, cont.
 TCELL 9/4/205 36-309/749 Experimental Design for Behavioral and Social Sciences Simple Regression Example Male black wheatear birds carry stones to the nest as a form of sexual display. Soler et al. wanted
: The model hypothesizes a relationship between the variables. The simplest probabilistic model: or.
 Chapter Simple Linear Regression : comparing means across groups : presenting relationships among numeric variables. Probabilistic Model : The model hypothesizes an relationship between the variables.
SOLUTIONS FOR PROBLEMS 1-30
 . Answer: 5 Evaluate x x + 9 for x SOLUTIONS FOR PROBLEMS - 0 When substituting x in x be sure to do the exponent before the multiplication by to get (). + 9 5 + When multiplying ( ) so that ( 7) ( ).
TOPIC 9 SIMPLE REGRESSION & CORRELATION
 TOPIC 9 SIMPLE REGRESSION & CORRELATION Basic Linear Relationships Mathematical representation: Y = a + bx X is the independent variable [the variable whose value we can choose, or the input variable].
Intro to Linear Regression
 Intro to Linear Regression Introduction to Regression Regression is a statistical procedure for modeling the relationship among variables to predict the value of a dependent variable from one or more predictor
ASSIGNMENT 3 SIMPLE LINEAR REGRESSION. Old Faithful
 ASSIGNMENT 3 SIMPLE LINEAR REGRESSION In the simple linear regression model, the mean of a response variable is a linear function of an explanatory variable. The model and associated inferential tools
Warm-up Using the given data Create a scatterplot Find the regression line
 Time at the lunch table Caloric intake 21.4 472 30.8 498 37.7 335 32.8 423 39.5 437 22.8 508 34.1 431 33.9 479 43.8 454 42.4 450 43.1 410 29.2 504 31.3 437 28.6 489 32.9 436 30.6 480 35.1 439 33.0 444
q3_3 MULTIPLE CHOICE. Choose the one alternative that best completes the statement or answers the question.
 q3_3 MULTIPLE CHOICE. Choose the one alternative that best completes the statement or answers the question. Provide an appropriate response. 1) In 2007, the number of wins had a mean of 81.79 with a standard
CS 147: Computer Systems Performance Analysis
 CS 147: Computer Systems Performance Analysis Advanced Regression Techniques CS 147: Computer Systems Performance Analysis Advanced Regression Techniques 1 / 31 Overview Overview Overview Common Transformations
MS Algebra 1 Scope and Sequence Quarter 1 Overview
 Quarter 1 Overview Equations, Inequalities, Absolute Value Students must master creating, solving, and In 7 th grade, students will have developed a Write, solve, and interpret multi-step equations analyzing
MATH 2560 C F03 Elementary Statistics I LECTURE 9: Least-Squares Regression Line and Equation
 MATH 2560 C F03 Elementary Statistics I LECTURE 9: Least-Squares Regression Line and Equation 1 Outline least-squares regresion line (LSRL); equation of the LSRL; interpreting the LSRL; correlation and
BIOSTATISTICS NURS 3324
 Simple Linear Regression and Correlation Introduction Previously, our attention has been focused on one variable which we designated by x. Frequently, it is desirable to learn something about the relationship
The response variable depends on the explanatory variable.
 A response variable measures an outcome of study. > dependent variables An explanatory variable attempts to explain the observed outcomes. > independent variables The response variable depends on the explanatory
36-309/749 Experimental Design for Behavioral and Social Sciences. Sep. 22, 2015 Lecture 4: Linear Regression
 36-309/749 Experimental Design for Behavioral and Social Sciences Sep. 22, 2015 Lecture 4: Linear Regression TCELL Simple Regression Example Male black wheatear birds carry stones to the nest as a form
1 A Review of Correlation and Regression
 1 A Review of Correlation and Regression SW, Chapter 12 Suppose we select n = 10 persons from the population of college seniors who plan to take the MCAT exam. Each takes the test, is coached, and then
appstats27.notebook April 06, 2017
 Chapter 27 Objective Students will conduct inference on regression and analyze data to write a conclusion. Inferences for Regression An Example: Body Fat and Waist Size pg 634 Our chapter example revolves
Linear Regression and Correlation. February 11, 2009
 Linear Regression and Correlation February 11, 2009 The Big Ideas To understand a set of data, start with a graph or graphs. The Big Ideas To understand a set of data, start with a graph or graphs. If
MATH 0409: Foundations of Mathematics COURSE OUTLINE
 MATH 0409: Foundations of Mathematics COURSE OUTLINE Spring 2016 CRN91085 MW 5:30-7:30pm AM209 Professor Sherri Escobar sherri.escobar@hccs.edu 281-620-1115 Catalog Description: Foundations of Mathematics.
AP Statistics Two-Variable Data Analysis
 AP Statistics Two-Variable Data Analysis Key Ideas Scatterplots Lines of Best Fit The Correlation Coefficient Least Squares Regression Line Coefficient of Determination Residuals Outliers and Influential
Chapter 8. Linear Regression. The Linear Model. Fat Versus Protein: An Example. The Linear Model (cont.) Residuals
 Residuals") Chapter 8 Linear Regression Copyright 2007 Pearson Education, Inc. Publishing as Pearson Addison-Wesley Slide 8-1 Copyright 2007 Pearson Education, Inc. Publishing as Pearson Addison-Wesley Fat Versus
Chapter 8 Linear Regression Copyright 2007 Pearson Education, Inc. Publishing as Pearson Addison-Wesley Slide 8-1 Copyright 2007 Pearson Education, Inc. Publishing as Pearson Addison-Wesley Fat Versus
7. Do not estimate values for y using x-values outside the limits of the data given. This is called extrapolation and is not reliable.
 AP Statistics 15 Inference for Regression I. Regression Review a. r à correlation coefficient or Pearson s coefficient: indicates strength and direction of the relationship between the explanatory variables