LARISSA Glaciology and Early Results from the AMIGOS Stations
|
|
|
- Abraham Horton
- 5 years ago
- Views:
Transcription


1 LARISSA Glaciology and Early Results from the AMIGOS Stations Ted Scambos National Snow and Ice Data Center, CIRES, University of Colorado, Boulder Ronald Ross Terry Haran Anika Petach Avega Systems, Sydney Aus.; NSIDC/CIRES, Univ. of Colorado; Harvard University Field work supported by NSF-OPP awards and Remote sensing supported by NASA award NNG06GA69G

2 LARISSA Project: 2010 AMIGOS, GPS, and Seismic Installations

3 Flask Glacier AMIGOS System installed (AMIGOS-3)
 Apogee SP-212 pyranometers Sony PTZ color camera* Topcon GRS-1 precision GPS* Platinum thermistors (4)* Site Beta Sensors: Vaisala WXT510 weather sensor ( 2 ) Apogee SP-212")
4 Control: Triton ETN-LP Linux computer Campbell CR-1000 data logger INS Spider 5TX-EEC ethernet hub Communications: NAL A3LA-SA Iridium modem DCB IP6600 router Scar and Flask Sensors: Vaisala WXT510 weather sensor ( 2 ) Apogee SP-212 pyranometers Sony PTZ color camera* Topcon GRS-1 precision GPS* Platinum thermistors (4)* Site Beta Sensors: Vaisala WXT510 weather sensor ( 2 ) Apogee SP-212 pyranometers Campbell SR50A Sonic ranging* Garmin 17-HVS WAAS GPS* Platinum thermistors (17)* Scar and Flask Power: Flexcharge 20NC12L12F charger ( 3 ) BP-340J 40 watt solar panels E31SLDGST Deka 12V batteries (4)* Site Beta Power: Flexcharge 20NC12L12F charger ( 3 ) BP-340J 40 watt solar panels E31SLDGST Deka 12V batteries (3)*

5

6
7 Weather and albedo data from AMIGOS-2, single day


8 Flask Glacier AMIGOS-3 image set


9 AMIGOS System camera on Scar Inlet and Flask Glacier: accumulation pole movies SCAR Inlet: Near-zero net accumulation in 6 months Flask Glacier: ~0.7 m net accumulation in 6 months
; Geoid height March 2010 ice flow speeds: Scar Inlet: 641.0 m/yr Flask Gl.: 258.")
10 Precision GPS results for AMIGOS -2 Scar Inlet Vertical Motion: tides On-board processing (C/A GPS and GLONASS) Differential processing (GAMIT Track); Geoid height March 2010 ice flow speeds: Scar Inlet: m/yr Flask Gl.: m/yr Little change since 2006; Some acceleration since 2002?
11 AMIGOS 2 and 3 Firn Temperature profiles: Scar Inlet near the shelf stability limit; Flask is even warmer


12 AMIGOS 2 Temperature: melt detection Weather data: Mid winter melt event July Firn thermistor data:
 mean annual temperature temperature history for past 10-20 yrs.")
13 Bruce Plateau AMIGOS System Sonic snow height sensor accumulation rate Weather data Vaisala system: wind, temp, press, humid Albedometer solar power, surface melt onset Thermistor string (120 m) mean annual temperature temperature history for past yrs. NO LONGER TRANSMITTING: SNOW BURIAL RATE ~1m/month
14
15 Bruce Plateau 120 m firn thermal profile, March-April 2010 Surface* Winter-summer m 40 m Cooler past few years 60 m 80 m 100 m Decadal warming 120 m C C C C

16 ʻRidge Camʼ AMIGOS System, for high-resolution images overlooking the glaciers or ice shelves AMIGOS: Automated Met-Ice-Geophys. Observing Stations Hi-Res Camera three 12 megapixel images, 2x /day surface processes, crevassing, calving Weather data Vaisala system: wind, temp, press, humid Albedometer solar power, surface melt onset NOT YET INSTALLED; REQUIRES HELICOPTER TO INSTALL AND REMOVE 4 Hours Ground Time

17 Plans for Further Installations in 2011/2012 Crane Glacier Ice front Hi-Res AMIGOS Glacier AMIGOS Precision GPS Flask Glacier Ridge-top Hi-Res AMIGOS Leppard Glacier Glacier AMIGOS

18 Crane Glacier - new AMIGOS and GPS sites in 2013 Thank you Questions?

19 Thank you Questions?

20 After the collapse glacier speed-up and drawdown Punchbowl Glacier The Larsen B used to be here

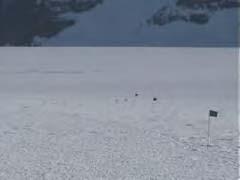
21 Iceberg evolution during drift - A22A Tower AMIGOS: Automated Met-Ice-Geophys. Observing Stations GPS Camera flag lines accum/ablate surface events Weather data Ice thickness and melt rate didnʼt work


 your")

22 Iceberg evolution during drift - Automated station science results A22a station, March Lots to look at -- accumulation mast flag line (barrel) your feet yourself..and record the weather and GPS position

23 Iceberg evolution during drift - AMIGOSberg disintegration: water Nov 2 Nov 3 Nov 23 The last day Nov 5 Nov 7 Nov 7 Nov Nov Nov Nov Nov
24 Iceberg ʻedge-wastingʼ loss rates - three stages rift calving edge wasting disintegration Units here: hectares per day per kilometer ice edge Or -- 1 unit equal 10 m edge retreat per day Scambos et al., 2008 J. Glac.

 (L. Thompson, E.")
 On the N. B.")
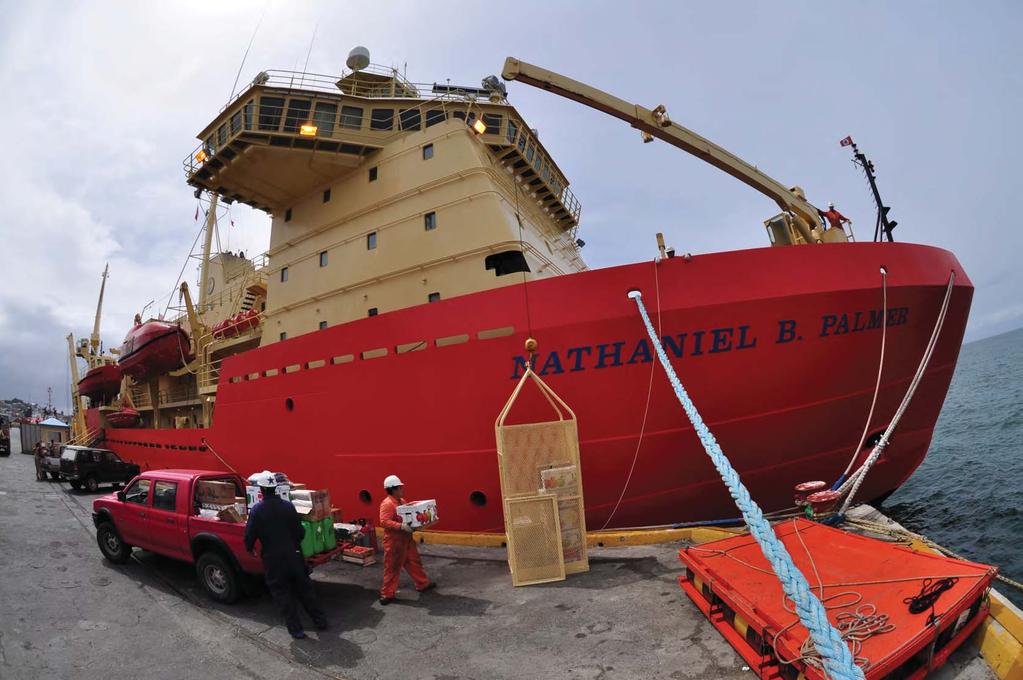
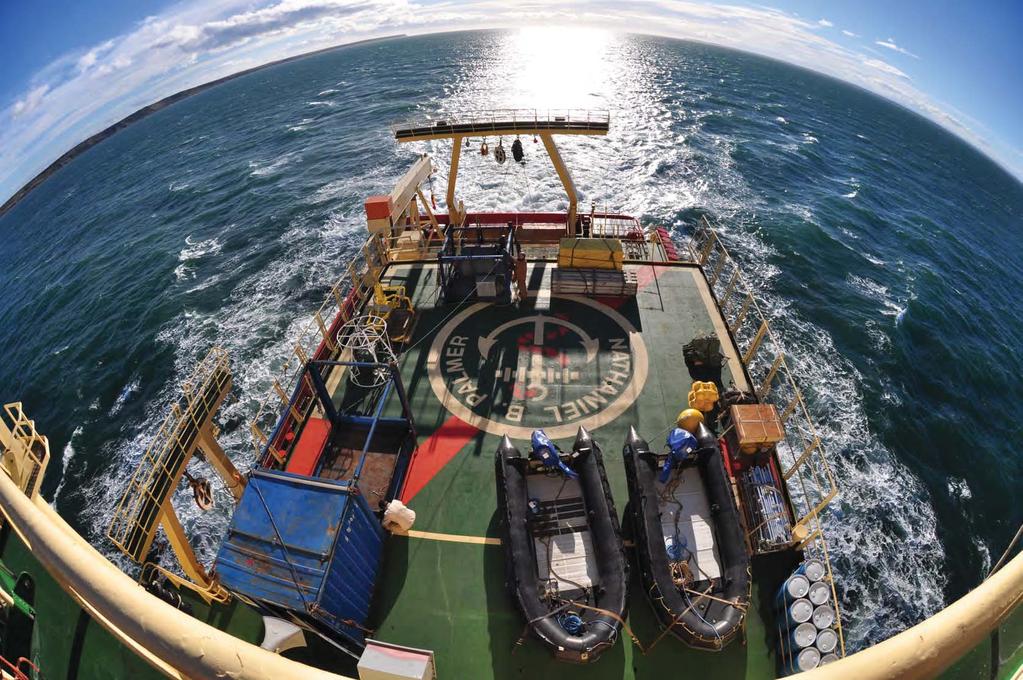
25 LARISSA: Larsen Ice Shelf System, Antarctica 3 linked studies: Marine Geology E. Domack*, A. Leventer, S. Brachfield, et al. Cryosphere and Oceans T. Scambos, M. Truffer, E. Pettit, B. Huber L. Thompson and E. Mosley-Thompson Ecosystems M. Vernet, C. VanDover, C. Smith,, et al. CRYOSPHERE AND OCEANS: Ice core on Bruce Plateau (~400m) (L. Thompson, E. Mosley-Thompson) Met data and ice geophysics, (ʻAMIGOSʼ); GPR surveys; flowline models and others (T. Scambos, M. Truffer, E. Pettit) On the N. B. Palmer With helos Ocean circulation, exchange (A. Gordon, B. Huber)
26 LARISSA: how ice sheets, marine geosystems, and the biosphere respond to rapid polar climate change
27 Iceberg evolution during drift - AMIGOSberg disintegration: water Nov 2 Nov 3 Nov 5 Nov 7 Nov 7 Nov Nov Nov Nov Nov Saturated firn can initiate a ʻdisintegration-styleʼ break-up Scambos et al., 2008 J. Glac.
28
29
 Other components of a ʻdisintegr")
30 How a small amount of melt has a magnified effect (Weertman, 1973) Other components of a ʻdisintegrationʼ-style collapse: pre-existing crevasses, e.g. from glacier stresses or ice front stresses; low compression within the shelf (explains George VI, Amery) a surface reservoir of water to fill the as fracture as it deepens (e.g., ponds) Scambos et al., 2003 Ant. Res. Series

31 After the shelf was lost, glaciers began to accelerate. Larsen B Embayment: A significant speed increase occurred for all glaciers feeding the breakup areas. No ice speed change was observed in glaciers south of the break-up zone.


32 Ice shelves - the gatekeepers of mass balance change Glaciers feeding the Larsen B accelerated and thinned after disintegration of the ice shelf -- MODIS image, November, 2002 Landsat-7 image, February 2003 Scambos et al., 2004, GRL

33 Study area, and altimetry / bathymetry data sets SPOT-5 image, 25 November 2006 Scambos et al., 2010, J. Glac.
34 A brief period of rapid elevation loss (ʻdrawdownʼ): late 2004 to late 2005 Looking downstream Shuman et al., 2010 in prep.


35 All glaciers in the region of shelf disintegration show major speed and elevation effects; where the shelf remains, there is little change. Shuman et al., 2010 in prep. Along-flow elevation difference profiles of the Larsen B glaciers


36 Larsen B Ice Shelf disintegration, February-March 2002 ʻDisintegrationʼ style break-up Not all retreat events are disintegrations Climate change driven; rapid increase in surface melting; hydro-fracture. Above, melt ponds cover the area of subsequent break-up; Sliver icebergs, ice-front-parallel At right, blue areas are toppled ice; brown streaks are entrained debris exposed by the break-up. Scambos et al., 2003 Ant. Res. Series

37 Mass loss of the Larsen B tributary glaciers and Drygalski Glacier: Total is ~62.3 Gtons Shuman et al., 2010 in prep.

38 Antarctica Ice Sheet GRACE Mascon Solution GRACE mascon - ICE5G (Gt / yr) GRACE mascon - IJ05 (Gt / yr) < 2000 m -96 ± > 2000 m -8 ± 13 6 WAIS -120 ± EAIS 16 ± Antarctica -105 ± Tip of Penn. -43 ± 4-39 ± 4 Luthke, 2009 GSFC, pers. comm.
Today s Lecture: Land, biosphere, cryosphere (All that stuff we don t have equations for... )
") Today s Lecture: Land, biosphere, cryosphere (All that stuff we don t have equations for... ) 4 Land, biosphere, cryosphere 1. Introduction 2. Atmosphere 3. Ocean 4. Land, biosphere, cryosphere 4.1 Land
Today s Lecture: Land, biosphere, cryosphere (All that stuff we don t have equations for... ) 4 Land, biosphere, cryosphere 1. Introduction 2. Atmosphere 3. Ocean 4. Land, biosphere, cryosphere 4.1 Land
ACTIVITY II: THE FATE OF THE LARSEN S, A FAMILY OF ANTARCTIC ICE SHELVES
 ACTIVITY II: THE FATE OF THE LARSEN S, A FAMILY OF ANTARCTIC ICE SHELVES Ice Shelves play a critical role in Antarctica, serving as a buffer between the ocean and the continental ice sheet covering the
Remote and Autonomous Measurements of Precipitation in Antarctica
 Remote and Autonomous Measurements of Precipitation in Antarctica Mark W. Seefeldt 1 Scott D. Landolt 2 and Andrew J. Monaghan 2 1 Cooperative Institute for Research in Environmental Sciences (CIRES) University
Brita Horlings
 Knut Christianson Brita Horlings brita2@uw.edu https://courses.washington.edu/ess431/ Natural Occurrences of Ice: Distribution and environmental factors of seasonal snow, sea ice, glaciers and permafrost
Polar Portal Season Report 2013
 Polar Portal Season Report 2013 All in all, 2013 has been a year with large melting from both the Greenland Ice Sheet and the Arctic sea ice but not nearly as large as the record-setting year of 2012.
Observations of sea ice and ice sheet interaction in Greenland and the Antarctic Peninsula
 Observations of sea ice and ice sheet interaction in Greenland and the Antarctic Peninsula Twila Moon 1,2, Ted Scambos 1, Mark Fahnestock 3, Ian Joughin 2, Ben Smith 2, Terry Haran 1, Marin Klinger 1,
Vermont Soil Climate Analysis Network (SCAN) sites at Lye Brook and Mount Mansfield
 sites at Lye Brook and Mount Mansfield") Vermont Soil Climate Analysis Network (SCAN) sites at Lye Brook and Mount Mansfield 13 Years of Soil Temperature and Soil Moisture Data Collection September 2000 September 2013 Soil Climate Analysis Network
Vermont Soil Climate Analysis Network (SCAN) sites at Lye Brook and Mount Mansfield 13 Years of Soil Temperature and Soil Moisture Data Collection September 2000 September 2013 Soil Climate Analysis Network
Ocean Ice Interactions: A
 Ocean Ice Interactions: A Cryospheric Perspective Tony Payne a.j.payne@bristol.ac.uk Steph Cornford, Rupert Gladstone and Dan Martin (LLNL) KISS short course Sept. 2013 Slide number 1/37 Outline Evidence
The State of the cryosphere
 The State of the cryosphere Course outline Introduction The cryosphere; what is it? The Earth; a unique planet Cryospheric components Classifications Lecture outlines The State of the cryosphere The State
Polar Portal Season Report 2016
 Polar Portal Season Report 2016 Less ice both on land and at sea This year s report is the fourth since the Polar Portal was launched, and as an introduction, we have chosen to take a look at the trends
Glaciers form wherever snow and ice can accumulate High latitudes High mountains at low latitudes Ice temperatures vary among glaciers Warm
 The Cryosphere Glaciers form wherever snow and ice can accumulate High latitudes High mountains at low latitudes Ice temperatures vary among glaciers Warm (temperate) glaciers: at pressure melting point,
CRACKS IN THE ARMOR?
 CRACKS IN THE ARMOR? R BY ROBERT MONROE ULE NO. 1 FOR BEHAVIOR around Loose Tooth : Maintain half a football field s distance from its rift zones at all times. As the name of the soon-to-be iceberg suggests,
SCIENTIFIC REPORT NERC GEF
 SCIENTIFIC REPORT NERC GEF Loan 927 Measuring changes in the dynamics of Pine Island Glacier, Antarctica A.M. Smith & E.C. King, British Antarctic Survey (BAS) pp J.B.T. Scott ABSTRACT A brief period of
SEA ICE AND GLOBAL WARMING
 jkjk SEA ICE AND GLOBAL WARMING Lesson plan for grades K- 3 By: Laura Sanders, Environmental Science Institute, March 2011 Length of lesson: two 30- minute class periods SOURCES AND RESOURCES: Atmospheric
Ocean variability contributing to basal melt rate near the ice front of Ross Ice Shelf, Antarctica
 Ocean variability contributing to basal melt rate near the ice front of Ross Ice Shelf, Antarctica Laurie Padman I. Arzeno, R.C. Beardsley, R. Limeburner, B. Owens, S.R. Springer, C.L. Stewart, M.J.M.
Overview: Key Concepts: Time: 2, minute class periods. Materials:
 Text and Activities Adapted from: Teachers Domain, Texas A&M University: Ocean Drilling Distance Learning Program, The New York Times, Center for Remote Sensing of Ice Sheets (CReSIS), the Natural Resources
The Wedge, Grease and Heat: Why Ice Sheets Hate Water
 The Wedge, Grease and Heat: Why Ice Sheets Hate Water Dr. Robert Bindschadler Chief Scientist Laboratory for Hydrospheric and Biospheric Sciences NASA Goddard Space Flight Center Robert.A.Bindschadler@nasa.gov
ATOC OUR CHANGING ENVIRONMENT Class 19 (Chp 6) Objectives of Today s Class: The Cryosphere [1] Components, time scales; [2] Seasonal snow
![ATOC OUR CHANGING ENVIRONMENT Class 19 (Chp 6) Objectives of Today s Class: The Cryosphere [1] Components, time scales; [2] Seasonal snow](/thumbs/95/126309683.jpg "ATOC OUR CHANGING ENVIRONMENT Class 19 (Chp 6) Objectives of Today s Class: The Cryosphere [1] Components, time scales; [2] Seasonal snow") ATOC 1060-002 OUR CHANGING ENVIRONMENT Class 19 (Chp 6) Objectives of Today s Class: The Cryosphere [1] Components, time scales; [2] Seasonal snow cover, permafrost, river and lake ice, ; [3]Glaciers and
ATOC 1060-002 OUR CHANGING ENVIRONMENT Class 19 (Chp 6) Objectives of Today s Class: The Cryosphere [1] Components, time scales; [2] Seasonal snow cover, permafrost, river and lake ice, ; [3]Glaciers and
Watch for Week 8/9 Review Assessment
 Wednesday, October 25, 2017 Exam 2 results, key is posted on the main course website. Please check to make sure there are no errors in the scoring of the Scantron portion of the exam (note the scantron
Summary for the Greenland ice sheet
 Contribution of Greenland and Antarctica to future sea level change Catherine Ritz, Gaël Durand, Fabien Gillet-Chaulet, Olivier Gagliardini, Vincent Peyaud EDGe team, LGGE, CNRS/UJF Grenoble, France Ice
Coupling of Waves, Turbulence and Thermodynamics across the Marginal Ice Zone
 DISTRIBUTION STATEMENT A. Approved for public release; distribution is unlimited. Coupling of Waves, Turbulence and Thermodynamics across the Marginal Ice Zone Tim Stanton and Bill Shaw Oceanography Department,
Thomas P. Phillips CIRES Prof K. Steffen, L. Colgan PhD ABD, D. McGrath MA
 Thomas P. Phillips CIRES Prof K. Steffen, L. Colgan PhD ABD, D. McGrath MA Problem: we know very little about the processes happening within the Greenland Ice Sheet. What is the velocity at the base? What
Sea-ice change around Alaska & Impacts on Human Activities
 Sea-ice change around Alaska & Impacts on Human Activities Hajo Eicken Geophysical Institute University of Alaska Fairbanks, hajo.eicken@gi.alaska.edu Introduction The Arctic sea-ice cover: Observations
Norsk-amerikansk forskningsekspedisjon på innlandsisen i Antarktis. Kirsty Langley Norsk Polarinstitutt
 Norsk-amerikansk forskningsekspedisjon på innlandsisen i Antarktis Kirsty Langley Norsk Polarinstitutt The Antarctic ice sheet Area: ca. 14. 10 6 km 2 90 % of Earth s s ice Complete melting: 60 m sea-level
Mass loss of Larsen B tributary glaciers (Antarctic Peninsula) unabated since 2002
 unabated since 2002") GEOPHYSICAL RESEARCH LETTERS, VOL. 39,, doi:10.1029/2012gl051755, 2012 Mass loss of Larsen B tributary glaciers (Antarctic Peninsula) unabated since 2002 Etienne Berthier, 1 Ted A. Scambos, 2 and Christopher
GEOPHYSICAL RESEARCH LETTERS, VOL. 39,, doi:10.1029/2012gl051755, 2012 Mass loss of Larsen B tributary glaciers (Antarctic Peninsula) unabated since 2002 Etienne Berthier, 1 Ted A. Scambos, 2 and Christopher
Sea level contribution of Antarctica & Greenland Andrew Shepherd
 Andrew Shepherd School of Geosciences, Edinburgh Sea Subglacial level contribution lakes of Antarctica & Greenland Climate change Satellite observations Ice Sheets and Sea level Climate change Climate
Polar Portal Season Report 2018
 Polar Portal Season Report 2018 Unusual weather resulted in an atypical melting season in the Arctic The 2017-18 season in the Arctic has once again been extraordinary. A cold summer with high levels of
An Arctic Perspective on Climate Change
 An Arctic Perspective on Climate Change 23 Oct 2012 Gifford Miller (and many others) University of Colorado Boulder The Earth is warming How do we know? Temperature Anomaly ( C) It s a fact Global Land
Glacial Geomorphology Lecture 1: Glaciers & Glacial Environments. GGY 166: Geomorphology of Southern Africa
 Glacial Geomorphology Lecture 1: Glaciers & Glacial Environments GGY 166: Geomorphology of Southern Africa Relevance in Southern African Context South African landscape has been influenced by glacial action
Spectral Albedos. a: dry snow. b: wet new snow. c: melting old snow. a: cold MY ice. b: melting MY ice. d: frozen pond. c: melting FY white ice
 Spectral Albedos a: dry snow b: wet new snow a: cold MY ice c: melting old snow b: melting MY ice d: frozen pond c: melting FY white ice d: melting FY blue ice e: early MY pond e: ageing ponds Extinction
ENIGMA: something that is mysterious, puzzling, or difficult to understand.
 Lecture 12. Attempts to solve the Eccentricity Enigma ENIGMA: something that is mysterious, puzzling, or difficult to understand. Milankovitch forcing glacier responses pre-900,000 yr BP glacier responses
XVI. Warming and the cryosphere
 XVI. Warming and the cryosphere review temperature from thermometers, satellites, glacier lengths and boreholes all show significant warming in the 20th C+ reconstruction of past temperatures from corals,
Frank PATTYN Laboratoire de Glaciologie Université Libre de Bruxelles Belgium
 Frank PATTYN Laboratoire de Glaciologie Université Libre de Bruxelles Belgium 200 x 10 6 people living in coastal floodplains IPCC, 2007 2 x 10 6 km 2 and 10 12 US$ worth of assets lying
Ice shelf thickness over Larsen C, Antarctica, derived from satellite altimetry
 Click Here for Full Article GEOPHYSICAL RESEARCH LETTERS, VOL. 36,, doi:10.1029/2009gl039527, 2009 Ice shelf thickness over Larsen C, Antarctica, derived from satellite altimetry J. A. Griggs 1 and J.
The Environmental Literacy Framework (ELF) was made possible through financial support provided by
 was made possible through financial support provided by") The Environmental Literacy Framework (ELF) was made possible through financial support provided by Energy Geosphere As part of NOAA Environmental Literacy Grant #NA09SEC490009 to the University of Nebraska
The Environmental Literacy Framework (ELF) was made possible through financial support provided by Energy Geosphere As part of NOAA Environmental Literacy Grant #NA09SEC490009 to the University of Nebraska
Glacier (and ice sheet) Mass Balance
 Mass Balance") Glacier (and ice sheet) Mass Balance The long-term average position of the highest (late summer) firn line is termed the Equilibrium Line Altitude (ELA) Firn is old snow How an ice sheet works (roughly):
Glacier (and ice sheet) Mass Balance The long-term average position of the highest (late summer) firn line is termed the Equilibrium Line Altitude (ELA) Firn is old snow How an ice sheet works (roughly):
The recent retreat of glaciers in the world
 The recent retreat of glaciers in the world Consequences for the global environment Dr Bernard Francou Director of Research Emeritus Grenoble-Alpes University - France Glaciers are part of the cryosphere
Strong winter surface melt on an Antarctic ice shelf
 Strong winter surface melt on an Antarctic ice shelf P. Kuipers Munneke 1, A. J. Luckman 2, S. L. Bevan 2, E. Gilbert 3, C. J. P. P. Smeets 1, M. R. van den Broeke 1, W. Wang 4, C. Zender 4, B. Hubbard
Lesson 2. Antarctic Oceanography: Component I - Ice/Glaciers Component II - Marine Snow
 Lesson 2. Antarctic Oceanography: Component I - Ice/Glaciers Component II - Marine Snow Lesson Objectives: Introduces students to the different kinds of ice found in Antarctica, Students will become familiar
Lecture 21: Glaciers and Paleoclimate Read: Chapter 15 Homework due Thursday Nov. 12. What we ll learn today:! Learning Objectives (LO)
") Learning Objectives (LO) Lecture 21: Glaciers and Paleoclimate Read: Chapter 15 Homework due Thursday Nov. 12 What we ll learn today:! 1. 1. Glaciers and where they occur! 2. 2. Compare depositional and
Learning Objectives (LO) Lecture 21: Glaciers and Paleoclimate Read: Chapter 15 Homework due Thursday Nov. 12 What we ll learn today:! 1. 1. Glaciers and where they occur! 2. 2. Compare depositional and
Development of Innovative Technology to Provide Low-Cost Surface Atmospheric Observations in Data-sparse Regions
 Development of Innovative Technology to Provide Low-Cost Surface Atmospheric Observations in Data-sparse Regions Paul Kucera and Martin Steinson University Corporation for Atmospheric Research/COMET 3D-Printed
The Northern Hemisphere Sea ice Trends: Regional Features and the Late 1990s Change. Renguang Wu
 The Northern Hemisphere Sea ice Trends: Regional Features and the Late 1990s Change Renguang Wu Institute of Atmospheric Physics, Chinese Academy of Sciences, Beijing World Conference on Climate Change
The Wilkins Ice Shelf Con Job
 The Wilkins Ice Shelf Con Job John McLean 2 April 2008 On 25 March the US National Snow and Ice Data Center (NSIDC) and the British Antarctic Survey (BAS) jointly published a press statement declaring
Ice sheets of West Antarctica are warming fast. West Antarctic Ice Sheet warming twice earlier estimate
 Ice sheets of West Antarctica are warming fast 02 January 2013 Magazine issue 2898. Subscribe and save For similar stories, visit the Climate Change Topic Guide THE ice sheets of West Antarctica are warming
Calving and ice-shelf break-up processes investigated by proxy: Antarctic tabular iceberg evolution during northward drift
 Journal of Glaciology, Vol. 54, No. 187, 2008 579 Calving and ice-shelf break-up processes investigated by proxy: Antarctic tabular iceberg evolution during northward drift T. SCAMBOS, 1 R. ROSS, 2 R.
The continent of Antarctica Resource N1
 The continent of Antarctica Resource N1 Prepared by Gillian Bunting Mapping and Geographic Information Centre, British Antarctic Survey February 1999 Equal area projection map of the world Resource N2
Meltwater produced by wind-albedo interaction stored in an East Antarctic ice shelf Supplementary Information
 Meltwater produced by wind-albedo interaction stored in an East Antarctic ice shelf Supplementary Information 1 Supplementary Figure 1: (a) Upper and (b) lower surface of an englacial lake surveyed by
Glaciers Earth 9th Edition Chapter 18 Glaciers: summary in haiku form Key Concepts Glaciers Glaciers Glaciers Glaciers
 1 2 3 4 5 6 7 8 9 10 11 12 13 14 Earth 9 th Edition Chapter 18 : summary in haiku form Ten thousand years thence big glaciers began to melt - called "global warming." Key Concepts and types of glaciers.
Buoyant flexure and basal crevassing in dynamic mass loss at Helheim Glacier
 SUPPLEMENTARY INFORMATION DOI: 10.1038/NGEO2204 Buoyant flexure and basal crevassing in dynamic mass loss at Helheim Glacier Timothy D. James*, Tavi Murray, Nick Selmes, Kilian Scharrer and Martin O Leary
Coastal Antarctic polynyas: A coupled process requiring high model resolution in the ocean and atmosphere
 Coastal Antarctic polynyas: A coupled process requiring high model resolution in the ocean and atmosphere Mike Dinniman and John Klinck Center for Coastal Physical Oceanography Old Dominion University
Waking Giants: Ice Sheets in a Warming World
 Waking Giants: Ice Sheets in a Warming World Dr. Robert Bindschadler Chief Scien6st Hydrospheric and Biospheric Sciences Laboratory NASA Goddard Space Flight Center Robert.A.Bindschadler@nasa.gov Ice Sheets
Glaciers. (Shaping Earth s Surface, Part 6) Science 330 Summer 2005
 Science 330 Summer 2005") Glaciers (Shaping Earth s Surface, Part 6) Science 330 Summer 2005 1 Glaciers Glaciers are parts of two basic cycles Hydrologic cycle Rock cycle Glacier a thick mass of ice that originates on land from
Glaciers (Shaping Earth s Surface, Part 6) Science 330 Summer 2005 1 Glaciers Glaciers are parts of two basic cycles Hydrologic cycle Rock cycle Glacier a thick mass of ice that originates on land from
Regional Outlook for the Bering-Chukchi-Beaufort Seas Contribution to the 2018 Sea Ice Outlook
 Regional Outlook for the Bering-Chukchi-Beaufort Seas Contribution to the 2018 Sea Ice Outlook 25 July 2018 Matthew Druckenmiller (National Snow and Ice Data Center, Univ. Colorado Boulder) & Hajo Eicken
How Will Melting Ice Sheets Affect Us?
 PASSAGE 4 How Will Melting Ice Sheets Affect Us? Variation is normal. During the last ice age, for example, ice sheets also covered much of North America and Scandinavia. Why is what s happening now different
Annual September Arctic Sea ice extent
 Annual September Arctic Sea ice extent 1979-2012 Annual September Arctic Sea ice extent 1979-2012 Notes: The month of September has the minimum sea ice cover each year. Passive microwave instruments on
Validation of the Antarctic Snow Accumulation and Ice Discharge Basal Stress Boundary of the Southeastern Region of the Ross Ice Shelf, Antarctica
 Validation of the Antarctic Snow Accumulation and Ice Discharge Basal Stress Boundary of the Southeastern Region of the Ross Ice Shelf, Antarctica TEAM MEMBERS Ayanna Overton, junior Charlie Nelson, senior
NASA Images of Antarctica and the Arctic covered in both land and sea ice
 ICE SHELVES ACTIVITY 1: DECODING THE ROLE OF ANTARCTIC ICE IN GLOBAL CLIMATE Ice Shelves play a critical role in Antarctica, serving as a buffer between the ocean and the continental ice sheet covering
POLAR WEEKEND SHRINKING ICE SHEETS AND RISING SEA LEVEL
 POLAR WEEKEND SHRINKING ICE SHEETS AND RISING SEA LEVEL TOPIC: Shrinking Ice Sheets and Rising Sea Levels PROJECT PERSONNEL: Dr. Robert Bindschadler, Glaciologist, NASA Scientists provide information on
Earth Science and Climate Change
 Earth Science and Climate Change Dr. Mary L. Cleave February 7, 2007 YOU ARE HERE 3 Land Use Changes Over Time Lingering Doubts on Temperature Trends Have Been Resolved 1st CCSP Synthesis & Assessment
Glaciers Response after Disintegration of Northern Larsen Ice Shelf, Antarctic Peninsula, observed by Multisensor Satellite Data
 Glaciers Response after Disintegration of Northern Larsen Ice Shelf, Antarctic Peninsula, observed by Multisensor Satellite Data Helmut Rott1,2, Jan Wuite1, Thomas Nagler1, Dana Floricioiu3, Michael Kern4
MiSP Ecology/Pollution Global Warming Worksheet #1, L2 GLOBAL WARMING AND ICE EXTENT
 MiSP Ecology/Pollution Global Warming Worksheet #1, L2 Name Date GLOBAL WARMING AND ICE EXTENT Introduction: Sea ice is found in remote polar oceans. On average, sea ice covers about 25 million square
Spring break reading. Glacial formation. Surface processes: Glaciers and deserts. The Control of Nature
 suggested Spring break reading The Control of Nature by John McPhee Surface processes: Glaciers and deserts describes our efforts to control three natural hazards: 1. The Mississippi Floods 2. The Heimaey
THE EARTH S CLIMATE SYSTEM
 THE EARTH S CLIMATE SYSTEM Earth s Climate System is driven by interactions between the parts of our biosphere So.what is the Biosphere? a relatively thin layer of Earth that has conditions suitable for
How much are glaciers and ice sheets contributing to global sea-level rise?
 How much are glaciers and ice sheets contributing to global sea-level rise? From measurements made by the IPCC it is clear that Global sea level is rising, however the direct cause of this rise is not
PREVIEW 35. The ice sheets that cover Antarctica average one and a half miles in thickness. The thickest ice is almost three miles thick.
 PREVIEW 35 Antarctica is a place of unique and extreme characteristics. But just how unique and extreme? Read each statement below. Circle whether you believe each one is a fact or an exaggeration. The
Exploring The Polar Connection to Sea Level Rise NGSS Disciplinary Core Ideas Science & Engineering Crosscutting Concepts
 Exploring The Polar Connection to Sea Level Rise NGSS Disciplinary Core Ideas Science & Engineering Crosscutting Concepts Practices MS - ESS: Earth & Space Science 1. Ask questions 2. Developing and using
Milankovitch Theory of the Ice Ages
 Ruddiman CHAPTER 10 Insolation Control of Ice Sheets Milankovitch Theory of the Ice Ages margin of Greenland ice sheet Today s main points: 1) Review of glaciology basics. 2) Orbital changes affecting
Antarctic Automatic Weather Station Data for the calendar year 2000
 Antarctic Automatic Weather Station Data for the calendar year 2000 by Linda M. Keller George A. Weidner Charles R. Stearns Matthew T. Whittaker Robert E. Holmes Matthew A. Lazzara Space Science and Engineering
CNES activities post SPIRIT. Steven Hosford Strategy and Programs Directorate CNES
 CNES activities post SPIRIT Steven Hosford Strategy and Programs Directorate CNES Summary Reminder SPIRIT project Context Data acquired Activities since 2009 Data access Further acquistions New activities
Aspects of a climate observing system: energy and water. Kevin E Trenberth NCAR
 Aspects of a climate observing system: energy and water Kevin E Trenberth NCAR Tracking Earth s Global Energy Where has global warming from increased GHGs gone? Kevin E Trenberth NCAR Where did the heat
Terrestrial Snow Cover: Properties, Trends, and Feedbacks. Chris Derksen Climate Research Division, ECCC
 Terrestrial Snow Cover: Properties, Trends, and Feedbacks Chris Derksen Climate Research Division, ECCC Outline Three Snow Lectures: 1. Why you should care about snow: Snow and the cryosphere Classes of
Effect of Ocean Warming on West Antarctic Ice Streams and Ice Shelves. Bryan Riel December 4, 2008
 Effect of Ocean Warming on West Antarctic Ice Streams and Ice Shelves Bryan Riel December 4, 2008 Ice Sheet Mass Balance/WAIS Dynamics -Mass Balance = (Ice/Snow Accumulation) (Surface melting, ice outflux,
POLAR WEEKEND SUBGLACIAL LAKES
 POLAR WEEKEND SUBGLACIAL LAKES TOPIC: AN Unknown Subglacial World CHRISTOPHER SHUMAN, UNIVERSITY OF ADRIENNE BLOCK, LDEO MARYLAND BALTIMORE COUNTY'S GODDARD EARTH SCIENCE AND TECHNOLOGY CENTER PROJECT
Investigating snow accumulation variability on the Antarctic Peninsula using Ground Penetrating Radar. - A tool for interpreting ice core records
 Investigating snow accumulation variability on the Antarctic Peninsula using Ground - A tool for interpreting ice core records Elizabeth R. Thomas June 2008 Scientific Report in support of Loan 824 Identifying
The Ice Age sequence in the Quaternary
 The Ice Age sequence in the Quaternary Subdivisions of the Quaternary Period System Series Stage Age (Ma) Holocene 0 0.0117 Tarantian (Upper) 0.0117 0.126 Quaternary Ionian (Middle) 0.126 0.781 Pleistocene
ESS 431 Principles of Glaciology ESS 505 The Cryosphere
 MID-TERM November 9, 2015 ESS 431 Principles of Glaciology ESS 505 The Cryosphere Instructions: Please answer the following 5 questions. [The actual 5 questions will be selected from these 12 questions
Ice shelves in a warming world: The Filchner-Ronne Ice Shelf system
 Ice shelves in a warming world: The Filchner-Ronne Ice Shelf system Svein Østerhus Oceanographer uni research climate NARE prosjekt: Long-term observing system for the oceanic regime of Filchner-Ronne
SUPPLEMENTARY INFORMATION
 SUPPLEMENTARY INFORMATION DOI: 10.1038/NGEO1887 Diverse calving patterns linked to glacier geometry J. N. Bassis and S. Jacobs 1. Supplementary Figures (a) (b) (c) Supplementary Figure S1 Schematic of
Ice in the climate system. Summary so far. Today. The Cryosphere. 1. Climate history of the Earth. 2. Paleo observations (1)
") Ice in the climate system 1. Climate history of the Earth 2. Paleo observations (1) 3. Paleo observations (2) 4. Ice ages 5. Climate sensitivity 6. Ice in the climate system Summary so far Radiation (Milankovitch
Ice in the climate system 1. Climate history of the Earth 2. Paleo observations (1) 3. Paleo observations (2) 4. Ice ages 5. Climate sensitivity 6. Ice in the climate system Summary so far Radiation (Milankovitch
Ice Sheets and Climate Change. William H. Lipscomb Los Alamos National Laboratory
 Ice Sheets and Climate Change William H. Lipscomb Los Alamos National Laboratory What is an expert? An expert is somebody who is more than 50 miles from home, has no responsibility for implementing the
Supplementary Fig. 1. Locations of thinning transects and photos of example samples. Mt Suess/Gondola Ridge transects extended metres above
 Supplementary Fig. 1. Locations of thinning transects and photos of example samples. Mt Suess/Gondola Ridge transects extended 260 24 metres above the modern surface of Mackay Glacier, and included 16
Rates of southeast Greenland ice volume loss from combined ICESat and ASTER observations
 Click Here for Full Article GEOPHYSICAL RESEARCH LETTERS, VOL. 35, L17505, doi:10.1029/2008gl034496, 2008 Rates of southeast Greenland ice volume loss from combined ICESat and ASTER observations Ian M.
Measuring recent dynamic behaviour of Svalbard glaciers to investigate calving and surging
 Measuring recent dynamic behaviour of Svalbard glaciers to investigate calving and surging Adrian Luckman, Swansea University, UNIS Doug Benn, Heidi Sevestre, University of St Andrews Suzanne Bevan, Swansea
Chapter 9 Notes: Ice and Glaciers, Wind and Deserts
 Chapter 9 Notes: Ice and Glaciers, Wind and Deserts *Glaciers and Glacial Features glacier is a mass of ice that moves over land under its own weight through the action of gravity Glacier Formation must
Ice sheet climate in CESM
 CESM winter meeting Boulder, February 9, 2016 Ice sheet climate in CESM Jan Lenaerts & many CESM community members! 2 Exciting CESM land ice science in 2015 Impact of realistic GrIS mass loss on AMOC (Lenaerts
Agricultural Science Climatology Semester 2, Anne Green / Richard Thompson
 Agricultural Science Climatology Semester 2, 2006 Anne Green / Richard Thompson http://www.physics.usyd.edu.au/ag/agschome.htm Course Coordinator: Mike Wheatland Course Goals Evaluate & interpret information,
Extreme Weather and Climate Change: the big picture Alan K. Betts Atmospheric Research Pittsford, VT NESC, Saratoga, NY
 Extreme Weather and Climate Change: the big picture Alan K. Betts Atmospheric Research Pittsford, VT http://alanbetts.com NESC, Saratoga, NY March 10, 2018 Increases in Extreme Weather Last decade: lack
History. Late 18 th /early 19 th century Europeans observed that erratic boulders dispersed due to the retention of glaciers caused by climate chance
 Ice ages What is an ice age? Geological period of long-term reduction in the temperature of the Earth's surface and atmosphere which results in the formation and expansion of continental ice sheets, polar
Northern Larsen Ice Shelf, Antarctica: further retreat after collapse
 Annals of Glaciology 34 2002 # International Glaciological Society Northern Larsen Ice Shelf, Antarctica: further retreat after collapse Helmut Rott, 1 Wolfgang Rack, 1 Pedro Skvarca, 2 Hernän De Angelis
1 IntroductIon to the cryosphere
 1 IntroductIon to the cryosphere in this place, nostalgia roams, patient as slow hands on skin, transparent as melt-water. nights are light and long. Shadows settle on the shoulders of air. time steps
Canadian Ice Service
 Canadian Ice Service Key Points and Details concerning the 2009 Arctic Minimum Summer Sea Ice Extent October 1 st, 2009 http://ice-glaces.ec.gc.ca 1 Key Points of Interest Arctic-wide The Arctic-wide minimum
UV RADIATION IN THE SOUTHERN SEAS IN SUMMER 2000 Gerd Wendler and Brian Hartmann Geophysical Institute, University of Alaska, Fairbanks, Alaska 99775
 P3.2 UV RADIATION IN THE SOUTHERN SEAS IN SUMMER 2000 Gerd Wendler and Brian Hartmann Geophysical Institute, University of Alaska, Fairbanks, Alaska 99775 Abstract During a cruise on the USCGC POLAR SEA
WEATHER STATION FOR SOLAR FARM MONITORING
 WEATHER STATION FOR SOLAR FARM MONITORING SOLAR FARM MONITORING SYSTEM: Measures global, horizontal, & background irradiance. Measures wind speed, wind direction, ambient temperature, and relative humidity.
SUPPLEMENTARY INFORMATION
 SUPPLEMENTARY INFORMATION doi: 10.108/ngeo75 This section includes additional information for the model parameters as well as the results of a set of sensitivity experiments to illustrate the dependence
Figure 1: Two schematic views of the global overturning circulation. The Southern Ocean plays two key roles in the global overturning: (1) the
 the") Figure 1: Two schematic views of the global overturning circulation. The Southern Ocean plays two key roles in the global overturning: (1) the Antarctic Circumpolar Current connects the ocean basins, establishing
Figure 1: Two schematic views of the global overturning circulation. The Southern Ocean plays two key roles in the global overturning: (1) the Antarctic Circumpolar Current connects the ocean basins, establishing
Where is Earth s Water?
 PASSAGE 1 Where is Earth s Water? Our planet contains a limited amount of water that is always in motion. The water that comes out of your faucet moved through the atmosphere, flowed across Earth s surface,
Supplement of Detailed ice loss pattern in the northern Antarctic Peninsula: widespread decline driven by ice front retreats
 Supplement of The Cryosphere, 8, 2135 2145, 2014 http://www.the-cryosphere.net/8/2135/2014/ doi:10.5194/tc-8-2135-2014-supplement Author(s) 2014. CC Attribution 3.0 License. Supplement of Detailed ice
The Meteorological Observatory from Neumayer Gert König-Langlo, Bernd Loose Alfred-Wegener-Institut, Bremerhaven, Germany
 The Meteorological Observatory from Neumayer Gert König-Langlo, Bernd Loose Alfred-Wegener-Institut, Bremerhaven, Germany History of Neumayer In March 1981, the Georg von Neumayer Station (70 37 S, 8 22
Southern Ocean observations & change
 Southern Ocean observations & change Steve Rintoul Project leader CSHOR Project staff Steve Rintoul (Project leader and research scientist) Laura Herraiz-Borreguero (Research scientist) Alessandro Silvano
Deep Ocean Circulation & implications for Earth s climate
 Deep Ocean Circulation & implications for Earth s climate I. Ocean Layers and circulation types 1) Ocean Layers Ocean is strongly Stratified Consists of distinct LAYERS controlled by density takes huge