DEFORMATION ZONES ALONG STRIKE SLIP AND DIP-SLIP FAULTS. Wen-Jeng Huang. and. Arvid M. Johnson
|
|
|
- Roy Summers
- 5 years ago
- Views:
Transcription
1 1 DEFORMATION ZONES ALONG STRIKE SLIP AND DIP-SLIP FAULTS by Wen-Jeng Huang and Arvid M. Johnson Wen-Jeng Huang Department of Geological Sciences, Indiana University, USA 1001 E. 10 th St., Bloomington, IN Work telephone: huang22@indiana.edu Arvid M. Johnson Department of Earth and Atmospheric Sciences, Purdue University, USA 550 Stadium Mall Dr. Purdue University, West Lafayette, IN Work telephone: gotesson@purdue.edu * Corresponding author, Phone: huang22@indiana.edu Index term: 8012 High strain deformation zones 8020 Mechanics, theory, and modeling 8010 Fractures and faults Keywords: deformation zones; Chi-Chi earthquake, Dücze earthquake, Northridge earthquake 1
2 29 ABSTRACT Deformation zones are belts of high strains that can occur at the ground surface centered or asymmetrical relative to the trace of an earthquake fault and can range in width from a meter or two up to hundreds of meters. In order to minimize damage to engineering structures within deformation zones one needs to be able to determine the characteristics of the deformation zone. According to the mechanism of deformation-zone formation suggested here, certain parameters should characterize deformation zones. The ratio of widths of deformation zone in hanging wall and foot wall of dipping faults, w Hang /w Foot, should be controlled by fault dip angle, θ, and the kind of fault the relations are different for strike slip and dip slip faults. Also, the total width of the deformation zone, w = w Hang + w Foot, normalized with fault slip during the earthquake, w/s, should be determined by the dip angle, θ, the exponent, n, of the yield condition, (II e ε' ) c, and the kind of fault. The theoretical parameters measured for deformation zones along the strike slip, Dücze Bolu fault at Kaynaşlı, Turkey and two deformation zones along the thrust, Chi Chi fault, Taiwan agree well with parameters determined from geophysical and geological sources. The theoretical model also indicates that the Winnetka strain belts of the 1994 Northridge earthquake could have formed above a previously unknown blind fault at Winnetka; the analysis suggests that the Winnetka fault is a normal, dip slip fault, dipping ~54 S with a fault-tip depth of approximately 360 m INTRODUCTION It is unquestionable in the earthquake engineering and geoscience communities that earthquakes cause damage to engineering structures by ground shaking and various kinds of foundation soil failures even far from the hypocenter and the earthquake rupture, but it is generally unappreciated that much of the damage to near-fault engineering structures can be due to two other 2
3 distinctly different earthquake phenomena: ground lurching on the one hand and ground distortion on the other [Gür, 2004]. Ground lurching and distortion are quite distinct from ground shaking although they can all occur together. Ground lurching and shaking are both essentially dynamic. Ground distortion can be either dynamic, associated with sudden earthquake faulting, or static, associated with slow, silent faulting. In this paper we focus on ground distortion. Several geologists, G. K. Gilbert, F. E. Matthes, Esper S. Larsen and A. Lawson, whom were charged with describing the rupture of the 1906 San Francisco earthquake mostly north of San Francisco, showed incontrovertibly that earthquake ruptures were in some cases traces of fault planes but in many cases were zones of distortion [Lawson, 1908; Reid, 1910], which we now call deformation zones. We have described deformation zones and belts ranging in width from a few meters to half a kilometer along strike slip earthquake ruptures at Landers, California, and Kaynaşlı, Turkey [Johnson et al., 1994a, 1994b, 1997, 2002; Fleming and Johnson, 1997a; Fleming et al., 1997b]. The idea of the deformation belt or deformation zone is apparently analogous to the ideas of Riedel shears [e.g., Hansen, 1961; Morgenstern and Tchalenko, 1967; Wallace, 1973; Vailon et al., 1976; Gamond, 1983], fault zones [e.g., Gamond, 1983], process zones [e.g., Atkinson, 1987] and shear belts or fracture belts [e.g., Johnson et al., 1994a, 2002]. Although some engineers have recognized that deformation zones with large strains can seriously damage engineering structures [e.g., Steinbrugge et al., 1973; Lazarte et al., 1994; Taiwan National Center for Research on Earthquake Engineering (NCREE), 2000 and Gür, 2004], the causes of deformation zones have remained obscure. The purpose of this paper is to describe and then analyze quantitatively the phenomena of ground distortion in deformation zones along several earthquake ruptures as a step toward developing an understanding of the causes of deformation 3
4 zones. Engineers ultimately need to have quantitative information about how, why and where deformation zones occur in order to design engineering structures to appropriately address them. In this paper we are going to present various lines of evidence that suggest that deformation zones are manifested in different ways in the field, depending on properties of materials near the ground surface, but that the zones reflect the same general subsurface mechanisms, which occur in somewhat different forms: The deformation zone can be a band at the ground surface of permanent strain fracturing or some kind of flow of materials the general nature of which is consistent with the kinematics of the slip on the fault that produces it. If the fault is a right lateral, strike slip fault, the shearing within the deformation zone is right lateral; if the fault is normal, dip slip, the predominant deformation within the deformation zone is extension normal to the fault trace plus complimentary vertical strain. The sense of permanent strain in a deformation zone, therefore, is opposite to the sense of elastic strain due to elastic rebound. The proposed mechanism is based on the proposition that deformation zones form as slip on a fault propagates toward the ground surface. The proposition evolved out of studies of deformation zones along strike slip earthquake ruptures in California and Turkey [Johnson et al., 1993, 1994a, 1994b, 1996a, 1996b, 1997, 2002; Fleming et al., 1997a, 1997b, 1998] and of growth of ruptures bounding large, rapidly moving landslide masses in Utah [Fleming and Johnson, 1989]. The theoretical analysis formulated here quantifies the mechanism approximately and suggests physical properties of the ground, geometrical properties of the fault, and kinematic properties of slip on the fault that control the ways ideal deformation zones manifest themselves. Then we summarize field descriptions of deformation zones along two surface ruptures Dücze Bolu strike slip fault at Kaynaşlı, Turkey [Johnson et al., 2002] and the Chi Chi thrust fault in Taiwan [Huang, 2006], as well as a deformation zone over the Winnetka blind fault at Northridge, California 4
5 96 97 [Cruikshank et al., 1996], and use the theoretical analysis to compare values of parameters measured in the field with values of parameters expected theoretically HOW DEFORMATION ZONES DEVELOP The mechanism of deformation-zone development that we have proposed [Johnson et al., 2002] is based essentially on three ideas borne of observation: The deformation zone is characterized by permanent deformation at the ground surface fracturing or some kind of flow. The general nature of the deformation in the zone is consistent with the slip on the fault that produces the zone. A corollary is that the deformation in the zone is opposite to that of elastic rebound. The third idea is that the deformation zone forms as slip on a fault propagates toward the ground surface. A corollary is that a deformation zone forms before the slip on the fault reaches the ground surface. Although the mechanism of deformation zone formation has been developed for strike slip faults [Johnson et al., 2002], it is clear that the general mechanism should apply to deformation zones associated with dip slip faults. The characteristic permanent deformations in deformation zones are manifested in different ways. Along the Johnson Valley and Homestead Valley fault zones at Landers, the ground was brittle and the interiors of the deformation zones were marked by spectacular arrays of small faults and tension cracks [Johnson et al., 1993, 1994b, 1996b]. Along the northern part of the Emerson Lake fault zone at Landers, the soils were soft and sandy and, although the deformation zones could be recognized and the main rupture easily recognized, the internal deformation was mainly by flow so that rupturing was visible in only a few small faults and tension cracks [Fleming et al., 1997a, 1997b; Johnson et al., 1996b]. At Kaynaşlı, Turkey, the earthquake rupture passed under the viaduct within alluvium, so we could recognize only the main rupture and a couple of other 5
6 fractures. The full width of the deformation zone was detected only by measuring ground strains [Johnson et al., 2002; Gür, 2004]. Maps, photographs and detailed descriptions of many deformation zones along strike-slip faults are available in the literature [Lawson, 1908; Reid, 1910; Fleming et al., 1997a, 1997b; Johnson et al., 1993, 1994b, 1997, 2002]. We assume that interested readers will read those sources so that none of the maps and photos needs to be repeated here. According to elementary elastic rebound theory [e.g., Gilbert, 1907; Reid, 1910], the phenomena illustrated in Figure 1a and Figure 1b will occur at the ground surface for a right lateral, strike slip fault of finite length if a straight passive marker is placed normal to the trace of the fault (Figure 1a) shortly before the fault ruptures. When the fault slips suddenly at depth, the passive marker is offset and will deform as shown schematically in Figure 1b. The critical observation here is that, although the offset on the fault is right lateral, the deformed line indicates that the rock on either side of the fault was distorted in a left lateral sense. This is the result of elastic rebound. The rebound is illustrated via the exaggerated deformation of squares into parallelograms on either side of the fault. A deformation zone, however, is characterized by a distinctly different pattern of deformation (Figure 1c). If offset on the fault is right lateral then the sense of shearing within the deformation zone is also right lateral. On either side of the deformation zone, however, the deformation is left lateral, reflecting elastic rebound. In effect, the deformation zone and the main fault together accomplish the faulting near the ground surface that may well be accomplished on a single fault surface at depth. Two idealized versions of the position of the main fault with respect to the deformation zone are shown in Figure 1c and Figure 1d. In both versions, however, the initial condition is the same as 6
7 that for elastic rebound, shown in Figure 1a. The position of the main fault in Figure 1c is near midwidth so it appears to be similar to the position of the main fault at the San Andreas Reservoir intake structure [Lawson, 1908, Figure 35, p. 98]. The position in Figure 1d is closer to one side of the deformation zone so it appears to be similar to the position of the main rupture at Kaynaşlı, Turkey [Johnson et al., 2002]. The third idea underlying the mechanism proposed for the formation of deformation zones derives from the field observations that fault slip propagation near the ground surface that is, within the part of the ground that affects the formation of deformation zones is upward for strike slip faults. In particular, the surficial expressions of strike slip ruptures that we have observed in large landslides in Utah [Fleming and Johnson, 1989], the 1989 Loma Prieta earthquake ruptures [Aydin et al., 1992; Martosudarmo et al., 1996], 1992 Landers earthquake [e.g., Johnson et al., 1994b; 1996b] and the 1999 Kaynaşlı, Turkey, earthquake [Johnson et al., 2002] all reflect mode III propagation, that is, propagation of faults from below to the ground surface (Figure 2a). One reason we know that strike slip fault segments could not have been propagating near the ground surface in mode II is that the traces of segments are discontinuous at the ground surface; mode II propagation would require continuity. The segments must have been propagating in mode III (Figure 2a). For strike slip faults, therefore, we would expect stresses induced by mode III loading to control the patterns of the near surface strains and fracturing in the deformation zones. That is what we have deduced in all our studies of fractures within strike slip deformation zones. We have few observations about direction of propagation of dip slip faults near the ground surface. We will assume that the traditional view prevails, that dip slip faults propagate in mode II near the ground surface, as shown in Figure 2b. We have insufficient experience to assume otherwise; only enough to wonder [e.g., Fleming and Johnson, 1989]. 7
8 Deformation zones begin to form at the ground surface before the slip front on the fault reaches the ground surface. That is, the tip of propagation is blind at the time the deformation zone forms at the ground surface. The highly localized, intense shearing that we call the fault trace only occurs as the slip reaches the ground surface. One of the questions we will address in our analyses of four field examples is how close the tip of slip on the fault is to the ground surface at the time the deformation begins to form. We will see that the distance is expected to be on the order of the width of the deformation zone A MECHANICAL MODEL We will analyze deformation associated with a dislocation fault that slips uniformly or progressively beneath the ground surface, partly based on the three general ideas we have described above but also on a set of simplifying assumptions that maintain the essential physics of the problems we want to address. We approximately model the strains at the ground surface, even where plastic deformation is occurring, by elastic strains computed with the solution for uniform slip with one or more dislocations. In particular, we describe the incremental permanent deformation associated with slipping dislocations by calculating the incremental elastic strains for a dislocation and then approximately calculating the incremental permanent strains with an elastic plastic model for yielding (see Appendix A). We simulate propagation of slip on a fault as shown in Figure 3: The fault exists before the simulated slip event occurs. It has a width of W f. At time t 0 there is no slip on the fault and no strain in the medium. At time t 1, part of the fault of width δd 1 slips as an incremental dislocation as shown in Figure 3b. We model the deformation at each point along the ground surface caused by the mode II or mode III dislocation of width W d = δd 1. At time t 2, the same amount of slip occurs on an adjacent part of the fault represented by another dislocation of width δd 2. Thus the tip of slip has 8
9 propagated from the upper end of dislocation δd 1 to the upper end of dislocation δd 2. The tip of slip is now at Wd = δd 1 +δd 2 (Figure 3c). We model the additional deformation due to the additional dislocation at each point at the ground surface. This process is repeated in the simulation until the propagation is terminated or the slip breaks through the ground surface. The analysis of the problem is presented in Appendix A SIMULATION OF STRAIN PATTERNS AND ZONES OF PERMANENT DEFORMATION DIP-SLIP AND STRIKE-SLIP FAULTS The characteristics of theoretical zones of permanent surface deformation, which we identify with deformation zones observed in the field, are determined by the dip angle of the fault as well as whether the fault accommodates dip-slip or strike slip and contraction or extension. Figure 5 compares zones of permanent surface deformation formed over a low-angle fault dipping 30 and slipping in either a right-lateral strike-slip sense (Figure 5a) or a reverse dip-slip (Figure 5b) sense. The boundary conditions at the ground surface are the same so that Figure 5a and 5b show ways in which deformation is different for the two kinds of fault. Each figure element, i.e., Figure 5a1, shows the plan view above and the cross section below at a stage of slip propagation. Slippage begins at great depth for both types of fault and the tip of slip approaches the ground surface as dislocation patches of slip are added to the width, W d, of the dislocation. As the width of the dislocation, W d, approaches the width, W f, of the fault, stresses and elastic strains at the ground surface become large enough to cause permanent deformation. The zone of permanent deformation, shown with a stippled rectangular area in plan view, widens as slippage approaches and ultimately reaches the ground surface. The plan view in each element of the figure shows a map of strains at each stage of slip propagation. The strains are shown with rectangular strain figures, which consist of a square and a 9
10 rectangle. The area of the square indicates the magnitude of strain and the shape of the rectangle intimates the principal strains that transformed the square into the rectangle. The magnitude of the strain is read by comparing the square of a strain figure to a series of scaled squares, such as those in the upper left of Figure 5a1. In this example, the orders of magnitude range from -3.5 to -2, that is, strains range in magnitude from to The sides of the square and rectangle of a strain figure are parallel to the principal strain directions. The principal strains are indicated by comparing the square and rectangle. Thus, the dimension of the rectangle of a strain figure is greater than the width of the square if the strain in that direction is extensile, and the dimension of the rectangle of a strain figure is less than the width of the square if the strain in that direction is compressive. Appendix B explains how to read the strain figures quantitatively. Figure 5a shows four stages in the formation of a zone of permanent deformation at the ground surface caused by upward propagation of slip on a strike slip fault (mode III propagation). We would note that only in stage 4 has the slip broken through the ground surface. In stages 1 through 3 the fault is blind. Since the pattern of ground deformation evolves as the slip propagates, one can in principle use the deformation pattern to approximately characterize the faulting. The only parameters changed in the models shown in Figure 5 are the type of fault (strike-slip or dip-slip) and the ratio of the width of the slipped part of the fault to the total length of the fault, W d W f. Two parameters are fixed: the dip angle, θ = 30, of the fault and the critical value of the second 228 invariant of the deviatoric strain (IIε' e ) c = Besides the strains, the main variables that change as the slip propagates are: (1) D ts S, the depth ratio, where Dts is the depth to the tip of slip on the fault and S is the slip. The value of particular interest is the depth ratio at which the zone of permanent deformation begins to form at the ground 10
11 surface. (2) w S, the normalized width of the zone of permanent deformation, where w is the width of the zone. The value we record is the normalized width when the slip has propagated to the ground surface. (3) w b, the width ratio of the zone of permanent deformation behind, w b, to that than in w f 235 front, wf, of the projection of the tip of slip of a blind fault to the ground surface. This variable is of 236 particular interest for blind faults. (4) w Hang w Foot, the width ratio of the width, w Hang, of the zone of 237 permanent deformation in the hanging wall to that in the footwall, wfoot. This ratio is the special 238 case of w b w f where slip has propagated to the ground surface. 239 At Stage 1, the fault is blind (Figure 5a1), although the right-lateral slip has already propagated along 90 percent of the fault length, W d W f = 0.9. For the special case we are considering, the slip has thus propagated to within 500 m of the ground surface. The direction of maximum extensile strain, ε1, is NW SE if north is upward in the diagram. There is right lateral, simple shear parallel to the trace of the fault. The largest deviatoric strain is approximately 10 3 so the second invariant of the elastic strains, II ε' e, is locally approximately 10 6, that is, roughly equal to the critical value we have adopted for this problem. The yielding is just beginning at the ground surface; the zone of permanent deformation is about to form. Two characteristics are: The deformation at the ground surface is right lateral (same sense as fault) simple shear everywhere in the view. The strains are entirely elastic. The largest shear strain is approximately at the vertical projection of the tip of slip to the ground surface (dashed line in map view) At stage 2, the slip has propagated to within 350 m of the ground surface, and W d W f = The fault is still blind, of course. The zone of permanent deformation at the ground surface (stippled) 11
12 has initiated and widened within the hanging wall of the fault. The maximum strain (elastic and plastic) within the zone of permanent deformation remains essentially over the tip of slip. The width 254 of the zone of permanent deformation is slightly wider behind, wb, than in front, w f, of the upward projection of the tip of slip: w b w f 1.3. The largest shear strain remains approximately at the vertical projection of the tip of slip to the ground surface At stage 3, slip has propagated to within 150 m of the ground surface, and W d W f = The zone of permanent deformation (stippled) has widened. It is still in the hanging wall of the fault. The 259 width of the zone of permanent deformation is two and half times as wide behind, wb, than in front, w f, of the upward projection of the tip of slip: w b w f approximately at the vertical projection of the tip of slip The largest shear strain remains 262 At stage 4, the tip of slip has propagated to the ground surface so the zone of permanent deformation is complete; W d W f = 1. The zone is highly asymmetric. It is quite narrow in the footwall and wide in the hanging wall of the fault so the plastic zone is almost entirely within the hanging wall. The maximum permanent strain is, in principle, at the surface rupture. The larger squares represent a principal strain, ε1, of approximately 10 2, so the second invariant of the total strain is II ε' = 10 4, two orders of magnitude larger than the critical value of (II ε' e ) c = 10 6 assumed for the case discussed here. The width ratio of the zone in the hanging wall, w Hang, is perhaps fourteen times that in the footwall, w Foot, that is, w Hang w Foot
13 The idealized deformation zone for a low angle, reverse fault (Figure 5b) develops rather differently than that for the low angle, strike slip fault. The reverse fault slips in mode II and is assumed to propagate in mode II At Stage 1, during the elastic stage, D ts = 500 m and W d W f = 0.9, the strains normal to the surface trace of the fault change sign across the vertical projection of the tip of slip to the ground surface. At the vertical projection the strain is essentially zero (Figure 5b1); for the strike-slip fault it is maximal there. The deformation at the ground surface is compressive (same sense as fault) normal to the fault trace in front of the projection of the tip of slip to the ground surface. It is extensile behind the projection. The largest strain is in the zone of compression. 279 At Stage 2, the tip of slip for the reverse slip fault has propagated to a depth of D ts = 350 m, and W d W f = The zone of permanent deformation has initiated and widened. The permanent deformation appears well in front of the tip of slip. Indeed, the strains still change from compression in front to extension behind the projection of the tip of slip At stage 3, the slip propagates to a depth 150 m, W d W f = 0.97, and the zone of permanent deformation occurs mostly in front of the upward projection of the tip of slip for the reverse fault, whereas it was essentially over the tip of slip for the strike slip fault. The zone of permanent deformation is mostly in front of the tip of slip but within the hanging wall of the fault. The width of the zone of permanent deformation is wider in front, wf, than in back, w b, of the tip of slip: w b w 0.5. f 288 The width of the zone in the hanging wall is perhaps four times that in the footwall, w Hang w Foot 4. 13
14 As the slip ruptures to the ground surface, W d W f = 1, at stage 4, the zone of permanent deformation is highly asymmetric with respect with the fault trace. The width of the zone in the hanging wall is perhaps three times that in the footwall, w Hang w Foot 3. The zone is quite narrow in the footwall and wide in the hanging wall of the fault for both for the strike slip fault and the reverse slip fault. The simulations shown in Figure 5 illustrate how mode III propagation of slip on a strike slip fault and mode II propagation on a reverse fault from depth to the ground surface could produce somewhat different ratios, w Hang w Foot, of widths of deformation zones in hanging walls and footwalls and highly different strain patterns. The strain pattern is a qualitative variable. The simulations suggest that, if one could know where the termination of tip of slip of a blind fault projects to the ground surface and the strain pattern at the ground surface one could determine the kind of blind fault. In all cases, though, the strain pattern should be diagnostic of the type of faulting EFFECT OF DIP ANGLE The two examples in Figure 5 have shown how the idealized strain patterns elastic and permanent as well as characteristic variables, w S and w Hang w Foot, should ideally evolve as a function of 304 slip propagation, W d W f upward along the fault. Now we examine the characteristic variables, w S and w Hang w Foot, for strike slip and dip slip faults after the slip has propagated to the ground surface, for faults with three dip angles of θ = 30, 60 or 90 (Figure 6). 14
15 For the faults dipping 30 beneath the hanging wall we have already seen: For both types of fault, the position of the fault trace is much closer to one side of the zone of permanent deformation than the other (Figure 6a1 and 6b1). The fault dips beneath the widest part of the deformation zone. A corollary is that the width of the zone of permanent deformation is significantly wider in the hanging wall block than in the footwall block for both kinds of faults; w Hang w Foot For the vertical faults, Figure 6a3 and Figure 6b3, we see two strong features: The pattern of strains in the zone of permanent deformation is diagnostic. It is symmetric across the strike slip fault and antisymmetric across the dip slip fault (Figure 6a3 and Figure 6b3). The position of the fault trace is at midwidth of the zone of permanent deformation for both vertical strike slip and dip slip faults. The results for the faults dipping 60 are unsurprising in the context of Figure 6 because they are intermediate between those for faults dipping 30 or 90. There are, however, distinctive differences between dip-slip and strike-slip zones of permanent deformation if the dip is 60 : The position of the fault trace, that is, w Hang w Foot, for the θ = 60 dip slip fault is more nearly like that of the vertical dip slip fault, θ = 90. The position of the fault trace for the θ = 60 strike slip fault is more nearly like that of the θ = 30 strike slip fault. It follows that the width of the zone of permanent deformation is significantly narrower in the footwall block than in the hanging wall block for θ = 60 strike slip faults; w Hang w Foot > 1. > 1. The widths of deformation zones are more nearly equal, w Hang w Foot 1, in the two blocks for θ = 60 dip slip faults. For both of the 60 faults, however, the strains are significantly larger in the hanging wall than in the footwall. 15
16 NORMAL AND REVERSE DIP SLIP FAULTS Figure 7 compares the strain patterns for normal and reverse dip-slip faults the slip on which has extended to the ground surface. The only possible difference in the idealized deformation zones is a matter of symmetry; nevertheless, it might be helpful to see the difference: For a normal fault the strain with the largest magnitude is extensile whereas for a reserve the strain with the largest magnitude is compressive. For both types of fault, the wider zone of permanent deformation is in the hanging wall block. The slip direction of the blind fault is determined by the ratio, w C /w E, where w C is the width of the compression belt and w E is the width of the extension belt. If the ratio is less than one the fault is a normal fault. If the ratio is greater than one the fault is a reverse fault. We note that although the larger strain is extensile for the normal fault and compressive for the reverse fault, the only type of failure possible in the elastic-plastic theory is plastic yielding, so the theory cannot be expected to recognize that failure in tension is generally quite different from failure in compression in earth materials. Finally, an observation that is relevant to the interpretation of the type of blind fault at Winnetka that we describe in following paragraphs: The strain with the largest magnitude is compressive for the reverse fault (Figure 5b, Figure 6b, Figure 7b) and extensile for the normal fault (Figure 7a). There are the general characteristics for strike-slip and dip-slip faults according to the theoretical model that we use to understand some features of deformation zones SOME ESTIMATES OF THE CRITICAL DEVIATORIC STRAIN INVARIANT It is helpful to have some idea about the range of values that one might expect for the parameter we call the critical deviatoric strain invariant for plastic yielding, (II e ε' ) c. In doing so, we liberally interpret what the parameter might represent. Table 1 shows low and high estimates of representative deviatoric strain, r ε' c, and corresponding critical second invariant, (II e ε' ) c, where, 16
17 350 rε' c = ± (II ε' e ) c for measurements that we have made in the field and in the laboratory. Some estimates of representative deviatoric strain, r ε' c, and critical second invariant, (II ε' e ) c, are given in Table The brittle materials include cylindrical specimens of granite, and concrete in sidewalks, curbs and foundations. The more ductile materials include soil, landslide debris (loaded in the field in tension and in compression) and asphalt pavement. For example, ground strains measured in an area of extensively fractured ground, pavement and sidewalks in the Granada Hills area that was damaged during the Northridge earthquake, were typically , but maximum strains ranged up to 10 2 [Johnson et al., 1996]. In the Winnetka area of the Northridge earthquake [Cruikshank et al., 1996], the ground strains were much smaller, on the order of , than in the Granada Hills area. Perhaps the strains in much of the Winnetka area, where there was minimal cracking and damage to utilities, were mainly elastic. This might explain the very small values in the last row in Table 1. Where strains were somewhat larger, up to 10 3, there was modest cracking and damage at Winnetka, but the types of damaged mapped mainly reflected extension. The estimates for landslide debris are based on measurements of strains prior to failure in landslide debris at Aspen Grove, Utah [Fleming and Johnson, 1989] GRAPHICAL DETERMINATION OF CHARACTERISTIC PARAMETERS We have compiled three diagrams in order to help one estimate a couple of parameters for a deformation zone. The diagrams are in terms of dimensionless parameters. We have selected the amount of slip, S, to normalize many lengths because it is commonly known or can be estimated. The dimensionless parameters used in the theoretical analyses are the ratio of the fault width to the 17
18 372 slip, W f S, the dip angle of the fault, θ ( ), and the critical invariant of the deviatoric elastic strain, 373 (IIε' e ) c. Other dimensionless variables that we can determine with numerical solutions are the ratio of the width of the deformation zone in the hanging wall to that in the footwall, w Hang w Foot, and the ratio of the total width of the zone, w = whang + w Foot, of the deformation zone to the slip, w/s. These dimensionless variables are interrelated in Figure The width ratio, w Hang w Foot, of the deformation zone is particularly useful because it relates well to the dip angle, θ, of the fault. The two curves in Figure 8a show the width ratio, w Hang, as a function of dip angle, θ, for strike-slip and dip-slip faults. The curves were calculated for a wide range of w Foot 380 critical invariants, (IIε' e ) c, but the curves were indistinguishable, so only two curves need to be plotted. Thus, if one knows dip angle, θ, one can estimate the width ratio, w Hang w Foot. Or if one knows the width ratio one can estimate the dip angle. The relations between the total width of the deformation zone and the critical invariant of 385 deviatoric strain depend on the dip angle, so Figure 8b and Figure 8c show the relations for strikeslip and dip-slip faults, respectively. The total width is represented in its dimensionless form, w S, and the critical invariant of the deviatoric elastic strain, (IIε' e ) c, is represented by it exponential form, n, where (II ε' e ) c = 10 n. Thus, one first uses the appropriate curve in Figure 8a to determine the dip 388 angle of the fault from measurement of the width ratio, w Hang w Foot, and then one uses the curves in either 18
19 389 Figure 8b for strike-slip faults or Figure 8c for dip-slip faults to determine either w S or (II ε' e ) c, 390 depending which is unknown W f w The results shown in Figure 8 were calculated for a W f S ratio of For very wide faults, say > 500 or 1000, the results should be insensitive to the total width of the fault because the zone of permanent deformation does not appear until the tip of slip is rather near the ground surface, as suggested by the results in Figure ANALYSIS OF DEFORMATION BELTS ALONG SOME EARTHQUAKE RUPTURES RIGHT LATERAL DEFORMATION ZONE BENEATH KAYNAŞLI VIADUCT, TURKEY The fault trace of the 12 November 1999 earthquake in the Düzce Bolu region in Anatolia crossed the 2.4 km long alignment of a new viaduct at Kaynaşlı, Turkey. Surveys of the piers provided a very rare record of ground deformation along an earthquake rupture because the piers had been surveyed before and after the earthquake. In effect, each group of four piers (Figure 9) that supported the viaduct was a giant strain gage that spanned the earthquake rupture zone and yielded data about ground movement and distortion near the fault. The surveys show that along the right lateral rupture at Kaynaşlı the fault zone consists of a belt of large, right lateral distortion containing the main trace with right lateral offset, and is bounded by small, left lateral distortion on the north. We have presented the data and described the results of strain and displacement analyses elsewhere [Johnson et al., 2002; Gür, 2004] At the intersection of the Kaynaşlı Viaduct and the main rupture, the rupture crossed a service road at an acute angle with the south edge of the viaduct and trended eastward toward pier 45R, 19
20 under the eastbound lane of the viaduct (supported by piers R, Figure 10). The main rupture ran into pier 45 R, threaded its way between piers 46 R and 46 L, ran into pier 47 L and continued on the north side of the viaduct. The main rupture was perhaps a meter wide and the offset across the main rupture was 1.15 m, right lateral [Barka and Altunel, 2000]. Measurements of piers along the entire viaduct indicate 2.1 m of offset across the deformation zone [Gür, 2004], so approximately 55% of the offset occurred along the main rupture. The rest was distributed through the deformation zone and is presumably reflected in the strain measurements (Figure 11). Deformations that were computed from surveys of horizontal positions of piers before and after the earthquake [Johnson et al., 2002] show that the maximum shear strain (ε 1 ε 2 )/2 is largest near where the main rupture passed beneath the viaduct, but the strains are significant for about 450 m of the length of the viaduct involving all the piers between nos. 39 and 49 (Figure 11). Quadrilaterals involving piers 45 to 48 have the highest shear strains, ranging from 1.5 x 10 2 to 5 x Quadrilaterals involving piers 38 to 44 in the western part of the deformation zone have smaller maximum shear strains, approximately 10 2 (Figure 11). The ground was so soft in the alluvium of the Asarsus stream valley where the Dücze rupture zone passed beneath the Kaynaşlı Viaduct that even though the ground strained at magnitudes of 10 3 to 10 2 the distortion was largely invisible outside the main rupture. The azimuths of the maximum extension directions for the quadrilaterals complete the picture of the strain of ground beneath the viaduct (Figure 12). They indicate a right lateral deformation zone with boundaries roughly parallel to the trend of the main rupture. The azimuths of maximum extension directions are approximately 60 for quadrilaterals 39 through 43 and 55 for quadrilaterals 44 through 48, so the angle between the maximum principal strain and the main rupture ranges from 38 to 43. If the strain associated with fault rupturing had been simple shear, 20
21 we would have expected the angle to be approximately 45. The orientation of the maximum strain direction is consistent with a zone of simple shear along the trend plus some negative dilation normal to the trend of the main rupture. One of the interesting features of the strains is the reversal of the direction of shearing in the vicinity of piers 36 to 38 (Figure 12). The maximum shear strains computed for quadrilaterals involving piers 36, 37 and 38 were smaller than the errors of measurement [Johnson et al., 2002], and therefore negligible. Those computed for quadrilaterals involving piers 34, 35 and 36, though, are significant and the azimuths of maximum extension were 10 to 15. Thus, the shearing part of the deformation definitely switched from right to left lateral in the vicinity of piers 36 to 38. The central question for our analysis of the Kaynaşlı deformation zone is whether one can fit the results of the slip propagation theory to the salient field observations and measurements. Bürgmann et al. [2002] have suggested that the Dücze fault dips approximately 54 north. The dimensional parameters of the part of the fault that slipped were approximately: length of 40 km and width of W f = 20 km (Yagi and Kikuchi, Online). We assume that the length is essentially infinite in the analysis. The slip at depth on the fault in the Kaynaşlı area was approximately S = 3 m [Ayküz, 2002]. The characteristic parameters according to the theory are summarized in Table 2. The salient features are: The deformation zone at Kaynaşlı was approximately w = 110 m wide. The main rupture, the Dücze fault at Kaynaşlı, was near the south side of the deformation zone. The ratio of the width of the deformation zone in the hanging wall to that in the footwall of the main rupture was approximately w Hang w Foot = 6. The amount of shift across the deformation zone at the ground surface was 2.1 m at Kaynaşlı viaduct (Table 2). 21
22 In order to derive a solution with the theoretical model we assume that we know the fault width, Wf, and the amount of slip, S (Table 2, column 2) and do not vary these parameters. We vary dip angle, θ, and yield condition, (II e ε' ) c. We have an estimate of the dip angle for the entire Dücze Bolu fault but we use that estimate to check the result determined with the theory. The yield condition is an empirical parameter; as such, it is so abstract that we have very little knowledge about what it really might represent or what its value should be. All we can do with the yield value is compare the calculated values with the field and laboratory estimates of critical values of deviatoric strain reported in Table 1. As shown in the column for the deformation zone at the Kaynaşlı viaduct in Table 3, based on the known value of the parameter, w Hang w Foot the fault: θ = 44. = 6, we can use Figure 8a to compute the dip angle, θ, of Furthermore, we can use the dip angle, θ, and the normalized width of the deformation zone, w/s = 36, to estimate n, the exponent of the yield condition, n = The exponent can also be expressed in terms of the critical invariant of the deviatoric strains, that is, the yield criterion, (II e ε' ) c = or in terms of the representative critical strain, r ε' c = The value determined for the critical invariant, (II e ε' ) c is comparable to the high-end of values for fracturing at Granada Hills and the low-end of values for landslide debris (Table 1). The values of the parameters reported here were also computed by iteration, using a computer program, and are the same as those estimated from Figure 8. The computer program is available on a website, The computer solution provides some information about the beginning of formation of the deformation zone, which is not determined by the graphical solutions in Figure 8. It is only natural 22
23 to wonder how close the tip of the slipped fault is to the ground surface when the deformation zone begins to form. We have no observations, but the theory suggests an answer to the question. According to the computer solution, the tip of slip of the strike-slip fault at Kaynaşlı was approximately 74 m deep when the deformation zone began to form (Table 4). The width of the deformation zone was approximately 110 m, so the tip was quite shallow. The solution indicates that the tip of slip was approximately 76 m north of the trace of the ultimate surface rupture at Kaynaşlı (Table 4) as the deformation zone started to form. The value calculated for the dip angle of the fault near the southern end of the Dücze fault at Kaynasli is θ = 44 N, which is 10 lower than the one calculated by Bürgmann et al. [2002] for the entire Dücze fault, but both solutions provide a north dipping, strike slip fault. We have shown that the width ratio of w Hang w Foot = 6, as determined from strain measurements (Figure 11), indicates a dip angle of 44. If the fault angle were selected to be 54, as determined by Bürgmann et al. [Table 2, 2002], the calculated width ratio, w Hang w Foot = 4, would have been much smaller than that measured. A 10 difference in dip angles determined by these two quite different methods, however, would not be surprising. 490 Finally, we have noted in earlier pages that the calculations summarized in Figure 8 are for a 491 large, normalized fault width, which we selected to be W f S = The normalized fault widths for 492 problems solved with Figure 8 must be large in order for the solutions to be meaningful. Let us 493 examine the conditions assumed for fault width at Kaynaşlı, Wf = 20 km, according to Yagi and Kikuchi (Online). For a slip of 3 m, the normalized fault width W f S = This value is essentially infinite because the distance from the tip of the fault at the ground surface to the tip of the slipped 23
24 part of the fault, W f W ts, was approximately 106 m, two orders of magnitude smaller than 20 km, according to the computer solution, at the time permanent deformation began at the ground surface. The tip of slip was approximately 74 m below the ground surface and was 75.6 m north of the eventual surface trace of the upward propagating Dücze fault according to the solution Thus, the normalized width of the fault, W f S of the fault that remained to slip, = 6666, was much larger than the normalized width 502 W f W ts S = 1 S D ts 2 +w t when the deformation zone began to form at the ground surface according to the calculations for Kaynaşlı THRUST DEFORMATION ZONE AT CHUNG CHENG PARK, TAIWAN The ground rupture of the 1999 Chi Chi earthquake in Taiwan caused much of the damage to dwellings, large structures and infrastructure of communities through which the rupture passed [Taiwan Central Geological Survey (TCGS), 1999a, 1999b; NCREE, 2000; Kelson et al., 2001; Dong et al., 2003]. East of the city of Fengyuan, near the northern end of the Chi Chi rupture, the deformation zone along the ground rupture was about 350 m wide at Chung Cheng Park and in the hills to the south (Figure 13a). The Chung Cheng Park deformation zone was defined by opposite facing escarpments and smaller, internal structures (Figure 13b). The ground appeared to be undeformed to the east and west of the deformation zone. The escarpment on the west side of the deformation zone was the leading edge of the Chi-Chi thrust fault, which formed along the mountain front. It was west facing and 4.5 to 5 m high. Along 24
25 the leading edge of the Chi Chi rupture belt at the west side of the park was a disrupted zone about 15 m wide of intense deformation extending from the base to the crest of the western escarpment. The most severe building damage was in that area (Figure 13a). All the buildings were partly damaged to completely destroyed; many were tilted. The damage was mostly caused by ground deformation and fracturing [NCREE, 2000; Huang, 2006]. The escarpment on the eastern side of the deformation zone was east facing and up to 1.5 m high. It could be traced for about 250 meters across the valley bottom. Its height diminished toward the south, so the escarpment may well have formed only in the alluvium in the valley bottom. The geologic structures within the Chung-Cheng Park deformation zone along Han River include small anticlines and synclines, low monoclinal escarpments, fractures, and cracks. These small structures occur throughout the width of the deformation belt (Figure 13b). The most common structure in the asphalt road in the in Han River Valley was open fractures, tension cracks, and some high angle, reverse faults. There were several low amplitude, anticlinal and synclinal folds in the asphalt road. The relief of the folds ranged from 0.15 m to 0.3 m [Huang, 2006]. Dong et al. [2003] examined damage to man made structures in the residential development on the hilltop, south of Han River, and mapped a west facing, monoclinal escarpment with vertical uplift of 10 to 20 cm trending N 12 E in that area (Figure 13b). According to Lee et al. [2003], the western escarpment accommodated oblique shift, 6.5 m of left lateral and 2.5 m of reverse, dip shift. They inferred an underlying fault dipping approximately 60 east. We have chosen to analyze the faulting beneath Chung Cheng Park to be pure reverse faulting the toe of a thrust sheet in the theoretical model of the formation of the deformation zone. The small high angle reverse faults, low amplitude folds and fractures (Figure 13b), indicate 25
26 that the direction of maximum compression in the park was normal to the overall trend of the Chi Chi fault trace in the area. GPS data indicate that directions of horizontal components of displacement are normal to the trace of the Chi Chi earthquake rupture at the park [Yu et. al., 2001]. Although the Chung Cheng Park structure may well not have been a simple thrust toe, the much larger escarpment on the west side than on the east side, however, suggests that we can approximately analyze the structure as a thrust toe. The geometric parameters for the fault of the Chi Chi earthquake were determined by Kao and Chen [2000]: Fault length 80 km; fault width W f = 30 km; fault dip θ = 20 to 30 E. The deformation zone at Chung Cheng Park was highly asymmetric: the width ratio of hanging wall to foot wall was approximately w Hang w Foot = 12. The total width of the deformation zone was about 350 m. Our best estimate of the dip slip on the fault on the west side of the zone is 6 m (Table 5). The origins of the estimates of the parameters of the Chung-Cheng Park deformation zone are shown in Table As indicated in Table 5, two parameters were adjusted in order to model the shear zone at Chung Cheng Park: the exponential form of the critical yield condition, n, in 10 n, and the dip angle, θ, of the fault. Two parameters are fixed, the fault width, W f = 30x10 3 m and the amount of reverse slip, S = 6 m. Three other quantities were measured in the field and are therefore known: the width of the deformation zone in the hanging wall, w Hang, and footwall, w Foot, and the total width, w, of the deformation zone. 26
27 Using the curve for dip slip fault in Figure 8a, the value of w Hang w Foot = 11.5 corresponds to a dip angle of θ = 16.5, as recorded in Table 3. Using that dip angle and the normalized width of the 562 deformation zone, w S = 57 in Figure 8c, we can estimate the exponent of the critical second invariant of the deviatoric strains to be approximately 4.3, so that (IIε' e ) c = = (Table 3). Comparing the computed critical value, (II e ε' ) c, for the deformation zone at Chung-Cheng Park to the values determined empirically from field and laboratory measurements (Table 1), it is closer to the lower than the upper end of the range of values presented in the table. It is comparable to the low values for Aspen Grove landslide debris and the materials in the Granada Hills area, as well as the alluvium beneath the Kaynaşlı Viaduct (Table 1). Comparing the calculated dip angle θ = 16.5 E to dips estimated by others (Table 5), we see that it is near the lower end of the range of dips, 20 to 30 E, determined by Kao and Chen [2000] for most of the N S part of the Chi Chi rupture, and much smaller than the 60 E determined by Lee et al. [2003] for the Chung Cheng Park area. The computer solution provided some additional geometric information (Table 4): The deformation zone began to form when the tip of slip was approximately 428 m down the dip of the fault. The solution suggests that the tip of slip was at that time 122 m deep vertically and 410 m east, horizontally, from where the rupture at Chi Chi came to the ground surface (Table 4) THRUST DEFORMATION ZONE AT TANLIWUN, TAIWAN Parts of a deformation zone at Tanliwun, near Chushan, in the southern part of the Chi Chi rupture, have been described by Huang [2006], who mapped some features of the deformation zone in detail. Approximate boundaries of the deformation zone are shown in Figure 14a. The average 27
28 width of the deformation zone was w = 80 m. The escarpment at the leading edge of the thrust sheet was 1 to 2 m high. The trace of the escarpment rather closely followed the trace of the western edge of the foothills throughout the Tanliwun area (Figure 14a). A trench (Location A, Figure 14a) dug across the escarpment of the main Chi Chi rupture shows that the fault zone was 4 to 5 m broad and that about half the horizontal displacement of 3.4 to 4 m in 1999 was accommodated by the faults in Chushan trench (Figure 14c and 14d). The ground deformation exposed within the trench is restricted to the immediate vicinity of the escarpment and its subsurface counterpart [Huang, 2006]. Differential horizontal displacements of approximately one to two m were accommodated by the rest of the deformation zone. There are few deformation features west of the escarpment in the footwall of the Chi Chi rupture. Fractures in a Shanhu Yuan in the hanging wall of the Chi Chi thrust (Location B, Figure 14a) 60 m NE of the trench were mapped in detail in order to analyze the deformation in part of the hanging wall of the Tanliwun deformation zone (Figure 14b; Huang, 2006). All the features were a result of horizontal compression in the NE SW direction as well as sufficient horizontal tension NW SE to produce tension cracks. The direction of compression in the courtyard, then, was parallel to the direction of compression in the Chushan trench as indicated by the faulting and folding exposed in the trench. GPS data in the area also indicates that the direction of horizontal component of displacement is normal to the general trace of the Chi Chi rupture at Tanliwun [Yu et al., 1990]. The example of a deformation zone at Tanliwun is unusual in that we know the dip angle, θ, of the fault but not the width ratio, w Hang w Foot, of the deformation zone, so we use the dip angle to estimate the width ratio, for example with Figure 8a. A fault dip angle of 24 was calculated for the Chushan trench site using surface and subsurface information, including a borehole drilled NE of the trench 28
29 to intersect the fault [Chen et el., 2007]. The dip angle of the fault at Tanliwun is consistent with the dip angle of the Chi Chi fault over a broad area, generally 20 to 30 E The width ratios, w Hang w Foot, estimated according to field observations is highly variable, but appears to be generally large because the main rupture is near the leading edge of the deformation zone (Figure 14a). For a dip angle of 24 we can use Figure 8a to determine that the width ratio for the deformation zone at Tanliwun should be on the order of w Hang w Foot = 5 (Table 3). Other dimensional parameters for the fault were a fault length of 80 km and a fault width W f = 30 km according to a seismic study Kao and Chen [2000] (Table 6). The width of the deformation zone at Tanliwun ranges from w = 50 to 100 m (Figure 14). The amount of reverse slip near the ground surface was about 3 m in Chushan trench (Figure 14). We select values for two parameters in order to simulate the deformation zone at Tanliwun: The slip on the fault is 3 m and the dip angle of the fault is 24 E. Only one parameter, the critical yield condition, (II ε' e ) c, needs to be adjusted in order to analyze the shear zone at Tanliwun. 616 Examination of Figure 8a indicates that for a dip of 24 the width ratio should be w Hang w Foot = 5. We turn to Figure 8c, which relates the exponent, n, of (IIε' e ) c to the normalized width of the deformation zone and the dip angle. The width of the deformation zone ranges between 72 and 78 m and the slip on the fault was 3 m, so the normalized width of the deformation zone ranges 620 between w S = 24 and 26. Examining Figure 8c, we see that for a dip angle of 24, the exponent of (IIε' e ) c should range from about 3.8 to 3.9. Thus, we estimate (II e ε' ) c so that value would be (II ε' e ) c 1.3 to 1.6 x 10 4, which corresponds to a representative critical strain of
30 r ε' c (Table 3). This critical strain is close to the values determined at Granada Hills and landslide debris at Aspen Grove (Table 1). According to field observation, the width of the deformation zone ranges from 50 to 100 m, so the expected value is 75 m. We obtain 72 to 78 m from the numerical simulation (Table 6), which has the same expected value. According to the numerical solution, the deformation zone at Tanliwun began to form when the tip of slip on the fault was at a distance of W f W ts = 107 m from the fault tip at the ground surface to the tip of slip at depth, as measured along the fault. The tip of slip was at a depth of D ts = 44 m beneath the ground and 98 m east of the ultimate surface rupture at the trench (Table 4). The tip of slip was perhaps 50 m below and 30 or 50 m east of the Shanhu Yuan (Figure 14b) at that time. This result is consistent with the observation of E-W compressive deformation in the yard of the Shanhu Yuan (Figure 14b), which was probably a manifestation of the deformation zone BLIND, NORMAL COACTIVE FAULT AT NORTHRIDGE, CALIFORNIA The Winnetka deformation belts, which formed in during the 1994 Northridge, California earthquake in Los Angeles, was a two ply zone of relatively high strains consisting of a belt of extension on one side and a belt of compression on the other, each roughly 500 m wide, centered on Winnetka and extending at least 4.5 km in the NE SW direction. It is likely that the belts extended into areas of relatively high damage to buildings in the southwest in Canoga Park and in the northeast in Northridge and California State University at Northridge, in which case the belts could have been 9 km long [Cruikshank et al., 1996]. The Winnetka deformation belts were detected in unprecedented detail by resurveys of subsurface monuments before and after the 1994 earthquake. The relative horizontal positions of monuments at most street intersections and in places between street intersections had been 30
31 measured throughout Los Angeles after the 1971, San Fernando earthquake sequence. In cooperation with the City of Los Angeles, we resurveyed part of the Winnetka area in 1995 in order to establish the NW and SE boundaries of the Winnetka deformation belts [Cruikshank et al., 1996]. In part of the deformation belts we measured lengths of street segments and angles between intersecting streets in the NE part of the Winnetka deformation zone (Figure 15) so that we could compute strains and investigate the internal structure of the deformation belts. The strains are shown via strain figures, shmoos and nerds, that are read as explained in the figure caption. Briefly, where the magnitude of the extension is greater than the compression, the strain figure is a shmoo. Where the magnitude of compression is greater than the extension, the strain figure is a nerd. The construction of the shmoos and nerds is explained in Appendix B. The survey data and computational methods are presented in Johnson et al. [1996a] and Cruikshank et al. [1996]. The shmoos and nerds are largely segregated into different rectangular belts within the deformation zone. Most of the shmoos are in the upper left belt shown in the figure, which is the belt of predominant NW SE extension normal to walls of the zone. The nerds are in the lower right belt in the figure generally reflecting NW SE compression normal to the walls of the zone. The ground rupture and damage to the infrastructure correlated in kind and position with the extension and compression belts within the deformation belts but no surface rupture could be identified [Cruikshank et al., 1996]. Although we mapped predominantly tension fractures in the NE end of the Winnetka extension deformation belt, there were scant signs of damage to streets or sidewalks within the compression deformation belt. The extensions measured in the NE belt of the Winnetka zone on either side of Tampa Avenue and between Parthenia and Chase streets (Figure 15) were apparently large enough, on the order of 10 3 to , to fracture concrete and soils. The fractured ground in the NE part of the deformation zone, though, must have been brittle, 31
32 fracturing at relatively small strains. The damage in the area of the compression belt was small, and the magnitudes of the larger compressive strains were on the order of , one third to one fifth the magnitude of the extensile strains. The strains in the Winnetka area were generally smaller than the strains in the Granada Hills area; the damage was much higher in the Granada Hills area also [Johnson et al., 1996a]. These observations suggest that the deformation in Winnetka area could have been largely elastic and thus it is unclear whether a classic deformation belt formed at Winnetka. It is unclear whether there were permanent ground deformations outside the NE part of the Winnetka zone, near intersections of Parthenia and Chase streets with Parthenia (Figure 15). Not only are we uncertain whether the Winnetka zone is a classic deformation zone, like those at Kaynaşlı, Chung-Cheng Park and Tanliwun, but we found no trace of a fault rupturing the ground surface, suggesting that, if the pattern of strains is a result of faulting, as we suppose, the fault must be blind. Following are the salient features of the deformation belts at Winnetka: (1) The deformation belts are defined primarily by elevated strains and secondarily by damage to sidewalks, roads, houses and utilities. The width of the zone of measureable strains is 1.5 to 1.6 km at Winnetka. (2) The shmoo and nerd extension figures show that the directions of principal extensions are parallel and normal to the walls of the deformation belts. (3) One of the striking characteristics of parallel belts of the Winnetka zone of shmoos and nerds, therefore, is that the maximum extension in the extension belt is parallel to the maximum compression in the compression belt (Figure 15). (4) The Winnekta zone contains a belt of NW SE extension with a width of w E = 0.94 to 1.05 km and a belt of NW SE compression with a width of w C = 0.60 to 0.53 km. Thus it is not due to a strike slip blind fault, but rather to a normal or a reverse blind fault. (5) If the strains that we measured in the 32
33 in the compression belt were permanent, we would estimate that the critical yield value would have to be unusually small, approximately, (IIε' e ) c 10 7 (an equivalent critical strain of -3 x 10 4 ). The strains are also unusually small in the extension belt, except in the NE part of the extension belt, where the ground was clearly fractured. If that area had permanent deformation, critical values of the deviatoric strain invariant were rather low (II e ε' ) c 10 6 to 2.5 x This range is still low, but more nearly consistent with the values we have estimated or calculated elsewhere (Table 1). The training simulations (Figure 5, Figure 6 and Figure 7) provide all the clues needed to determine that the pattern at Winnetka is expected for a blind, normal, dip-slip fault. Figure 5 shows strain patterns associated with blind strike-slip and dip-slip faults. According to Figure 5b: (1) For a dip-slip fault, the strains normal to the strike of the fault change sign across the vertical projection of the tip of slip to the ground surface. (2) The largest strain magnitude is in the belt of compression for a reverse fault and, by analogy, in the belt of extension for a normal fault. (3) The strain is essentially zero at the vertical projection of the tip of slip. (4) The strains are the same sense as the fault (i.e., extensile for a normal fault) in front of the vertical projection of the tip of slip; they are opposite behind the projection. According to Figure 6 and Figure 7, the strain with largest magnitude is compressive for the reverse fault and extensile for the normal fault. The dip direction of the blind fault is also determined by the ratio, w C /w E, where w C is the width of the compression belt and w E is the width of the extension belt. If the ratio is less than one the fault is a normal fault. If the ratio is greater than one the fault is a reverse fault (Figure 5b2). In order to analyze the deformation zone at Winnetka we assume that there is a blind dip slip fault (i.e., invisible to the eye), normal or reverse, the slip on which terminated below the Winnetka deformation zone. The fault slip is fixed for the analysis: it is assumed to be S = 1.6 m (for reason noted in Table 7). The fault width is also fixed for the analysis: it is assumed to be W f = 3 km in 33
34 width. The estimate of the width is weak, based only on the width of the Chatsworth Reservoir normal fault in San Fernando Valley [Huftile and Yeats, 1996, Figure 4a]. Whether the blind fault is a normal fault or a reverse fault is determined by the ratio, w E /w C, where w C is the width of the compression belt and w E is the width of the extension belt. If the ratio is greater than one the fault is a normal fault. If the ratio is less than one the fault is a reverse fault. The direction of the dip is determined by the pair of belts. The fault dips beneath the narrower zone. Thus, as illustrated for the blind reverse fault in Figures 5b1 and 5b2, the fault dips beneath the narrower extension belt. If the fault were normal, the two belts would switch positions, and the fault would dip beneath the narrow compression belt. Clearly the fault beneath the Winnetka deformation zone is a normal fault. Since the wide extension belt is NW of the narrow compression belt, the fault is normal and the downthrown side is on the SE side of the fault. We have used an analysis of a blind rectangular dislocation/fault in an elastic medium in order to determine the parameters. We cannot use the analysis for the deformation zone in this case, because the strains are generally too small for there to have been much permanent deformation, except in the NE end of the Winnetka extension belt (Figure 15). The analysis is implemented in a computer program, SeGaLiFaRF v 1.46, (2008), available on the website, Thus, we use the parameters already defined in order to make analytical diagrams. In keeping with the accuracy of strain measurements by surveying, we assume that the edges of the strain belts are defined by a normal strain of This is the strain in the direction normal to the boundary between the compression and extension belt; at Winnetka, the normal strains trend NE. In principal, the solution provides a way of determining the depth to the tip of slip on the fault, D ts. Figure 16a 34
35 shows the relation between depth to the tip of slip, D ts /S, where S is the slip, to the normalized total width of the pair of strain belts, w/s. The relations are slightly different for different dip angles of the fault, as indicated by the bundle of curves for dips ranging from 35 to 70, but the differences are small. The values of measurements and the solution for the depth to the tip of slip of the blind fault are shown in Table 7. We see that the depth to the upper end of the blind fault was Dts 350 to 370 m at the time the Winnetka strain belts formed. Using this estimate of D ts /S = 220 to 230 and measurements of the width of the extension belt, w E, to the compression belt, w C, to form the ratio, w E /w C = 1.6 to 2, we use Figure 16b to determine than the dip angle of the fault was approximately, θ 50 to 58. In this way, the values were obtained for the two unknown parameters, D ts, the depth to the upper end of the blind fault and θ, the dip angle of the fault. A third diagram, Figure 16c, shows another way of estimating the normalized depth to the tip of slip D ts /S, in terms of the maximum normal strain, normal to the walls of the belt, within the extension belt. With Figure 16c we determined that D ts /S = 220 to 230. With Figure 16c we determine that, since the largest strain in the extension belt, outside the NE part of the belt where ground fracturing occurred, is on the order to 10-3, perhaps as large as , the depth ratio of the tip of slip should be approximately D ts /S = 200 to perhaps as low as 100. We estimated 220 to 230 by the first method DISCUSSION AND CONCLUSIONS The development of deformation zones, a phenomenon that is still relatively unknown or ignored in earthquake engineering and geoscience communities, complicates the commonly applied, simple notion of a construction setback from traces of active faults. The notion of the simple setback is that structures built across known active faults in earthquake prone areas are expected to 35
36 be damaged by fault offset of their foundations, of course, but structures built near the faults are expected to be undamaged by ground deformation if they are built beyond certain distance from the fault traces. Engineering structures are, however, damaged in many ways during earthquakes. It is well known that earthquakes cause damage to engineering structures by ground shaking, faulting, and various kinds of foundation soil failures. It is much less well known that much of the damage to engineering structures near a fault can be due to two other distinctly different earthquake phenomena: ground lurching on the one hand and ground distortion on the other [Gür, 2004]. Ground lurching and distortion are quite distinct from ground shaking although they can all occur together. In this paper, we are considering ground distortion within deformation zones that are closely associated with slip on faults. The theoretical model used to analyze strike slip and reverse slip deformation zones at Kaynaşlı, Turkey and Chi Chi, Taiwan is based on the assumption of permanent (elastic plastic) deformation at the ground surface and along the fault at depth as slip propagates along the fault toward the ground surface. The theory suggests that the width of the deformation zone and the position of fault rupture within the deformation zone are determined by parameters including the material properties of ground near the fault, geometric properties of the fault and the amount and sense of slip of the fault. Although the geometric variables in the theory are clearly relevant to the phenomenon, the material properties assumed for the ground by the theory are so elementary that they may be inadequate to describe the phenomenon. Besides elastic properties, we characterize the permanent yielding of the ground in terms of a single parameter, various identified as an exponent, n, or a critical second invariant of elastic strain, (II e ε' ) c. The theoretical model, although clearly incomplete and somewhat cobbled together, is our most recent attempt to quantitatively study 36
37 and, at some level, to understand why deformation zones should form along earthquake ruptures and how their geometric properties might be interrelated. According to the analysis of the deformation-zone mechanism, the ratio of widths of deformation zone in hanging wall and footwall of dipping faults, w Hang w Foot, is largely controlled by fault dip angle and the kind of fault the relations are different for strike slip and dip slip faults (Figure 787 8a). The relations are independent of the value of the yield condition, (IIε' e ) c. Thus, if one knows the dip angle and type of a fault, the model will determine a width ratio, w Hang w Foot. Or, if one knows the width ratio, the model will determine a dip angle for the fault. The analysis indicates that total width of the deformation zone, w = w Hang + w Foot, normalized with fault slip during the earthquake, w/s, is determined by two parameters, the dip angle, θ, and the exponent, n, of the yield condition, (II ε' e ) c, as well as whether the fault is dip-slip (Figure 8c) or strike-slip (Figure 8b). We have applied the theoretical model to deformation zones along the strike slip, Dücze Bolu fault at Kaynaşlı, Turkey and two thrust deformation zones of quite different widths along the Chi Chi earthquake rupture at Cheng Chung Park and Tanliwun, Taiwan. The parameters are compared in Table 3. Quantitative analyses of the deformation zones illustrate how one uses the theoretical model to characterize the deformation zones mechanically and show that the theoretical values of parameters agree quite well with strain measurements, dip angles and other data determined from geophysical and geological studies. The theoretical model also helps one to interpret the Winnetka deformation belts that formed above the Winnetka blind fault during the 1994 Northridge earthquake (Table 7). 37
38 We have some information about the internal consistency of the parameters identified with the theory, particularly the parameters of width ratio, w Hang w Foot, and dip angle of the fault. For example, theoretically the width ratio, w Hang w Foot, is related only to the fault dip angle, θ. We have an internal check with these variables, then, if they are both measured. The dip angle was determined independently with GPS measurements and dislocation theory by Bürgmann et al. [2002] to be on average, θ = 54 N for the entire Dücze-Bolu fault. With the deformation-zone analysis, we used the observed width ratio, w Hang w Foot = 6 to determine that the dip angle of the Dücze-Bolu fault at Kaynaşlı was θ = 44 N (Table 2). The values for dip angle are remarkably close, since Bürgmann s estimate was for the whole length (40 km) and width (20 km) of the fault whereas ours is for a relatively short segment of the fault. Difference in scales of the analyses are suggested by the fact that our results indicate that the deformation zone at Kaynaşlı is a result of a highly localized process, that the zone started to form when the tip of slip was only about 74 m beneath the ground surface. The width ratio was measured at Chung Cheng Park, but the estimates of dip angle are rather wild, ranging from 20 to 60 E (Table 5). Accepting the dip angles of 20 to 30 determined for a large part of the fault by Kao and Chen [2000], the lower end of their dip measurements are close to our computed value of about 17 E. Thus, the width ratio and dip angle were both known moderately well at Chung-Cheng Park, so one can conclude that the dip parameter is internally consistent with the width ratio and Chung-Cheng Park as well as at Kaynaşlı. We have only weak checks of consistency for other parameters because they are related, theoretically, through the yield condition, (II ε' e ) c, which is rather poorly controlled. Indeed, the only values of (II ε' e ) c that we have computed independently are presented in Table 1, for landslide debris, 38
39 824 concrete and asphalt, and a very brittle granite. Theoretically, the yield condition, (II ε' e ) c, is determined by the dip angle, θ (or width ratio, w Hang w Foot zone and the type of fault Figure 8b and Figure 8c. ), the normalized width, w S, of the deformation The only check we have on internal consistency of these variables comes from the values of the yield condition, (II ε' e ) c. Ignoring the extremes in Table 1, the range of values is 10 4 (II ε' e ) c Comparing this range of the yield values with the range of yield values calculated from the 830 deformation zones, (II ε' e ) c , Table 3, we see that calculated values for the deformation zones are somewhat smaller than the range estimated from field and laboratory observations. Even though the estimated values of the yield condition, (II e ε' ) c, might appear to be consistent, we would maintain that the parameter (II e ε' ) c must be considered to be merely an empirical constant that cannot be understood physically in our analyses but rather is used merely for curvefitting. The parameter (II e ε' ) c is not derived from fundamental properties of materials. Thus, we conclude that one needs to be able to understand how deformation zones form so that their characteristics, including total width, partitioning of the distortion on either side of the fault trace and the amount of distortion to be expected at various places within the zone. We have posited in this paper a credible mechanism of formation of a deformation zone based on observations of several examples in the field, a few of which are described herein. The mechanism suggested here appears to lead to a plausible explanation for many of the features we have observed in deformation zones. More important, however, analysis of the mechanism suggests a set of parameters that appear to characterize many features of deformation zones. Knowledge of the characteristic parameters such as dip of the fault, the sense and amount of slip on the fault, the width of the deformation zone, 39
40 and an estimate of the yield criterion should help one predict the widths of the deformation zone in the handing wall and footwall of the fault, the depth of the tip of slip at which the deformation zone will begin to form. Knowledge of the mechanism, plus practical knowledge from field study of deformation zones associated with various kinds of fault that have ruptured to the ground surface, therefore, guide the observations, measurements and calculations needed to characterize what a deformation zone will most likely be like along a fault in an unfamiliar area. 40
41 852 References Cited Akyüz, H. S., R. Hartleb, A. Barka, E. Altunel,, G. Sunal, B. Meyer, and R. Armijo (2002), Surface Rupture and Slip Distribution of the 12 November 1999 Düzce Earthquake (M 7.1), North Anatolian Fault, Bolu, Turkey, Bull. Seismol. Soc. Am., 92(1), Atkinson, B. K. (1987), Fracture mechanics of rock, 534 pp., Academic Press, London. Aydin, A., A. M. Johnson,, and R. Fleming (1992), Right lateral/reverse surface rupturing along the San Andreas and Sargent fault zones during the October 17, 1989 Loma Prieta, California, earthquake, Geology, 20, Baum, R. L., R. W. Fleming, and A. M. Johnson (1993), Kinematics of the Aspen Grove landslide, Ephraim Canyon, central Utah, Open File Rep. 1842F, 34 pp., U.S. Geological Survey Bulletin. Baum, R. L., A. M. Johnson, and R. W. Fleming (1988), Measurement of slope deformation using quadrilaterals, Open File Rep. 1842B, 23 pp., United States Geological Survey Bulletin. Barka, A., and E. Altunel (2000), Preliminary report on whether the Asursu Valley is active fault controlled. Unpublished consulting report to ASTALDI BAYINDIR Co., 28 pp. Bürgmann, R., M. E. Ayhan, E. J. Fielding, T. J. Wright, S. McClusky, B. Aktug, C. Demir, O. Lenk, and A. Türkezer (2002), Deformation during the 12 November 1999 Düzce, Turkey, Earthquake, from GPS and InSAR Data, Bull. Seismol. Soc. Am., 92(1), Chen, W. S., C. C. Yang, I C. Yen, L. S. Lee, K. J. Lee, H. C. Yang, H. C. Chang, Y. Ota, C. W. Lin, W. H. Lin, T. S. Shih, and S. T. Lu (2007), Late Holocene Paleoseismicity of the Southern Part of the Chelungpu Fault in Central Taiwan: Evidence from the Chushan Excavation Site, Bull. Seismol. Soc. Am., 97(1), pp Cruikshank, K. M., A. M. Johnson, R. W. Fleming and R. Jones (1996), Winnetka deformation zone: Surface expression of coactive slip on a blind fault during the Northridge earthquake sequence, California, Open file Rep , 70 pp., U. S. Geological Survey. Dong, J. J., C. D. Wang, C. T. Lee, J. J. Liao, and Y. W. Pan (2003), The influence of surface ruptures on building damage in the 1999 Chi Chi earthquake: a case study in Fengyuan City, Engineering Geology, 71, Fleming, R. W., and A. M. Johnson (1989), Structures associated with strike slip faults that bound landslide elements, Engineering Geology, 27, Fleming, R. W., J. A. Messerich, and K. M. Cruikshank (1998), Fractures along a portion of the Emerson fault zone related to the 1992 Landers, California, earthquake: Evidence for the Galway Lake Road rotated block, Geological Society of America Map and Chart Series MCH082, scale 1:3,000. Fleming, R. W., and A. M. Johnson (1997a), Growth of a tectonic ridge, Geology, 25,
42 Fleming, R. W., A. M. Johnson, and J. A. Messerich (1997b), Growth of a tectonic ridge, Open file Report , 94 pp., 6 Plates, U. S. Geological Survey. Gamond, J. F. (1983), Displacement features associated with fault zones: a comparison between observed examples and experimental models, Journal of Structural Geology, 5, Gilbert, G. K. (1907), The earthquake as a natural phenomenon, in The San Francisco Earthquake and Fire, U.S. Geological Survey Bulletin 324, Gür, T. (2004), Earthquake effects on articulated structures location in fault rupture zones, Ph.D. dissertation, 191 pp., Purdue University in West Lafayette, Indiana, May Hansen, B. (1961), Shear box tests on sand, Proc. 4 th. International Conference on Soil Mechanics, 1, Huftile, G. J. and R. S. Yeats (1996), Deformation Rates across the Placerita (Northridge Mw = 6.7 Aftershock Zone) and Hopper Canyon Segments of the Western Transverse Ranges Deformation Belt, Bull. Seismol. Soc. Am., 86(1B), S3 S18. Huang, W. J. (2006), Deformation at the leading edge of thrust faults, Ph.D. dissertation, 435 pp., Purdue University in West Lafayette, Indiana, July. Johnson, A. M., R. W. Fleming, and K. M. Cruikshank (1993), Broad belts of shear zones as the common form of surface rupture produced by the 28 June 1992 Landers, California, earthquake, Open File Rep., , 61 pp., United States Geological Survey. Johnson, A. M., K. M. Cruikshank, and R. W. Fleming (1994a), Borrego Mountain, Loma Prieta, Landers, Northridge: Simply earthquakes or seismostructural events? Abstract T41B 7, Spring American Geophysical Union Meeting, Baltimore, Maryland. Johnson, A. M., R. W. Fleming, and K. M. Cruikshank (1994b), Shear zones formed along long, straight traces of fault zones during the 28 June 1992 Landers, California, Earthquake, Bull. Seismol. Soc. Am., 84(3), Johnson, A. M., R. W. Fleming, K. M. Cruikshank, and R. F. Packard (1996a), Coactive fault of the Northridge earthquake Granada Hills area, California, Open file Rep , 66 pp., U. S. Geological Survey. Johnson, A. M., R. W. Fleming, S. Y. Martosudarmo, N. A. Johnson, K. M. Johnson, and W. Wei (1996b), Analecta of structures formed along strike slip fault zones during 28 JUNE 1992 Landers, California earthquake sequence, Open file Report , 59 pp., 10 plates, U. S. Geological Survey. Johnson, A. M., R. W. Fleming, K. M. Cruikshank, S. Y. Martosudarmo, N. A. Johnson, K. M. Johnson, and W. Wei (1997), Analecta of structures formed during the 28 June 1992 Landers Big Bear, California, earthquake sequence, Open File Report, 97 94, 59 pp. U.S. Geological Survey. 42
43 Johnson, A. M., K. M. Johnson, J. Durdella, M. Sözen, and T. Gür (2002), An emendation of elastic rebound theory: Main rupture and adjacent belt of right lateral distortion detected by viaduct at Kaynasli, Turkey 12 November 1999 Dücze earthquake, Journal of Seismology, 6, Kao, H., and W. P. Chen (2000), The Chi Chi earthquake sequence: active, out of sequence thrust faulting in Taiwan, Science, 288, Kelson, K. I, Kang, K. H, Page, W. D., Lee, C. T. and Cluff, L. S. (2001), Representative styles of deformation along the Chelungpu fault from the 1999 Chi Chi (Taiwan) Earthquake: Geomorphic Characteristics and responses of man made structures, Bull. Seismol. Soc. Am., 91(5), Lawson, A. C. (1908), The California earthquake of April 18, Report of the State Earthquake Investigations Commission, Carnegie Institute of Washington Publication 87(1), 451 pp.. Lazarte, C. A., J. D. Bray, A. M. Johnson, and R. E. Lemmer (1994), Surface breakage of the 1992 Landers earthquake and its effects on structures, Bull. Seismol. Soc. Am., 84(3), Lee, Y. H., M. L. Hsieh, S. D. Lu, T. S. Shih, W. Y. Wu, Y. Sugiyama, T. Azuma, and Y. Kariya, (2003), Slip vectors of the rupture of the 1999 Chi Chi earthquake, western Taiwan, Journal of Structural Geology, 25, Martosudarmo, S.Y., A. M. Johnson, and R. W. Fleming (1996), Ground fracturing on the southern end of Summit Ridge caused by the October 17, 1989 Loma Prieta, California earthquake, Open File Rep., , 43 pp., 5 plates, U.S. Geological Survey. Morgenstern, N. R. and J. S.Tchalenko (1967), Microscopic structures in kaolin subjected to direct shear, Géotechnique, 17, NCREE: Taiwan National Center for Research on Earthquake Engineering, Chi Chi earthquake database analysis and management system (in Chinese), Peng, S. and A. M. Johnson (1972), Crack growth and faulting in cylindrical specimens of Chelmsford granite, International Journal of Rock mechanics and Mining Sciences, 9, Reid, H. F. (1910), Report of the State Earthquake Investigation Commission, II: The mechanics of the earthquake. Carnegie Institution of Washington, Washington, D. C., 192 pp.. Steinbrugge, K. V., E. E. Schader, and D. F. Moran (1973), Building Damage in San Fernando Valley, in San Fernando, California, Earthquake of 9 February 1971, vol. 196, edited by G. Oakeshott, pp , California Division of Mines and Geology, Bulletin. Taiwan Central Geological Survey (1999a), Surface ruptures along the Chelungpu fault during the Chi Chi earthquake, Taiwan, Map at scale 1:25,000, Central Geological Survey, MOEA, Taipei. Taiwan Central Geological Survey (1999b), Report of the geological survey of the 1999 Chi Chi earthquake (in Chinese), Central Geological Survey, MOEA, Taipei. 43
44 Vailon, P., M. Ruhland, and J. Grolier (1976), Elements de Tectonique Analytique, 118 pp., Masson, Paris. Wallace, R. E. (1973), Surface fracture patterns along the San Andreas fault, in Proceedings of the Conference on Tectonic. Yagi, Y., and M. Kikuchi, (Online), The 1999 Turkey Earthquake, ERI, University of Tokyo, Japan, Available: tokyo.ac.jp/yuji/trk2. Yu, S. B., L. C. Kuo, Y. J. Hsu, H. H. Su, C. C. Liu, C. S. Hou, J. F. Lee, T. C. Lai, C. C. Liu, C. L. Liu, T. F. Tseng, C. S. Tsai, and T. C. Shin (2001), Preseismic Deformation and Coseismic Displacements Associated with the 1999 Chi Chi, Taiwan, Earthquake, Bull. Seismol. Soc. Am., 91(5),
45 970 FIGURE CAPTION Figure 1. Idealized ground deformation along earthquake ruptures with pure right lateral, strike slip for a fault of finite length. The senses of distortion are indicated via exaggerated deformation of squares into parallelograms. a. Map view of the trace of a strike slip fault (dashed vertical line). Passive marker, ab, placed across the area just prior to earthquake rupturing. b. Essence of classic elastic rebound theory [Reid, 1910]. When the traction on the fault suddenly drops, the fault slips and slip propagates to the ground surface, offsetting the passive marker. The passive marker appears as two deformed line segments, ac and db, broken by the fault. Note that the offset on the fault is right lateral, but the deformed line and passive squares indicate that the rock on either side of the fault was distorted in a left lateral sense as a result of elastic rebound. The sense of shearing in rebound is illustrated via the exaggerated deformation of squares into parallelograms on either side of the fault. c. A zone of permanent right lateral deformation the deformation zone includes the right lateral fault. The deformation zone is bounded on either side by elastic rebound that dies off with distance from a fault of finite length. [Fleming et al., 1997a; 1997b]. Initial conditions were the same as in part a, but a deformation zone a zone of permanent, right lateral deformation straddles the main, right lateral rupture the slip on which propagated to the ground surface (in mode III). d. Same as c, but main rupture near one side of deformation zone Figure 2. Propagation of strike slip or dip slip along vertical or inclined faults. This paper is a study of the deformation zones formed at the ground surface for these two kinds and four varieties of faults. a. Right lateral, strike slip faults with different dips. Slip propagates in mode III toward the ground surface. b. Dip slip, reverse faults with different dips propagating in mode II toward the ground surface
46 Figure 3. Simulation of propagation of uniform slippage toward the ground surface along an existing fault. Slip zero in front of tip of slip. Slip uniform along slipped part of fault. a. Cross section of fault of width, Wf, dipping at θ = 30. b. At time t 1, first increment of dislocation of width δd 1 slips a certain amount. c. At time t 2, a second dislocation with the same width is added in front of the first, making the total width of the dislocation δd 1 + δd 2 = W d. The slip, though, remains the same for δd 1, δd 2, and W d. d. Another dislocation with the same width is added to the first two δd 1 + δd 2 + δd 3 = W d. e. Four more incremental dislocations added seqentially until the slip reaches the ground surface and W d = W f. The slip is finally uniform over the width of the fault, W f Figure 4. Relation between second invariants of deviatoric stress, II σ', and deviatoric strain, II ε' for elastic plastic material. Deformation path for continuous loading of the elastic plastic material at a point on the ground surface. At four time steps, four dislocations are added to the idealized fault, as in Figure 3. The slope of the relation between invariants II σ' and II ε' e is proportional to the square of twice the shear modulus, G. The relation is linear for times, t 1, t 2, t 3, as three incremental dislocations are added because the loading is within the elastic range. Yielding is impending at time t 3 ; the second invariant of deviatoric stress is at the critical value (II σ' ) c = k 2, where k is yield strength, and the second invariant of deviatoric elastic strains is at its critical value also, (II ε' e ) c = ( k 2G ). With continued loading between times t 3 and t 4, II σ' remains equal to k 2 whereas the total 1015 strain invariant, IIε', increases because it includes both elastic and plastic strains, and exceeds (II e ε' ) c. 46
47 Figure 5. Development of zones of permanent deformation at ground surface over low angle, 30 dip, strike slip fault and dip slip fault. Each figure consists of a map view of strains and a cross section of the fault and the part of the fault that has slipped. The depth to the lower end of the fault is Df = W f /2, where W f is the width of the fault. The fault slip, S, is W f. If W f were 5 km, the depth to where the slip started would be at the depth D f = 2500 m and the fault slip would be S =1.5 m. a. Right-lateral strike-slip fault. Stages of formation of zone of permanent deformation at ground surface caused by mode III propagation of strike slip. (1). The slip has propagated over 90% of the width, W f, of the fault ( W d W f = 0.9), from the lower end of the fault at a depth of D ts = 2500 m to a depth Dts = 500 m. (2). The slip has propagated over 93 % of the fault width ( W d W = 0.93) so the depth f to the tip of slip is Dts = 350 m. (3). Slip has propagated over 97 % of the fault width ( W d W = 0.97). f The depth to the the tip of slip is Dts = 150 m. (4). Slip has propagated to ground surface. b. Reverse, dip-slip fault. Stages of formation of zone of permanent deformation caused by propagation of slip in mode II of a low angle, reverse, dip slip fault toward the ground surface. Depth of each stage same as for strike-slip fault Figure 6. Idealized zones of permanent deformation for strike slip and reverse slip faults dipping at different angles. Faults in rows 1 and 2 dip to the right in the views. Slip has propagated to the ground surface; W d W f = 1. a. Right lateral, strike slip fault. All strains within the zones of permanent deformation display right-lateral sense like the sense of slip on the fault whereas strains outside of the zones display leftlateral sense. 1. Fault dip 30 (to right); w Hang w Foot >> 1. The width of the zone of permanent deformation in the hanging wall is definitely wider than that in the footwall. 2. Dip angle 60 (to right); w Hang w Foot Width of the zone of permanent deformation in the hanging wall is approximately triple that in the footwall; 3. Dip of fault 90 ; w Hang w Foot = 1. Zone of permanent deformation bisected by the rupture
48 b. Reverse, dip slip fault. 1. Fault dip 30 ; w Hang w Foot 3. The width of the zone of permanent deformation in the hanging wall is approximately triple that in the footwall. 2. Dip angle 60 ; w Hang w Foot 1. Width of the zone of permanent deformation is only slightly larger in the hanging wall. Compressive strain somewhat larger next to fault in hanging wall than in footwall. Away from fault trace the strains are compressive in footwall and extensile in hanging wall. 3. Dip of fault 90 ; w Hang w Foot = 1. Zone of permanent deformation bisected by the rupture; perfectly symmetric about fault trace. Extensile strain in direction normal to fault trace in uplifted block; compressive strain in same direction in downthrown block Figure 7. Final zone of permanent deformation for a dip slip, normal fault dipping at 60 and a dip slip, reverse fault dipping at the same angle. a. The normal fault. The magnitude of the extensile strain closest to the fault is larger than anywhere. Away from fault trace the strains normal to the trace of the fault are extensile in the footwall block and compressive in the hanging wall. b. The reverse fault. The magnitude of the compressive strain closest to the fault is larger than anyway. Away from fault trace the strains normal the trace of the fault are compressive in the footwall block and extensile in the haning wall Figure 8. Relations among variables for zones of premanent deformation. The normalized width of the fault is constant, W f /S = C-C PK is Chung-Cheng Park. The curves show that the width ratio, w/s is sensitive to the fault type, the dip angle, θ, and the critical second invariant, (II ε' e ) c. a. Width ratio, w Hang w Foot, as a function of fault dip, θ, and fault type. The relations have been plotted for a wide range of values of (IIε' e ) c, the critical second invariant of deviatoric strains, but the plots superpose nearly perfectly so the relations are apparently independent of the critical second invariant. 48
49 b. Strike-slip faults. The ratio, w/s, of the total width of the deformation zone to the fault slip, as a function of the fault dip angle, θ, and the exponent, n, of the critical second invariant. c. Dip-slip faults. Relations among the same variables but for dip-slip faults Figure 9. View south of the village of Kaynaşlı and some of the piers that support the two highway ribbons of the Kaynaşlı viaduct. A corner of each pier provides a point in a quadrilateral, which was resurveyed after the earthquake to determine ground deformation near the earthquake rupture. The piers are spaced approximately 39 m apart longitudinally and 21 m apart transversely to the axis of the viaduct Figure 10. Trace of main rupture beneath Kaynaşlı Viaduct. Rectangles represent pier caps. (After figure prepared by ASTALDI BAYINDIR Co.). The deformation zone is about 110 m wide, mostly north of the main rupture, and the viaduct intersects the earthquake rupture at an angle of approximately Figure 11. Distribution of maximum shear strain across the width of the right lateral deformation zone at Kaynaşlı viaduct. Vertical axis is distance normal to the trace of the main rupture. Origin of vertical coordinate is at pier 46. Points represent average strains for quadrilaterals of four piers (e.g., 39 is for piers 38L, 38R, 39L, 39R). Two plots show measurements for two different corners of each pier. There are no survey data for piers 54 and 55. Shearing apparently was negligible between piers 48 and 57. Shear zone extends at least from pier 38 to pier 48. Highest shearing was between piers 44 and 49, of course, where the main rupture passed beneath the viaduct (Figure 10). Belt of high shearing extends from approximately 20 m to +90 m, so the right lateral shear zone is approximately 110 m wide Figure 12. The Kaynaşlı right lateral deformation zone. The double headed arrows show azimuths of maximum extension along the viaduct. Orientations indicate right lateral shearing between piers 49
50 and 48, and left lateral shearing between piers 34 and 36. Strains were too small to analyze south of the deformation zone so the left lateral shearing indicated there is hypothetical Figure 13 Deformation features in Chung Cheng Park. The structures shown on the two maps are collated data by the senior author and data from maps (corrected by senior author) by Kelson et al. [2001] and Dong et al. [2003]. a. Escarpments on each side of deformation zone and distribution of building damage. Two opposite facing escarpments, a monoclinal thrust escarpment on the west and a monoclinal escarpment on the east bound the deformation zone. Square, triangle or circle shows location of a damaged building [NCREE, 2000]. Buildings were damaged mostly within the deformation zone but damage was especially high near the west facing escarpment. b. Deformation features between the two opposite facing escarpments. The features include removed bridge, high angle reverse faults, fractures, cracks and low amplitude folds Figure 14. Deformation zone in Tanliwun area near Chushan, Taiwan. a. The two dotted lines are approximate boundaries of the deformation zone. The solid line, with tick marks indicating downthrown side, is the trace of the crest of the thrust escarpment. The east (right) side of the escarpment was lifted up one to two m relative to the west side. Point A is site of Chushan trench, through which the main rupture passes. Point B is Shanhu Yuan that exposes the deformation zone in the hanging wall. b. Setting and traces of larger fractures in the Shanhu Yuan (point B, Figure a.). The courtyard and road were paved with asphalt. The kinematics of all the fractures in the asphalt were a result of horizontal compression in the NE SW direction as well as sufficient horizontal tension NW SE to produce tension cracks. c. and d. Traces of larger faults in the walls of Chushan trench. At this high level of simplification, the two views expose two main faults (U for upper and L for lower) and two main folds, an upper anticline in the N wall (left) and a lower syncline in the S wall (right). 50
51 c. The N wall exposes an asymmetric anticline underlain by a reverse fault (L) dipping toward the NE. The fault is antilistric. Its maximum dip is 27 and its maximum apparent slip is 3 m. The beds in the hanging wall, in the lower limb of the anticline, are vertical. The beds in the footwall of the fault are essentially horizontal. The sedimentary layers of the anticline have been shifted upward and SW at least 6 m relative to those in the footwall. d. The south wall exposes an asymmetric syncline overlain by a different reverse fault (U) dipping 35 toward the NE. The thickness of the reverse fault zone ranges from paper thin to 15 cm; it separates distinctly different sedimentary layers and cuts through to the ground surface. The apparent slip on this fault is consistently 4.2 m, based on crosscutting relations of older layers. Half of the 4.2 m of slip occurred in 1999, as indicated by offset of the soil horizon Figure 15. The extension belt (upper left) and compression belt (lower right) in the part of the Winnetka deformation zone where strains were measured completely. The zone of measureable strains trends NE-SW and is about 1.5 km wide. NW and SE of the deformation zone the strains were too small to measure. The inset figure shows how the strain figures are read: The size of the circle is compared to the size of a series of scaled circles to determine the strain magnitude. The rest of the strain information is contained in the multi curved line plotted on top of the circle. The multi curve indicates the distribution of the strains and shows the principal strains. Where the multi curve touches the circle the strain is zero. Where the multi curve is inside the circle there is compression, and where it is outside the circle there is extension Figure 16. Analytical diagrams used to determine depth to tip of slip on blind fault and dip angle of the blind fault for Winnetka strain belts. a. Relation between normalized depth to tip of slip, D ts /S, for blind fault dips ranging from 35 to 70. b. Relation between dip angle of fault and width ratio of extension belt to compression belt, w E /w C, for normalized values of depth to tip of slip ranging from about 63 to 500. c. Relation between D ts /S and the magnitude of the largest extension in the extension belt. A check on the results for the depth to the tip of slip, D ts /S. 51
52 52
53 1149 Table 1. Estimates of critical invariant of deviatoric strain parameter (II ε' e ) c. Critical Value (Low) Critical Value (High) Material Representative Invariant Exponent Strain e (10 n ) Representative Strain Invariant Exponent (10 n ) rε' c (II ε' e ) c n rε' c (II ε' e ) c n Granite (compression) a Landslide debris (compression) b Landslide debris (extension) b Concrete, asphalt, soil c Concrete, asphalt, soil d a Chelmsford Granite. Peng and Johnson [1972]. b Aspen Grove Landslide debris. Fleming and Johnson [1989]; Baum, Johnson, and Fleming [1988]; Baum, Fleming, and Johnson [1993]. c Granada Hills, Johnson et al. [1996a]. d Winnetka, Cruikshank et al. [1996]. e Note: The relative critical strain r ε' c is the square root of (II e ε' ) c ; n is the log 10 of (II e ε' ) c
54 1157 Table 2. Values of parameters for Kaynaşlı Deformation Zone Parameter [unit] Measured Assumed Varied Calculated w, Width def. zone [m] 110 a 108 S, Slip [m] 2.1 a Yes, 3 c w Hang w, Width ratio [] 6 a Foot θ, Dip of fault [ ] 54 N b 44 N w S, Normalized width def. zone [] 36 n, Exponent of yield condition (10 n ) d [] Yes a Johnson et al. [2002], Gür [2004] b Bürgmann et al. [2002] c Ayküz [2002] 1161 d Note: 10 n = (II ε' e ) c ; r ε' c = (II ε' e ) c 54
55 Zones Table 3. Characteristic Parameters Estimated with Graphical Solutions for Three Deformation Parameter [unit] Kaynaşlı Chung Cheng Park Tanliwun w Hang w Foot,Ratio of width of hanging wall to footwall [] a θ, Dip angle of fault [ ] a, b w/s, Normalized width of deformation to 26 zone[] b n, Exponent in value of yield condition to -3.9 (10 n )[] b (II ε' e ) c, Critical deviatoric strain invariant [] x x 10 4 rε' c, Relative critical Strain[]b x to 1.3 x a Values shown in Figure 8a b Values shown in Figure 8b or Figure 8c c Note: (IIε' e ) c = 10 n 55
56 Table 4. Locations of Tip of Slip when Permanent Ground Deformation Began for Three Deformation Zones Parameter [unit] Kaynaşlı Chung Cheng Park Tanliwun Fault Type[] Strike slip Thrust Thrust θ, Dip angle [ ] D ts, Vertical distance from ground surface to tip of slip [m] w t, Horizontal distance from tip of slip to ultimate surface rupture [m]
57 1170 Table 5. Values of Parameters for Chung Cheng Park Deformation Zone Parameter [unit] Measured Assumed Adjusted Calculated Fault width, W f [m] Yes (30x10 3 ) b w, Width of deformation zone [m] 350 a No 346 S, Slip d [m] RDS: 5 a ; 6.5 LL, 2.5 RDS c Yes (6 m) w Hang w Foot, Width ratio [] 11.5 a No θ, Fault dip angle [ ] 20 to 30 E b ; 60 E c No yes 16.5 E w/s, Normalized width of deformation zone[] n, Exponent in value of yield condition (10 n )[] 57 yes a Huang [2006] b Kao and Chen [2000] c Lee et al. [2003] d RDS is reverse, dip slip; LL is left lateral 57
58 1176 Table 6. Values of Parameters for Tanliwun Deformation Zone Parameter [unit] Measured Assumed Adjusted Calculated Fault width, W f [m] 30 x 10 3 a yes Width ratio, w Hang /w Foot [ ] large b yes 5 Fault dip θ [ ] 20 E to 30 E a, 24 E b, c 24 E w, Width def. zone, w [m] 50 to 100 b 72 to 78 S, Slip [m] 3 b w/s [ ] 24 to 26 n, Exponent in value of yield condition (10 n )[ ] yes -3.8 to a Kao and Chen [2000] b Huang [2006] c Chen et el. [2007] 58
59 1180 Table 7. Values of parameters for Winnetka Deformation Zone Parameter [unit] Measured Assumed Calculated W f, Fault width [m] 3000 S, Slip [m] a 1.6 Yes w, Total width strain belts [m] 1540 to 1580 w/s, Normalized width of belts[] 963 to 988 D ts /S Normalized Depth to fault tip[] 220 to 230 D ts, Depth to fault tip [m] 350 to 370 w E /w C, Width ratio [] 1.6 to 2 (a) θ, Fault dip [ ] 50 to 58 S a The size of an anomaly in the differential vertical displacement map near Northridge [Cruikshank et al., 1996, Figure. 2] is 0.6 to 0.8 m. The slip therefore was probably on the order of 1.2 to 1.6 m. 59


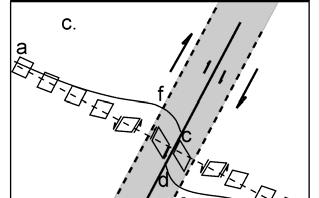
60 1183 Figure
61 1185 Figure
62 1187 Figure 3 a. at t 0 No dislocation θ ground surface W f existing fault (width of fault) b. at t 1 First increment of slip amount of slip δd 1 c. at t 2 Second increment of slip δd 2 (width of dislocation) W d d. at t 3 Third increment of slip δd 3 W d δd 7 e. at t 7 Slip reaches ground surface θ W d = W f
63 1189 Figure
64 1191 Figure
65 1193 Figure
66 1197 Figure
67 1199 Figure
68 68


69 1201 Figure
For Goodness Sake, Let me Examine the Evidence, Ayhan!!!
 For Goodness Sake, Let me Examine the Evidence, Ayhan!!! Deformation Belts and Fracture Belts along Earthquake Ruptures: INTRODUCTION The Ayhan and Arvid Comedy Hour and a Half!!! 13 February 2006 Kaynaşlı,
Lecture # 6. Geological Structures
 1 Lecture # 6 Geological Structures ( Folds, Faults and Joints) Instructor: Dr. Attaullah Shah Department of Civil Engineering Swedish College of Engineering and Technology-Wah Cantt. 2 The wavy undulations
Chapter 15 Structures
 Chapter 15 Structures Plummer/McGeary/Carlson (c) The McGraw-Hill Companies, Inc. TECTONIC FORCES AT WORK Stress & Strain Stress Strain Compressive stress Shortening strain Tensional stress stretching
Earthquakes and Seismotectonics Chapter 5
 Earthquakes and Seismotectonics Chapter 5 What Creates Earthquakes? The term Earthquake is ambiguous: Applies to general shaking of the ground and to the source of the shaking We will talk about both,
Crustal Deformation. Earth Systems 3209
 Crustal Deformation Earth Systems 3209 Crustal Deformation pg. 415 Refers to all changes in the original form and/or size of a rock body. May also produce changes in the location and orientation of rocks.
Stress and Strain. Stress is a force per unit area. Strain is a change in size or shape in response to stress
 Geologic Structures Geologic structures are dynamically-produced patterns or arrangements of rock or sediment that result from, and give information about, forces within the Earth Produced as rocks change
4. Geotechnical and Geological Aspects. 4.1 Geotechnical Aspects
 4. Geotechnical and Geological Aspects 4.1 Geotechnical Aspects A preliminary reconnaissance of the geotechnical conditions of Duzce, Kaynasli, and Bolu urban areas was done during the Turkey Expedition
Crustal Deformation Earth - Chapter Pearson Education, Inc.
 Crustal Deformation Earth - Chapter 10 Structural Geology Structural geologists study the architecture and processes responsible for deformation of Earth s crust. A working knowledge of rock structures
Introduction Faults blind attitude strike dip
 Chapter 5 Faults by G.H. Girty, Department of Geological Sciences, San Diego State University Page 1 Introduction Faults are surfaces across which Earth material has lost cohesion and across which there
Crags, Cracks, and Crumples: Crustal Deformation and Mountain Building
 Crags, Cracks, and Crumples: Crustal Deformation and Mountain Building Updated by: Rick Oches, Professor of Geology & Environmental Sciences Bentley University Waltham, Massachusetts Based on slides prepared
Deformation of Rocks. Orientation of Deformed Rocks
 Deformation of Rocks Folds and faults are geologic structures caused by deformation. Structural geology is the study of the deformation of rocks and its effects. Fig. 7.1 Orientation of Deformed Rocks
What Causes Rock to Deform?
 Crustal Deformation Earth, Chapter 10 Chapter 10 Crustal Deformation What Causes Rock to Deform? Deformation is a general term that refers to all changes in the shape or position of a rock body in response
CRUSTAL DEFORMATION. Chapter 10
 CRUSTAL DEFORMATION and dgeologic Structures t Chapter 10 Deformation Df Deformation involves: Stress the amount of force applied to a given area. Types of Stress: Confining Stress stress applied equally
Geologic Structures. Changes in the shape and/or orientation of rocks in response to applied stress
 Geologic Structures Changes in the shape and/or orientation of rocks in response to applied stress Figure 15.19 Can be as big as a breadbox Or much bigger than a breadbox Three basic types Fractures >>>
Staple this part to part one of lab 6 and turn in. Lab 6, part two: Structural geology (analysis)
") Geology 101 Staple this part to part one of lab 6 and turn in Lab 6, part two: Structural geology (analysis) Recall that the objective of this lab is to describe the geologic structures of Cougar Mountain
Geology 101 Staple this part to part one of lab 6 and turn in Lab 6, part two: Structural geology (analysis) Recall that the objective of this lab is to describe the geologic structures of Cougar Mountain
UNIT 10 MOUNTAIN BUILDING AND EVOLUTION OF CONTINENTS
 UNIT 10 MOUNTAIN BUILDING AND EVOLUTION OF CONTINENTS ROCK DEFORMATION Tectonic forces exert different types of stress on rocks in different geologic environments. STRESS The first, called confining stress
Lab 7: STRUCTURAL GEOLOGY FOLDS AND FAULTS
 Lab 7: STRUCTURAL GEOLOGY FOLDS AND FAULTS This set of labs will focus on the structures that result from deformation in earth s crust, namely folds and faults. By the end of these labs you should be able
I. Locations of Earthquakes. Announcements. Earthquakes Ch. 5. video Northridge, California earthquake, lecture on Chapter 5 Earthquakes!
 51-100-21 Environmental Geology Summer 2006 Tuesday & Thursday 6-9:20 p.m. Dr. Beyer Earthquakes Ch. 5 I. Locations of Earthquakes II. Earthquake Processes III. Effects of Earthquakes IV. Earthquake Risk
1. classic definition = study of deformed rocks in the upper crust
 Structural Geology I. Introduction 1. classic definition = study of deformed rocks in the upper crust deformed includes translation, rotation, and strain (change of shape) All rocks are deformed in some
Unit 4 Lesson 7 Mountain Building
 Indiana Standards 7.2.4 Explain how convection currents in the mantle cause lithospheric plates to move causing fast changes like earthquakes and volcanic eruptions, and slow changes like creation of mountains
4 Deforming the Earth s Crust
 CHAPTER 7 4 Deforming the Earth s Crust SECTION Plate Tectonics BEFORE YOU READ After you read this section, you should be able to answer these questions: What happens when rock is placed under stress?
Answers: Internal Processes and Structures (Isostasy)
") Answers: Internal Processes and Structures (Isostasy) 1. Analyse the adjustment of the crust to changes in loads associated with volcanism, mountain building, erosion, and glaciation by using the concept
Answers: Internal Processes and Structures (Isostasy) 1. Analyse the adjustment of the crust to changes in loads associated with volcanism, mountain building, erosion, and glaciation by using the concept
Apparent and True Dip
 Apparent and True Dip Cross-bedded building stone. The contact immediately below A appears to dip gently to the right, but at B, the contact appears to dip to the left. But it's not a syncline! Both of
Taiwan, (Sathiyam.tv)
") Taiwan, 1999. (Sathiyam.tv) This document was modified and supplemented by BYU-Idaho faculty. All illustrations are from USGS unless otherwise noted. Learning Objectives Your goals in studying this chapter
Taiwan, 1999. (Sathiyam.tv) This document was modified and supplemented by BYU-Idaho faculty. All illustrations are from USGS unless otherwise noted. Learning Objectives Your goals in studying this chapter
Lab 6: Plate tectonics, structural geology and geologic maps
 Geology 103 Name(s): Lab 6: Plate tectonics, structural geology and geologic maps Objective: To show the effects of plate tectonics on a large-scale set of rocks and to reconstruct the geological history
Crustal Deformation. (Building Earth s Surface, Part 1) Science 330 Summer Mapping geologic structures
 Science 330 Summer Mapping geologic structures") Crustal Deformation (Building Earth s Surface, Part 1) Science 330 Summer 2005 Mapping geologic structures When conducting a study of a region, a geologist identifies and describes the dominant rock structures
Crustal Deformation (Building Earth s Surface, Part 1) Science 330 Summer 2005 Mapping geologic structures When conducting a study of a region, a geologist identifies and describes the dominant rock structures
Chapter 2. Earthquake and Damage
 EDM Report on the Chi-Chi, Taiwan Earthquake of September 21, 1999 2.1 Earthquake Fault 2.1.1 Tectonic Background The island of Taiwan is located in the complex junction where the Eurasian and Philippine
Chapter 4 Near Fault Ground Motion
 Chapter 4 Near Fault Ground Motion 4.1 Introduction This chapter deals with the description of near-source ground motions and their characteristics which make them different from far-field ground motions.
Section 19.1: Forces Within Earth Section 19.2: Seismic Waves and Earth s Interior Section 19.3: Measuring and Locating.
 CH Earthquakes Section 19.1: Forces Within Earth Section 19.2: Seismic Waves and Earth s Interior Section 19.3: Measuring and Locating Earthquakes Section 19.4: Earthquakes and Society Section 19.1 Forces
Earthquakes How and Where Earthquakes Occur
 Earthquakes How and Where Earthquakes Occur PPT Modified from Troy HS Is there such thing as earthquake weather? Absolutely NOT!!! Geologists believe that there is no connection between weather and earthquakes.
Structural Geology and Geology Maps Lab
 Structural Geology and Geology Maps Lab Mesa College Geology 101 Lab Ray Rector: Instructor Structural Geology Lab Pre-Lab Resources Pre-Lab Internet Links 1) Fundamentals of Structural Geology 2) Visualizing
CHAPTER 1 BASIC SEISMOLOGY AND EARTHQUAKE TERMINOLGY. Earth Formation Plate Tectonics Sources of Earthquakes...
 CHAPTER 1 BASIC SEISMOLOGY AND EARTHQUAKE TERMINOLGY Earth Formation... 1-2 Plate Tectonics... 1-2 Sources of Earthquakes... 1-3 Earth Faults... 1-4 Fault Creep... 1-5 California Faults... 1-6 Earthquake
Earthquakes Chapter 19
 Earthquakes Chapter 19 Does not contain complete lecture notes. What is an earthquake An earthquake is the vibration of Earth produced by the rapid release of energy Energy released radiates in all directions
Foldable Fault Blocks Lesson Plans and Activities
 Foldable Fault Blocks Lesson Plans and Activities By Polly R. Sturgeon Targeted Age: Elementary to High School Activity Structure: Individual assignment Indiana Standards and Objectives: 3.PS.1, 4.ESS.2,
Materials and Methods The deformation within the process zone of a propagating fault can be modeled using an elastic approximation.
 Materials and Methods The deformation within the process zone of a propagating fault can be modeled using an elastic approximation. In the process zone, stress amplitudes are poorly determined and much
December 21, Chapter 11 mountain building E.notebook. Feb 19 8:19 AM. Feb 19 9:28 AM
 Mountains form along convergent plate boundaries. Typically (usually) if you look at a mountain range, you know that it is at a plate boundary (active continental margin) or has been some time in the past
San Andreas Movie Can It Happen?
 San Andreas Movie Can It Happen? Learning Objectives (LO) Lecture 14: Faults and Quakes Read: Chapter 10 and 11 Homework #12 due Thursday 12pm What we ll learn today:! 1. Compare strike-slip to dip-slip
Forces in Earth s Crust
 Forces in Earth s Crust This section explains how stresses in Earth s crust cause breaks, or faults, in the crust. The section also explains how faults and folds in Earth s crust form mountains. Use Target
Learning goals - January 16, Describe the geometry of a fault (1) orientation of the plane (strike and dip) (2) slip vector
 orientation of the plane (strike and dip) (2) slip vector") Learning goals - January 16, 2012 You will understand how to: Describe the geometry of a fault (1) orientation of the plane (strike and dip) (2) slip vector Understand concept of slip rate and how it is
Learning goals - January 16, 2012 You will understand how to: Describe the geometry of a fault (1) orientation of the plane (strike and dip) (2) slip vector Understand concept of slip rate and how it is
Earthquakes and Earthquake Hazards Earth - Chapter 11 Stan Hatfield Southwestern Illinois College
 Earthquakes and Earthquake Hazards Earth - Chapter 11 Stan Hatfield Southwestern Illinois College What Is an Earthquake? An earthquake is the vibration of Earth, produced by the rapid release of energy.
Forces in the Earth s crust
 EARTHQUAKES Forces in the Earth s crust How does stress in the crust change Earth s surface? Where are faults usually found, and why do they form? What land features result from the forces of plate movement?
Elastic rebound theory
 Elastic rebound theory Focus epicenter - wave propagation Dip-Slip Fault - Normal Normal Fault vertical motion due to tensional stress Hanging wall moves down, relative to the footwall Opal Mountain, Mojave
Part 2 - Engineering Characterization of Earthquakes and Seismic Hazard. Earthquake Environment
 Part 2 - Engineering Characterization of Earthquakes and Seismic Hazard Ultimately what we want is a seismic intensity measure that will allow us to quantify effect of an earthquake on a structure. S a
Earthquakes. Building Earth s Surface, Part 2. Science 330 Summer What is an earthquake?
 Earthquakes Building Earth s Surface, Part 2 Science 330 Summer 2005 What is an earthquake? An earthquake is the vibration of Earth produced by the rapid release of energy Energy released radiates in all
Forces in Earth s Crust
 Name Date Class Earthquakes Section Summary Forces in Earth s Crust Guide for Reading How does stress in the crust change Earth s surface? Where are faults usually found, and why do they form? What land
on the earthquake's strength. The Richter scale is a rating of an earthquake s magnitude based on the size of the
 Earthquakes and Seismic Waves An earthquake is the shaking and trembling that results from the movement of rock beneath Earth's surface. The point beneath Earth s surface where rock under stress breaks
SURFACE DEFORMATION TROUGHS INDUCED BY NORMAL FAULTING AND REVERSE FAULTING
 SURFACE DEFORMATION TROUGHS INDUCED BY NORMAL FAULTING AND REVERSE FAULTING Chung-Jung LEE 1, Yu-Yi CHANG 2, and Wen-Yi HUNG 3 ABSTRACT A series of centrifuge normal faulting and reverse faulting tests
Jocelyn Karen Campbell
 THE UNCERTAINTIES IN ASSESSING THE IMPACT OF REGIONAL SEISMICITY AT THE WIL SITE Statement of Evidence by Jocelyn Karen Campbell A CANTERBURY FAULTS coded by type CHARACTERISTICS OF THRUST FAULTS IN CANTERBURY
6.1 Geological Stresses
 www.ck12.org Chapter 6. Geological Activity from Plate Tectonics Processes 6.1 Geological Stresses Define the types of geological stress and describe their affect on various types of rock under a range
How mountains are made. We will talk about valleys (erosion and weathering later)
") How mountains are made We will talk about valleys (erosion and weathering later) http://www.ilike2learn.com/ilike2learn/mountainmaps/mountainranges.html Continent-continent plate convergence Less dense,
How mountains are made We will talk about valleys (erosion and weathering later) http://www.ilike2learn.com/ilike2learn/mountainmaps/mountainranges.html Continent-continent plate convergence Less dense,
EARTHQUAKE LOCATIONS INDICATE PLATE BOUNDARIES EARTHQUAKE MECHANISMS SHOW MOTION
 6-1 6: EARTHQUAKE FOCAL MECHANISMS AND PLATE MOTIONS Hebgen Lake, Montana 1959 Ms 7.5 1 Stein & Wysession, 2003 Owens Valley, California 1872 Mw ~7.5 EARTHQUAKE LOCATIONS INDICATE PLATE BOUNDARIES EARTHQUAKE
Instructor: Ms. Terry J. Boroughs Geology 305 Restless/Dynamic EARTH: Geologic Structures (Folds & faults); Earthquakes; and the Earth s Interior
; Earthquakes; and the Earth s Interior") DATE DUE: Instructor: Ms. Terry J. Boroughs Geology 305 Name: Restless/Dynamic EARTH: Geologic Structures (Folds & faults); Earthquakes; and the Earth s Interior Instructions: Read each question carefully
DATE DUE: Instructor: Ms. Terry J. Boroughs Geology 305 Name: Restless/Dynamic EARTH: Geologic Structures (Folds & faults); Earthquakes; and the Earth s Interior Instructions: Read each question carefully
Science Starter. Describe in your own words what an Earthquake is and what causes it. Answer The MSL
 Science Starter Describe in your own words what an Earthquake is and what causes it. Answer The MSL WHAT IS AN EARTHQUAKE AND HOW DO WE MEASURE THEM? Chapter 8, Section 8.1 & 8.2 Looking Back Deserts Wind-shaped
UNDERSTANDING GEOLOGIC M APS
 Name: Lab Section: work in groups, but each person turns in his/her own GEOSCIENCE 001 L AB UNDERSTANDING GEOLOGIC M APS Geologic maps are colorful and even beautiful, but they also contain an amazing
Lecture 9 faults, folds and mountain building
 Lecture 9 faults, folds and mountain building Rock deformation Deformation = all changes in size, shape, orientation, or position of a rock mass Structural geology is the study of rock deformation Deformation
Earthquakes and Faulting
 Earthquakes and Faulting Crustal Strength Profile Quakes happen in the strong, brittle layers Great San Francisco Earthquake April 18, 1906, 5:12 AM Quake lasted about 60 seconds San Francisco was devastated
Earth Science, (Tarbuck/Lutgens) Chapter 10: Mountain Building
 Chapter 10: Mountain Building") Earth Science, (Tarbuck/Lutgens) Chapter 10: Mountain Building 1) A(n) fault has little or no vertical movements of the two blocks. A) stick slip B) oblique slip C) strike slip D) dip slip 2) In a(n) fault,
Earth Science, (Tarbuck/Lutgens) Chapter 10: Mountain Building 1) A(n) fault has little or no vertical movements of the two blocks. A) stick slip B) oblique slip C) strike slip D) dip slip 2) In a(n) fault,
Brittle Deformation. Earth Structure (2 nd Edition), 2004 W.W. Norton & Co, New York Slide show by Ben van der Pluijm
, 2004 W.W. Norton & Co, New York Slide show by Ben van der Pluijm") Lecture 6 Brittle Deformation Earth Structure (2 nd Edition), 2004 W.W. Norton & Co, New York Slide show by Ben van der Pluijm WW Norton, unless noted otherwise Brittle deformation EarthStructure (2 nd
Lecture 6 Brittle Deformation Earth Structure (2 nd Edition), 2004 W.W. Norton & Co, New York Slide show by Ben van der Pluijm WW Norton, unless noted otherwise Brittle deformation EarthStructure (2 nd
Dip-Sequence Analysis
 Chapter 9 Dip-Sequence Analysis 9.1 Introduction The three-dimensional geometry of a structure can be determined from the bedding attitudes measured in a single well bore or on a traverse through a structure.
Earthquakes and Earth s Interior
 - What are Earthquakes? Earthquakes and Earth s Interior - The shaking or trembling caused by the sudden release of energy - Usually associated with faulting or breaking of rocks - Continuing adjustment
Faults, folds and mountain building
 Faults, folds and mountain building Mountain belts Deformation Orogens (Oro = Greek all changes for mountain, in size, shape, genesis orientation, = Greek for or formation) position of a rock mass Structural
How to Build a Mountain and other Geologic Structures. But first a short review
 How to Build a Mountain and other Geologic Structures But first a short review Where do we see deep earthquakes? What is happening there? What can happen at a plate boundary? 1. Plates can move apart
Section 3 Deforming Earth s Crust
 Section 3 Deforming Earth s Crust Key Concept Tectonic plate motions deform Earth s crust. Deformation causes rock layers to bend and break and causes mountains to form. What You Will Learn Stress is placed
Earthquakes. Chapter Test A. Multiple Choice. Write the letter of the correct answer on the line at the left.
 Earthquakes Chapter Test A Multiple Choice Write the letter of the correct answer on the line at the left. 1. Stress that pushes a mass of rock in two opposite directions is called a. shearing. b. tension.
Chapter 6: Earthquakes
 Section 1 (Forces in Earth s Crust) Chapter 6: Earthquakes 8 th Grade Stress a that acts on rock to change its shape or volume Under limited stress, rock layers can bend and stretch, but return to their
Earthquakes.
 Earthquakes http://quake.usgs.gov/recenteqs/latestfault.htm An earthquake is a sudden motion or shaking of the Earth's crust, caused by the abrupt release of stored energy in the rocks beneath the surface.
UGRC 144 Science and Technology in Our Lives/Geohazards
 UGRC 144 Science and Technology in Our Lives/Geohazards Session 3 Understanding Earthquakes and Earthquake Hazards Lecturer: Dr. Patrick Asamoah Sakyi Department of Earth Science, UG Contact Information:
Earthquakes = shaking of Earth because of a rapid release of energy
 There are more than 30,000 earthquakes worldwide each year! Earthquakes = shaking of Earth because of a rapid release of energy usually because of movement of tectonic plates Most earthquakes last for
In this lab, we will study and analyze geologic maps from a few regions, including the Grand Canyon, western Wyoming, and coastal California.
 Name: Lab Section: work in groups, but each person turns in his/her own GEOSCIENCE 001 LAB UNDERSTANDING GEOLOGIC MAPS Geologic maps are colorful and even beautiful, but they also contain an amazing amount
Deformation of the Crust
 Deformation of the Crust Review Choose the best response. Write the letter of that choice in the space provided. 1. The state of balance between the thickness of the crust and the depth at which it rides
Learning Objectives (LO) What we ll learn today:!
 What we ll learn today:!") Learning Objectives (LO) Lecture 13: Mountain Building Read: Chapter 10 Homework #11 due Tuesday 12pm What we ll learn today:! 1. Define the types of stress that are present in the crust! 2. Define the
Learning Objectives (LO) Lecture 13: Mountain Building Read: Chapter 10 Homework #11 due Tuesday 12pm What we ll learn today:! 1. Define the types of stress that are present in the crust! 2. Define the
Lecture 6 Folds, Faults and Deformation Dr. Shwan Omar
 Fold: A fold is a bend or wrinkle of rock layers or foliation; folds form as a sequence of ductile deformation. Folding is the processes by which crustal forces deform an area of crust so that layers of
Earthquakes. Earthquake Magnitudes 10/1/2013. Environmental Geology Chapter 8 Earthquakes and Related Phenomena
 Environmental Geology Chapter 8 Earthquakes and Related Phenomena Fall 2013 Northridge 1994 Kobe 1995 Mexico City 1985 China 2008 Earthquakes Earthquake Magnitudes Earthquake Magnitudes Richter Magnitude
Name. GEOL.5220 Structural Geology Faults, Folds, Outcrop Patterns and Geologic Maps. I. Properties of Earth Materials
 I. Properties of Earth Materials GEOL.5220 Structural Geology Faults, Folds, Outcrop Patterns and Geologic Maps Name When rocks are subjected to differential stress the resulting build-up in strain can
Instructor: Ms. Terry J. Boroughs Geology 300 Restless/Dynamic EARTH: Geologic Structures (Folds & faults); Earthquakes; and the Earth s Interior
; Earthquakes; and the Earth s Interior") DATE DUE: Instructor: Ms. Terry J. Boroughs Geology 300 Name: Restless/Dynamic EARTH: Geologic Structures (Folds & faults); Earthquakes; and the Earth s Interior Instructions: Read each question carefully
DATE DUE: Instructor: Ms. Terry J. Boroughs Geology 300 Name: Restless/Dynamic EARTH: Geologic Structures (Folds & faults); Earthquakes; and the Earth s Interior Instructions: Read each question carefully
Unit 4 Lesson 3 Mountain Building. Copyright Houghton Mifflin Harcourt Publishing Company
 Stressed Out How can tectonic plate motion cause deformation? The movement of tectonic plates causes stress on rock structures. Stress is the amount of force per unit area that is placed on an object.
Study the architecture and processes responsible for deformation of Earth s crust. Folding and Faulting
 Crustal Deformation AKA Structural geology (adapted from Brunkel, 2012) Study the architecture and processes responsible for deformation of Earth s crust. Folding and Faulting How Rocks Deform: 4 Controls
C2.2 The physics of Earthquakes
 C2.2 The physics of Earthquakes C2.2.1 Stress axes and faults Most earthquakes occur because of the mechanical failure on brittle faults. The type of faulting is a consequence of the stress pattern causing
Chapter Review USING KEY TERMS. asthenosphere uplift continental drift. known as. tectonic plates move. object. UNDERSTANDING KEY IDEAS
 Skills Worksheet Chapter Review USING KEY TERMS 1. Use the following terms in the same sentence: crust, mantle, and core. Complete each of the following sentences by choosing the correct term from the
Chapter 10: Deformation and Mountain Building. Fig. 10.1
 Chapter 10: Deformation and Mountain Building Fig. 10.1 OBJECTIVES Describe the processes of rock deformation and compare and contrast ductile and brittle behavior in rocks. Explain how strike and dip
Strike & Dip. Structural Geology I: Folds & Faults 2009 Lect. 18, J. Steven Kite, West Virginia University
 2 Apr Structural Geology I: Folds & Faults 2009 Lect. 18, J. Steven Kite, West Virginia University Steeply dipping axial plane cleavage. These folded sedimentary layers exposed near Sullivan River in southeastern
Reconstruction of fault slip of the September 21st, 1999, Taiwan earthquake in the asphalted surface of a car park, and co-seismic slip partitioning
 Journal of Structural Geology 25 (2003) 345±350 www.elsevier.com/locate/jsg Reconstruction of fault slip of the September 21st, 1999, Taiwan earthquake in the asphalted surface of a car park, and co-seismic
Mountains and Mountain Building: Chapter 11
 Mountains and Mountain Building: Chapter 11 Objectives: 1)Explain how some of Earth s major mountain belts formed 2) Compare and contrast active and passive continental margins 3) Explain how compression,
Gullfoss. 8.1 Why Has Gullfoss Two Oblique Steps?
 Gullfoss 8 The drive from Geysir to the waterfall Gullfoss along Road 35 is short. The waterfall, which constitutes the eleventh stop (11), is located in Fig. 4.1. The main features to see on the way are
Effects of Fault Dip and Slip Rake Angles on Near-Source Ground Motions: Why Rupture Directivity Was Minimal in the 1999 Chi-Chi, Taiwan, Earthquake
 Bulletin of the Seismological Society of America, Vol. 94, No. 1, pp. 155 170, February 2004 Effects of Fault Dip and Slip Rake Angles on Near-Source Ground Motions: Why Rupture Directivity Was Minimal
11.1 Rock Deformation
 Tarbuck Lutgens Mountain Building 11.1 Rock Deformation Factors Affecting Deformation Factors that influence the strength of a rock and how it will deform include temperature, confining pressure, rock
Embedment Depth Effect on the Shallow Foundation - Fault Rupture Interaction
 Embedment Depth Effect on the Shallow Foundation - Fault Rupture Interaction M. Ashtiani & A. Ghalandarzadeh Faculty of Civil Engineering, University of Tehran, Iran SUMMARY: The 1999 earthquakes in Turkey
GPS Strain & Earthquakes Unit 5: 2014 South Napa earthquake GPS strain analysis student exercise
 GPS Strain & Earthquakes Unit 5: 2014 South Napa earthquake GPS strain analysis student exercise Strain Analysis Introduction Name: The earthquake cycle can be viewed as a process of slow strain accumulation
Deformation: Modification of Rocks by Folding and Fracturing
 CHAPTER 7 Deformation: Modification of Rocks by Folding and Fracturing Chapter Summary A geologic map is a scientific model of rock formations that are exposed on the Earth s surface showing outcrops,
Seismic Source Mechanism
 Seismic Source Mechanism Yuji Yagi (University of Tsukuba) Earthquake Earthquake is a term used to describe both failure process along a fault zone, and the resulting ground shaking and radiated seismic
Name: KEY. Examine all possible answers; some may not satisfy the question criteria and should be left blank. mica crystals big enough to see
 GE 50 Exam #3, FS07 Name: KEY_ Examine all possible answers; some may not satisfy the question criteria and should be left blank. 1. Match the metamorphic rock with its foliated texture. [10 pts] slate
The Earthquake Cycle Chapter :: n/a
 The Earthquake Cycle Chapter :: n/a A German seismogram of the 1906 SF EQ Image courtesy of San Francisco Public Library Stages of the Earthquake Cycle The Earthquake cycle is split into several distinct
Earthquakes Earth, 9th edition, Chapter 11 Key Concepts What is an earthquake? Earthquake focus and epicenter What is an earthquake?
 1 2 3 4 5 6 7 8 9 10 Earthquakes Earth, 9 th edition, Chapter 11 Key Concepts Earthquake basics. "" and locating earthquakes.. Destruction resulting from earthquakes. Predicting earthquakes. Earthquakes
How to Build a Mountain and other Geologic Structures. But first, questions
 How to Build a Mountain and other Geologic Structures But first, questions Questions your students might ask How were Montana s mountains formed? How old are the mountains? What are the different ways
An aerial view from the south of the eruption of Mount St. Helens volcano on May 18, 1980.
 1 2 3 4 5 6 7 8 9 10 Building Earth s Surface Tillery, Chapter 21 Science 330 Summer 2007 An aerial view from the south of the eruption of Mount St. Helens volcano on May 18, 1980. Interpreting Earth s
4 Deforming the Earth s Crust
 CHAPTER 7 4 Deforming the Earth s Crust SECTION Plate Tectonics BEFORE YOU READ After you read this section, you should be able to answer these questions: What happens when rock is placed under stress?
Ground displacement in a fault zone in the presence of asperities
 BOLLETTINO DI GEOFISICA TEORICA ED APPLICATA VOL. 40, N. 2, pp. 95-110; JUNE 2000 Ground displacement in a fault zone in the presence of asperities S. SANTINI (1),A.PIOMBO (2) and M. DRAGONI (2) (1) Istituto
A Model of Three Faults
 A Model of Three Faults Grades 7-12 Adapted from the USGS Learning Web Lesson Plans Background One of the most frightening and destructive phenomena of nature is a severe earthquake and its terrible aftereffects.
IZMIT BAY BRIDGE SOUTH APPROACH VIADUCT: SEISMIC DESIGN NEXT TO THE NORTH ANATOLIAN FAULT
 Istanbul Bridge Conference August 11-13, 2014 Istanbul, Turkey IZMIT BAY BRIDGE SOUTH APPROACH VIADUCT: SEISMIC DESIGN NEXT TO THE NORTH ANATOLIAN FAULT A. Giannakou 1, J. Chacko 2 and W. Chen 3 ABSTRACT
KEY CHAPTER 12 TAKE-HOME QUIZ INTERNAL STRUCTURES AND PROCESSES Score Part B = / 55 PART B
 GEOLOGY 12 KEY CHAPTER 12 TAKE-HOME QUIZ INTERNAL STRUCTURES AND PROCESSES Score Part B = / 55 PART B CHAPTER 12 Isostacy and Structural Geology 1. Using the terms below, label the following diagrams and