What Can Seismology Say About Hot Spots?
|
|
|
- Jennifer Melinda Flynn
- 5 years ago
- Views:
Transcription
1 What Can Seismology Say About Hot Spots? Bruce R. Julian U. S. Geological Survey, Menlo Park, CA USA G. R. Foulger Dept. of Geological Sciences, Univ. of Durham, Durham DH1 3LE, U.K. Seismology offers the highest-resolution view of mantle structure. In the decades since Morgan [1971] first proposed deep-mantle plumes, seismologists have used increasingly sophisticated methods to look for evidence of such structures, but so far they have had little success. This abstract outlines the relevant seismological methods for non-specialists and summarizes the current state of knowledge about structure beneath hot spots, to set the stage for the seismological component of this conference. Factors Affecting Seismic-Wave Speeds Direct thermal effect If thermal plumes exist in the mantle, they would have lower seismic wave speeds than their surroundings. In the upper mantle, a 100 K temperature rise lowers the compressional-wave speed, V P, by about 1%, and the shear-wave speed, V S, by about 1.7%. In the deep mantle, this effect is several times weaker. The temperature anomalies proposed for plumes are about 200 to 600 K. Indirect thermal effect Temperature variations also cause variation in the depths of polymorphic phase boundaries in the transition zone between the upper and lower mantle. These are places where pressure causes certain minerals to change their crystal structure, and these changes are accompanied by jumps in density and seismic wave speed [Anderson, 1967]. Two such zones in particular, at depths of about 410 and 650 km, are global features and fairly easily detectable. A 100 K temperature rise would depress the 410-km discontinuity by about 8 km, and raise the 650-km discontinuity by about 5 km. (Both of these numbers are based on the assumption that olivine is the main mantle mineral, and are subject to significant uncertainty.) Thus a high-temperature anomaly would produce negative wave-speed anomalies at 410 km and positive ones at 650 km. The depths to these phase changes can also be measured directly using waves reflected from them (see Receiver Functions, below). Chemical effect If a plume has a different composition from the surrounding mantle, this alone will cause a seismic wave-speed anomaly. The sign and magnitude of the anomaly will depend on what minerals are involved. As a rule of thumb more buoyant materials have lower wave speeds, but an exception to this rule is mantle residuum peridotite from which partial melt has been removed. Residuum is buoyant, but has a higher wave speed than its parent fertile peridotite. Melting The presence of even a small amount of melt in a rock can have a large effect on the seismic-wave speeds. Partial melting may reflect either thermal (high temperature) or chemical (low melting point) effects. The magnitude of the effect on seismic wave speeds depends
2 2 strongly on the geometric form of the melt bodies. Thin films on grain boundaries have the largest effect, and approximately spherical melt bodies have the smallest effect [Goes et al., 2000]. Anisotropy Seismic wave speeds and other properties of rocks vary with direction, and this can be as strong an effect as spatial heterogeneity. Olivine, in particular, becomes strongly anisotropic when flow causes crystal to align. Most studies of Earth structure ignore this effect, and their results probably are biased by this oversimplification. Studies dealing explicitly with anisotropy are becoming more common [Montagner, 2002]. Anelasticity Many physical processes remove energy from seismic waves and convert it to heat, causing the waves eventually to die away. Most of these processes are thermally activated, so hotter regions are expected to exhibit stronger attenuation (high Q -1 ). A side effect of anelasticity is to introduce a weak frequency dependence of the wave speeds, which must be accounted for in studies of Earth structure. Seismic Tomography The travel time of a seismic wave through the Earth gives an average of the wave speed along the ray path (but see Bananas & Doughnuts, below). If travel times are available for enough ray paths, passing through all parts of a region in many different directions, it is possible to unscramble the times to determine the three-dimensional wave-speed distribution. The term tomography, borrowed from medicine, is given to such seismic techniques. Seismic tomography is much more difficult than X-ray tomography, because the ray paths are curved and initially unknown, and in some cases the locations of the sources are poorly known. Three seismic tomography techniques are particularly useful in studying mantle structure: Teleseismic Tomography In order to study the structure immediately under an area, one can deploy an array of seismometers and record waves from distant earthquakes (>~ 2,500 km away). Such waves arrive at angles within about 30 of the vertical, so crossing rays sample the structure down to depths comparable to the array aperture. The ray directions are not isotropically distributed, however; no ray paths are ever close to horizontal. Consequently, compact structures tend to be smeared vertically in images obtained by this technique [Keller et al., 2000]. This smearing is unfortunate, because it generates artifacts that can be mistaken for real structures. It is possible to estimate quantitatively the severity of the smearing, however, and if due attention is paid to this error source, teleseismic tomography is the best technique available for studying the upper few hundred kilometers of particular regions. Figure 1 shows results of one of the most detailed teleseismic tomography studies, of the structure beneath Iceland [Foulger et al., 2001; Foulger et al., 2000]. A strong low-wave-speed anomaly in the upper mantle, 200 to 250 km in diameter, extends to the deepest well-resolved depths, about 400 km. Significantly, though, the shape of the anomaly changes strongly and systematically below about 250 km, becoming tabular and parallel to the mid-atlantic Ridge. This shape strongly suggests that the anomaly is related to plate-tectonic processes, a conclusion supported by whole-mantle tomography, which shows no continuation of the wave-speed anomaly beneath the transition zone [Ritsema et al., 1999]. Whole-Mantle Tomography There have now been thousands of seismometers deployed globally for decades, and millions of travel-time observations have accumulated and been used to
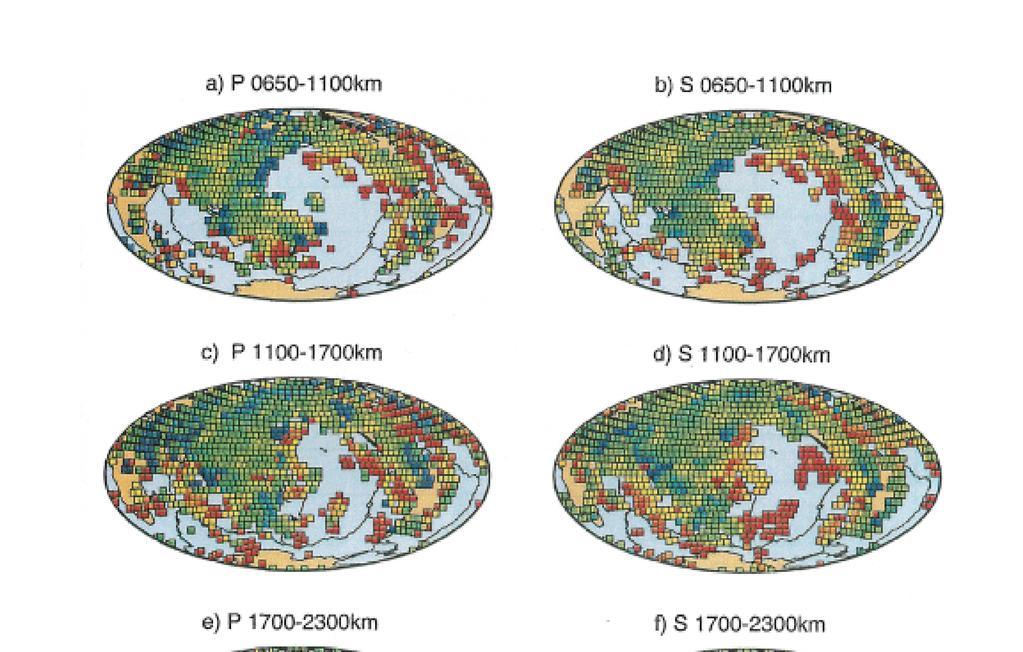
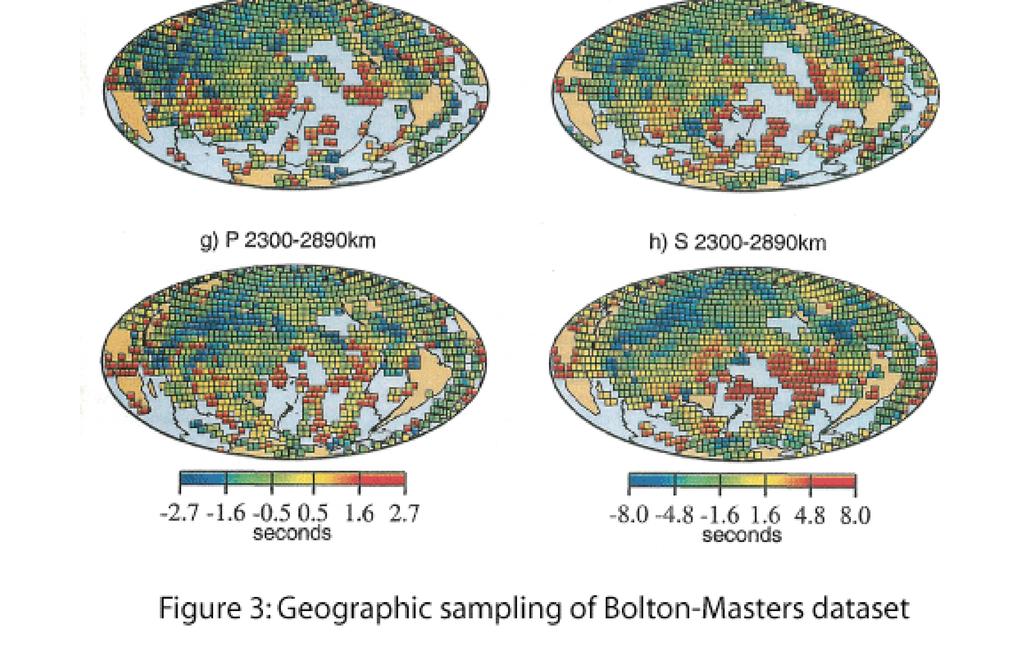
3 3 derive three-dimensional models of the whole mantle. Some studies use enormous data sets obtained from seismological bulletins such as that of the International Seismological Centre, but these data are subject to large and systematic observational errors. Others use data measured in more objective and consistent ways, usually using digitally recorded seismograms. Most wholemantle models agree about the largest-scale anomalies (thousands of kilometers in size), but for a long time this was not so. The model that currently has the best resolution at depths of a few hundred kilometers is described by Ritsema et al. [1999]. This model shows, among other things, a strong low-wave-speed anomaly in the upper mantle beneath Iceland, which extends down to the transition zone but not to greater depths, confirming inferences drawn from teleseismic tomography of the region. The resolution of whole-mantle tomography models is limited both by the ray distributions and by the state of computer technology. The smallest anomalies currently resolvable are 500 km or more in size. Furthermore, ray paths fall far short of sampling the Earth uniformly. Both earthquakes and seismometers are distributed irregularly over the Earth, and some places within the Earth are sampled poorly or not at all e.g., the southern hemisphere, and particularly the south Pacific and Indian Oceans. The uneven ray distribution also systematically distorts anomalies in the Earth. As with teleseismic tomography, this distortion can be assessed quantitatively, but not by the general reader unless considerable information on this subject is given in the paper in question. Surface-wave Tomography Tomographic methods can also be applied to surface waves, lowfrequency seismic waves that propagate in the crust and upper mantle and owe their existence to the presence of the free surface. The depth to which surface waves are sensitive depends on frequency, with low-frequency waves feeling to greater depths and therefore propagating at higher speeds. It is a rule of thumb that surface waves feel down to about a quarter of their wavelength. They also propagate at about 4 km/s, so this depth, in kilometers, is about 1/frequency (Hz). Because of the distribution of earthquakes and seismometers, surface waves can often sample regions of the crust and upper mantle that body waves do not. They are also expected to be highly sensitive to plume heads, which are predicted to flatten out in the upper mantle, producing low wave speed regions that extend for thousands of km [Anderson et al., 1992]. Body-wave and surface-wave data are often combined in whole-mantle tomography studies, such as that of Ritsema et al. [1999]. Bananas & Doughnuts The statement above, that travel times are averages along ray paths, is a simplification. In reality, seismic waves feel the structure in a finite volume, and in fact Dahlen et al. [2000] have recently shown that travel times are most sensitive near a hollow surface around the ray, whose shape reminds them of certain snack foods. Figure 2 shows examples of the spatial distribution of sensitivity according to the new theory. Incorporation of frequency-dependent kernels into tomographic practice will significantly improve the quality of three-dimensional Earth models. The first results of such studies [Montelli et al., 2003] show vertical low-wave-speed anomalies in the south Pacific, notably beneath Hawaii, Samoa-Tahiti, and Easter Island, but these are also regions of sparse data or clumps of data surrounded by regions lacking data (Figure 3), a
4 4 circumstance that would tend produce spurious structural features in tomographic images. The reality of these plume-like anomalies is a critical question at present. Multiple ScS Because they have limited resolution and can distort anomalies in complicated ways, tomographic results often are difficult to interpret. It would be much better if seismic waves sampled precisely a region of interest, and nothing else. Happily, nature occasionally arranges an experiment for us in just this way. For example, the seismic phase ScS, a shear wave reflected from the core-mantle boundary (CMB), when observed close to the epicenter of an earthquake, has a nearly vertical ray path through the entire mantle [Anderson and Kovach, 1964]. Such waves are ideally suited to looking for narrow vertical structures such as plumes. On April 26,1973, a magnitude 6.2 earthquake occurred in Hawaii, and the records from seismometers on Oahu show an usually clear train of multiple-scs phases, reflected repeatedly between the Earth s surface and the CMB [Best et al., 1975]. These waves are sensitive to structure in a vertical cylinder with a diameter of about 500 to 1000 km extending down to the CMB. They show no indication of a plume. The wave speed V S in the upper and middle mantle inferred from arrival times is higher than the average for the southwestern Pacific [Katzman et al., 1998], and the propagation efficiency (Q) is also high [Sipkin and Jordan, 1979; Sipkin and Jordan, 1980]. Figure 2 shows the sensitivity kernel for these ScS waves at different depths in the mantle. The location of a possible plume in the lower mantle might be far enough from Hawaii that these ScS waves would not sample it, but these observations argue strongly against a large region of unusually high temperature or extensive melting in the upper mantle beneath Hawaii. In particular, an upper-mantle anomaly similar to the one beneath Iceland appears to be ruled out. Receiver Functions When a compressional or shear seismic wave strikes a discontinuity in the Earth, it generates reflected and transmitted waves of both types. Because of this, waves from distant earthquakes passing through a layered medium such as the crust or upper mantle generate complicated seismograms containing many echoes. To interpret these records, seismologists process them to generate simplified artificial waveforms, somewhat inscrutably called receiver functions. These can be inverted to yield the variation of V S with depth, and they are particularly sensitive to strong wave-speed discontinuities. Receiver functions are particularly powerful for studying the depths to the Moho and the 410-km and 650-km discontinuities, which may provide evidence about crustal thickness and temperature at these depths [Du et al., 2002]. One of the most detailed receiver-function studies done to date took the form of a profile across the eastern Snake River Plain, the suggested track of a mantle plume now beneath Yellowstone, which lies at the northeastern end of the Plain [Dueker and Sheehan, 1997]. The results illustrate the complexity of structures revealed by receiver functions, and some of the difficulties of interpreting them. Several discontinuities are present, in addition to the major ones near 410 and 650 km. Even these two major features are not continuous, and the 410-km discontinuity appears to split in two near the left end of the profile. The depths to the 410- and 650-km discontinuities are expected to be negatively correlated if their topography results from temperature variations, but actually they are weakly positively correlated. The receiver functions thus provide no evidence of elevated temperatures
5 5 Plume waves ( Fiber waves ) Zones of low wave-speed trap energy and act as waveguides, along which waves propagate efficiently for great distances. This is the principle behind fiber-optic communication. The narrow low-wave-speed anomalies expected for plumes would be ideal for supporting such waves (J. R. Evans, personal communication, 2002), but no such plume waves have ever been noticed. This failure might indicate merely that nothing excites plume waves efficiently (there are no earthquakes in the lower mantle), or it might mean that plume waveguides do not exist. Quantitative theoretical investigation of the excitation and propagation of plume waves would be highly worthwhile. Summary The main methods for studying Earth structure in a way that is useful in the search for plumes include seismic tomography, studying the transit times and attenuation of individual waves that penetrate the volume of interest, and the use of receiver functions to study topography on the boundaries of the transition zone. A potentially new and interesting approach is the search for plume waves. Whereas downgoing slabs in subduction zones and their effects on the transition zone have been easy to detect, the same cannot be said about plumes, heads or tails, and promising images often have not proved reproducible by later, more detailed studies. It will be interesting to follow what the next decade brings. Figure captions Figure 1: Compressional-wave speed (V P ) anomaly in the upper 500 km beneath Iceland, imaged by Foulger et al. [2001] using teleseismic tomography techniques. Inside the green surface, V P exceeds the average value at a given depth by 0.5%. At shallow depths the anomaly is approximately cylindrical, but beneath 250 km it changes shape, and becomes tabular, with its long dimension parallel to the mid-atlantic Ridge. Figure 2: Frechet kernels giving the sensitivity of the travel time of the seismic phase ScS, a shear wave that reflects from the core-mantle boundary, to changes in the shear-wave speed at different depths, computed using the theory of Dahlen et al. [2000] for waves with dominant frequency Hz. The geometry is appropriate for waves generated by the Hawaii earthquake of April 26, 1973 (star) and recorded at station KIP (triangle), as reported by Best et al. [1975] and Sipkin and Jordan [1980]. The maps have been corrected for convergence of the verticals, which otherwise exaggerates the size of deeper features; thus the distance scale, not than the geographic coordinates, correspond to reality in the deep mantle. The two shallowest maps have attenuated color scales. Figure 3: Sampling of the mantle by the travel time data set of Bolton and Masters [2001], which was used, in addition to high-frequency data from the ISC Bulletin, in the recent tomographic study of Montelli [2003]. Squares show surface projections of turning points of rays in the indicated depth ranges. P phases are shown on the left, and S phases on the right. In
6 6 the central and south Pacific, coverage is sparse and observations occur in clumps that correspond closely to the plume-like anomalies reported by Montelli [2003]. References Anderson, D., Y-S. Zhang, and T. Tanimoto, Plume heads, continental lithosphere, flood basalts and tomography, in Magmatism and the causes of continental break-up, edited by B.C. Storey, T. Alabaster, and R.J. Pankhurst, pp , Geological Society Special Publication, Anderson, D.L., Phase changes in the upper mantle, Science, 157 (3793), , Anderson, D.L., and R.L. Kovach, Attenuation in the mantle and rigidity of the core from multiply reflected core phases, Proceedings of the National Academy of Sciences, 51 (2), , Best, W.J., L.R. Johnson, and T.V. McEvilly, ScS and the mantle beneath Hawaii, EOS Fall Meeting Supplement, 1147, Bolton, H., and G. Masters, Travel times of P and S from the global digital seismic networks: Implications for the relative variation of P and S velocity in the mantle, J. Geophys. Res., 106 (B7), , Dahlen, F.A., S.-H. Hung, and G. Nolet, Frechet kernels for finite-frequency traveltimes - I. Theory, Geophys. J. Int., 141 (1), , Du, Z., G.R. Foulger, B.R. Julian, R.M. Allen, G. Nolet, W.J. Morgan, B.H. Bergsson, P. Erlendsson, S. Jakobsdottir, R. Stefansson, and K. Vogfjord, Crustal structure beneath western and eastern Iceland from surface waves and receiver functions, Geophys. J. Int., 149 (2), , Dueker, K.G., and A.F. Sheehan, Mantle discontinuity structure from midpoint stacks of converted P to S waves across the Yellowstone hotspot track, J. Geophys. Res., 102, , Foulger, G.R., M.J. Pritchard, B.R. Julian, J.R. Evans, R.M. Allen, G. Nolet, W.J. Morgan, B.H. Bergsson, P. Erlendsson, S. Jakobsdottir, S. Ragnarsson, R. Stefansson, and K. Vogfjord, Seismic tomography shows that upwelling beneath Iceland is confined to the upper mantle, Geophys. J. Int., 146, , Foulger, G.R., M.J. Pritchard, B.R. Julian, J.R. Evans, R.M. Allen, G. Nolet, W.J. Morgan, B.H. Bergsson, P. Erlendsson, S. Jakobsdóttir, S. Ragnarsson, R. Stefánsson, and K. Vogfjörd, The seismic anomaly beneath Iceland extends down to the mantle transition zone and no deeper, Geophys. J. Int., 142 (3), F2-F5, Goes, S., R. Govers, and P. Vacher, Shallow mantle temperatures under Europe from P and S wave tomography, J. Geophys. Res., 105, , Katzman, R., L. Zhao, and T.H. Jordan, High-resolution, two-dimensional vertical tomography of the central Pacific mantle using ScS reverberations and frequency-dependent travel times, J. Geophys. Res., 103 (B8), , Keller, W.R., D.L. Anderson, and R.W. Clayton, Difficulties in seismically imaging the Icelandic hotspot, Geophys. Res. Lett., 27, , Montagner, J.-P., Upper mantle low anisotropy channels below the Pacific plate, in EPSL (submitted), 2002.
7 7 Montelli, R., G. Nolet, G. Masters, F.A. Dahlen, and S.-H. Hung, Finite frequency tomography reveals a variety of plumes in the mantle, in Plume IV: Beyond the Plume Hypothesis, Hveragerdi, Iceland, Morgan, W.J., Convection plumes in the lower mantle, Nature, 230, 42-43, Ritsema, J., H.J.v. Heijst, and H.H. Woodhouse, Complex shear wave velocity structure imaged beneath Africa and Iceland, Science, 286, , Sipkin, S.A., and T.H. Jordan, Frequency dependence of Q ScS, Bull. Seismol. Soc. Am., 69, , Sipkin, S.A., and T.H. Jordan, Multiple ScS travel times in the western Pacific: Implications for mantle heterogeneity, J. Geophys. Res., 85 (B2), , 1980.


8
9
10
Evidence from P-to-S mantle converted waves for a flat b660-kmq discontinuity beneath Iceland
 H4.SMR/1775-32 "8th Workshop on Three-Dimensional Modelling of Seismic Waves Generation, Propagation and their Inversion" 25 September - 7 October 2006 Evidence from P-to-S mantle converted waves for a
5: ABSOLUTE PLATE MOTIONS & HOTSPOTS
 5-1 5: ABSOLUTE PLATE MOTIONS & HOTSPOTS 1 Relative motions between plates are most important In some applications important to consider absolute plate motions, those with respect to the deep mantle ABSOLUTE
3D IMAGING OF THE EARTH S MANTLE: FROM SLABS TO PLUMES
 3D IMAGING OF THE EARTH S MANTLE: FROM SLABS TO PLUMES Barbara Romanowicz Department of Earth and Planetary Science, U. C. Berkeley Dr. Barbara Romanowicz, UC Berkeley (KITP Colloquium 9/11/02) 1 Cartoon
The Earth s Structure from Travel Times
 from Travel Times Spherically symmetric structure: PREM - Crustal Structure - Upper Mantle structure Phase transitions Anisotropy - Lower Mantle Structure D D - Structure of of the Outer and Inner Core
The Coso Geothermal Area: A Laboratory for Advanced MEQ Studies for Geothermal Monitoring
 The Coso Geothermal Area: A Laboratory for Advanced MEQ Studies for Geothermal Monitoring Bruce R. Julian U. S. Geological Survey, Menlo Park, CA 94025 USA julian@usgs.gov Gillian R. Foulger Dept. Earth
Tracing rays through the Earth
 Tracing rays through the Earth Ray parameter p: source receiv er i 1 V 1 sin i 1 = sin i 2 = = sin i n = const. = p V 1 V 2 V n p is constant for a given ray i 2 i 3 i 4 V 2 V 3 V 4 i critical If V increases
Mantle plumes as presently imaged by seismic tomography. Barbara Romanowicz 1,2
 Mantle plumes as presently imaged by seismic tomography Barbara Romanowicz 1,2 1 Collège de France, Paris 2 Univ. of California, Berkeley Contributors: V. Lekic, S. French, S. Cottaar, Kaiqing Yuan Collège
Plate motions, hotspots, and plumes
 Plate motions, hotspots, and plumes These notes cover a rather disparate collection of pieces of information. Hotspots are geophysically important not only as a means for the Earth to lose heat, but potentially
Edge Driven Convection and Iceland
 Edge Driven Convection and Iceland Scott D. King Department of Earth and Atmospheric Sciences Purdue University, West Lafayette, Indiana One of the alternative hypotheses for hotspot volcanism is Edge-Driven
A) B) C) D) 4. Which diagram below best represents the pattern of magnetic orientation in the seafloor on the west (left) side of the ocean ridge?
 B) C) D) 4. Which diagram below best represents the pattern of magnetic orientation in the seafloor on the west (left) side of the ocean ridge?") 1. Crustal formation, which may cause the widening of an ocean, is most likely occurring at the boundary between the A) African Plate and the Eurasian Plate B) Pacific Plate and the Philippine Plate C)
1. Crustal formation, which may cause the widening of an ocean, is most likely occurring at the boundary between the A) African Plate and the Eurasian Plate B) Pacific Plate and the Philippine Plate C)
Icelandic Lithosphere & Upper Mantle Structure. Natalia Solomatova
 Icelandic Lithosphere & Upper Mantle Structure Natalia Solomatova Location of Iceland maps.google.com Lithosphere Thickness Anomalously thick lithosphere beneath Greenland and Baltic shield may be due
Geophysical Journal International
 Geophysical Journal International Geophys. J. Int. (2012) 188, 293 300 doi: 10.1111/j.1365-246X.2011.05256.x An analysis of SS precursors using spectral-element method seismograms L. Bai, Y. Zhang and
Tomography of the 2011 Iwaki earthquake (M 7.0) and Fukushima
 and Fukushima") 1 2 3 Auxiliary materials for Tomography of the 2011 Iwaki earthquake (M 7.0) and Fukushima nuclear power plant area 4 5 6 7 8 9 Ping Tong 1,2, Dapeng Zhao 1 and Dinghui Yang 2 [1] {Department of Geophysics,
1 2 3 Auxiliary materials for Tomography of the 2011 Iwaki earthquake (M 7.0) and Fukushima nuclear power plant area 4 5 6 7 8 9 Ping Tong 1,2, Dapeng Zhao 1 and Dinghui Yang 2 [1] {Department of Geophysics,
Ambient Noise Tomography in the Western US using Data from the EarthScope/USArray Transportable Array
 Ambient Noise Tomography in the Western US using Data from the EarthScope/USArray Transportable Array Michael H. Ritzwoller Center for Imaging the Earth s Interior Department of Physics University of Colorado
Global surface-wave tomography
 Global surface-wave tomography Lapo Boschi (lapo@erdw.ethz.ch) October 7, 2009 Love and Rayleigh waves, radial anisotropy Whenever an elastic medium is bounded by a free surface, coherent waves arise that
Supporting Information for An automatically updated S-wave model of the upper mantle and the depth extent of azimuthal anisotropy
 GEOPHYSICAL RESEARCH LETTERS Supporting Information for An automatically updated S-wave model of the upper mantle and the depth extent of azimuthal anisotropy Eric Debayle 1, Fabien Dubuffet 1 and Stéphanie
Estimation of S-wave scattering coefficient in the mantle from envelope characteristics before and after the ScS arrival
 GEOPHYSICAL RESEARCH LETTERS, VOL. 30, NO. 24, 2248, doi:10.1029/2003gl018413, 2003 Estimation of S-wave scattering coefficient in the mantle from envelope characteristics before and after the ScS arrival
Topic 12: Dynamic Earth Pracatice
 Name: Topic 12: Dynamic Earth Pracatice 1. Earth s outer core is best inferred to be A) liquid, with an average density of approximately 4 g/cm 3 B) liquid, with an average density of approximately 11
Changbaishan volcanism in northeast China linked to subduction-induced mantle upwelling
 SUPPLEMENTARY INFORMATION DOI: 10.1038/NGEO2166 Changbaishan volcanism in northeast China linked to subduction-induced mantle upwelling Youcai Tang, Masayuki Obayashi, Fenglin Niu, Stephen P. Grand, Yongshun
Chapter 12 Lecture. Earth: An Introduction to Physical Geology. Eleventh Edition. Earth s Interior. Tarbuck and Lutgens Pearson Education, Inc.
 Chapter 12 Lecture Earth: An Introduction to Physical Geology Eleventh Edition Earth s Interior Tarbuck and Lutgens Earth s Internal Structure Earth s interior can be divided into three major layers defined
TIME-DEPENDENT SEISMIC TOMOGRAPHY OF GEOTHERMAL SYSTEMS
 PROCEEDINGS, Thirty-Fourth Workshop on Geothermal Reservoir Engineering Stanford University, Stanford, California, February 9-11, 2009 SGP-TR-187 TIME-DEPENDENT SEISMIC TOMOGRAPHY OF GEOTHERMAL SYSTEMS
C3.4.1 Vertical (radial) variations in mantle structure
 variations in mantle structure") C3.4 Mantle structure Mantle behaves as a solid on short time scales (seismic waves travel through it and this requires elastic behaviour). Over geological time scales the mantle behaves as a very viscous
C3.4 Mantle structure Mantle behaves as a solid on short time scales (seismic waves travel through it and this requires elastic behaviour). Over geological time scales the mantle behaves as a very viscous
Selected Seismic Observations of Upper-Mantle Discontinuities
 Selected Seismic Observations of Upper-Mantle Discontinuities Peter Shearer IGPP/SIO/U.C. San Diego August 31, 2009 Earthquake Research Institute Interface Depth vs. Publication Date Most depths are sampled
Supporting Online Material for
 www.sciencemag.org/cgi/content/full/326/5949/112/dc1 Supporting Online Material for Global Surface Wave Tomography Using Seismic Hum Kiwamu Nishida,* Jean-Paul Montagner, Hitoshi Kawakatsu *To whom correspondence
SURFACE WAVE GROUP VELOCITY MEASUREMENTS ACROSS EURASIA
 SURFACE WAVE GROUP VELOCITY MEASUREMENTS ACROSS EURASIA A. L. Levshin, M. H. Ritzwoller, and L. I. Ratnikova Department of Physics, University of Colorado at Boulder -Contract Number F49620-95-1-0139 Sponsored
Tristan volcano complex: oceanic end-point of a major African lineament.
 Tristan volcano complex: oceanic end-point of a major African lineament. Ken Bailey and Gill Foulger No direct evidence for plumes is yet available: seismic tomography, currently the best hope, so far
Global variation of body wave attenuation in the upper mantle from teleseismic P wave and S wave spectra
 GEOPHYSICAL RESEARCH LETTERS, VOL. 38,, doi:10.1029/2011gl046812, 2011 Global variation of body wave attenuation in the upper mantle from teleseismic P wave and S wave spectra Y. K. Hwang, 1 J. Ritsema,
2008 Monitoring Research Review: Ground-Based Nuclear Explosion Monitoring Technologies
 STRUCTURE OF THE KOREAN PENINSULA FROM WAVEFORM TRAVEL-TIME ANALYSIS Roland Gritto 1, Jacob E. Siegel 1, and Winston W. Chan 2 Array Information Technology 1 and Harris Corporation 2 Sponsored by Air Force
Continent-sized anomalous zones with low seismic velocity at the base of Earth s mantle
 SUPPLEMENTARY INFORMATION DOI: 10.1038/NGEO2733 Continent-sized anomalous zones with low seismic velocity at the base of Earth s mantle Edward J. Garnero 1, Allen K. McNamara 1, and Sang-Heon D. Shim 1
Whole Mantle Convection
 Whole Mantle Convection Overview 1. Evidence for whole mantle convection 2. Model of whole mantle convection reconciling geophysical and geochemical data Transition Zone Water Filter Model 3. Evidence
Mantle Transition Zone Topography and Structure Beneath the Yellowstone Hotspot
 University of Wyoming Wyoming Scholars Repository Geology and Geophysics Faculty Publications Geology and Geophysics 9-17-2004 Mantle Transition Zone Topography and Structure Beneath the Yellowstone Hotspot
Plate Tectonics: A Scientific Revolution Unfolds
 Chapter 2 Lecture Earth: An Introduction to Physical Geology Eleventh Edition Plate Tectonics: A Scientific Revolution Unfolds Tarbuck and Lutgens From Continental Drift to Plate Tectonics Prior to the
Seismic ray path variations in a 3D global velocity model
 Physics of the Earth and Planetary Interiors 141 (2004) 153 166 Seismic ray path variations in a 3D global velocity model Dapeng Zhao, Jianshe Lei Geodynamics Research Center, Ehime University, Matsuyama
Regional 3D velocity structure
 Seismic imaging: Regional 3D velocity structure 3 Seismic anisotropy courtesy of Ed Garnero This is birefringence: tells us about the preferential orientation of minerals 1 Anisotropy beneath the East
Dynamic Crust Practice
 1. Base your answer to the following question on the cross section below and on your knowledge of Earth science. The cross section represents the distance and age of ocean-floor bedrock found on both sides
Dynamic Earth A B1. Which type of plate boundary is located at the Jordan Fault? (1) divergent (3) convergent (2) subduction (4) transform
 divergent (3) convergent (2) subduction (4) transform") Dynamic Earth A B1 1. The edges of most lithospheric plates are characterized by (1) reversed magnetic orientation (2) unusually rapid radioactive decay (3) frequent volcanic activity (4) low P-wave and
Dynamic Earth A B1 1. The edges of most lithospheric plates are characterized by (1) reversed magnetic orientation (2) unusually rapid radioactive decay (3) frequent volcanic activity (4) low P-wave and
Our Dynamic Earth Unit Unit 5
 EARTH SCIENCE REGENTS - SOTO Our Dynamic Earth Unit Unit 5 Mr. Soto - Key 1/1/2013 Our Dynamic Earth Vocabulary List 1 Directions: Define each vocabulary word provided below. You may have to use your Earth
OCN 201 Mantle plumes and hot spots
 OCN 201 Mantle plumes and hot spots Question Long-term (>50 million years) changes in sea level are caused by: A. Changes in the volume of water in the ocean B. Changes in the volume of the ocean basins
Full file at
 Chapter 2 PLATE TECTONICS AND PHYSICAL HAZARDS MULTIPLE-CHOICE QUESTIONS 1. What direction is the Pacific Plate currently moving, based on the chain of Hawaiian Islands with only the easternmost island
Chapter 02 The Sea Floor
 Chapter 02 The Sea Floor Multiple Choice Questions 1. One of the following is not one of the world's major ocean basins: A. Atlantic Ocean B. Arctic Ocean C. Indian Ocean D. Antarctic Ocean E. Pacific
An efficient Matlab script to calculate heterogeneous anisotropically elastic wave propagation in three dimensions $
 Computers & Geosciences 32 (2006) 259 264 www.elsevier.com/locate/cageo An efficient Matlab script to calculate heterogeneous anisotropically elastic wave propagation in three dimensions $ Oliver S. Boyd
What Forces Drive Plate Tectonics?
 What Forces Drive Plate Tectonics? The tectonic plates are moving, but with varying rates and directions. What hypotheses have been proposed to explain the plate motion? Convection Cells in the Mantle
MYRES Seismic Constraints on Boundary Layers. Christine Thomas
 MYRES 2004 Seismic Constraints on Boundary Layers Christine Thomas Outline Seismic constraints: what can we resolve? how can we detect seismic structures? how well can we resolve these structures? (resolution
Attached are (1) the equation dictionary project, and (2) the description of the small group project, a discussion of what geophysics teaches us
 the equation dictionary project, and (2) the description of the small group project, a discussion of what geophysics teaches us") Attached are (1) the equation dictionary project, and (2) the description of the small group project, a discussion of what geophysics teaches us about hot spots and mantle plumes. The major goal of the
Attached are (1) the equation dictionary project, and (2) the description of the small group project, a discussion of what geophysics teaches us about hot spots and mantle plumes. The major goal of the
Crustal Boundaries. As they move across the asthenosphere and form plate boundaries they interact in various ways. Convergent Transform Divergent
 Name: Date: Period: Plate Tectonics The Physical Setting: Earth Science CLASS NOTES Tectonic plates are constantly moving and interacting As they move across the asthenosphere and form plate boundaries
Mantle plume tomography
 Chemical Geology 241 (2007) 248 263 www.elsevier.com/locate/chemgeo Mantle plume tomography Guust Nolet a, Richard Allen b, Dapeng Zhao c, a Department of Geosciences, Princeton University, Princeton,
Plate Tectonics Tutoiral. Questions. Teacher: Mrs. Zimmerman. Plate Tectonics and Mountains Practice Test
 Teacher: Mrs. Zimmerman Print Close Plate Tectonics and Mountains Practice Test Plate Tectonics Tutoiral URL: http://www.hartrao.ac.za/geodesy/tectonics.html Questions 1. Fossils of organisms that lived
CHAPTER 2. Seismology (continued)
") CHAPTER 2 Seismology (continued) 2.1 A tour through the Earth. The gross structure of the Earth and its division into core, mantle and crust were determined by seismologists early in this century. More
CHAPTER 2 Seismology (continued) 2.1 A tour through the Earth. The gross structure of the Earth and its division into core, mantle and crust were determined by seismologists early in this century. More
PLATE TECTONIC PROCESSES
 Lab 9 Name Sec PLATE TECTONIC PROCESSES 1. Fill in the blank spaces on the chart with the correct answers. Refer to figures 2.3, 2.4 p.33 (2.2 and 2.3 on p. 23) as needed. 2. With your knowledge of different
SUPPLEMENTARY INFORMATION
 SUPPLEMENTARY INFORMATION Seismic evidence for a global low velocity layer within the Earth s upper mantle SUPPLEMENTARY MATERIAL Benoît Tauzin 1, Eric Debayle 2 & Gérard Wittlinger 3 1 Department of Earth
THE INTERNAL STRUCTURE OF THE EARTH
 UNIT 1 THE INTERNAL STRUCTURE OF THE EARTH 1.1.Earth s interior layers The interior of the Earth can be divided into layers according to: -Composition layers ( organized in order of increasing density
Theory of Plate Tectonics:
 Theory of Plate Tectonics: Combined Seafloor Spreading and Subduction Lithosphere created at spreading ridges and consumed at subduction zones Continents are along for the ride! Mechanisms? Three types
4-D Geodynamic Modeling With Data Assimilation: Subduction and Continental Evolution
 4-D Geodynamic Modeling With Data Assimilation: Subduction and Continental Evolution PI: Lijun Liu Department of Geology, University of Illinois at Urbana-Champaign Corresponding author: Lijun Liu, ljliu@illinois.edu
Moho (Mohorovicic discontinuity) - boundary between crust and mantle
 - boundary between crust and mantle") Earth Layers Dynamic Crust Unit Notes Continental crust is thicker than oceanic crust Continental Crust Thicker Less Dense Made of Granite Oceanic Crust Thinner More Dense Made of Basalt Moho (Mohorovicic
Earth Layers Dynamic Crust Unit Notes Continental crust is thicker than oceanic crust Continental Crust Thicker Less Dense Made of Granite Oceanic Crust Thinner More Dense Made of Basalt Moho (Mohorovicic
Thorne, Garnero, Jahnke, Igel, McNamara Supplementary Material - 1 -
 Supplementary Material S1. Bin Location Map Location of 2.5 2.5 bins for which data was obtained to infer the ULVZ distribution. The preferred ULVZ model is drawn (yellow areas). Gray shaded regions indicate
Lab 2: Plate tectonics
 Geology 101 Name(s): Lab 2: Plate tectonics Plate tectonics is the theory that is used to explain geological phenomena worldwide. For this reason, most of the useful maps that illustrate plate tectonics
CONTENT. A. Changes in the Crust Facts Changes Construction and Destruction. B. Continental Drift What is it? Evidence
 Name Earth Science Date Period TOPIC THE DYNAMIC EARTH CONTENT A. Changes in the Crust Facts Changes Construction and Destruction B. Continental Drift What is it? Evidence C. Theory of Plate Tectonics
A magnitude 7.4 earthquake struck 255 km (158 miles) southwest of Tonga, according to the US Geological Survey, but there were no reports of damage.
 southwest of Tonga, according to the US Geological Survey, but there were no reports of damage.") A magnitude 7.4 earthquake struck 255 km (158 miles) southwest of Tonga, according to the US Geological Survey, but there were no reports of damage. The earthquake hit at 5:19 am local time and was centered
A magnitude 7.4 earthquake struck 255 km (158 miles) southwest of Tonga, according to the US Geological Survey, but there were no reports of damage. The earthquake hit at 5:19 am local time and was centered
Do mantle plumes exist?
 Do mantle plumes exist? Celeste Introna 3rd-year undergraduate, Earth and Planetary Science, December 2003 Faculty of Science, Kingston University, Penrhyn Road, Kingston upon Thames, Surrey, KT1 2EE,
Imaging the mantle beneath Iceland using integrated seismological techniques
 JOURNAL OF GEOPHYSICAL RESEARCH, VOL. 107, NO. B12, 2325, doi:10.1029/2001jb000595, 2002 Imaging the mantle beneath Iceland using integrated seismological techniques Richard M. Allen, 1,2 Guust Nolet,
Imaging the Gutenberg Seismic Discontinuity beneath the Oceanic Crust of the North American Plate
 Imaging the Gutenberg Seismic Discontinuity beneath the Oceanic Crust of the North American Plate Robbie Burgess 11-25-15 Dr. Nicholas Schmerr GEOL 394 1 1. Abstract: The lithosphere-asthenosphere boundary
12/3/2014. Plate Tectonics: A Scientific Revolution Unfolds Earth Science, 13e Chapter 7. Continental drift: an idea before its time
 Plate Tectonics: A Scientific Revolution Unfolds Earth Science, 13e Chapter 7 Stanley C. Hatfield Southwestern Illinois College Continental drift: an idea before its time Alfred Wegener First proposed
Stop the Presses! New discovery about the origin of tetrapods!
 Mantle Plumes and Intraplate Volcanism Origin of Oceanic Island Volcanoes Lecture 20 Stop the Presses! New discovery about the origin of tetrapods! Tiktaalik rosaea Volcanism on the Earth Mid-ocean ridges
Lab 7: Plate tectonics
 Geology 115/History 150 Name(s): Lab 7: Plate tectonics Plate tectonics is the theory that is used to explain geological phenomena worldwide. For this reason, most of the useful maps that illustrate plate
Supplementary Online Material for. Seismic evidence for a chemically distinct thermochemical reservoir in Earth s deep mantle beneath Hawaii
 Supplementary Online Material for Seismic evidence for a chemically distinct thermochemical reservoir in Earth s deep mantle beneath Hawaii Authors: Chunpeng Zhao 1, Edward J. Garnero 1,*, Allen K. McNamara
Multi-station Seismograph Network
 Multi-station Seismograph Network Background page to accompany the animations on the website: IRIS Animations Introduction One seismic station can give information about how far away the earthquake occurred,
Do deep mantle plumes explain the Mesozoic igneous features of New England?
 Do deep mantle plumes explain the Mesozoic igneous features of New England? J. Gregory McHone 9 Dexters Lane, Grand Manan, New Brunswick, Canada E5G3A6 greg@earth2geologists.net Hotspots are regions of
Simultaneous inversion for mantle shear velocity and topography of transition zone discontinuities
 Geophys. J. Int. (23) 154, 559 583 Simultaneous inversion for mantle shear velocity and topography of transition zone discontinuities Yu J. Gu, Adam M. Dziewoński and Göran Ekström Department of Earth
Data Repository Item
 Data Repository Item 2009003 An abrupt transition from magma-starved to magma-rich rifting in the eastern Black Sea Donna J. Shillington, Caroline L. Scott, Timothy A. Minshull, Rosemary A. Edwards, Peter
ANEWJOINTP AND S VELOCITY MODEL OF THE MANTLE PARAMETERIZED IN CUBIC B-SPLINES
 ANEWJOINTP AND S VELOCITY MODEL OF THE MANTLE PARAMETERIZED IN CUBIC B-SPLINES Michael Antolik, Göran Ekström, Adam M. Dziewonski, Yu J. Gu, Jian-feng Pan, and Lapo Boschi Department of Earth and Planetary
Non-linear crustal corrections in high-resolution regional waveform seismic tomography
 Geophys. J. Int. (27) 17, 46 467 doi: 1.1111/j.1365-246X.27.3399.x Non-linear crustal corrections in high-resolution regional waveform seismic tomography Federica Marone and Barbara Romanowicz Berkeley
29th Monitoring Research Review: Ground-Based Nuclear Explosion Monitoring Technologies
 TRANSITION ZONE WAVE PROPAGATION: CHARACTERIZING TRAVEL-TIME AND AMPLITUDE INFORMATION Peter M. Shearer and Jesse F. Lawrence University of California San Diego, Institute of Geophysics and Planetary Physics
Topic 5: The Dynamic Crust (workbook p ) Evidence that Earth s crust has shifted and changed in both the past and the present is shown by:
 Evidence that Earth s crust has shifted and changed in both the past and the present is shown by:") Topic 5: The Dynamic Crust (workbook p. 65-85) Evidence that Earth s crust has shifted and changed in both the past and the present is shown by: --sedimentary horizontal rock layers (strata) are found
Topic 5: The Dynamic Crust (workbook p. 65-85) Evidence that Earth s crust has shifted and changed in both the past and the present is shown by: --sedimentary horizontal rock layers (strata) are found
An Introduction of Aleutian Subduction Zone. Chuanmao Yang, Hong Yang, Meng Zhang, Wenzhong Wang 2016/04/29
 An Introduction of Aleutian Subduction Zone Chuanmao Yang, Hong Yang, Meng Zhang, Wenzhong Wang 2016/04/29 Outline General Introduction Formation history Structure from seismic study geochemical features
The Dynamic Crust 2) 4) Which diagram represents the most probable result of these forces? 1)
 4) Which diagram represents the most probable result of these forces? 1)") 1. The diagrams below show cross sections of exposed bedrock. Which cross section shows the least evidence of crustal movement? 1) 3) 4. The diagram below represents a section of the Earth's bedrock. The
1. The diagrams below show cross sections of exposed bedrock. Which cross section shows the least evidence of crustal movement? 1) 3) 4. The diagram below represents a section of the Earth's bedrock. The
4 Deforming the Earth s Crust
 CHAPTER 7 4 Deforming the Earth s Crust SECTION Plate Tectonics BEFORE YOU READ After you read this section, you should be able to answer these questions: What happens when rock is placed under stress?
Marine Science and Oceanography
 Marine Science and Oceanography Marine geology- study of the ocean floor Physical oceanography- study of waves, currents, and tides Marine biology study of nature and distribution of marine organisms Chemical
D) outer core B) 1300 C A) rigid mantle A) 2000 C B) density, temperature, and pressure increase D) stiffer mantle C) outer core
 outer core B) 1300 C A) rigid mantle A) 2000 C B) density, temperature, and pressure increase D) stiffer mantle C) outer core") 1. In which area of Earth's interior is the pressure most likely to be 2.5 million atmospheres? A) asthenosphere B) stiffer mantle C) inner core D) outer core Base your answers to questions 2 and 3 on
1. In which area of Earth's interior is the pressure most likely to be 2.5 million atmospheres? A) asthenosphere B) stiffer mantle C) inner core D) outer core Base your answers to questions 2 and 3 on
Extended-time multi-taper frequency domain cross-correlation receiver function estimation
 Extended-time multi-taper frequency domain cross-correlation receiver function estimation George Helffrich Earth Sciences, University of Bristol, Wills Mem. Bldg., Queen s Road, Bristol BS8 1RJ, UK Manuscript
Global Tectonics. Kearey, Philip. Table of Contents ISBN-13: Historical perspective. 2. The interior of the Earth.
 Global Tectonics Kearey, Philip ISBN-13: 9781405107778 Table of Contents Preface. Acknowledgments. 1. Historical perspective. 1.1 Continental drift. 1.2 Sea floor spreading and the birth of plate tectonics.
10. Paleomagnetism and Polar Wandering Curves.
 Map of ocean floor Evidence in Support of the Theory of Plate Tectonics 10. Paleomagnetism and Polar Wandering Curves. The Earth's magnetic field behaves as if there were a bar magnet in the center of
Tomographic imaging of P wave velocity structure beneath the region around Beijing
 403 Doi: 10.1007/s11589-009-0403-9 Tomographic imaging of P wave velocity structure beneath the region around Beijing Zhifeng Ding Xiaofeng Zhou Yan Wu Guiyin Li and Hong Zhang Institute of Geophysics,
7.1 FIJI 1, :57:22 UTC
 A magnitude 7.1 earthquake struck 141 km (88 miles) northeast of Ndoi Island, Fiji, and 313 km (194 mi) west-northwest of Nuku alofa, Tonga according to the US Geological Survey, but there were no reports
2008 Monitoring Research Review: Ground-Based Nuclear Explosion Monitoring Technologies
 FINITE-FREQUENCY SEISMIC TOMOGRAPHY OF BODY WAVES AND SURFACE WAVES FROM AMBIENT SEISMIC NOISE: CRUSTAL AND MANTLE STRUCTURE BENEATH EASTERN EURASIA Yong Ren 2, Wei Zhang 2, Ting Yang 3, Yang Shen 2,and
Plaattektoniek en Mickey Mouse: de bewegingen van de Aarde en de geologie van Marokko. G. Bertotti - TUDelft
 Plaattektoniek en Mickey Mouse: de bewegingen van de Aarde en de geologie van Marokko G. Bertotti - TUDelft Moving continents Continent with matching boundaries Same fauna in different continents Similar
Earth and Space Science Semester 2 Exam Review. Part 1. - Convection currents circulate in the Asthenosphere located in the Upper Mantle.
 Earth and Space Science 2015 Semester 2 Exam Review Part 1 Convection -A form of heat transfer. - Convection currents circulate in the Asthenosphere located in the Upper Mantle. - Source of heat is from
Plate Tectonics. entirely rock both and rock
 Plate Tectonics I. Tectonics A. Tectonic Forces are forces generated from within Earth causing rock to become. B. 1. The study of the origin and arrangement of Earth surface including mountain belts, continents,
Earth s Changing Surface
 Earth s Changing Surface Tectonics What do you think? Read the two statements below and decide whether you agree or disagree with them. Place an A in the Before column if you agree with the statement or
Beneath our Feet: The 4 Layers of the Earty by Kelly Hashway
 Beneath our Feet: The 4 Layers of the Earty by Kelly Hashway The Earth is more than a giant ball made up of dirt, rocks, and minerals. The Earth may look like a giant ball from when looking at it from
Lecture notes Bill Engstrom: Instructor Earth s Interior GLG 101 Physical Geology
 Lecture notes Bill Engstrom: Instructor Earth s Interior GLG 101 Physical Geology We memorized the layers of the Earth early in the semester. So, how do we know what s beneath the Earth s surface. In the
Section Forces Within Earth. 8 th Grade Earth & Space Science - Class Notes
 Section 19.1 - Forces Within Earth 8 th Grade Earth & Space Science - Class Notes Stress and Strain Stress - is the total force acting on crustal rocks per unit of area (cause) Strain deformation of materials
Plate Tectonics. Essentials of Geology, 11 th edition Chapter 15
 1 Plate Tectonics Essentials of Geology, 11 th edition Chapter 15 2 3 4 5 6 7 8 9 10 11 12 13 14 15 Plate Tectonics: summary in haiku form Alfred Wegener gave us Continental Drift. Fifty years later...
Global Mid-Ocean Ridges Mantle Tomography Profiles
 Earth Sciences 2015; 4(2): 80-88 Published online April 9, 2015 (http://www.sciencepublishinggroup.com/j/earth) doi: 10.11648/j.earth.20150402.13 ISSN: 2328-5974 (Print); ISSN: 2328-5982 (Online) Global
A magnitude 7.8 earthquake has occurred km (63.3 mi) ESE of Suva, Fiji at a depth of km (378 miles).
 ESE of Suva, Fiji at a depth of km (378 miles).") A magnitude 7.8 earthquake has occurred 101.8 km (63.3 mi) ESE of Suva, Fiji at a depth of 608.6 km (378 miles). There is no risk of a tsunami from an earthquake at this depth. Images courtesy of Google
A magnitude 7.8 earthquake has occurred 101.8 km (63.3 mi) ESE of Suva, Fiji at a depth of 608.6 km (378 miles). There is no risk of a tsunami from an earthquake at this depth. Images courtesy of Google
GEOLOGY MEDIA SUITE Chapter 13
 UNDERSTANDING EARTH, SIXTH EDITION GROTZINGER JORDAN GEOLOGY MEDIA SUITE Chapter 13 Earthquakes 2010 W.H. Freeman and Company Three different types of seismic waves are recorded by seismographs Key Figure
Vertical coherence in mantle heterogeneity from global seismic data
 GEOPHYSICAL RESEARCH LETTERS, VOL. 38,, doi:10.1029/2011gl049281, 2011 Vertical coherence in mantle heterogeneity from global seismic data L. Boschi 1,2 and T. W. Becker 3 Received 11 August 2011; revised
3. PLATE TECTONICS LAST NAME (ALL IN CAPS): FIRST NAME: PLATES
: FIRST NAME: PLATES") LAST NAME (ALL IN CAPS): FIRST NAME: PLATES 3. PLATE TECTONICS The outer layers of the Earth are divided into the lithosphere and asthenosphere. The division is based on differences in mechanical properties
LAST NAME (ALL IN CAPS): FIRST NAME: PLATES 3. PLATE TECTONICS The outer layers of the Earth are divided into the lithosphere and asthenosphere. The division is based on differences in mechanical properties
Seafloor Spreading and Paleomagnetism Activity
 Name: PART A: Ocean Bottom Profile Background: Seafloor spreading is the hypothesis that the sea floor moves sideways away from the crest of the mid- ocean ridge. It is estimated that 20 volcanic eruptions
boundaries with additional record sections, as emphasized in Fig. S2. The observations at the
 Data used to Sample African Anomaly. The great circle paths of the source-receiver combinations used in this study are shown in Fig. S1. The event information is given in Table S1. Abrupt Changes across
25th Seismic Research Review - Nuclear Explosion Monitoring: Building the Knowledge Base
 Pn Q UNDER TIBET AND TIENSHAN WITH PRACTICAL AND SCIENTIFIC IMPLICATIONS Jiakang Xie Lamont-Doherty Earth Observatory, Columbia University Sponsored by Defense Threat Reduction Agency Contract No. DTRA01-00-C-0048