JOURNAL OF GEOPHYSICAL RESEARCH, VOL. 114, XXXX, DOI: /,
|
|
|
- Christine Richards
- 5 years ago
- Views:
Transcription
1 JOURNAL OF GEOPHYSICAL RESEARCH, VOL. 114, XXXX, DOI: /, Short-term and long-term tremor migration patterns of the Cascadia 2004 tremor and slow slip episode using small aperture seismic arrays W endy McCausland 1, Ken Creager 2, Mario La Rocca 3 and Steve Malone 2 1 U.S. Geological Survey, Cascades Volcano Observatory, 1300 SE Cardinal Ct, Bldg 10, Ste 100, Vancouver, WA 98683, USA 2 Department of Earth and Space Sciences, University of Washington, Box 35130, Seattle, WA 98195, USA 3 Istituto Nazionale di Geofisica e Vulcanologia, Osservatorio Vesuviano, Via Diocleziano, 328, Napoli, Italy DRAFT September 1, 2008 DRAFT
2 2 MCCAUSLAND ET AL.: SHORT TERM AND LONG TERM MIGRATION OF Abstract Tectonic tremor has been recorded at many subduction zones, including the Nankai, Cascadia, Mexican and Alaskan subduction zones. This study, the first to use small aperture seismic arrays to track tremor, deployed three small aperture seismic arrays along the Cascadia subduction zone during a tremor and slow slip episode in July The tremor was active during virtually all (up to 99%) minutes of the analyzed tremor episode using 5-minute sample windows. Individual wave phases were tracked across the arrays and used to derive slowness vectors. These were compared with slowness vectors computed from a standard layered Earth model to derive tremor locations. Locations were stable within a volume roughly 250 km 2 in epicenter and 20 km in depth for hours to days before moving to a new volume. The migration between volumes was not smooth, and the movement of the sources within the volume followed no specific pattern. Overall migration speeds along the strike of the subduction zone were between 5 and 15 km/day; smaller scale migration speeds between volumes reached speeds up to 2 km/min. Uncertainties in the best locations were 5 km in epicenter and 10 km in depth. For this dataset and processing methodology, tremor does not locate predominately on the primary subduction interface. Our favored model for the generation of tectonic tremor signals is that the tremor is triggered by stress and fluid pressure changes caused by slow slip and is comprised, at least in part, by low frequency earthquakes broadly distributed in location.
3 3 MCCAUSLAND ET AL.: SHORT TERM AND LONG TERM MIGRATION OF 1. Introduction Where and how the stresses created by subduction are released is important to the assessment of seismic hazards. The rate of plate convergence can be estimated using long-term GPS measurements (e.g. Dragert et al., 2001; Miller et al., 2002), and borehole tiltmeters (Hirose and Obara, 2005). In Cascadia and elsewhere that process is not smooth, rather there are periodic, local reversals to the steady convergent plate motion called slow slip events (Dragert et al., 2001; Miller et al., 2002). In the northern Cascadia subduction zone, the slow slip events are accompanied by seismic tremor and occur at regular intervals of months (Miller et al., 2002). This seismic tremor (herein called tectonic tremor) has been detected at a multitude of subduction zones worldwide (Obara, 2002; Schwartz and Rokosky, 2007), notably in Cascadia (e.g. Rogers and Dragert. 2003; McCausland et al., 2005; Szeliga et al., 2004) and along sections of the transform boundary of the San Andreas Fault system (Nadeau and Dolenc, 2005). Yet the two phenomena apparently do not always occur together: to date no tectonic tremor has been observed associated with slow slip events in New Zealand (e.g. Douglas et al, 2005; Wallace et al, 2006), or Hawaii (Segall et. al., 2006; Brooks et al., 2006), and no slow slip has been observed in Parkfield associated with tectonic tremor. Even in subduction zones, there are episodes of tectonic tremor that have no accompanying detectable slow slip (e.g. McCausland et al., 2005), though this may be due to the limits of GPS resolution. A third phenomenon called very low frequency earthquakes (VLF), thus far only detected in southwest Japan, are sometimes coincident with tectonic tremor (e.g. Ito et al, 2007). In Cascadia tectonic tremor signals are emergent, occur as bursts that last for
4 4 MCCAUSLAND ET AL.: SHORT TERM AND LONG TERM MIGRATION OF minutes to hours (Figure 1), have a dominant frequency content between 1 and 10 Hz, large horizontal component amplitudes, and apparent velocities (network-scale moveout of tremor burst) around 4 km/s. Waveforms cannot be directly correlated between stations separated by more than a few kilometers (Figure 1). These characteristics make it difficult to use traditional network data and processing techniques to locate the source of the signals. Previous studies of tectonic tremor have used regional seismic networks to locate and detect tremor using three methods. The first uses relative arrival times at network stations obtained from amplitude variations that can be tracked between network stations by the cross-correlation of signal envelopes (band-pass filtered, rectified signals- herein called envelopes) (Obara, 2002; McCausland et al., 2005). This method is unable to precisely determine the depth of the events because the tremor signals lack phases that can be tracked from regional station to regional station. The second method is the source scanning algorithm (SSA), which searches all space for bright spots of energy (sources) (Kao and Shan 2004; Kao et al., 2005; Kao et al., 2006). This method is computationally intensive and results depend on the identification of amplitude variations that are common to many stations. Both these methods assume that the peaks in the tremor signal represent the direct, minimum-time arrivals such as S-waves. Because the envelopes are maximum amplitude, this assumption may not be valid. The third method cross-correlates previously identified and located low frequency earthquakes on or near the subduction zone interface with the tremor signals (Shelly et al., 2006). However, there is no catalog of independently-occurring, network-detected low frequency earthquakes in Cascadia. Studies using the first two methods in Cascadia have shown that the hypocentral
5 5 MCCAUSLAND ET AL.: SHORT TERM AND LONG TERM MIGRATION OF locations of tremor have a wide depth distribution (12-60km) with errors on the order of kilometers in epicenter and 10 km in depth (Kao et al., 2005; McCausland et al., 2005; Kao et al., 2006). The distribution is not just a wider zone whose geometry mimics the subducting slab, and the spread in depths is much greater than the errors. This is in strong contrast to Japan, where low frequency earthquakes occur concurrently with tremor and locate along and just above the subducting slab interface (third method, Shelly et al., 2006). However, only low frequency earthquakes located on the plate interface were used as template events, potentially biasing the results. Further more, it has not yet been proven that these low frequency events explain the entire tremor wavefield. The signals of tectonic tremor in Cascadia are dominated by SH wave phases, but there is evidence of weak P-wave phases when the data are analyzed on small aperture seismic arrays (La Rocca, et al., 2005; La Rocca et al., submitted to JGR, Sept. 2008). This led to the development of a fourth method that identifies P- and S-wave phases within the tremor signal, and then uses the S-P time to locate the source. The use of the T s-p time poses a strong constraint on the source location, reducing dramatically the uncertainty in the source depth. Many P-S wave sequences have been identified in the July 2004 tremor, however as with method 3, the sources identified do not account for all the recorded tremor wavefield. Results obtained by this method indicate that most of sources are much closer to the subducting slab interface (within +/- 8km) than methods 1 and 2 suggest, but, again, not on a plane that simply mirrors the shape of the interface (La Rocca et al., submitted to JGR, Sept. 2008; La Rocca et al., 2009). All these studies have not yet led to definitive models of the mechanics of tremor sources and their relationship to slow slip. More importantly for hazard, the connections between tremor, slow slip and
6 6 MCCAUSLAND ET AL.: SHORT TERM AND LONG TERM MIGRATION OF the potential for great earthquakes in the locked portions of plate boundaries remains unclear. In Northern Cascadia, network data show the net migration of tremor (along the strike of the subduction zone) at speeds between 5 and 12 km/day (Kao et al., 2006). However network data alone are not adequate to understand how deep tremor changes and progresses on much shorter timescales (seconds to minutes), which could be more directly related with the source process. Thus another approach to studying tremor location, the approach taken in the present study, is to deploy arrays of seismometers and use array processing techniques such that the entire tremor waveform can be correlated among stations that are close to each other to define a coherent wave-front (Figure 1). Array processing techniques can then be used to determine the apparent velocity and back-azimuth of the signal wave-fronts. This experiment is the first to use small aperture seismic arrays to study the wave properties of and spatial and temporal changes of tectonic tremor. Subsequent tectonic tremor array designs, locations and processing techniques in Cascadia utilized the experience of this work (e.g. Wech and Creager, 2007). We installed three temporary seismic arrays in March and April of 2004 to study tectonic tremor associated with one tremor and slow slip episode that occurred in July 2004 in the northern section of the Cascadia subduction zone. At each array we determined the apparent slowness and back-azimuth of the tremor in 5-minute and 30- second windows throughout the sequence of tremor (Section 2.2). We located the tremor bursts using the slowness vector from the three arrays and a 1D S-wave velocity model (derived from the Pacific Northwest Seismic Network (PNSN) P3 model (Crosson,
7 7 MCCAUSLAND ET AL.: SHORT TERM AND LONG TERM MIGRATION OF 1976)) (Section 2.3). We analyzed larger time windows (5-minute) for the entire duration of the 2004 tremor episode (Section 3.1). We then analyzed the short-time scale (30- second) spatial and temporal evolution of tremor locations for a few characteristic time periods (Section 3.2). Results from the longer time window analysis are consistent with the shorter window results, thus justifying the computation savings in using longer time windows to complete the analyses for the entire episode. Using the results of our analyses in Sections 2 and 3, we discuss source models for tectonic tremor that are consistent with the majority of ours and previous observations (Section 4). Our conclusions are outlined in Section Data and Processing 2.1 Small Aperture Array Data From late March through early August 2004, we deployed three seismic arrays to record an anticipated tectonic tremor and slip event: one array was located near Sequim, WA, one on Lopez Island, WA, and one near Sooke, BC (Figure 2). Array locations were chosen to surround the area where the previous repeating Cascadia tectonic tremor and slip events had initiated (Figure 2; Rogers and Dragert, 2003; McCausland et al., 2005). The aperture of the arrays (~600m) and inter-station spacings ( m) were chosen based on the strongest frequencies (1.5-4 Hz) and apparent velocities of the tremor ( km/s) (McCausland et al., 2005). The array near Sequim consisted of 7 stations, recorded at 125 Hz: each station using a Lennartz LE-3Dlite 1-Hz seismometer and a Lennartz Marslite data logger. The array near Sooke consisted of 6 seismic stations recorded at 100 Hz: each station using a DRAFT 3/15/10 DRAFT
8 8 MCCAUSLAND ET AL.: SHORT TERM AND LONG TERM MIGRATION OF 2-Hz L22 seismometer, a Quanterra Q330 data logger, and a Quanterra baler. The array on Lopez Island consisted of 6 stations recorded at 125 Hz. Lennartz LE-3Dlite 1-Hz Cross-correlation analysis The relative arrival times of the tremor at different stations within each array were determined by cross-correlating the waveforms at all station pairs. Sub-sample time delays were obtained by searching for local maxima in the cross-correlation function, fitting a parabola to the values nearest the maximum, and then calculating the lag time corresponding to the peak of the parabola. Time delays greater than 0.25 s were discarded because they are not realistic for a sub-surface seismic source given the maximum inter- station spacing of 568 m. Each remaining time delay was then used in a weighted leastsquares linear-regression that solved for the best fit plane-wave solution to relative seismometers and Lennartz M24 data loggers comprised this array. 2.2 Determination of relative arrival times and the apparent slowness We solved for the apparent slowness using the calculated relative arrival times of the tremor wave-front between station pairs. Each component of each array station was processed separately, and the vertical components were not used because the signal strength was too close to the background noise. Two different window sizes were used to process the data: 5-minutes and 30-seconds. The longer window was used to analyze the first 16 days of the sequence, while the shorter window was used to examine finer scale changes in the tremor during shorter, but representative time periods. Details concerning how these window sizes were determined are described in the first electronic supplement.
9 9 MCCAUSLAND ET AL.: SHORT TERM AND LONG TERM MIGRATION OF arrival. The weights were determined based on the relative size of the first two crosscorrelation maxima. Following Aster et al. (2004) the weighted least-squares linear regression can be described using matrices: A * s = δt, (1) where A contains the pair-wise station spacing differences in x (East) and y (North) coordinates, δt is a column vector containing the observed lag times between pairs of stations, and s is a two element vector containing the East and North components of the slowness of an assumed plane wave. Weights are applied to A and to δt in the following manner: and A w = C -1/2 * A, δtw = C -1/2 * δt, (2) where C -1/2 is a diagonal matrix whose entries are the reciprocals of the estimated errors in the observed travel-time differences. We then find the least-squares solution of the weighted equation A w * s = δt w. (3) The error in the estimate of slowness can be calculated from the estimated errors in the pair-wise time differences. The covariance of a product between a matrix, G, and a vector of random variables, δt w, can be rewritten as where T cov(s) = cov(g*δt w ) = G * cov(δt w ) * G, (4) DRAFT 3/15/10 DRAFT
10 10 MCCAUSLAND ET AL.: SHORT TERM AND LONG TERM MIGRATION OF G = (Aw T * Aw) -1 * Aw T, (5) and the weighted data have a covariance equal to the identity matrix. We evaluate the fit assuming the errors follow a normal distribution and are statistically independent, so that the dimensionless weighted misfit, M = res C -1 res, (6) has a χ 2 -squared distribution with an expected value of N-2, where N is the number of pairs of seismograms. The residual, res, can be determined from the difference between the observed relative arrival times and those predicted by the estimated slowness, res= δt observed - δt modeled = δt A * s. (7) Determination of the errors in the relative arrival times Our estimate of the error in the relative arrival times was determined from the normalized inter-station cross-correlation functions. The relative sizes of the two largest local maxima of the cross-correlation are used as a measure of the uncertainty of the relative arrival time for a station pair. If two seismograms are well-correlated, then the correlation function has one peak that is much higher than any other. If, on the other hand, the two highest peaks of the have similar amplitudes there is a source of coherent noise that is comparable to the signal rendering the observed time lag highly uncertain (an example of the cross-correlations functions is in the first electronic supplement). The ratio, R, between the first and second of the correlation maxima was plotted with respect to the time residual of that station pair, res (Figure 3). We fit this plot with a parametric equation as follows: -1/8-8 res = [ *(R-1)] /1000. (8)
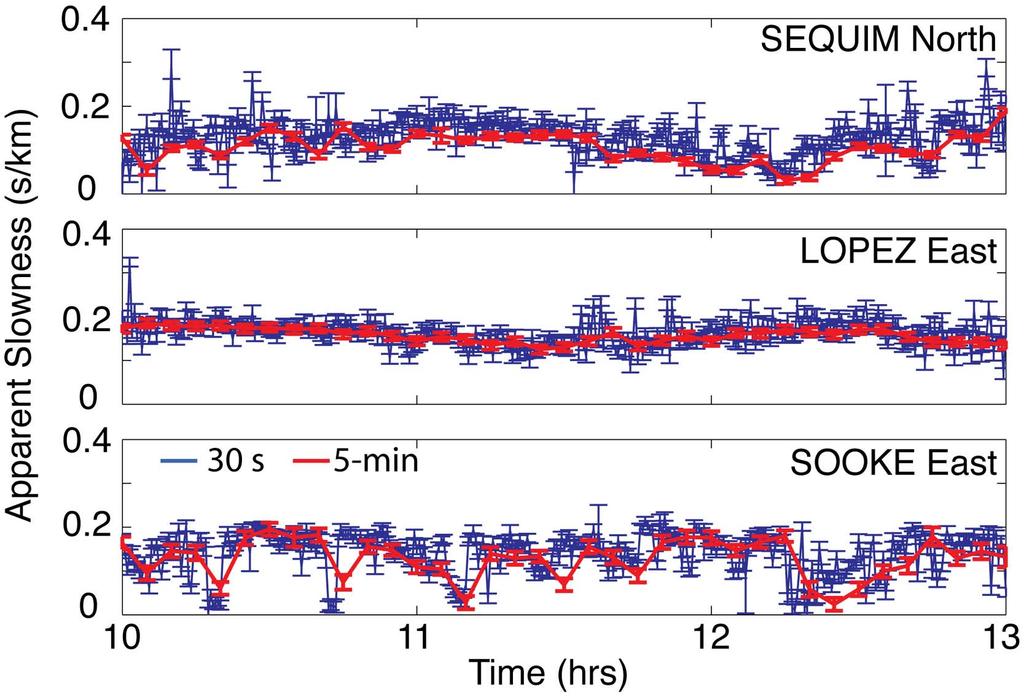
11 11 MCCAUSLAND ET AL.: SHORT TERM AND LONG TERM MIGRATION OF This empirical equation provided a mapping between the ratio of the two largest peaks in the correlogram and the error in the relative arrival time. The estimated error varies from a maximum of 0.25s (R=1) to a minimum of 0.005s (R=2.05). These values were used in the weighted least-squares slowness inversion described above (Section 2.2.1). Figure 4 shows computed slowness values and their errors for three hours on July 11, 2004 for the three arrays for both 5-minute and 30-second time windows. 2.3 Tremor location procedure The tremor locations were determined by minimizing the misfit between the arr ay-calculated slowness values and those predicted by rays traced through a velocity model from trial locations. We used a 1D linear-gradient S-wave model based on the regional P-wave velocity model (P3 model used by the PNSN to locate local and regional earthquakes (Crosson, 1976)) and a constant V p / V s equal to 1.75 (La Rocca et al., 2008). An S-wave model was used because the majority of energy contributing to tremor recorded on horizontal components is from SH-waves (La Rocca et al., 2005). The travel times and slowness vector at each array for the 1D model were calculated using the Java software package TauP (Crotwell et al., 1999). The S-wave velocity model is shown in Table 1. The travel time and slowness were computed for a series of depths and a range of distances for the first arriving S-wave phase. The calculated values were interpolated to obtain the slowness and travel time between points in a regular grid and the centroid of each array. The grid spacing was 5 km in x-y and 3 km in depth. The origin of the grid was 11 km above sea level at degrees north and
12 12 MCCAUSLAND ET AL.: SHORT TERM AND LONG TERM MIGRATION OF degrees west, and the grid extended 245 and 275 kilometers in longitude and latitude, respectively, and to a maximum depth of 88 km below sea level. The source locations were derived by minimizing the χ 2 -misfit (from now on referred to as misfit) between the observed and calculated slownesses for the three arrays, which for this data set can be represented as follows: where M is M(x)= [S obs S m (x)] T * cov(s obs ) -1 * [S obs S m (x)], (9) the misfit for a given grid point x, and S obs and S m are column vectors containing the 12 observed and model predicted values of the east-west and north-south components of slowness at each of the two horizontal channels on each of the three arrays. Our χ 2 statistic has 10 degrees of freedom with an expected value of 10 and should be 16.0 at least 90% of the time. However our misfit values are larger (by at least a factor 5-10) than predicted by the χ 2 -distribution. This is likely a result of the coarseness of the grid, underestimating the uncertainties in slowness, not considering errors in the wave speeds (which in truth is 3D), and, time windows in which the slowness calculated on the east and north components differ by more than the estimated error. Thus we took a Bayesian approach to understanding the error in our locations (Aster et al., 2004). We rescaled the probabilities of obtaining all the locations within the grid such that they added up to one. We summed the probabilities in ever-expanding concentric ellipsoids to determine the area of 90% confidence. The major axes of the ellipsoids are used to estimate the uncertainty in the location (Figure 5). The average of the errors in the best locations (misfit < 100) between July 6 and July 22 are of the order of 5-6 km in epicenter and 10 km in depth for 5-minute time windows (Table 3). Errors
13 13 MCCAUSLAND ET AL.: SHORT TERM AND LONG TERM MIGRATION OF in the locations more generally (misfit <600) for 5-minute time windows are on the order of 13 km in epicenter and 16 km in depth. 3. Tremor Locations and Spatio- Temporal Behavior Observations using network (McCausland et al., 2005) and array processing of the locations and the gross migration of the tremor over many hours to days are consistent. The first tremor bursts in the July 2004 episode located beneath the region of the Strait of Juan de Fuca east of Lopez and Sequim arrays, and subsequent epicenters migrated first in the east and west directions between the arrays at average speeds between 5-10 km/day. Then the epicenters migrated bi-directionally along strike, to the south of the Strait under the northern Olympic Peninsula and to the northwest of the Strait under Vancouver Island. This second (bi-directional) migration is the same as was observed from the location of tremor bursts using the PNSN stations (McCausland et al., 2005) and occurred at average speeds of 15 km/day. Dense seismic arrays are more sensitive to low levels of tremor than the regional network data. From PNSN data, we initially determined that the July 2004 tremor episode in Cascadia began on July 8 and lasted until July 24 in the region of the arrays. However, through the cross-correlation of the array data, we determined that the tremor sequence in the region between the three arrays started on July 6, 2004, but by July 24 th it had migrated out of the region between the three arrays but could be still detected on the Sooke array through July 27, when the arrays were dismantled. The large-scale migration of the tremor source occurred at an average speeds between 5 and 15 km/day, similar to
14 14 MCCAUSLAND ET AL.: SHORT TERM AND LONG TERM MIGRATION OF results of previous studies (Kao et al., 2006). The small-scale migration of the tremor source occurred at speeds between 1 and 2 km/min consistent with results in Japan (Shelly et al., 2007). Cross-correlating the array data in 5-minute analysis windows, we observed that tremor occurred during most hours (at the most, 99%) of the tremor episode (Table 2; locations summarized by day in second electronic supplement). Thus tremor catalogs based on network data alone (e.g. Rogers and Dragert, 2003; McCausland et al, 2005) underestimate the total number of hours of tremor. The depth distribution of the tremor locations including the errors is wider than would be expected if all of the tremor located on the subducting slab interface (Preston et al., 2003; Medema, 2006). They generally locate relative to the slab interface, but not directly on the interface, similar to previous studies in Cascadia (e.g. Kao et al., 2005; Kao et al., 2006; McCausland et al, 2005). Rather than attempting to reduce the depth error by using a priori assumptions (e.g. that the tremor sources occur on the plate interface ), we have tried to locate events without bias and to rigorously quantify the errors in the depths for the methods used in this experiment. 3.1 Consistency of Results We used 5-minute non-overlapping time windows to examine the changes in the tremor locations during the entire time period of interest (July 6 22, 2004), when tremor wa s located between the three arrays. We used 30-second time windows with 18-second overlap for representative time periods to examine the shorter scale changes in the tremor locations and characteristics. Comparing the results from the two analyses reveals that the general characteristics, locations, and errors remain consistent between the 30-second and
15 15 MCCAUSLAND ET AL.: SHORT TERM AND LONG TERM MIGRATION OF 5-minute time windows (Figure 4). Thus the larger time windows are a reasonable proxy for the 30-second time windows, allowing for a faster and more efficient way to summarize changes over the whole tremor episode. This also suggests that the location of the strongest tremor sources are stationary within the location error (5-16 km depending on misfit criteria, see Table 3) over 5 minutes, and from day-long plots of the slowness at the three arrays (one example from Lopez array in Figure 6a) the locations are in fact stationary within the errors over minutes to hours. Comparing the errors for the best locations (Table 3) to errors in array-determined earthquake locations in the same region from LaRocca et al. (2008) (<5 km in x and y, < 10 km in z), we find that the errors agree reasonably well. 3.2 Spatio-Temporal Evolution of the Tremor, July 6-22, 2004 The tremor began beneath the Strait of Juan de Fuca on July 6, and persisted there through July 11, During these first days, the majority of tremor epicenters were confined to within a small region (approximately 250 square kilometers on any given day), where on a day-to-day scale, the tremor epicenters migrated between a region east of Lopez and Sequim and a region to the west between the three arrays separated by a distance of about 50 km (see second electronic supplement). Average speeds of these migrations are between 5 and 10 km/day. The depths of the tremor range primarily between km on July 8 through July 11. Depths are generally, but not always, deeper to the east during these days suggesting that the tremor locations maintain, at the very least, a similar relationship to the plate interface. The shallowest depths are on July 6 and 7, the beginning of the episode.
16 16 MCCAUSLAND ET AL.: SHORT TERM AND LONG TERM MIGRATION OF On July 11 the epicenters are in the same region as the previous days (Figure 7), but the signal amplitudes are stronger and we obtained more locations. By July 12, the epicenters cover a larger region 50 km in latitude from Sooke to Sequim (e.g. see Figure 8 and second electronic supplement). At this point, despite the fact that the amplitude of the tremor is at its largest, the locations of the tremor have larger errors, particularly in depth with many of the events locating at the bottom edge of our grid. Such depths are not considered reasonable. In the 5-minute window results, the tremor moved around within this region smoothly on an hourly time scale, but without any specific pattern (such as upwards or downwards, along a line or outward from a given point). This time period shows more complicated migration pattern in the 30-second time windows discussed in the next section. The apparent widening of the tremor region on July 12 coincided with the time periods in which multiple sources began to be evident from network locations (McCausland et al., 2005) and from beam-forming analysis at the arrays (the tremor data are stacked at all possible apparent slownesses) (Figure 9). Beam-forming analysis from July 15 shows that at the Sequim array there were tremor sources to the northwest and southwest (Figure 9). At Sooke array, the sources were to the northeast and southeast of the array. For both arrays, these back-azimuth directions are consistent with array- determined source locations (Figure 8). Multiple sources were most common between July 12 and 17, and are easily observed on the Sequim and Sooke arrays. Multiple source regions complicate our ability to locate the tremor with the method because our analysis picks out the strongest source in any given window at each array. The strongest sources might be different at each array, therefore the method may not be able to resolve a
17 17 MCCAUSLAND ET AL.: SHORT TERM AND LONG TERM MIGRATION OF location that satisfies the calculated slowness at all three arrays. This greater distribution of locations during these days made the hourly-scale temporal progression harder to follow: the source that is the strongest in one window may not be the strongest in the next window (Figure 6b). This will cause the temporal progression from window to window to appear more chaotic or sporadic than it truly might be. Between July 17 and 24, the tremor located primarily around and to the northwest of the Sooke array. Depths during this time period were poorly to completely unconstrained because the Lopez and Sequim arrays were too far away from the tremor source to help constrain the depth. The epicenters had migrated out of the area of robust constraints (between the three arrays) by July 24, but tremor could still be detected through July 27 th when the last array, Sooke, was dismantled. Figure 10a shows all locations with a misfit less than 200 for the time period bet ween July 6 and July 22; average errors in these locations are 8 km in the East-West and North-south directions and 12 km in depth. For comparison all locations with no misfit cut-off are plotted on the same figure (Figure 10b). The locations are all within the same region and depths, including events with large errors (> 20 km). Figures in the second electronic supplement include two-dimensional histograms of the locations for July 6 July 22 for 5-minute time windows. The location errors in the supplement averaged over all days are <11 km in x- and y-directions, < 15km in depth. The errors in the locations were determined for the 5-minute time windows from the size of the 90% region of the Bayesian modified misfit calculation. 3.3 Spatio-Temporal Evolution of Tremor on July 11 and July 15, 2004 DRAFT 3/15/10 DRAFT
18 18 MCCAUSLAND ET AL.: SHORT TERM AND LONG TERM MIGRATION OF To examine the spatial and temporal progression of the tremor on a time scale on the order of minutes, we looked in greater detail at windows in the early days of the sequence when the tremor was located between the three arrays and seemed to be isolated to a small region (see second electronic supplement). We used 30-second long windows with an 18-second overlap; the overlapping 30-second time windows ensured that the same tremor source was included within the time window at each array, for sources located between the three arrays. There was just one source active in a given time window during the first days of the tremor episode (July 6-11, 2004), and the direction and slowness of the waves from a source were steady over time periods of minutes or longer (Figure 6a). Changes in the direction and slowness (which relate to changes in location) occurred gradually and systematically over time periods of 2 to 4 hours; they did not occur abruptly or chaotically. Changes in azimuth that did occur were within degrees; changes in slowness were within 0.15 s/km. On July 11, 2004, tremor amplitudes were the largest for the times when the source region was spatially-limited (Figure 7). We examined the first five hours of July 11 in 30-second time windows with an 18-second overlap (Figure 11). Results are consistent with those obtained from the non-overlapping 5-minute windows (Figure 7). The locations moved around within roughly 15 km in latitude, 40 km in longitude and 20 km in depth. From one time window to the next, the locations do not change greatly: the average change in the epicentral location was km, and the average change in depth wa s km. This made determining an average migration speed difficult, but at most the sources moved 10 km/hr. Only in the later days of the episode (after July 12), when
19 19 MCCAUSLAND ET AL.: SHORT TERM AND LONG TERM MIGRATION OF the tremor migrates bi-directionally do the shorter analysis windows show more extreme variations in the location of the tremor source. During the last hours on July 11, 2004, there was more than one active source region (Figure 7), therefore we used 30-second time windows with a 10-second overlap to investigate the epicenter transition between these two regions or whether the two regions were simultaneously active. Figure 12 shows a filmstrip representation of consecutive 5-minute summaries of locations for 30-second analysis windows. The transition of the tremor from one region to another occurs between 21:00 and 22:00 hours. The tremor does not simply jump from one region to another, but the movement is not smooth either. The epicenters move generally west to east, back west, and then stay to the east for a few hours. The initial three and final two frames show the migration is not perpendicular to strike (roughly northeast), rather it is in the east-west directions. The majority of the intervening frames show movement in the up- and down-dip directions. The speeds of these migrations range from 1-2km/min, regardless of direction. Source depths are deeper than the slab, but are deeper in the downdip direction, consistent with the shape of the slab. Finally we examined a day in which there were several different tremor sources active at any given time knowing we would be able to resolve fewer locations even tho ugh the tremor amplitudes were at their largest. When the tremor data are stacked at individual arrays for all possible apparent slownesses (beam-forming), multiple source regions are clearly resolved (Figure 9), a result which is consistent with network- determined locations (McCausland et al., 2005) and consistent with times when the first two peaks of the cross-correlation function are of similar magnitude. Locations from just
20 20 MCCAUSLAND ET AL.: SHORT TERM AND LONG TERM MIGRATION OF 1 hour on July 15 for 30-second time windows are shown in Figure 13. Figure 13a shows the best locations (misfits < 100) with their 90% confidence region. The location errors are larger than for the same misfit criterion on July 11, and with the exception of one location, the depth error is essentially unconstrained. Figure 13b shows a histogram of more locations (misfits < 600), which gives a better indication of the source distribution. The sources cover a much larger region than in earlier days of the tremor episode: near Sequim there are three sources, one to the northeast of the array and two to the southwest; near Lopez there is one to the southwest; while near Sooke the sources cover a 180 degree arc clockwise between the northeast and southwest directions. 4. Interpretation and Discussion The goals of our experiment were to better locate the tremor, to track the pro gression of tremor sources during an ETS event, and thus to better understand the source of the tremor and how it relates to the processes at plate boundaries. In this section, we will comment on the results from this small-aperture seismic array experiment, and evaluate two working hypotheses for the tremor source, taking into account the tremor observations, GPS observations and other geochemical and geophysical observations found in Cascadia and other warm, young subduction zones. 4.1 Comments on results from this experiment and previous network observations From the array data we observe that the migration of tremor hypocenters on a several day time scale is not smooth, but rather the hypocenters are localized to within 15
21 21 MCCAUSLAND ET AL.: SHORT TERM AND LONG TERM MIGRATION OF km horizontally and km in depth for several days, and then the active volume rapidly (within hours) shifts to a new position. Our detailed analysis allowed a raw estimate of the migration velocity, which in some cases yields values up to 2 km/min. This value reveals a small scale behavior of the tremor quite different compared with the much slower migration estimated at regional scale. The depths observed with the arrays in this experiment (30-70km) are slightly deeper than the network depths (12 60 km) (McCausland et al., 2005; Kao et al., 2006). While the array locations do not fall precisely along the modeled subducting slab interface, they do seem to better mirror the slab interface than the network locations. The lack of shallow (12-30km) array-determined locations could be an artifact of using only direct S-wave phases to calculate the model slowness values. In other words, only the first arriving up-going (s) or down-going (S) direct S-wave was used to calculate the theoretical slowness vector for each grid point to each array- no converted phases were considered (e.g. ss, ps, etc). However this assumption may cause deeper depths to be assigned to those shallow sources whose first arriving phases are converted phases, such as tremor sources whose distance from the array is great compared to the depth. Therefore this assumption will preclude shallower sources. Location solutions for the 1D velocity model have the smallest errors when there is a single tremor source region active at one time, and location solutions become almost impossible to determine with the present methodology when multiple source regions are active. The presence of multiple active source regions can be seen in the network data, in the 5-minute cross-correlated time windows (McCausland, 2006), and from beamforming analysis on 5-second overlapping time windows where the source location can
22 22 MCCAUSLAND ET AL.: SHORT TERM AND LONG TERM MIGRATION OF change over 1 second (Figure 9). Therefore a more sophisticated methodology needs to be developed to track the tremor when it resolves into simultaneous multiple source regions near the arrays. The same signal characteristics are observed as from network data, and some network-scale observations are important to our discussion of possible tremor source models. Average reduced displacements (McCausland et al., 2005) for tremor with and without a known slow slip event are similar indicating that the amplitude of the seismic signal is independent of whether a detectable slip event occurs. However the epicentral regions for the Cascadia tremor events without slip are smaller than those with slip, suggesting that if the tremor and slip always occur together then perhaps the slip patch is below the current resolution of regional GPS networks. On the time scale of days and over great distances (hundreds of kilometers), the network-determined tremor epicenters are consistent with the progression of previously modeled slow slip events (e.g. Dragert et al., 2001; McCausland et al, 2005; Kao et al., 2007). However on shorter time scales (minutes to hours), the source locations are more chaotic (this experiment; McCausland et al., 2005; Kao et al., 2006). Finally the tremor can migrate bi-directionally from the point of initiation. 4.2 Comments on other seismic, geophysical, geodetic, geochemical data relevant to the mechanism of tectonic tremor in Cascadia A comprehensive physical model of tectonic tremor must account for a number of constraints from the seismic signals themselves and from our analysis of the spatial and temporal properties of the tremor. In this section we start our discussion of models with a DRAFT 3/15/10 DRAFT
23 23 MCCAUSLAND ET AL.: SHORT TERM AND LONG TERM MIGRATION OF brief summary of the constraints we have developed and of those from previous geophysical, geodetic, seismic and geochemical studies. The general seismic character of tremor can be summarized as: low band-limited frequency content, emergent-onset, long- durations, small-amplitudes, dominance of the waveform by S-waves (e.g. Obara, 2002; McCausland et al., 2005; Kao et al., 2006), and embedded low frequency earthquakes within the tectonic tremor signal (Shelly et al., 2006; La Rocca et al., 2009). The spatial and temporal characteristics of Cascadia tectonic tremor are: frequent concurrence with cyclic geodetically-measured slow slip events (Rogers and Dragert, 2003), overall migration of tremor epicenters on several day times scales (Rogers and Dragert, 2003; McCausland et al., 2005; Kao et al., 2007), depth distribution of locations greater than the depth variation of the subducting slab (McCausland et al., 2005; Kao et al., 2006; this experiment), persistence of tremor within a localized volume on the time scale of hours, presence of multiple active source regions in very short (2-second), short (30-second), and long time windows (5-minute), and independence of size (average reduced displacements) for a given episode from measured geodetic slip (McCausland et al., 2005). Geochemical studies indicate that fluids are released from the subducting crust and sediments in the region where tremor and slow slip are observed (e.g. Peacock, 1993; Hyndman and Peacock, 2003). These same geochemical studies also indicate that the introduction of fluids to the overlying mantle in this region is likely fracture-controlled and eventually interacts with the overlying mantle peridotite to form serpentinite, reducing the density and seismic velocity and increasing Poisson s ratio of the overlying mantle (Hyndman and Peacock, 2003; Christensen, 2004; Evans, 2004). Field evidence
24 24 MCCAUSLAND ET AL.: SHORT TERM AND LONG TERM MIGRATION OF shows that fluid movement and serpentinization in the mantle is likely fracture controlled (Evans, 2004). These material changes are corroborated in Cascadia by seismic studies that indicate anomalously low shear wave velocities in the overlying mantle (e.g. Bostock et al., 2002; Brocher et al., 2003; Nicholson et al., 2005). Magnetotelluric studies in Japan (Seno et al., 2001, Matsumoto et al., 2003; Umeda et al., 2006) and Cascadia (Kurtz et al., 1986; Soyer and Unsworth, 2006) show conductivity anomalies in the lower crust above the subducting slab that are interpreted to result from the presence of interconnected fluids. In Cascadia the anomaly is located at approximately 20 km beneath Vancouver Island (Soyer and Unsworth, 2006). 4.3 Discussion and source hypotheses Choice of a definitive model from plausible models for tremor depends critically on which of the depth distributions of tremor reported in the many existing studies is the correct one. Three location methods in Cascadia (McCausland et al., 2005; Kao et al., 2006; this experiment) have found that the tremor locations have a depth distribution that is different than simply locating along the modeled subduction zone interface. Other studies in Cascadia and in Japan have found that some fraction of the signal can be explained by low frequency earthquakes that locate on or very near the modeled subducting plate interface, and these studies suggest that these signals interfere in such a way as to produce the near continuous recorded displacements (Rogers and Dragert, 2003; Shelley et al., 2006; La Rocca et al., 2009). The three methods that find a larger depth distribution make no assumption about the nature of the tremor source. Furthermore they use more of the wavefield, including the parts that cannot be explained by low frequency earthquakes, while allowing for the inclusion of low frequency
25 25 MCCAUSLAND ET AL.: SHORT TERM AND LONG TERM MIGRATION OF earthquakes within the tremor signal.in the following paragraphs, we consider two possible models for tremor source location and the relevant supporting observations for each. In the first model, the tremor signal is comprised only of the collective radiation from low frequency earthquakes located only on the subduction interface, and is consistent with the depth distribution in Japan of Shelly et al. (2006). In a second model, the tremor signal is more broadly distributed in location (both at and near the subducting slab interface), is comprised in part by low frequency earthquakes, but is triggered by stress and fluid pressure changes caused by slow slip It is important to note that many properties of tectonic tremor are consistent with both source models, such as the coincidence of tremor with slow slip events, the slow migration of tremor epicenters roughly coincident with the migration of slow slip events, the long duration and emergent onset of the signals, the dominance of SH-waves in the tremor wavefield, and the presence of P- and S-wave pairs in the signals (La Rocca et al., 2005; La Rocca et al., 2009; La Rocca et al., submitted to this JGR volume, Sept. 2008). Both models are consistent with the geochemical and geophysical constraints on the presence of confined, pressurized fluids throughout a volume above the slab. An increase in fluid pressure results in a decrease in effective normal stress on fractures allowing for strain energy release at low shear stresses. These resulting strain releases (e.g. low stress drop earthquakes) need not be limited to the subduction interface. The fault slip may be reasonably as broad as the source region of the dehydration and mantle hydration reactions, consisting of a distributed set of pressurized faults and fractures. There are several examples of the phenomenon of fluid-reduced normal stresses and subsequent failure in other tectonic settings (e.g. Vidale and Shearer, 2006; Segall et al., 2006). The
26 26 MCCAUSLAND ET AL.: SHORT TERM AND LONG TERM MIGRATION OF presence of confined fluids can explain the concurrence of tremor and slow slip events both if the coincidence of tremor and slow slip are manifestations of the same phenomenon at different source time scales, and if the occurrence of the slow slip event changes the stress in the surrounding material, which in turn increases pore pressure and allows localized low frequency earthquakes. Several of the findings from this experiment are also consistent with both models. First are the short-term (minutes to hours) migration patterns of the tremor, where the tremor sometimes jumps from one region to another in any direction. This implies that the slow slip and tremor are not the simple unzipping or smooth propagation of a rupture front. Furthermore the tremor epicenter volume migrates both away and toward the trench within hours at the same point along strike of the subduction zone, and within a given volume the epicenters have no specific migration pattern, both of which are more similar to a tectonic aftershock distribution or swarm than a propagating rupture front. Perhaps the tectonic tremor and slow slip process is a very slow version of an earthquake, where in large-scale (for tremor, this is days) the tremor migrates smoothly along strike; but in fine-scale (minutes to days), the rupture is complicated and possibly linked to more than one asperity along the fault plane or planes, like for the rupture fronts modeled for the 2004 Parkfield earthquake (e.g. Ma et al., 2008) and 2004 Sumatra earthquake (Ishii et al., 2005). Because studies of tremor location relative to the subducting slab interface are not in agreement, we must consider the possibility that the depth locations in our study or in other studies are in error. Most of the studies to date in Cascadia find the sources to be distributed (McCausland et al., 2005; Kao et al., 2007), but new techniques are being
27 27 MCCAUSLAND ET AL.: SHORT TERM AND LONG TERM MIGRATION OF developed and larger arrays are being deployed, and results from these studies shows evidence of low frequency events within the tremor that concentrate closer to the subduction interface (La Rocca et al., submitted to this volume Sept 2008; La Rocca et al., 2009). Therefore consider first that the depth distribution in the current study is an artifact of the processing methods or velocity models used, and that the tremor signal is indeed comprised only of the collective radiation from many low frequency earthquakes on the subducting plate interface. These low frequency earthquakes could represent the release of seismic energy in the transition zone, between stick-slip and stable sliding behavior. We know that their low frequency content is a product of the source process because regional earthquakes of similar depths have a normal tectonic earthquake spectrum. The low frequency content is compatible with low-stress drop earthquakes that occur in a material with a very low shear modulus (e.g. Kamaya et al., 2004; Ito and Obara, 2006a; Ito and Obara, 2006b). The juxtaposition of broadband tectonic events and tectonic tremor would suggest that the material properties at these depths are spatially heterogeneous and when the strain rates are high, broadband earthquakes are produced. But in areas with a low shear modulus and when the strain rate is low (and close to static), low frequency earthquakes are produced. This model, where the tremor is composed of low frequency events located on the interface in studies to date, presumes the plate interface is a well-defined, single fault zone; however geodetic models cannot rule out the possibility that the slow slip source is on a distributed in a thicker shear zone or wedge, or that the slip is occurring on portions of the slab that have delaminated from the down-going plate, as reflectors delineated by seismic reflection data under Vancouver Island could be interpreted (Nicholson et al., 2005). The low frequency earthquake
28 28 MCCAUSLAND ET AL.: SHORT TERM AND LONG TERM MIGRATION OF locations in Cascadia (La Rocca et al. 2009; La Rocca et al., submitted to this volume Sept. 2008) have better resolution than the current experiment because one can identify both P- and S-wave phases or S-P times within the tremor signal. However, it has yet to be demonstrated at a high level of certainty that the entire tremor wavefield is made up of these low frequency earthquakes. Now consider that the depth distribution of the tremor locations in this study is real, that the tremor is partly comprised of low frequency earthquakes that occur along the down-going slab interface, but that some fraction of the tremor signal results from sources that locate above or below that interface. This model assumes that the tremor signal results from slip or rapid motion at high fluid pressures in confined faults and fractures, with off-slab high fluid pressures generated by local changes in the stress field around the slab interface during a slow slip event. The off-slab signals could be low frequency earthquakes or another seismic process that lacks clear P- and S- wave phases on structures parallel or perpendicular to the plate interface. Consider as well that off-slab signals could occur because the slab interface is not a single well-defined plane but rather a distributed wider shear zone, including the occurrence of tremor and slip on portions of the subducting slab that have delaminated. Instead of being confined to a well-defined fault plane, the tremor occurs at depths that reflect the structure of the shear zone and stress field. The events making up the tremor are essentially continuous (identified on one array (Lopez) during 99% of the 2004 tectonic tremor and slow slip episode), and the tremor episodes have small variations in maximum amplitudes within and between episodes (McCausland et al., 2005), indicating that the tremor does not obey the same
29 29 MCCAUSLAND ET AL.: SHORT TERM AND LONG TERM MIGRATION OF magnitude scaling relationship as tectonic earthquakes. In fact they exhibit characteristics more akin to earthquake swarms than mainshock-aftershock sequences. This model allows the material properties to vary over short distances in all directions, whereby the low frequency earthquakes are occurring in material that is more brittle and the slip is occurring in material that is more ductile. This variation in material properties explains how broadband tectonic earthquakes can be located in the same areas as the tectonic tremor and slow slip events. Results described in this paper and previous network results of source location, which show a wide depth distribution, are consistent with the second source model. 5. Conclusions This experiment was the first to use small aperture seismic arrays to track the location of tectonic tremor using a time-windowing approach. Our purpose in determining the spatial and temporal evolution of tremor during large tectonic tremor and slow slip episode is to better constrain possible physical mechanisms of tremor and how it relates to subduction zone structure and therefore to regional seismic hazard in northern Cascadia. To study the July 2004 Cascadia tectonic tremor and slow slip episode, we used three small aperture seismic arrays above the subduction zone with locations chosen to surround the initiation point of several previous tectonic tremor and slow slip episodes. Using 5-minute duration windows, we found that tectonic tremor was active up to 99 percent of the tremor and slow slip episode, a result that suggests that network derived tremor counts are greatly underestimated.
30 30 MCCAUSLAND ET AL.: SHORT TERM AND LONG TERM MIGRATION OF Tectonic tremor locations were calculated by tracking individual wave phases across the stations of the arrays and comparing those vectors to ones derived using standard layered Earth velocity model. Uncertainties in the best locations are 5km in epicenter and 16km depth. At the beginning of the episode when the locations are best resolved, the tectonic tremor locations were found to be stationary within a volume roughly 250 km in epicenter and 20km in depth for hours to days before moving to a new volume; the movement of the tremor locations within a given volume followed no specific pattern. The transition between volumes was not a smooth unidirectional migration; rather the locations begin to transition, return to the original volume and restart the transition. We observed transitions in both the updip and downdip directions. The overall daily migration speeds estimated from the data agree with previous studies, but small scale (minutes) estimates of the source migration speeds yielded values as fast as 2 km/min, a detail that cannot be determined from network data. We considered our results and those of previous studies of tectonic tremor and slow slip in Cascadia and existing constraints from geophysics, seismology and geochemistry of the region to address possible physical mechanisms responsible for tremor. We argue that the collective evidence suggests, but does not definitively require, that tectonic tremor is related to the presence of fluids at depth, but whether the presence of fluids causes the tremor and slow slip or just facilitates their occurrence under the correct stress conditions is not yet clear. Our favored model is that pressurized pore fluids reduce normal stresses along pre-existing faults and fractures at and near the subducting plate interface causing low stress drop earthquakes that make up at least part of the tremor signal, and that the migration of tremor is not a smooth process indicating
31 31 MCCAUSLAND ET AL.: SHORT TERM AND LONG TERM MIGRATION OF variability in slab conditions material properties at the locations of the tremor sources along dip and strike of the Cascadia subduction zone. In Cascadia, it remains unclear whether tremor is concentrated on the subduction interface or is more distributed; our results suggest that it is distributed. To distinguish between interface and distributed models of tectonic tremor source, some issues must be resolved and additional data acquired. For example the location and configuration of the slab interface is not known precisely. Studies that have modeled the slab interface are based primarily on velocity changes (reflection surveys), earthquake locations, and receiver functions; thus we cannot truly know if the tremor is locating on the subducting slab interface, on a series of planes that define the interface, within the plate, or just above. Further data relating the exact timing of the initiation of the tremor and slip events is required to understand which occurs first and if they always accompany one another. Studies using the Plate Boundary Observatory borehole strain meters can resolve slow events on shorter time scales than with GPS data. Using the co-located borehole seismometers, which have better signal-to-noise than surface stations, one also might discern the relative timing of the initiation of slow slip events and tremor.
32 32 MCCAUSLAND ET AL.: SHORT TERM AND LONG TERM MIGRATION OF Acknowledgments The Deep Tremor Project 2004 was funded by NSF EAR Seismic sensors used at Lopez and Sequim array were financed and loaned by AMRA, Regione Campania, Italy. Seismic stations used at Sooke were provided by the PASSCAL instrument pool of IRIS. The authors gratefully acknowledge the assistance of personnel from the Pacific Northwest Seismograph Network and from the Pacific Geoscience Centre who provided valuable discussions and assisted in the installation and servicing of the Sooke array. We also thank E. Roeloffs, Nick Beeler, the reviewers and editors for their comments that improved the quality of this paper.
33 33 MCCAUSLAND ET AL.: SHORT TERM AND LONG TERM MIGRATION OF References Aster, R., B. Borchers, and C. Thurber (2004), Parameter Estimation and Inverse Problems. Burlington, MA: Elsevier Science & Technology. Bostock, M.G., R.D. Hyndman, S. Rondenay and S.M. Peacock (2002), An inverted continental Moho and serpentinization of the forearc mantle, Nature, 417, Brocher, T.M., T. Parsons, A.M. Trehu, C.M. Snelson, and M.A. Fisher (2003), Seismic evidence for widespread serpentinized forearc upper mantle along the Cascadia margin, Geology, 31 (3), Brooks, B., J.H. Fostera, M. Bevis, L.N. Frazera, C.J. Wolfe and M.B. Behn (2006), Periodic slow earthquakes on the flank of Kilauea volcano, Hawaii, Earth and Plan. Sci. Lett., 246, Issues 3-4, Chouet, B. (1996), New Methods and Future Trends in Seismological Volcano Mon itoring, in Monitoring and Mitigation of Volcano Hazards, edited by R. Scarpa and R.I. Tilling, Springer-Verlag, Berlin/Heidelberg, Germany, pp Chouet, B. (2003), Volcano Seismology, Pure Appl. Geophys. 160,
34 34 MCCAUSLAND ET AL.: SHORT TERM AND LONG TERM MIGRATION OF Christensen, N.I. (2004), Serpentinites, peridotites, and seismology, in Serpentine and Serpentinites: Mineralogy, Petrology, Geochemistry, Ecology, Geophysics and Tectonics, edited by W.G. Ernst, Bellwether Publishing, Ltd., Columbia, MD, pp Crosson, R. S. (1976), Crustal structure modeling of earthquake data 1. Simultaneous least squares estimation of hypocenter and velocity parameters; J. Geophys. Res., 81, B17, Crotwell, H.P., T.J. Owens, and J. Ritsema (1999), The TauP Toolkit: Flexible seismic travel-time and ray-path utilities. Seis. Res. Lett., 70, Douglas A., J. Beavan, L. Wallace, and J. Townend (2005), Slow slip on the northern Hikurangi subduction interface, New Zealand, Geophys. Res. Lett., 32, L16305, doi: /2005gl Dragert, H., K. Wang, K, and T.S. James (2001), A silent slip event on the deeper Cas cadia Subduction Interface, Science, 292, Evans, B., The serpentinite multi-system revisited: chrysotile is metastable (2004), in Serpentine and Serpentinites: Mineralogy, Petrology, Geochemistry, Ecology, Geophysics and Tectonics, edited by W.G. Ernst, Bellwether Publishing, Ltd., Columbia, MD, DRAFT 3/15/10 DRAFT
35 35 MCCAUSLAND ET AL.: SHORT TERM AND LONG TERM MIGRATION OF Hirose, H., and K. Obara (2005), Repeating short- and long-term slow slip events with deep tremor activity around the Bungo channel region, southwest Japan, Earth Planets Space, 57, Hyndman, R. and S.M. Peacock (2003), Serpentinization of the forearc mantle, Earth and Plan. Sci Lett., 212, Ishii, M., P.M. Shearer, H. Houston, and J.E. Vidale (2005), Extent, duration and speed of the 2004 Sumatra-Andaman earthquake imaged by the Hi-Net array, Science, Vol. 435, Ito, Y., and K. Obara (2006a), Dynamic deformation of the accretionary prism excites very low frequency earthquakes, Geophys. Res. Lett., 33(2), L Ito, Y., and K. Obara (2006b), Very low frequency earthquakes within accretionary prisms are very low stress-drop earthquakes, Geophys. Res. Lett., 33(9), L Julian, B.R. (1994), Volcanic tremor; nonlinear excitation by fluid flow, J. Geophys. Res., 99 (B6), 11,859-11,878. Kamaya, N., A. Katsumata, and Y. Ishigaki (2004), Low-frequency tremor and slow slip around the probably source region of the Tokai Earthquake- A new indicator for
36 36 MCCAUSLAND ET AL.: SHORT TERM AND LONG TERM MIGRATION OF the Tokai Earthquake prediction provided by unified seismic networks in Japan, USGS Open File Report , 47. Ka o, H., and S. Shan (2004), The Source-Scanning Algorithm: mapping the distribution of seismic sources in time and space, Geophys. J. Int., 157, 2, Ka o, H., S. Shan, H. Dragert, G. Rogers, J. F. Cassidy, K. Wang, T. S. James, and K. Ramachandran (2005), A wide depth distribution of seismic tremors along the northern Cascadia margin. Nature, 436 (7052), Kao H., S. Shan, H. Dragert, G. Rogers, J. F. Cassidy, K. Wang, T. S. James, and K. Ramachandran (2006), Spatial-temporal patterns of seismic tremors in northern Cascadia. J. Geophys. Res., 111, B03309, doi: /2005jb Kao H., S. Shan, G. Rogers, H. Dragert (2007), Migration characteristics of seismic tremors in the northern Cascadia margin, Geophysical Research Letters, (34) doi: /2006gl Kurtz, R.D., J. M. DeLaurier, and J. C. Gupta (1986), A magnetotelluric sounding across Van couver Island detects the subducting Juan de Fuca plate, Nature 321, (05 June 1986); doi: /321596a0. DRAFT 3/15/10 DRAFT
37 37 MCCAUSLAND ET AL.: SHORT TERM AND LONG TERM MIGRATION OF La Rocca, M., K.C. Creager, D. Galluzzo, S. Malone, J.E. Vidale, J.R. Sweet, and A.G. Wech (2009), Cascadia Tremor Located Near Plate Interface Constrained by S ratios in well gases in the Kinki district, SW Japan: surface appearance of slab- Minus P Wave Times, Science, 323, La Rocca, M., D. Galluzzo, S. Malone, W. McCausland, G. Saccorotti, and E. Del Pezzo (2008), Testing Small-Aperture Array Analysis on Well-Located Earthquakes, and Application to the Location of Deep Tremor, Bull. of the Seis. Soc. of Am., 98, p La Rocca, M., D. Galluzzo, S. Malone, W. McCausland, and E. Del Pezzo, Array analysis and precise source location of deep tremor in Cascadia, submitted to J. Geophys. Res., La Rocca, M., W. McCausland, D. Galluzo, S. Malone, G. Saccorotti, and E. Del Pezzo (2005), Array measurements of deep tremor signals in the Cascadia subduction zone, Geophys. Res. Lett., 32, L Ma, S., Custódio, S., Archuleta, R.J. and Liu, P. (2008). Dynamic modeling of the 2004 Mw6.0 Parkfield, California, earthquake. Journal of Geophysical Research, 113, B02301, doi: /2007jb Matsumoto T., T. Kawabata, J. Matsuda, K. Yamamoto, and K. Mimura (2003), 3He/4He
38 38 MCCAUSLAND ET AL.: SHORT TERM AND LONG TERM MIGRATION OF derived fluids in a non-volcanic area in Kii Peninsula, Earth and Plan. Sci. Lett., 216, Issues 1-2, , doi: /s x(03) McCausland, W. (2006), Tracking Subduction Tremor in Cascadia Using Regional Network and Small Aperture Seismic Array Data. PhD Dissertation, University of Washington. McCausland, W., S. Malone and D. Johnson, Temporal and spatial occurrence of deep non-volcanic tremor: From Washington to northern California (2005), Geophys. Res. Lett., 32, L Medema, G.F. (2006), Juan de Fuca subducting plate geometry and intraslab seismicity, Unpublished doctoral dissertation, University of Washington, Seattle, WA. Miller, M., T. Melbourne, D.J. Johnson, and W.Q. Sumner (2002), Periodic slow earthquakes from the Cascadia subduction zone, Science, 295, Nadeau, R., and Dolenc (2005), Nonvolcanic tremors deep beneath the San Andreas fault, Science, 307, 389. Nicholson, T., M. Bostock, and J.F. Cassidy (2005), New constraints on subduction zone structure in nor thern Cascadia, Geophys. J. Int., 161,
39 39 MCCAUSLAND ET AL.: SHORT TERM AND LONG TERM MIGRATION OF Obara, K. (2002), Non-volcanic deep tremor associated with subduction in Southwest Japan, Science, 296, Peacock, S.M. (1993), Large-scale hydration of the lithosphere above subducting slabs, Chem. Geology, 108, Preston, L., and K. Creager (2003), Intraslab earthquakes; dehydration of the Cascadia slab, Science, 302, Rogers, G., and H. Dragert (2003), Episodic tremor and slip on the Cascadia subduction zone: The chatter of silent slip", Science, 300, Schwartz, S. Y., and J. M. Rokosky (2007), Slow slip events and seismic tremor at circum-pacific subduction zones, Rev. Geophys., 45, RG3004, doi: /2006rg Segall, P., E.K. Desmarais, D. Shelly, A. Miklius, and P. Cervelli (2006), Earthquakes triggered by silent slip events on Kilauea volcano, Hawaii, Nature (442), Seno, T., D. Zhao, Y. Kobayashi, and M. Nakamura (2001), Dehydration of serpentinized slab mantle: Seismic evidence from southwest Japan, Earth Planets Space, 53, DRAFT 3/15/10 DRAFT
40 40 MCCAUSLAND ET AL.: SHORT TERM AND LONG TERM MIGRATION OF Shelly, D. R., G.C. Beroza, S. Ide and S. Nakamula (2006), Low-Frequency Earthquakes in Shikoku, Japan, and their relationship to episodic tremor and slip, Nature,442, Shelly, D.R., G.C. Beroza, and S. Ide (2007), Complex evolution of transient slip derived from precise tremor locations in western Shikoku, Japan, Geochem. Geophys. Geosyst., 8, Q10014, doi: /2007gc Soyer, W. and M. Unsworth (2006), Deep electrical structure of the northern Cascadia (British Columbia, Canada) subduction zone: Implications for the distribution of fluids, Geology, 34, Szeliga, W., T.I. Melbourne, M.M. Miller, V.M. Santillan (2004), Southern Cascadia episodic slow earthquakes, Geophys. Res. Lett., 31, L Umeda, K., Y. Ogawab, K. Asamoria and T. Oikawaa (2006), Aqueous fluids derived from a subducting slab: Observed high 3He emanation and conductive anomaly in a non-volcanic region, Kii Peninsula southwest Japan, J. of Volc. and Geoth. Res., 149, Issues 1-2, doi: /j.jvolgeores Vidale, J. and P.M. Shearer (2006), A survey of 71 earthquake bursts across southern California: Exploring the role of pore fluid pressure fluctuations and aseismic slip as drivers, J. of Geophys. Res., 111 (B), doi: /2005jb
41 41 MCCAUSLAND ET AL.: SHORT TERM AND LONG TERM MIGRATION OF Wallace, L. M., and J. Beavan (2006), A large slow slip event on the central Hikurangi subduction interface beneath the Manawatu region, North Island, New Zealand, Geophys. Res. Lett., 33, L11301, doi: /2006gl Wech, A. G., and K.C. Creager (2007), Cascadia tremor polarization evidence for plate interface slip, Geophys. Res. Lett.,34, doi: /2007gl031167
42 42 MCCAUSLAND ET AL.: SHORT TERM AND LONG TERM MIGRATION OF Figure captions: Figure 1: Bandpass filtered tremor data on 5 broadly distributed network stations (top 5 traces) and on 5 stations from the Lopez small aperture array (bottom 5 traces). Figure (1a) shows 20 minutes of data on July 10, 2004, where bursts can be identified and tracked across network stations. Figure (1b) shows 30-seconds of data from the highlighted section of figure (1a). On the network stations the individual phases cannot be tracked between stations, but on the array the signals are highly correlated and individual phases can be identified across all stations. Figure 2 Map showing the location of each array (white triangles), regional network stations (black triangles), and the region where previous tremor and slow slip episodes initiated (gray shaded oval). The inset maps show the station configurations for each array. Figure 3 Plot comparing the ratio of the amplitude of the largest two cross-correlation peaks to the absolute value of the relative arrival time residual (difference between the modeled and observed relative arrival times). Data for this plot come from all 5-minute time windows on July 11, The white curve represents the best empirical fit to these data, as cited in equation 8. Figure 4 Plot of the array computed slowness and errors that compares the results from the 30-second (blue) and 5-minute (red) analysis windows for three hours on July 11, Variations in the slowness with time are evident, indicating changes in the location
43 43 MCCAUSLAND ET AL.: SHORT TERM AND LONG TERM MIGRATION OF of tremor sources. Despite the large difference in window size, the computed values of the slowness for each are comparable to within the errors, thus demonstrating that the 5- minute windows are a reasonable proxy for the 30s windows. Figure 5 Contours of the misfit between the observed and predicted apparent slowness vectors for one 5-minute time window starting at 15:25 (UTC) on July 11, The contours are shown for the X-Y, X-Z, and Y-Z planes, with the best misfit (location) shown as a blue circle. The locations of the arrays are shown as black triangles, the coastline is plotted for reference on the X-Y plane, and the projection of the subducting slab interface (Preston et al., 2003; Medema, 2006) is indicated by the quadrilaterals on the X-Z and Z-Y planes. The projection represents the slab interface along profiles taken in the south at the latitude of the Sequim array, in the north at the latitude of the Lopez array, on the west at the longitude of Sooke array and on the east at the Lopez array. Between the three arrays, the slab dips roughly to the northeast. Plotted contours are at misfit values of 75, 100, 150, 250, 500, in increments of 1000, and the color of the contour signifies its value (see color bar). Figure 6 Figure (6a) is a time series plot of the slowness and backazimuth calculated in 5-minute windows at Lopez array on July 11, Colors represent the slowness calculated for each sensor component: red is North; blue is East; green is vertical. For most of the day the calculated slowness and backazimuths vary slowly over ranges of around 0.1s/km in slowness and 60 degrees in backazimuth, indicating a single but slowly changing source region for the tremor sources. Figure (6b) is the time series for 5-
44 44 MCCAUSLAND ET AL.: SHORT TERM AND LONG TERM MIGRATION OF minute time windows at Sequim array on July 16, Plot shows sharp changes (~120 degrees) in the backazimuth indicating the presence of multiple active source regions, particularly during the first 12 hours of the day. Figure 7. Figure (7a) shows the 5-minute time window locations with misfit <200 from the first 12 hours of the day on July 11, Figure (7b) shows the locations from the second 12 hours of the day. The location error as defined by the 90% confidence interval is plotted as an ellipse around the location. Mean errors are indicated as is the number of events, N. Two distinct clusters of locations are present in the second 12 hours. The coastline is plotted for reference on the X-Y plane, and the projection of the subducting slab interface (Preston et al., 2003; Medema, 2006) is indicated by the quadrilaterals on the X-Z and Z-Y planes. The projection represents the slab interface along profiles taken in the south at the latitude of the Sequim array, in the north at the latitude of the Lopez array, on the west at the longitude of Sooke array and on the east at the Lopez array. Figure 8. Five-minute time window locations with misfits < 300 plotted as 2D histograms projected onto X-Y, X-Z and Y-Z planes. The number of locations at any particular grid point is indicated by the grayscale value as indicated on the color bar. The coastline and slab projections are indicated as described in Figure 5. Epicentral locations are more geographically distributed and generally closer to the Sooke array. Depths are deeper and less well-constrained than for previous days. DRAFT 3/15/10 DRAFT
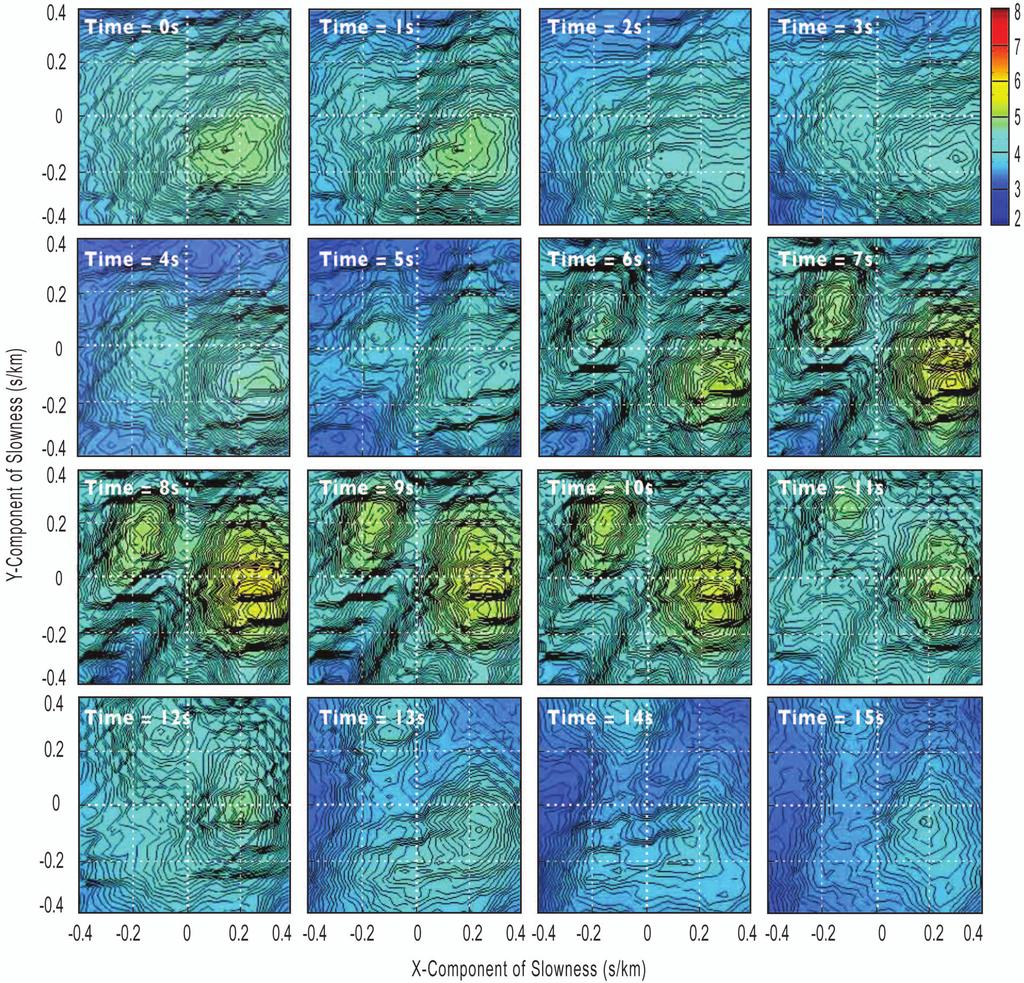
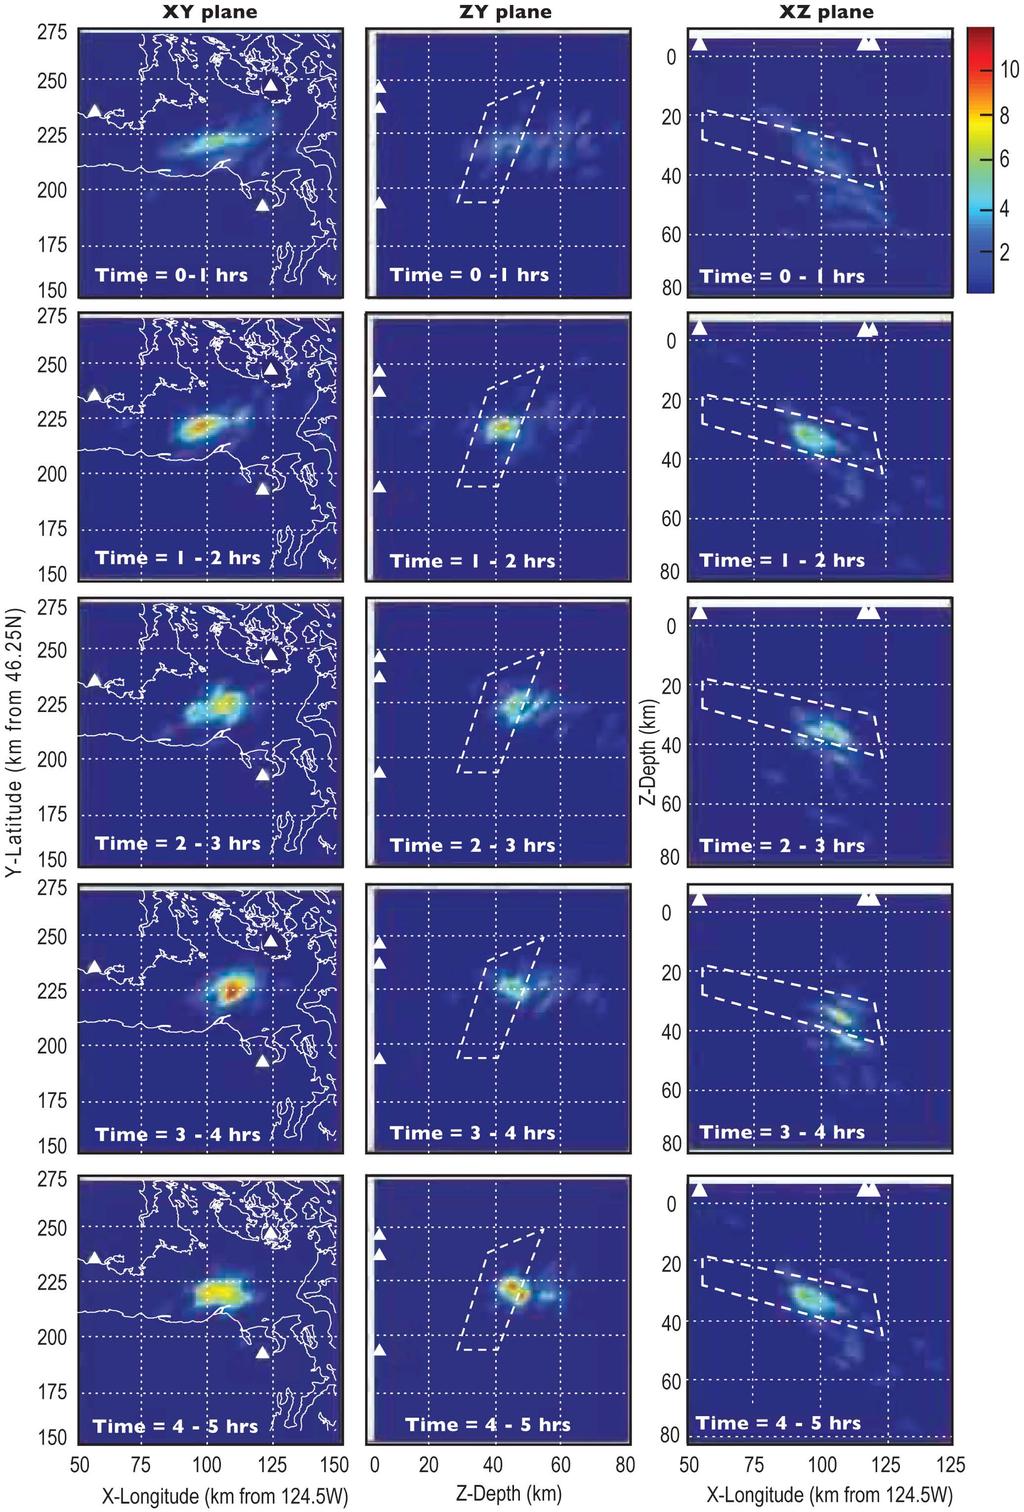
45 45 MCCAUSLAND ET AL.: SHORT TERM AND LONG TERM MIGRATION OF Figure 9. Time series view of beam-forming results in the apparent slowness plane for the east components of Sequim on July 15, The analysis time window for each figure is 5s, and the time between windows is 1s (i.e. a 4s overlap). Color indicates the relative power of the stack at each value of apparent slowness (reciprocal of velocity), where warmer colors indicate coherent energy arriving at the array from a particular direction with a particular apparent speed. For instance, if a wave were vertically incident then the apparent slowness would be zero and the corresponding peak would plot in the center of the above figures. At least two strong tremor sources are clearly evident in many of the time windows. Between 4s and 8s, the left tremor source migrates in the slowness plane from 0 to 0.2 s/km in the y-direction indicating a change in location. Changes in slowness also occur within 1-second, for instance between 12s and 13s the apparent slowness of the right source changes from approximately 0 to -0.1 s/km in the y- direction. Figure 10 Spatial 2D histogram of all locations from 5-minute time windows between July 6 22, Figure (10a) has a strict misfit cut off (< 200) for plotting the location. Figure (10b) has no cut-off for plotting the location, and therefore shows more locations but with larger errors. Despite the difference in the errors, the locations are consistent between the two figures. The coastline and slab interface projections are indicated as described in Figure 5. Figure 11 Filmstrip representation of changes in tremor locations during the first 5 hours on July 11, Each column is a 2D histogram of locations in one of the three
46 46 MCCAUSLAND ET AL.: SHORT TERM AND LONG TERM MIGRATION OF coordinate planes, with the number of sources at each grid point indicated by the color as indicated in the colorbar. Each plot represents one hour of locations determined in 30- second windows with 18-second overlap. From hour to hour, the concentration of tremor sources moves around within an area 15 km in latitude, up to 40 km in longitude, and 20 km in depth. Figure 12: Filmstrip 2D histogram representation of 30-s locations (misfit < 300) in successive 5-min windows between 21:00-22:00 (UTC) on July 11, First column shows the locations in the X-Y plane, next column is the Z-Y plane, and the last column is the X-Z plane. Each frame represents all locations within a 5-minute period, the value of the shading indicates the number of sources at a given grid point as indicated by the colorbar. The figures show how the tremor locations migrate from one source region (between the three arrays) to another source region (east of Lopez and Sequim arrays). Coastline and slab projections are shown as described in Figure 5. Figure 13. Figure of 30-s locations during a time period with multiple coincident source locations on July, 15, Figure (13a) shows location and confidence interval for misfits < 100 between 8:00 9:00 hours (UTC) on July 15, Figure (13b) is a 2D spatial histogram of locations for the same time period, but for misfits < 600, with the number of sources at any grid point indicated by the color. Average errors in the locations for each case are indicated. Note the location errors are larger and the epicentral locations are closer to the Sooke array and distributed over a larger region than on previous days. Coastline and slab interface projections are as described in Figure 5. Comment [WM1]: Check all figures- order and inclusion?
47 47 MCCAUSLAND ET AL.: SHORT TERM AND LONG TERM MIGRATION OF Table 1 One-dimensional velocity model. Velocity model used for 1D travel time and slowness calculations, derived from PNSN P3 model (Crosson, 1976). Depth (km) S-wave velocity (km/s) Table 2 Percentag e tremor occurrence. Percentage of five-minute and thirty-second time windows in which tremor was detected. Each component and array was considered separately. Sooke Sequim Lopez July 6 22, minute windows North July 6 22, minute windows East July 11, 2004, 0-6:00 30 s windows Nort h July 11, 2004, 0-6:00 30 s windows East July 11, 2004, 20-24:00 30 s windows North July 11, 2004, 20-24:00 30 s windows East
48 48 MCCAUSLAND ET AL.: SHORT TERM AND LONG TERM MIGRATION OF Table 3 Location Uncertainties. Uncertainty in the locations for five-minute time windows for different misfit values. The number of events used in the calculation (locations that meet the misfit criterion) is indicated in the last column. Misfit X error (km) Y error (km) Z error (km) N < / / / < / / / < / / / < / / /
49

50
51
52
53
54
55
56
57
58
59
60
The Non-volcanic tremor observation in Northern Cascadia. Hsieh Hsin Sung 3/22
 The Non-volcanic tremor observation in Northern Cascadia Hsieh Hsin Sung 3/22 Reference Kao, H., S. J. Shan, H. Dragert, and G. Rogers (2009), Northern Cascadia episodic tremor and slip: A decade of observations
Array analysis and precise source location of deep tremor in Cascadia
 Click Here for Full Article JOURNAL OF GEOPHYSICAL RESEARCH, VOL. 115,, doi:10.1029/2008jb006041, 2010 Array analysis and precise source location of deep tremor in Cascadia Mario La Rocca, 1 Danilo Galluzzo,
Tremor patches in Cascadia revealed by seismic array analysis
 GEOPHYSICAL RESEARCH LETTERS, VOL. 36, L17316, doi:10.1029/2009gl039080, 2009 Tremor patches in Cascadia revealed by seismic array analysis Abhijit Ghosh, 1 John E. Vidale, 1 Justin R. Sweet, 1 Kenneth
Depth-dependent slip regime on the plate interface revealed from slow earthquake activities in the Nankai subduction zone
 2010/10/11-14 Earthscope Workshop Depth-dependent slip regime on the plate interface revealed from slow earthquake activities in the Nankai subduction zone Kazushige Obara, ERI, Univ. Tokyo Recurrence
Array-analysis of Tremors in Shikoku Triggered by the 2012 Sumatra Earthquake
 Array-analysis of Tremors in Shikoku Triggered by the 2012 Sumatra Earthquake Tianyi Li 1 Instructor: Prof. Kazushige Obara 2 1. Department of Geophysics, Peking University 2. Earthquake Research Institute,
Seismic and geodetic constraints on Cascadia slow slip
 1 2 3 4 5 6 Seismic and geodetic constraints on Cascadia slow slip Aaron G. Wech 1, Kenneth C. Creager 1, & Timothy I. Melbourne 2 1 University of Washington, Department of Earth and Space Science, Box
Detection and location of non-volcanic tremor beneath the Central Range in Taiwan
 Detection and location of non-volcanic tremor beneath the Central Range in Taiwan Aileen Zhang Advisor: Prof. Kazushige Obara Introduction Volcanic tremor is a long-duration episode of weak seismic motions
volcanic tremor and Low frequency earthquakes at mt. vesuvius M. La Rocca 1, D. Galluzzo 2 1
 volcanic tremor and Low frequency earthquakes at mt. vesuvius M. La Rocca 1, D. Galluzzo 2 1 Università della Calabria, Cosenza, Italy 2 Istituto Nazionale di Geofisica e Vulcanologia Osservatorio Vesuviano,
An earthquake like magnitude frequency distribution of slow slip in northern Cascadia
 GEOPHYSICAL RESEARCH LETTERS, VOL. 37,, doi:10.1029/2010gl044881, 2010 An earthquake like magnitude frequency distribution of slow slip in northern Cascadia Aaron G. Wech, 1,2 Kenneth C. Creager, 1 Heidi
An autocorrelation method to detect low frequency earthquakes within tremor
 GEOPHYSICAL RESEARCH LETTERS, VOL. 35, L16305, doi:10.1029/2008gl034560, 2008 An autocorrelation method to detect low frequency earthquakes within tremor Justin R. Brown, 1 Gregory C. Beroza, 1 and David
Migration of low frequency tremors revealed from multiple array analyses in western
 Migration of low frequency tremors revealed from multiple array analyses in western Shikoku, Japan Tomotake Ueno, Takuto Maeda*, Kazushige Obara, Youichi Asano, and Tetsuya Takeda National Research Institute
Modulation of Tremor Amplitudes by Tidal Stresses in Cascadia Amanda Klaus Manuscript for Master s project. Abstract
 Modulation of Tremor Amplitudes by Tidal Stresses in Cascadia Amanda Klaus Manuscript for Master s project Abstract We recorded the 2010 and 2011 episodic tremor and slip events in Northern Cascadia on
Locating nonvolcanic tremors beneath the San Andreas Fault using a station pair double difference location method
 Click Here for Full Article GEOPHYSICAL RESEARCH LETTERS, VOL. 37,, doi:10.1029/2010gl043577, 2010 Locating nonvolcanic tremors beneath the San Andreas Fault using a station pair double difference location
Nonvolcanic deep tremor associated with subduction in Southwest Japan. Kazushige Obara (NIED)
") Nonvolcanic deep tremor associated with subduction in Southwest Japan Kazushige Obara (NIED) One-hour record chart at the station IKTH in Shikoku Island, Southwest Japan (2001/8/17 4 a.m.) Time (min) Time
Nonvolcanic deep tremor associated with subduction in Southwest Japan Kazushige Obara (NIED) One-hour record chart at the station IKTH in Shikoku Island, Southwest Japan (2001/8/17 4 a.m.) Time (min) Time
Segmentation in episodic tremor and slip all along Cascadia
 Segmentation in episodic tremor and slip all along Cascadia Michael R. Brudzinski and Richard M. Allen Geology 35 (10) 907-910, 2007, doi: 10.1130/G23740A.1 Data Repository: Methods for Automated Data
Unlocking the Secrets of Slow Slip in Cascadia Using Low- Frequency Earthquakes. Justin R. Sweet. A dissertation
 Unlocking the Secrets of Slow Slip in Cascadia Using Low- Frequency Earthquakes Justin R. Sweet A dissertation submitted in partial fulfillment of the requirements for the degree of Doctor of Philosophy
overlie the seismogenic zone offshore Costa Rica, making the margin particularly well suited for combined land and ocean geophysical studies (Figure
 Chapter 1 Introduction Historically, highly destructive large magnitude (M w >7.0) underthrusting earthquakes nucleate along the shallow segment of subduction zone megathrust fault, and this region of
Remote triggering of tremor along the San Andreas Fault in central California
 Click Here for Full Article JOURNAL OF GEOPHYSICAL RESEARCH, VOL. 114,, doi:10.1029/2008jb006049, 2009 Remote triggering of tremor along the San Andreas Fault in central California Zhigang Peng, 1 John
SUPPLEMENTARY INFORMATION
 doi:10.1038/nature11492 Figure S1 Short-period Seismic Energy Release Pattern Imaged by F-net. (a) Locations of broadband seismograph stations in Japanese F-net used for the 0.5-2.0 Hz P wave back-projection
Lessons from (triggered) tremor
 tremor") JOURNAL OF GEOPHYSICAL RESEARCH, VOL. 115,, doi:10.1029/2009jb007011, 2010 Lessons from (triggered) tremor Joan Gomberg 1 Received 29 September 2009; revised 12 May 2010; accepted 2 June 2010; published
JOURNAL OF GEOPHYSICAL RESEARCH, VOL. 115,, doi:10.1029/2009jb007011, 2010 Lessons from (triggered) tremor Joan Gomberg 1 Received 29 September 2009; revised 12 May 2010; accepted 2 June 2010; published
Variations in Tremor Activity and Implications for Lower Crustal Deformation Along the Central San Andreas Fault
 Variations in Tremor Activity and Implications for Lower Crustal Deformation Along the Central San Andreas Fault David R. Shelly USGS, Menlo Park Shelly and Hardebeck, GRL, 2010 Collaborators: Jeanne Hardebeck
SEISMIC CONSTRAINTS ON SLOW SLIP EVENTS WITHIN THE CASCADIA SUBDUCTION ZONE. A Thesis. Presented to. The Graduate Faculty
 SEISMIC CONSTRAINTS ON SLOW SLIP EVENTS WITHIN THE CASCADIA SUBDUCTION ZONE A Thesis Presented to The Graduate Faculty Central Washington University In Partial Fulfillment of the Requirements for the Degree
Migration of low frequency tremors revealed from multiple array analyses in western Shikoku, Japan
 JOURNAL OF GEOPHYSICAL RESEARCH, VOL. 115,, doi:10.1029/2008jb006051, 2010 Migration of low frequency tremors revealed from multiple array analyses in western Shikoku, Japan Tomotake Ueno, 1 Takuto Maeda,
ABSTRACT SPATIAL AND TEMPORAL PATTERNS OF NON-VOLCANIC TREMOR ALONG THE SOUTHERN CASCADIA SUBDUCTION ZONE. by Devin C. Boyarko
 ABSTRACT SPATIAL AND TEMPORAL PATTERNS OF NON-VOLCANIC TREMOR ALONG THE SOUTHERN CASCADIA SUBDUCTION ZONE by Devin C. Boyarko Episodic tremor and slip (ETS), the spatial and temporal correlation of slow
Using deformation rates in Northern Cascadia to constrain time-dependent stress- and slip-rate on the megathrust
 Using deformation rates in Northern Cascadia to constrain time-dependent stress- and slip-rate on the megathrust Lucile Bruhat Paul Segall Stanford University 1 50 Interseismic period for the Cascadia
Aseismic slip and low-frequency earthquakes in the Bungo channel, southwestern Japan
 GEOPHYSICAL RESEARCH LETTERS, VOL. 31, L769, doi:1.19/3gl19381, Aseismic slip and low-frequency earthquakes in the Bungo channel, southwestern Japan Shinzaburo Ozawa, 1 Yuki Hatanaka, 1 Masaru Kaidzu,
Non-volcanic Tremor: A Window into the Roots of Fault Zones
 Non-volcanic Tremor: A Window into the Roots of Fault Zones Justin L. Rubinstein, David R. Shelly, and William L. Ellsworth Abstract The recent discovery of non-volcanic tremor in Japan and the coincidence
Tremor asperities in the transition zone control evolution of slow earthquakes
 JOURNAL OF GEOPHYSICAL RESEARCH, VOL. 117,, doi:10.1029/2012jb009249, 2012 Tremor asperities in the transition zone control evolution of slow earthquakes Abhijit Ghosh, 1 John E. Vidale, 2 and Kenneth
Knowledge of in-slab earthquakes needed to improve seismic hazard estimates for southwestern British Columbia
 USGS OPEN FILE REPORT #: Intraslab Earthquakes 1 Knowledge of in-slab earthquakes needed to improve seismic hazard estimates for southwestern British Columbia John Adams and Stephen Halchuk Geological
25th Seismic Research Review - Nuclear Explosion Monitoring: Building the Knowledge Base
 KARATAU, MAKANCHI, AND LOCATION IN WESTERN CHINA Lee K. Steck, George E. Randall, Michael L. Begnaud, Charlotte A. Rowe, and Aaron A. Velasco Los Alamos National Laboratory Sponsored by National Nuclear
LETTERS. Non-volcanic tremor driven by large transient shear stresses
 Vol 448 2 August 27 doi:1.138/nature617 Non-volcanic tremor driven by large transient shear stresses LETTERS Justin L. Rubinstein 1, John E. Vidale 1, Joan Gomberg 2, Paul Bodin 1, Kenneth C. Creager 1
2008 Monitoring Research Review: Ground-Based Nuclear Explosion Monitoring Technologies
 STRUCTURE OF THE KOREAN PENINSULA FROM WAVEFORM TRAVEL-TIME ANALYSIS Roland Gritto 1, Jacob E. Siegel 1, and Winston W. Chan 2 Array Information Technology 1 and Harris Corporation 2 Sponsored by Air Force
29th Monitoring Research Review: Ground-Based Nuclear Explosion Monitoring Technologies MODELING P WAVE MULTIPATHING IN SOUTHEAST ASIA
 MODELING P WAVE MULTIPATHING IN SOUTHEAST ASIA Ali Fatehi and Keith D. Koper Saint Louis University Sponsored by the Air Force Research Laboratory ABSTRACT Contract No. FA8718-06-C-0003 We have used data
Plate Boundary Observatory Working Group for the Central and Northern San Andreas Fault System PBO-WG-CNSA
 Plate Boundary Observatory Working Group for the Central and Northern San Andreas Fault System PBO-WG-CNSA Introduction Our proposal focuses on the San Andreas fault system in central and northern California.
News Release December 30, 2004 The Science behind the Aceh Earthquake
 News Release December 30, 2004 The Science behind the Aceh Earthquake PASADENA, Calif. - Kerry Sieh, the Robert P. Sharp Professor of Geology at the California Institute of Technology and a member of Caltech's
A Brownian walk model for slow earthquakes
 GEOPHYSICAL RESEARCH LETTERS, VOL. 35, L17301, doi:10.1029/2008gl034821, 2008 A Brownian walk model for slow earthquakes Satoshi Ide 1 Received 29 May 2008; revised 10 July 2008; accepted 16 July 2008;
A hierarchy of tremor migration patterns induced by the interaction of brittle asperities mediated by aseismic slip transients
 A hierarchy of tremor migration patterns induced by the interaction of brittle asperities mediated by aseismic slip transients J.-P. Ampuero (Caltech Seismolab), H. Perfettini (IRD), H. Houston and B.
3.3. Waveform Cross-Correlation, Earthquake Locations and HYPODD
 3.3. Waveform Cross-Correlation, Earthquake Locations and HYPODD 3.3.1 Method More accurate relative earthquake locations depend on more precise relative phase arrival observations so I exploit the similarity
SOURCE MODELING OF RECENT LARGE INLAND CRUSTAL EARTHQUAKES IN JAPAN AND SOURCE CHARACTERIZATION FOR STRONG MOTION PREDICTION
 SOURCE MODELING OF RECENT LARGE INLAND CRUSTAL EARTHQUAKES IN JAPAN AND SOURCE CHARACTERIZATION FOR STRONG MOTION PREDICTION Kimiyuki Asano 1 and Tomotaka Iwata 2 1 Assistant Professor, Disaster Prevention
Scaling relationship between the duration and the amplitude of non-volcanic deep low-frequency tremors
 GEOPHYSICAL RESEARCH LETTERS, VOL. 34, L07305, doi:10.1029/2007gl029391, 2007 Scaling relationship between the duration and the amplitude of non-volcanic deep low-frequency tremors Tomoko Watanabe, 1 Yoshihiro
Dynamic Triggering Semi-Volcanic Tremor in Japanese Volcanic Region by The 2016 Mw 7.0 Kumamoto Earthquake
 Dynamic Triggering Semi-Volcanic Tremor in Japanese Volcanic Region by The 016 Mw 7.0 Kumamoto Earthquake Heng-Yi Su 1 *, Aitaro Kato 1 Department of Earth Sciences, National Central University, Taoyuan
Automated Detection and Location of Tectonic Tremor along the Entire Cascadia Margin From
 *Manuscript Click here to view linked References 1 2 3 4 5 6 7 8 9 10 11 12 13 14 15 16 17 18 19 20 21 22 23 24 25 26 27 28 29 Automated Detection and Location of Tectonic Tremor along the Entire Cascadia
AVERAGE AND VARIATION OF FOCAL MECHANISM AROUND TOHOKU SUBDUCTION ZONE
 13 th World Conference on Earthquake Engineering Vancouver, B.C., Canada August 1-6, 24 Paper No. 414 AVERAGE AND VARIATION OF FOCAL MECHANISM AROUND TOHOKU SUBDUCTION ZONE Shunroku YAMAMOTO 1 Naohito
MAGMATIC, ERUPTIVE AND TECTONIC PROCESSES IN THE ALEUTIAN ARC, ALASKA
 MAGMATIC, ERUPTIVE AND TECTONIC PROCESSES IN THE ALEUTIAN ARC, ALASKA Introduction The Aleutian Arc contains roughly ten percent of the world s active volcanoes. Hardly a year goes by without a major eruption
Earthquakes and Earthquake Hazards Earth - Chapter 11 Stan Hatfield Southwestern Illinois College
 Earthquakes and Earthquake Hazards Earth - Chapter 11 Stan Hatfield Southwestern Illinois College What Is an Earthquake? An earthquake is the vibration of Earth, produced by the rapid release of energy.
Megathrust Earthquakes
 Megathrust Earthquakes Susan Schwartz University of California Santa Cruz CIDER 2017 UC Berkeley July 5, 2017 The largest megathrust events are not uniformally distributed at all subduction zones. M>8
of other regional earthquakes (e.g. Zoback and Zoback, 1980). I also want to find out
. I also want to find out") 4. Focal Mechanism Solutions A way to investigate source properties of the 2001 sequence is to attempt finding well-constrained focal mechanism solutions to determine if they are consistent with those
4. Focal Mechanism Solutions A way to investigate source properties of the 2001 sequence is to attempt finding well-constrained focal mechanism solutions to determine if they are consistent with those
Earthquakes. Pt Reyes Station 1906
 Earthquakes Pt Reyes Station 1906 Earthquakes Ground shaking caused by the sudden release of accumulated strain by an abrupt shift of rock along a fracture in the earth. You Live in Earthquake Country
Supplementary Materials for
 advances.sciencemag.org/cgi/content/full/4/3/eaao4915/dc1 Supplementary Materials for Global variations of large megathrust earthquake rupture characteristics This PDF file includes: Lingling Ye, Hiroo
Three Fs of earthquakes: forces, faults, and friction. Slow accumulation and rapid release of elastic energy.
 Earthquake Machine Stick-slip: Elastic Rebound Theory Jerky motions on faults produce EQs Three Fs of earthquakes: forces, faults, and friction. Slow accumulation and rapid release of elastic energy. Three
Tidal triggering of low frequency earthquakes near Parkfield, California: Implications for fault mechanics within the brittle-ductile transition
 JOURNAL OF GEOPHYSICAL RESEARCH, VOL. 117,, doi:10.1029/2011jb009036, 2012 Tidal triggering of low frequency earthquakes near Parkfield, California: Implications for fault mechanics within the brittle-ductile
7.1 FIJI 1, :57:22 UTC
 A magnitude 7.1 earthquake struck 141 km (88 miles) northeast of Ndoi Island, Fiji, and 313 km (194 mi) west-northwest of Nuku alofa, Tonga according to the US Geological Survey, but there were no reports
OCEAN/ESS 410. Lab 12. Earthquake Focal Mechanisms. You can write your answers to all be (e) on this paper.
 on this paper.") Lab 1. Earthquake Focal Mechanisms You can write your answers to all be (e) on this paper. In this class we are going to use P-wave first motions to obtain a double-couple focal mechanism for a subduction
Lab 1. Earthquake Focal Mechanisms You can write your answers to all be (e) on this paper. In this class we are going to use P-wave first motions to obtain a double-couple focal mechanism for a subduction
Fracture induced shear wave splitting in a source area of triggered seismicity by the Tohoku-oki earthquake in northeastern Japan.
 Fracture induced shear wave splitting in a source area of triggered seismicity by the Tohoku-oki earthquake in northeastern Japan Masahiro Kosuga 1 1. Corresponding Author. Professor, Graduate School of
Slab morphology in the Cascadia fore arc and its relation to episodic tremor and slip
 Click Here for Full Article JOURNAL OF GEOPHYSICAL RESEARCH, VOL. 115,, doi:10.1029/2008jb006053, 2010 Slab morphology in the Cascadia fore arc and its relation to episodic tremor and slip Pascal Audet,
Seismic wave triggering of nonvolcanic tremor, episodic tremor and slip, and earthquakes on Vancouver Island
 Click Here for Full Article JOURNAL OF GEOPHYSICAL RESEARCH, VOL. 114,, doi:10.1029/2008jb005875, 2009 Seismic wave triggering of nonvolcanic tremor, episodic tremor and slip, and earthquakes on Vancouver
MIGRATING SWARMS OF BRITTLE-FAILURE EARTHQUAKES IN THE LOWER CRUST BENEATH MAMMOTH MOUNTAIN, CALIFORNIA
 MIGRATING SWARMS OF BRITTLE-FAILURE EARTHQUAKES IN THE LOWER CRUST BENEATH MAMMOTH MOUNTAIN, CALIFORNIA David Shelly and David Hill GRL, October 2011 Contents Tectonic Setting Long Valley Caldera Mammoth
ANOTHER MEXICAN EARTHQUAKE! Magnitude 7.1, Tuesday Sept. 19, 2017
 ANOTHER MEXICAN EARTHQUAKE! Magnitude 7.1, Tuesday Sept. 19, 2017 Why is there no oceanic crust older than 200 million years? SUBDUCTION If new oceanic crust is being continuously created along the earth
Along strike variations in short term slow slip events in the southwest Japan subduction zone
 JOURNAL OF GEOPHYSICAL RESEARCH, VOL. 115,, doi:10.1029/2008jb006059, 2010 Along strike variations in short term slow slip events in the southwest Japan subduction zone Shutaro Sekine, 1,2 Hitoshi Hirose,
Imaging sharp lateral velocity gradients using scattered waves on dense arrays: faults and basin edges
 2017 SCEC Proposal Report #17133 Imaging sharp lateral velocity gradients using scattered waves on dense arrays: faults and basin edges Principal Investigator Zhongwen Zhan Seismological Laboratory, California
Analysis of the 29th May 2008 Ölfus earthquake and aftershock sequence using three-component t processing on ICEARRAY
 Analysis of the 29th May 2008 Ölfus earthquake and aftershock sequence using three-component t processing on ICEARRAY Benedikt Halldórsson Steven J. Gibbons International Symposium on Strong-motion Earthquake
Sendai Earthquake NE Japan March 11, Some explanatory slides Bob Stern, Dave Scholl, others updated March
 Sendai Earthquake NE Japan March 11, 2011 Some explanatory slides Bob Stern, Dave Scholl, others updated March 14 2011 Earth has 11 large plates and many more smaller ones. Plates are 100-200 km thick
Dynamic Crust Practice
 1. Base your answer to the following question on the cross section below and on your knowledge of Earth science. The cross section represents the distance and age of ocean-floor bedrock found on both sides
LETTERS. Low-frequency earthquakes in Shikoku, Japan, and their relationship to episodic tremor and slip
 Vol 442 13 July 2006 doi:10.1038/nature04931 Low-frequency earthquakes in Shikoku, Japan, and their relationship to episodic tremor and slip David R. Shelly 1, Gregory C. Beroza 1, Satoshi Ide 2 & Sho
Non-volcanic tremor resulting from the combined effect of Earth tide and slow slip event
 1 Non-volcanic tremor resulting from the combined effect of Earth tide and slow slip event Ryoko Nakata 1, Naoki Suda 1 & Hiroshi Tsuruoka 2 1 Department of Earth and Planetary Systems Science, Hiroshima
Internal Layers of the Earth
 Lecture #4 notes Geology 3950, Spring 2006; CR Stern Seismic waves, earthquake magnitudes and location, and internal earth structure (pages 28-95 in the 4 th edition and 28-32 and 50-106 in the 5 th edition)
Widespread Ground Motion Distribution Caused by Rupture Directivity during the 2015 Gorkha, Nepal Earthquake
 Widespread Ground Motion Distribution Caused by Rupture Directivity during the 2015 Gorkha, Nepal Earthquake Kazuki Koketsu 1, Hiroe Miyake 2, Srinagesh Davuluri 3 and Soma Nath Sapkota 4 1. Corresponding
RELOCATION OF THE MACHAZE AND LACERDA EARTHQUAKES IN MOZAMBIQUE AND THE RUPTURE PROCESS OF THE 2006 Mw7.0 MACHAZE EARTHQUAKE
 RELOCATION OF THE MACHAZE AND LACERDA EARTHQUAKES IN MOZAMBIQUE AND THE RUPTURE PROCESS OF THE 2006 Mw7.0 MACHAZE EARTHQUAKE Paulino C. FEITIO* Supervisors: Nobuo HURUKAWA** MEE07165 Toshiaki YOKOI** ABSTRACT
Earthquakes Chapter 19
 Earthquakes Chapter 19 Does not contain complete lecture notes. What is an earthquake An earthquake is the vibration of Earth produced by the rapid release of energy Energy released radiates in all directions
Section Forces Within Earth. 8 th Grade Earth & Space Science - Class Notes
 Section 19.1 - Forces Within Earth 8 th Grade Earth & Space Science - Class Notes Stress and Strain Stress - is the total force acting on crustal rocks per unit of area (cause) Strain deformation of materials
Extending the magnitude range of seismic reservoir monitoring by Utilizing Hybrid Surface Downhole Seismic Networks
 Extending the magnitude range of seismic reservoir monitoring by Utilizing Hybrid Surface Downhole Seismic Networks Gisela Viegas*, ESG, Kingston, Ontario, Canada Gisela.Fernandes@esgsolutions.com and
Multi-station Seismograph Network
 Multi-station Seismograph Network Background page to accompany the animations on the website: IRIS Animations Introduction One seismic station can give information about how far away the earthquake occurred,
Earthquakes. Building Earth s Surface, Part 2. Science 330 Summer What is an earthquake?
 Earthquakes Building Earth s Surface, Part 2 Science 330 Summer 2005 What is an earthquake? An earthquake is the vibration of Earth produced by the rapid release of energy Energy released radiates in all
On May 4, 2001, central Arkansas experienced an M=4.4 earthquake followed by a
 1. Introduction On May 4, 2001, central Arkansas experienced an M=4.4 earthquake followed by a surprisingly large number of small earthquakes. We recorded about 2500 above the ambient noise level on a
EARTHQUAKE LOCATIONS INDICATE PLATE BOUNDARIES EARTHQUAKE MECHANISMS SHOW MOTION
 6-1 6: EARTHQUAKE FOCAL MECHANISMS AND PLATE MOTIONS Hebgen Lake, Montana 1959 Ms 7.5 1 Stein & Wysession, 2003 Owens Valley, California 1872 Mw ~7.5 EARTHQUAKE LOCATIONS INDICATE PLATE BOUNDARIES EARTHQUAKE
Introduction The major accomplishment of this project is the development of a new method to identify earthquake sequences. This method differs from
 28 June 212 Final Report on Project 8/TVH564: Physical and statistical models for the seismological properties and a temporal evolution of earthquake sequences (swarms) in the Central Volcanic Region,
Probing Mid-Mantle Heterogeneity Using PKP Coda Waves
 Probing Mid-Mantle Heterogeneity Using PKP Coda Waves Michael A.H. Hedlin and Peter M. Shearer Cecil H. and Ida M. Green Institute of Geophysics and Planetary Physics Scripps Institution of Oceanography,
Section 19.1: Forces Within Earth Section 19.2: Seismic Waves and Earth s Interior Section 19.3: Measuring and Locating.
 CH Earthquakes Section 19.1: Forces Within Earth Section 19.2: Seismic Waves and Earth s Interior Section 19.3: Measuring and Locating Earthquakes Section 19.4: Earthquakes and Society Section 19.1 Forces
SPATIAL DISTRIBUTION OF STRONG GROUND MOTION CONSIDERING ASPERITY AND DIRECTIVITY OF FAULT
 SPATIAL DISTRIBUTION OF STRONG GROUND MOTION CONSIDERING ASPERITY AND DIRECTIVITY OF FAULT Shunroku YAMAMOTO SUMMARY Waveform simulations of the 995 Hyogo-ken Nanbu earthquake were carried out to study
} based on composition
 Learning goals: Predict types of earthquakes that will happen at different plate boundaries based on relative plate motion vector vs. strike (vector subtraction) Understand interseismic and coseismic deformation,
GPS Strain & Earthquakes Unit 5: 2014 South Napa earthquake GPS strain analysis student exercise
 GPS Strain & Earthquakes Unit 5: 2014 South Napa earthquake GPS strain analysis student exercise Strain Analysis Introduction Name: The earthquake cycle can be viewed as a process of slow strain accumulation
The influence of short wavelength variations in viscosity on subduction dynamics
 1 Introduction Deformation within the earth, driven by mantle convection due primarily to cooling and subduction of oceanic lithosphere, is expressed at every length scale in various geophysical observations.
JOINT ACCURATE TIME-FREQUENCY AND HIGH-RESOLUTION ARRAY ANALYSIS, A TOOL FOR SITE EFFECTS ESTIMATION?
 Third International Symposium on the Effects of Surface Geology on Seismic Motion Grenoble, France, 30 August - 1 September 2006 Paper Number: 152 JOINT ACCURATE TIME-FREQUENCY AND HIGH-RESOLUTION ARRAY
PLATE TECTONIC PROCESSES
 Lab 9 Name Sec PLATE TECTONIC PROCESSES 1. Fill in the blank spaces on the chart with the correct answers. Refer to figures 2.3, 2.4 p.33 (2.2 and 2.3 on p. 23) as needed. 2. With your knowledge of different
Model for triggering of non-volcanic tremor by earthquakes. Naum I. Gershenzon 1,2, Gust Bambakidis 1. Highway Dayton, OH 45435
 Model for triggering of non-volcanic tremor by earthquakes Naum I. Gershenzon 1,, Gust Bambakidis 1 1 Physics Department, Wright State University, 364 Colonel Glenn Highway Dayton, OH 45435 Department
Rock Physics and Quantitative Wavelet Estimation. for Seismic Interpretation: Tertiary North Sea. R.W.Simm 1, S.Xu 2 and R.E.
 Rock Physics and Quantitative Wavelet Estimation for Seismic Interpretation: Tertiary North Sea R.W.Simm 1, S.Xu 2 and R.E.White 2 1. Enterprise Oil plc, Grand Buildings, Trafalgar Square, London WC2N
Arthur Frankel, William Stephenson, David Carver, Jack Odum, Robert Williams, and Susan Rhea U.S. Geological Survey
 Probabilistic Seismic Hazard Maps for Seattle: 3D Sedimentary Basin Effects, Nonlinear Site Response, and Uncertainties from Random Velocity Variations Arthur Frankel, William Stephenson, David Carver,
CHAPTER 2 THE WAY THE EARTH WORKS: EXAMINING PLATE TECTONICS
 CHAPTER 2 THE WAY THE EARTH WORKS: EXAMINING PLATE TECTONICS Coverage of plate tectonics is required early in introductory Geology as context for the mineralogy, petrology, structure, internal processes,
THREE-DIMENSIONAL FINITE DIFFERENCE SIMULATION OF LONG-PERIOD GROUND MOTION IN THE KANTO PLAIN, JAPAN
 THREE-DIMENSIONAL FINITE DIFFERENCE SIMULATION OF LONG-PERIOD GROUND MOTION IN THE KANTO PLAIN, JAPAN Nobuyuki YAMADA 1 And Hiroaki YAMANAKA 2 SUMMARY This study tried to simulate the long-period earthquake
Estimation of S-wave scattering coefficient in the mantle from envelope characteristics before and after the ScS arrival
 GEOPHYSICAL RESEARCH LETTERS, VOL. 30, NO. 24, 2248, doi:10.1029/2003gl018413, 2003 Estimation of S-wave scattering coefficient in the mantle from envelope characteristics before and after the ScS arrival
The Coso Geothermal Area: A Laboratory for Advanced MEQ Studies for Geothermal Monitoring
 The Coso Geothermal Area: A Laboratory for Advanced MEQ Studies for Geothermal Monitoring Bruce R. Julian U. S. Geological Survey, Menlo Park, CA 94025 USA julian@usgs.gov Gillian R. Foulger Dept. Earth
ON NEAR-FIELD GROUND MOTIONS OF NORMAL AND REVERSE FAULTS FROM VIEWPOINT OF DYNAMIC RUPTURE MODEL
 1 Best Practices in Physics-based Fault Rupture Models for Seismic Hazard Assessment of Nuclear ON NEAR-FIELD GROUND MOTIONS OF NORMAL AND REVERSE FAULTS FROM VIEWPOINT OF DYNAMIC RUPTURE MODEL Hideo AOCHI
Topic 12: Dynamic Earth Pracatice
 Name: Topic 12: Dynamic Earth Pracatice 1. Earth s outer core is best inferred to be A) liquid, with an average density of approximately 4 g/cm 3 B) liquid, with an average density of approximately 11
A) B) C) D) 4. Which diagram below best represents the pattern of magnetic orientation in the seafloor on the west (left) side of the ocean ridge?
 B) C) D) 4. Which diagram below best represents the pattern of magnetic orientation in the seafloor on the west (left) side of the ocean ridge?") 1. Crustal formation, which may cause the widening of an ocean, is most likely occurring at the boundary between the A) African Plate and the Eurasian Plate B) Pacific Plate and the Philippine Plate C)
1. Crustal formation, which may cause the widening of an ocean, is most likely occurring at the boundary between the A) African Plate and the Eurasian Plate B) Pacific Plate and the Philippine Plate C)
GPS Strain & Earthquakes Unit 4: GPS strain analysis examples Student exercise
 GPS Strain & Earthquakes Unit 4: GPS strain analysis examples Student exercise Example 1: Olympic Peninsula Name: Please complete the following worksheet to estimate, calculate, and interpret the strain
Chapter 15. Earthquakes and Plate Tectonics. what s the connection? At the boundaries friction causes plates to stick together.
 Chapter 15 Earthquakes and Plate Tectonics what s the connection? As with volcanoes, earthquakes are not randomly distributed over the globe At the boundaries friction causes plates to stick together.
The Earthquake Cycle Chapter :: n/a
 The Earthquake Cycle Chapter :: n/a A German seismogram of the 1906 SF EQ Image courtesy of San Francisco Public Library Stages of the Earthquake Cycle The Earthquake cycle is split into several distinct
Microearthquake Focal Mechanisms
 Microearthquake Focal Mechanisms A Tool for Monitoring Geothermal Systems By Bruce R. Julian (U. S. Geological Survey - Menlo Park, CA) and Gillian R. Foulger (University of Durham - Durham, United Kingdom)
Automatic Moment Tensor Analyses, In-Situ Stress Estimation and Temporal Stress Changes at The Geysers EGS Demonstration Project
 PROCEEDINGS, 42nd Workshop on Geothermal Reservoir Engineering Stanford University, Stanford, California, February 13-15, 2017 SGP-TR-212 Automatic Moment Tensor Analyses, In-Situ Stress Estimation and
Full file at
 Chapter 2 PLATE TECTONICS AND PHYSICAL HAZARDS MULTIPLE-CHOICE QUESTIONS 1. What direction is the Pacific Plate currently moving, based on the chain of Hawaiian Islands with only the easternmost island