Ecole d Eté Altimétrie spatiale. Sea level variations at climatic time scales: observations & causes. Benoit Meyssignac
|
|
|
- Asher Ferguson
- 5 years ago
- Views:
Transcription


1 Ecole d Eté 2014 Altimétrie spatiale Sea level variations at climatic time scales: observations & causes Benoit Meyssignac 1 Ecole d Eté 2014, Saint-Pierre d Oléron, 1-5 septembre 2014
2
3 Echelles climatiques
 Echelles")
4 Satellite Altimetry (nadir) Echelles climatiques
5 Outline What do we mean by «sea level» (What is in the sea level signal?) Observed sea level variations over the last yr (Is sea level rise accelarating? Is the current sea level rise unusual?) Causes of the sea level variations at climatic time scales (can we explain the present sea level rise and close the sea level budget?) Future sea level rise (What will be the future sea level in 2100?, what is the associated uncertainty?)
6 Outline What do we mean by «sea level» (What is in the sea level signal?) Observed sea level variations over the last yr (Is sea level rise accelarating? Is the current sea level rise unusual?) Causes of the sea level variations at climatic time scales (can we explain the present sea level rise and close the sea level budget?) Future sea level rise (What will be the future sea level in 2100?, what is the associated uncertainty?)

7 What do we mean by sea level? absolute sea level and relative sea level relative SSH = absolute SSH absolute LSH


 motion wrt the")
8 International Terrestrial Reference System: Localisation Pole Motion wrt the Earth surface (crust) Geocenter (center of mass) motion wrt the center of figure 8
 mm/yr between 2000 and 2006 (ITRF2000 IGS ppp). 0.")
9 International Terrestrial Reference Frame uncertainty: mm/yr From Plag 2006 Sea level trend generated by an uncertainty in the ITRF geocenter of (-1.5,-2.2,-2.1) mm/yr between 2000 and 2006 (ITRF2000 IGS ppp). 0.4 mm/yr in GMSL


10 What is in the sea level signal? SSH = geoid+mdt+sla


11 What is in the sea level signal: SSH-geoid = MDT+SLA


12 Sea level anomaly from satellite altimetry over
13 Outline What do we mean by «sea level» (What is in the sea level signal?) Observed sea level variations over the last yr (Is sea level rise accelarating? Is the current sea level rise unusual?) Causes of the sea level variations at climatic time scales (can we explain the present sea level rise and close the level budget?) Future sea level rise (What will be the future sea level in 2100?, what is the associated uncertainty?)
 Last")
 Present Updated from Lambeck et al.")
14 Global mean sea level rise since the Last Glacial Maximum ( years) Last Glacial Maximun +130 m Past Time (thousand years) Present Updated from Lambeck et al., 2002
15 Sea level evolution during the past 6000 years From Lambeck et al., 2010
16 Evolution of the mean sea level over the last 2000 years Kemp et al. (2011)

 Tide")


17 Instrumental era (since mid/late-19 th century) Tide gauge distribution with records > 40 years New York Brest Honolulu Tide gauge 20 cm Buenos-Aires 1900 Date 2000
18 Global mean sea level (20 th century) from tide gauge records 25 Jevrejeva et al Church and White 2011 Ray and Douglas ~18 cm cm 5 0 Data from Church and White (2011) Rate of sea level rise (20 th century) : 1.8 +/- 0.3 mm/yr

19 Sea level change now measured by satellites 19
20 Global coverage of the Earth in a few days 20
 Jason-1 (2001-2013)")
 Envisat")
 Saral-Altikaa(2013)")

21 Topex-Poseidon( ) GFO ( ) Jason-1 ( ) Jason-2 (2008) ERS-1/2 ( / ) Envisat ( ) Cryosat(2010) HY2A(2011) Saral-Altikaa(2013) Current sea surface height accuracy : 1cm-2 cm for a single measurement High-precision satellite altimetry
22 Global Mean Sea Level Rise measured by altimeter satellites since 1993 Rate of sea level rise ( ) 3.2 +/- 0.4 mm/yr La Nina 6 cm El Nino
 Dry atmos. (pressure fields) (Ablain et al.) 0.3 0.25 0.1 Sea state bias (Ablain et al.) 0.1 Quadratic sum 0.44 Tide gauge calibration (Micthum and Nerem; Beckley et al.; Ablain et al.")
23 Global mean sea level trend: error budget Source Trend error (mm/yr) Orbit (Beckley et al., Ablain et al.) 0.25 Wet atmos. (TMR/JMR drift) (Ablain et al.) Topex A-Topex B (Ablain et al.) Dry atmos. (pressure fields) (Ablain et al.) Sea state bias (Ablain et al.) 0.1 Quadratic sum 0.44 Tide gauge calibration (Micthum and Nerem; Beckley et al.; Ablain et al.) 0.4


24 Regional sea level: Sea level does not rise uniformly! Sea level trend patterns from satellite altimetry ( ) mm/yr
25 Summary of the Global mean sea level evolution Satellite altimetry era (since 1993) 6 cm Today Historical tide gauge data ~24 cm IPCC AR5, Oct 2013
26 Outline What do we mean by «sea level» (What is in the sea level signal?) Observed sea level variations over the last yr (Is sea level rise accelarating? Is the current sea level rise unusual?) Causes of the sea level variations at climatic time scales (can we explain the present sea level rise and close the level budget?) Future sea level rise (What will be the future sea level in 2100?, what is the associated uncertainty?)
27 Can we explain the observed sea level rise? Climatic contributions to the global mean sea level ( ) Altimetry-based sea level Total climatic contributions Total land ice Glaciers Thermal expansion Greenland Antarctica Church et al, 2011, Meyssignac &Cazenave, 2012


28 Ocean temperature measurements (XBT, CTD, Argo) Past few decades: coverage mainly along commercial roads Since about 2003 Argo profiling floats
29 Upper ocean thermal expansion (0-700 m) Temperature data from: Levitus et al. (2009) Ishii & Kimoto (2009) Thermal expansion = ρ (T,S, depth)/ρ ref Deep ocean warming contribution poorly known but estimated to ~ 20%
30 Global mean sea level ( ) Observed sea level by satellite altimetry Trend: 3.2 mm/yr Data from Levitus et al. (2009) Argo data from different groups Thermal expansion Mean trend ( ): 1.0 +/- 0.3 mm/yr*** ***: including the deep ocean contribution
31 Can we explain the observed sea level rise? Climatic contributions to the global mean sea level ( ) Altimetry-based sea level Total climatic contributions Total land ice Glaciers Thermal expansion Greenland Antarctica Church et al, 2011, Meyssignac &Cazenave, 2012


32 Contribution of glacier melting to sea level rise Satellite imagery GRACE space gravimetry Image SPOT 5 du massif du Mont Blanc 1900 In situ measurements Present
33 Contribution of glacier melting to sea level rise Annual Ice mass loss by glacier melting (Gt/year) Cogley, 2009 Meier, et al., 2007 Update from Cogley (2009); Kaser (p.c.) 360 Gt/yr ice mass loss = 1 mm/yr sea level rise 2010 Glacier contribution to sea level rise: ( ): 1. +/- 0.2 mm/yr ( ) : 1. +/ mm/yr (Updated from Meier et al., 2007)
34 Can we explain the observed sea level rise? Climatic contributions to the global mean sea level ( ) Altimetry-based sea level Total climatic contributions Total land ice Glaciers Thermal expansion Greenland Antarctica Church et al, 2011, Meyssignac &Cazenave, 2012


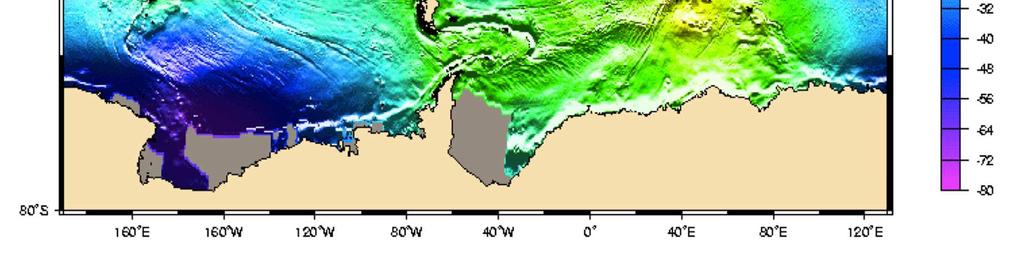
35 Ice sheet mass balance measured by remote sensing over the last 2 decades Greenland Greenland GRACE space gravimetry Antarctica InSAR Radar and laser altimetry 35
 0.6 +/- 0.2 mm/yr (2005-2010) 1. +/- 0.15 mm/yr")
36 Contribution of ice sheets to sea level rise Annual ice mass loss (Gt/yr) over From Shepherd et al Greenland + Antarctica contributions: ( ) 0.6 +/- 0.2 mm/yr ( ) 1. +/ mm/yr
37 Sea level rate 3 mm/yr Sea Level Budget: Sum of climatic components Observed sea level rise 2 mm/yr Land ice Ice sheets ~ 0.6 mm/yr Thermal expansion 1 mm/yr Glaciers ~1 mm/yr ~1. mm/yr
38 Global Mean Sea Level Rise measured by altimeter satellites since 1993 Rate of sea level rise ( ) 3.2 +/- 0.4 mm/yr La Nina 6 cm El Nino

39 Global Mean Sea Level Rise measured by altimeter satellites since 1993 El Niño 97/98 Essentially Amazon basin water storage La Niña 10/11 Essentially Australian basins water storage Detrended GMSL Ocean mass signal

40 Regional sea level: Sea level does not rise uniformly! Sea level trend patterns from satellite altimetry ( ) mm/yr
41 Regional variability of the rates of sea level change over (global mean rise removed) Observed sea level by satellite altimetry Observed thermal expansion + salinity changes

42 Another source of regional variability in sea level rise large-scale water mass redistribution due to land ice melt deforms ocean basins because the Earth mantle is viscous and the crust is elastic

43 Effects of Greenland and Antarctica mass loss on present-day sea level measurements Satellite altimetry from Tamisiea and Mitrovica 2011

44 Regional variability of the rates of sea level change over (global mean rise removed) Observed sea level by satellite altimetry Observed thermal expansion + salinity changes

45 Regional variability of the rates of sea level change (global mean rise removed) Observed sea level by satellite altimetry Reconstructed sea level With Tide gauges, satellite altimetry and OGCMs
46 Summary on sea level rise over the last 20 years Present sea level rise is due to thermal expansion of the ocean + land ice melt The interannual variability in sea level is essentially due to land water storage in response to the main climate modes of variability The regional variability in sea level rise is essentially due to the redistribution of heat and salt in the ocean by the circulation
47 Key questions about global sea level rise Is present sea level rise linked to anthropogenic green-house gazes emissions?


48 Energy budget of the earth at the equilibrium Soleil rayonnement Terre Under no climate change Energy in = Energy out
 Under climate change Net =Energy in - Energy")
49 Energy budget of the Earth Rayonnement reçu par la planète: 342 Watts/m 2 30% (Rayonnement IR) 100% (visible+ir+uv) Infra Rouge Réchauffement de la Terre par les gaz à effet de serre 70% (243Watts/m 2 ) Under climate change Net =Energy in - Energy out
50 Canonical Climate Forcing +2% S O or 2xCO 2 Case 1. Black Body C Case 2. Fast Feedbacks + 3 C H 2 O, Sea Ice, Clouds, Aerosols Case 3. Fast Feedbacks + Slow Surface Changes + 6 C Ice Sheets, Vegetation
51 Heat Content (10 22 Joules) Energy Budget of the Earth (last 50 years) Oceans ~ 90% of the observed global warming since 1950 is in the ocean 5 Land Atmosphere Levitus et al. 2005, 2012 Hansen et al Church et al
52 Energy Budget of the Earth from data Updated from Loeb et al. 2012

53 Energy Budget of the Earth Thermal expansion of the ocean From Gregory et al
54 Energy Budget of the Earth Glaciers ice melt From Gregory et al
 + ice loss through calving of icebergs (dynamical")
55 Ice sheet mass loss Ice sheet mass balance = surface mass balance (accumulation/ablation) + ice loss through calving of icebergs (dynamical change)
56 Summary on global sea level rise Sea level is rising fast compared to previous 3000yr Similar or higher rates already occurs in the past (14000 yrs ago) but for different reasons Present sea level rise is due to thermal expansion of the ocean + land ice melt The ocean warming and glaciers ice melt are linked to the anthropogenic GHG emissions
57 Outline What do we mean by «sea level» (What is in the sea level signal?) Observed sea level variations over the last yr (Is sea level rise accelarating? Is the current sea level rise unusual?) Causes of the sea level variations at climatic time scales (can we explain the present sea level rise and close the level budget?) Future sea level rise (What will be the future sea level in 2100?, what is the associated uncertainty?)

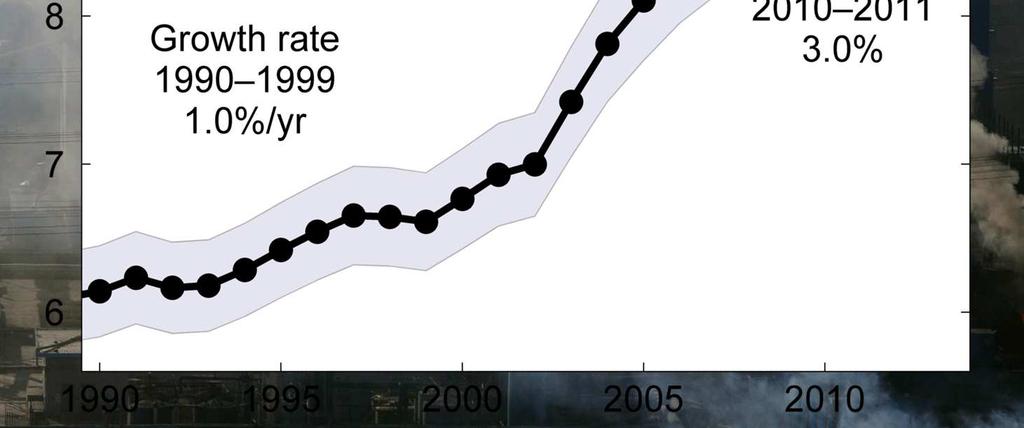
58 Greenhouse Gas Emissions 1990 Gigatons /year (carbon equivalent) From Le Le Quéré et et al., 2012
59 Warming scenarios considered by IPCC AR5 Representative Concentration Pathways (RCPs) 4 RCP scenarios defined by their total radiative forcing by 2100: - RCP2.6 (2.6 Wm -2 ) - RCP4.5 (4.5 Wm -2 ) - RCP6.0 (6.0 Wm -2 ) - RCP8.5 (8.5 Wm -2 ) Radiative forcing : an energy imbalance imposed on the climate system either externally or by human activities; ususally reported as a change in energy flux at the top of the atmosphere and expressed in units of watts per square meters (Wm -2 )


60 4 scenarios for future greenhouse gas emissions considered by IPCC AR5 for the 21 st century RCP 8.5 RCP 6.0 RCP 4.5 RCP 2.6 From IPCC AR5,2013

61 Earth surface mean temperature projections From IPCC AR5,2013
62 Projections in future sea level rise: Will sea level continue to rise in the future? Can we estimate the future global and regional? sea level rise? Depends on many still poorly known processes, e.g.: -Deep ocean heat uptake -Future land water changes due to human activities (e.g., ground water pumping) -Future dynamical behaviour of the ice sheets

63 Global mean sea level projections 63 From IPCC AR5,2013
64 Global mean sea level evolution Satellite altimetry era (since 1993) 6 cm Projections from climate models RCP 2.6 and 8.5 Today Historical tide gauge data ~20 cm From IPCC AR5,2013
65 Key question: Can we predict the future total relative sea level rise at any location? i.e., the global mean sea level rise? + the climate-related regional variability (due to ocean warming and freshening of sea waters)? + regional variations caused by deformation of ocean basins in response to ice mass redistribution (due to Last Deglaciation & future land ice melt)? + Local vertical motions of the ground (subsidence or uplift)?


66 Regional variability in relative sea level in (RCP 4.5) Ice sheets Glaciers steric Post-Glacial Rebound From IPCC AR5,2013 Sea level change (m) wrt present-day sea level


67 Regional variability in relative sea level and uncertainty (rcp 4.5) Sea level change in wrt present-day sea level Lower 90% CL uncertainty Upper 90% CL uncertainty From IPCC AR5,2013


68 Regional variability in relative sea level in From IPCC AR5,2013 Sea level change (m) wrt present-day sea level
69 Long-term climate change Many aspects of climate change will persist for many centuries even if emissions of greenhouse gases are stopped! 20% of emitted CO 2 will remain in the atmosphere more than 1000 years Sea level will continue to rise for mainy centuries in response to deep ocean warming and associated thermal expansion Ice sheet mass loss may become irreversible (Greenland) sustained warming above a certain threshold (1 C-4 C) may lead to near-complete loss of the Greenland ice sheet over a time scale of 1000 years ( 7 m of sea level rise)
70 Conclusions - Current global mean sea level rise is likely accelerating - The sea level budget (altimetry era) almost closed - Global mean sea level rise: very likely a consequence of anthropogenic global warming - Regional variability (spatial trend patterns) :due to heat redistribution still dominated by natural (internal) modes of climate variability - The global mean sea level will continue to rise during the 21st century in response to global warming (values by 2100 in the range 50 cm-1 m NOT unlikely) - The regional variability will amplify the global mean rise by 30%-40% in the tropics - Even if GHG emissions stop tomorrow, sea level will continue to rise during several centuries
71 Great challenges for the coming years Insure continuity of in situ and space-based observations of all components of the climate system Improve sea level estimates and projections from climate models at regional & local scales, integrating climate change processes & non climatic factors (e.g., solid Earth processes, human-related changes in hydrology) Evaluate coastal vulnerability and adapt according to LOCAL PROJECTIONS of future sea level rise 71

72 Thanks for your attention
73 Extra slides 73

74 Sea level reconstruction from tide gauges Jevrejeva et al Paleo Sea level data from salt marshes: North Carolina, Kemp et al Iceland, Gehrels et al New Zealand, Gehrels et al Tasmania, Gehrels et al Nova Scotia, Gehrels et al. 2005
75 32 mm/yr 28 Rates of sea level rise on different time scales Last Interglacial? Mean rate of Sea level rise during last deglaciation Deglaciation MWP-1A yrs ago (duration ~300 years) 40 mm/yr Last 3000 years 20 th century Last 2 decades years to years

")

76 Post Glacial Rebound Models of Post Glacial Rebound (also called Glacial Isostatic Adjustment or GIA) Deglaciation history + Models of Earth s viscosity structure
77 Sea level rate 3 mm/yr Sea Level Budget: Total GRACE + Thermal expansion Observed sea level rise 2 mm/yr GRACE-based ocean mass ~1.8 mm/yr (Chen et al., 2012) 1 mm/yr Thermal expansion 0.8. mm/yr

78 Vertical crustal motions can amplify the climate-related sea level rise (if the ground is subsiding) Tide gauge station Sea surface seafloor vertical crustal motions What counts is the TOTAL relative sea level!!! 78
Sea level change recent past, present, future
 Sea level change recent past, present, future Anny Cazenave LEGOS-CNES Toulouse, France CCI_Colocation meeting, ESA/ESRIN Global mean sea level rise during the 20 th century (red : tide gauges; blue :
Regional and global trends
 SEA LEVEL RISE Regional and global trends OCEANOBS 2009 Plenary Paper A.Cazenave D. Chambers, P. Cipollini, J. Hurell, S. Nerem, L.L. Fu, H.P. Plag, C.K. Shum, J. Willis Venice, September 2009 Global mean
Rising Sea Level Observations and Causes. Anny Cazenave LEGOS-CNES, Toulouse, France
 Rising Sea Level Observations and Causes Anny Cazenave LEGOS-CNES, Toulouse, France AAAS Annual Meeting, Chicago, Feb.2009 Sea Level budget: Comparison between observed sea level and sum of climate contributions
Sea-level change: A scientific and societal challenge for the 21 st century John Church International GNSS Service Workshop, Sydney, Feb 11, 2016
 Sea-level change: A scientific and societal challenge for the 21 st century John Church International GNSS Service Workshop, Sydney, Feb 11, 2016 OCEANS AND ATMOSPHERE NATIONAL RESEARCH FLAGSHIP Our coastal
Northern European Sea Level Rise. Aslak Grinsted Centre for Ice and Climate Niels Bohr Institute University of Copenhagen
 Northern European Sea Level Rise Aslak Grinsted Centre for Ice and Climate Niels Bohr Institute University of Copenhagen Global Sea Level Rise The world is warming and this causes sea level to rise because:
Sea Level and Climate
 Sea Level and Climate Anny Cazenave LEGOS-CNES, Toulouse & ISSI, Bern ESA UNCLASSIFIED - For Official Use OUTLINE 1. Introduction 2. Past sea level rise 3. Satellite altimetry and main applications 4.
Aspects of a climate observing system: energy and water. Kevin E Trenberth NCAR
 Aspects of a climate observing system: energy and water Kevin E Trenberth NCAR Tracking Earth s Global Energy Where has global warming from increased GHGs gone? Kevin E Trenberth NCAR Where did the heat
PROCESSES CONTRIBUTING TO THE GLOBAL SEA LEVEL CHANGE
 Second Split Workshop in Atmospheric Physics and Oceanography PROCESSES CONTRIBUTING TO THE GLOBAL SEA LEVEL CHANGE Student: Maristella Berta Mentor: Prof. Stjepan Marcelja Split, 24 May 2010 INTRODUCTION
Understanding and attributing climate variations: The role of energy. Kevin E Trenberth NCAR
 Understanding and attributing climate variations: The role of energy Kevin E Trenberth NCAR NCAR: attribution A way to organize a lot of research Makes it relevant to societal concerns Has some implications
Projection of global and regional sea level change for the 21st century
 Projection of global and regional sea level change for the 21st century Jonathan Gregory 1,2 1 NCAS-Climate, University of Reading 2 Met Office Hadley Centre, Exeter Global mean sea level rise observed
THE CHALLENGE FOR MEASURING SEA LEVEL RISE AND REGIONAL AND GLOBAL TRENDS
 THE CHALLENGE FOR MEASURING SEA LEVEL RISE AND REGIONAL AND GLOBAL TRENDS A. Cazenave (1), D.P. Chambers (2), P. Cipollini (3), L.L. Fu (4),, J.W. Hurell (5) M. Merrifield (6), S. Nerem (7), H.P. Plag
Prolog. Processes Causing Regional Sea Level Change
 Prolog Regional Variability: Causes for contemporary Regional Sea Level Changes Detlef fstammer Center für Erdsystemforschung und Nachhaltigkeit (CEN) Universität Hamburg Sea level is one of the climate
Today s Lecture: Land, biosphere, cryosphere (All that stuff we don t have equations for... )
") Today s Lecture: Land, biosphere, cryosphere (All that stuff we don t have equations for... ) 4 Land, biosphere, cryosphere 1. Introduction 2. Atmosphere 3. Ocean 4. Land, biosphere, cryosphere 4.1 Land
Today s Lecture: Land, biosphere, cryosphere (All that stuff we don t have equations for... ) 4 Land, biosphere, cryosphere 1. Introduction 2. Atmosphere 3. Ocean 4. Land, biosphere, cryosphere 4.1 Land
Oceans and Climate. Caroline Katsman. KNMI Global Climate Division
 Oceans and Climate Caroline Katsman KNMI Global Climate Division Aimée Slangen, Roderik van de Wal (IMAU, Utrecht University) Sybren Drijfhout, Wilco Hazeleger (KNMI, Global Climate) Bert Vermeersen (NIOZ/Delft
Sea Level. John Church WCRP Antarctic Climate and Ecosystems CRC Centre for Australian Weather and Climate Research
 Sea Level John Church WCRP Antarctic Climate and Ecosystems CRC Centre for Australian Weather and Climate Research Sea level rose by more than 120 m since the last glacial maximum 2 Church et al., 2008
J. Fasullo, R.S. Nerem, and B. Hamlington NCAR / University of Colorado. Fasullo: Is Detection of Accelerated Sea Level Rise Imminent?
 Is the Detection of Accelerated Sea Level Rise Imminent? J. Fasullo, R.S. Nerem, and B. Hamlington NCAR / University of Colorado Fasullo: Is Detection of Accelerated Sea Level Rise Imminent? Climate Variability
Sea level change. Eustatic sea level change. Tectono-eustasy. Tectonic control of global sea level. Global signal of sea level change Causes:
 Sea level change Important processes Global vs. local Geologic Modern Current rates of rise Observations, calculations, and models Lessons from the past Projected future changes Eustatic sea level change
6. What has been the most effective erosive agent in the climate system? a. Water b. Ice c. Wind
 Multiple Choice. 1. Heinrich Events a. Show increased abundance of warm-water species of planktic foraminifera b. Show greater intensity since the last deglaciation c. Show increased accumulation of ice-rafted
Contributions of Geodesy to Oceanography
 Contributions of Geodesy to Oceanography B. Tapley and J. Ries Center for Space Research, The University of Texas at Austin Dynamic Planet 2005 Cairns, Australia August 22-26, 2005 August 22-26, 2005 Dynam
An Assessment of IPCC 20th Century Climate Simulations Using the 15-year Sea Level Record from Altimetry Eric Leuliette, Steve Nerem, and Thomas Jakub
 An Assessment of IPCC 20th Century Climate Simulations Using the 15-year Sea Level Record from Altimetry Eric Leuliette, Steve Nerem, and Thomas Jakub Colorado Center for Astrodynamics Research and Department
New satellite mission for improving the Terrestrial Reference Frame: means and impacts
 Fourth Swarm science meeting and geodetic missions workshop ESA, 20-24 March 2017, Banff, Alberta, Canada New satellite mission for improving the Terrestrial Reference Frame: means and impacts Richard
Extremes of Weather and the Latest Climate Change Science. Prof. Richard Allan, Department of Meteorology University of Reading
 Extremes of Weather and the Latest Climate Change Science Prof. Richard Allan, Department of Meteorology University of Reading Extreme weather climate change Recent extreme weather focusses debate on climate
Explanation of thermal expansion differences between climate models
 Explanation of thermal expansion differences between climate models Summary More than 90% of the positive Earth s energy imbalance - mainly anthropogenic as origin (Church et al. 2013) - is stored in the
Physical Dynamics of the Coastal Zone in the Mediterranean on Annual to Decadal Scales
 Physical Dynamics of the Coastal Zone in the Mediterranean on Annual to Decadal Scales Hans-Peter Plag Nevada Bureau of Mines and Geology and Seismological Laboratory University of Nevada, Reno, Nevada,
Understanding and projecting sea level change: improvements and uncertainties
 Understanding and projecting sea level change: improvements and uncertainties Jonathan Gregory On behalf of all the lead authors of Chapter 13, Sea level change John Church, Peter Clark, Anny Cazenave,
Anthropogenic forcing fingerprint on the tropical Pacific sea level trend pattern from the CMIP5 simulations of the XXI st century
 Anthropogenic forcing fingerprint on the tropical Pacific sea level trend pattern from the CMIP5 simulations of the XXI st century Benoît t Meyssignac 1, David Salas y Melia Anny Cazenave 1 1 LEGOS, CNRM/Météo
Sea Level and Climate Change
 Special Report: Sea Level and Climate Change Judith Curry Climate Forecast Applications Network 25 November 2018 Contact information: Judith Curry, President Climate Forecast Applications Network Reno,
A geological perspective on sea-level rise and its impacts
 A geological perspective on sea-level rise and its impacts K.G. Miller, R.E. Kopp, B.H. Horton, J.V. Browning, A.C. Kemp Front Pages November 1, 2012 kgm@rutgers.edu Ship Bottom, Long Beach Island, NJ
Projecting regional sea-level changes for the 21 st century
 Projecting regional sea-level changes for the 21 st century Aimée Slangen In collaboration with Mark Carson (CEN Hamburg), Caroline Katsman (KNMI), Roderik van de Wal (IMAU), Armin Köhl (CEN Hamburg),
Projecting the uncertainty of sea level rise using climate models and statistical downscaling!
 Projecting the uncertainty of sea level rise using climate models and statistical downscaling! Peter Guttorp! Norsk Regnesentral! University of Washington! Outline! The importance of sea level rise! Measuring
Welcome to ATMS 111 Global Warming.
 Welcome to ATMS 111 Global Warming http://www.atmos.washington.edu/2010q1/111 Isotopic Evidence 16 O isotopes "light 18 O isotopes "heavy" Evaporation favors light Rain favors heavy Cloud above ice is
SUPPLEMENTARY INFORMATION
 Online Supplementary Information SUPPLEMENTARY INFORMATION DOI: 10.1038/NGEO1829 (Chen et al., Contribution of polar and mountain glacier melt to recent sea level rise) 1. Steric Sea Level Changes From
Patterns and impacts of ocean warming and heat uptake
 Patterns and impacts of ocean warming and heat uptake Shang-Ping Xie Scripps Inst of Oceanography, UCSD Ocean warming & circulation change Ocean heat uptake & meridional overturning circulation Global
The Science of Sea Level Rise and the Impact of the Gulf Stream
 Old Dominion University ODU Digital Commons July 29, 2016: The Latest in Sea Level Rise Science Hampton Roads Sea Level Rise/Flooding Adaptation Forum 7-29-2016 The Science of Sea Level Rise and the Impact
Climate Change 2007: The Physical Science Basis
 Climate Change 2007: The Physical Science Basis Working Group I Contribution to the IPCC Fourth Assessment Report Presented by R.K. Pachauri, IPCC Chair and Bubu Jallow, WG 1 Vice Chair Nairobi, 6 February
ASSESSING FUTURE EXPOSURE: GLOBAL AND REGIONAL SEA LEVEL RISE SCENARIOS FOR THE UNITED STATES
 ASSESSING FUTURE EXPOSURE: GLOBAL AND REGIONAL SEA LEVEL RISE SCENARIOS FOR THE UNITED STATES Chesapeake Bay Program Climate Resiliency Workgroup Conference Call May 15, 2017 William Sweet NOAA CO-OPS
PCIC SCIENCE BRIEF: SEA LEVEL RISE OBSERVATIONS
 PCIC SCIENCE BRIEF: SEA LEVEL RISE OBSERVATIONS AND ACCELERATION Three recent journal articles examine the rate of sea level rise and the ability of models to accurately simulate sea level rise at a global
Frank PATTYN Laboratoire de Glaciologie Université Libre de Bruxelles Belgium
 Frank PATTYN Laboratoire de Glaciologie Université Libre de Bruxelles Belgium 200 x 10 6 people living in coastal floodplains IPCC, 2007 2 x 10 6 km 2 and 10 12 US$ worth of assets lying
Centre for Australian Weather and Climate Research A partnership between CSIRO and the Australian Bureau of Meteorology
 Improved Ocean Warming Estimates: Implications for Climate Models and Sea-Level Rise Catia Domingues 1 John Church 1,2 Neil White 1,2 Peter Gleckler 3 Susan Wijffels 1 Paul Barker 1 Jeff Dunn 1 1 Centre
Global warming and Extremes of Weather. Prof. Richard Allan, Department of Meteorology University of Reading
 Global warming and Extremes of Weather Prof. Richard Allan, Department of Meteorology University of Reading Extreme weather climate change Recent extreme weather focusses debate on climate change Can we
Torben Königk Rossby Centre/ SMHI
 Fundamentals of Climate Modelling Torben Königk Rossby Centre/ SMHI Outline Introduction Why do we need models? Basic processes Radiation Atmospheric/Oceanic circulation Model basics Resolution Parameterizations
The oceans: Sea level rise & gulf stream
 Lecture Climate Change Lesson 10 The oceans: Sea level rise & gulf stream Rene Orth rene.orth@bgc-jena.mpg.de 1 Course webpage https://www.bgc-jena.mpg.de/bgi/index.php/lectures/hydrobioclimclimatechange
Sea-Level Rise in the Humboldt Bay Region
 Sea-Level Rise in the Humboldt Bay Region Update 1: March 2018 Prepared by Jeffrey K. Anderson Northern Hydrology & Engineering P.O. Box 2515 McKinleyville, CA 95519 Preparation of this document was partially
Climate Roles of Land Surface
 Lecture 5: Land Surface and Cryosphere (Outline) Climate Roles Surface Energy Balance Surface Water Balance Sea Ice Land Ice (from Our Changing Planet) Surface Albedo Climate Roles of Land Surface greenhouse
Sea level contribution of Antarctica & Greenland Andrew Shepherd
 Andrew Shepherd School of Geosciences, Edinburgh Sea Subglacial level contribution lakes of Antarctica & Greenland Climate change Satellite observations Ice Sheets and Sea level Climate change Climate
Coastal and Marine Projections for the Natural Resource Management Regions of Australia
 Coastal and Marine Projections for the Natural Resource Management Regions of Australia The Australian Coastal Councils Association Conference, May 4, 2016, Rockingham, WA Kathleen McInnes John Church,
Today we will discuss global climate: how it has changed in the past, and how the current status and possible future look.
 Global Climate Change Today we will discuss global climate: how it has changed in the past, and how the current status and possible future look. If you live in an area such as the Mississippi delta (pictured)
Land Surface Sea Ice Land Ice. (from Our Changing Planet)
") Lecture 5: Land Surface and Cryosphere (Outline) Land Surface Sea Ice Land Ice (from Our Changing Planet) Earth s s Climate System Solar forcing Atmosphere Ocean Land Solid Earth Energy, Water, and Biochemistry
Lecture 5: Land Surface and Cryosphere (Outline) Land Surface Sea Ice Land Ice (from Our Changing Planet) Earth s s Climate System Solar forcing Atmosphere Ocean Land Solid Earth Energy, Water, and Biochemistry
Earth s Climate System. Surface Albedo. Climate Roles of Land Surface. Lecture 5: Land Surface and Cryosphere (Outline) Land Surface Sea Ice Land Ice
 Land Surface Sea Ice Land Ice") Lecture 5: Land Surface and Cryosphere (Outline) Earth s Climate System Solar forcing Land Surface Sea Ice Land Ice Atmosphere Ocean Land Solid Earth Energy, Water, and Biochemistry Cycles (from Our Changing
Lecture 5: Land Surface and Cryosphere (Outline) Earth s Climate System Solar forcing Land Surface Sea Ice Land Ice Atmosphere Ocean Land Solid Earth Energy, Water, and Biochemistry Cycles (from Our Changing
Climate Change: Understanding Recent Changes in Sea Level and the Ocean. Sea Level Rise
 Climate Change: Understanding Recent Changes in Sea Level and the Ocean Sea Level Rise Philip L. Woodworth Proudman Oceanographic Laboratory, Liverpool ASE/BA/City of Culture Evening 18 October 2007 Long
Sea-Level Rise in the Humboldt Bay Region
 Local Sea-Level Rise (cm) Local Sea-Level Rise (cm) Sea-Level Rise in the Humboldt Bay Region Update 2: December 2018 350 300 250 200 150 North Spit Monthly Mean (1977-2016) RCP 8.5 RCP 2.6 Ext 2.5 RCP
Geodetic Observing Systems: tools in observing the Glacial Isostatic Adjustment. Markku Poutanen Finnish Geodetic Institute
 Geodetic Observing Systems: tools in observing the Glacial Isostatic Adjustment Markku Poutanen Finnish Geodetic Institute Glacial Isostatic Adjustment Land uplift is just one consequence of the physical
What we know about regional sea level rise and how we are affected by variations from the global mean
 regional sea level rise and variations from the global Magnus Hieronymus 2018 Regional and Global Sea level Global Density change: thermosteric Regional Density change: thermosteric+ halosteric Land Ice
Future Climate and Sea Level
 Future Climate and Sea Level Tonight: 2 nd night on human changes and controversy around them. three night series : 1) An Inconvenient truth 2) Impacts: Observed Warming and Projected Sea Level Changes
Monitoring Climate Change from Space
 Monitoring Climate Change from Space Richard Allan (email: r.p.allan@reading.ac.uk twitter: @rpallanuk) Department of Meteorology, University of Reading Why Monitor Earth s Climate from Space? Global Spectrum
GEOL/ENVS 3520 Spring 2009 Hour Exam #2
 GEOL/ENVS 3520 Spring 2009 Hour Exam #2 Enter your name, the date, your ID number, and a made-up 4-digit code (for later recall and identification of your test results) on the separate test sheet. Carefully
Interannual variations in degree-2 Earth s gravity coefficients C 2,0,C 2,2, and S 2,2 reveal large-scale mass transfers of climatic origin
 Author manuscript, published in "Geophysical Research Letters 40, 15 (2013) 4060-4065" DOI : 10.1002/grl.50772 GEOPHYSICAL RESEARCH LETTERS, VOL. 40, 1 6, doi:10.1002/grl.50772, 2013 Interannual variations
Tracking Earth s energy: From El Niño to global warming
 Tracking Earth s energy: From El Niño to global warming Kevin E. Trenberth and John T. Fasullo National Center for Atmospheric Research, Boulder, CO, USA Correspondence: Contact trenbert@ucar.edu Science
The ocean s overall role in climate
 The ocean s overall role in climate - moderates climate in time (diurnally, annually) - redistributes heat spatially in the largescale ocean circulation - lower albedo (sea ice higher albedo) - dry atmosphere
ATOC OUR CHANGING ENVIRONMENT Class 19 (Chp 6) Objectives of Today s Class: The Cryosphere [1] Components, time scales; [2] Seasonal snow
![ATOC OUR CHANGING ENVIRONMENT Class 19 (Chp 6) Objectives of Today s Class: The Cryosphere [1] Components, time scales; [2] Seasonal snow](/thumbs/95/126309683.jpg "ATOC OUR CHANGING ENVIRONMENT Class 19 (Chp 6) Objectives of Today s Class: The Cryosphere [1] Components, time scales; [2] Seasonal snow") ATOC 1060-002 OUR CHANGING ENVIRONMENT Class 19 (Chp 6) Objectives of Today s Class: The Cryosphere [1] Components, time scales; [2] Seasonal snow cover, permafrost, river and lake ice, ; [3]Glaciers and
ATOC 1060-002 OUR CHANGING ENVIRONMENT Class 19 (Chp 6) Objectives of Today s Class: The Cryosphere [1] Components, time scales; [2] Seasonal snow cover, permafrost, river and lake ice, ; [3]Glaciers and
Future Sea Level Rise and its Implications for SIDS and LDCs
 Future Sea Level Rise and its Implications for SIDS and LDCs Bill Hare, Michiel Schaeffer, Mahé Perrette, Matthias Mengel COP17, Durban, 2 nd December Overview Part 1: Global sea level: past and future
IPCC AR5 WG1 - Climate Change 2013: The Physical Science Basis. Nandini Ramesh
 IPCC AR5 WG1 - Climate Change 2013: The Physical Science Basis Nandini Ramesh Seminar in Atmospheric Science 21 st February, 2014 1. Introduc,on The ocean exchanges heat, freshwater, and C with the atmosphere.
Current Climate Science and Climate Scenarios for Florida
 Current Climate Science and Climate Scenarios for Florida Daniel Bader and Vivien Gornitz Water Utilities and Climate Change Workshop Palm Beach County Water Utilities/ Water Research Foundation June 10,
Let s make a simple climate model for Earth.
 Let s make a simple climate model for Earth. What is the energy balance of the Earth? How is it controlled? ó How is it affected by humans? Energy balance (radiant energy) Greenhouse Effect (absorption
Presented at the FIG Congress 2018, May 6-11, 2018 in Istanbul, Turkey
 Presented at the FIG Congress 2018, May 6-11, 2018 in Istanbul, Turkey Paper ID: 9253 (Peer Review) By: Amalina Izzati Abdul Hamid, Ami Hassan Md Din & Kamaludin Mohd Omar Geomatic Innovation Research
Ice sheet mass balance from satellite altimetry. Kate Briggs (Mal McMillan)
") Ice sheet mass balance from satellite altimetry Kate Briggs (Mal McMillan) Outline Background Recap 25 year altimetry record Recap Measuring surface elevation with altimetry Measuring surface elevation
Ice sheet mass balance from satellite altimetry Kate Briggs (Mal McMillan) Outline Background Recap 25 year altimetry record Recap Measuring surface elevation with altimetry Measuring surface elevation
Future sea level rise through 2100 and beyond
 Future sea level rise through 2100 and beyond Emma Stone Uncertain World Summit (Tuesday 20 October 2015) 1 Why are we interested in future sea level rise? How certain are we about the worst case scenario
Remote Sensing 4 Global mass changes from remote sensing
 Remote Sensing 4 Global mass changes from remote sensing Nick Barrand School of Geography, Earth & Environmental Sciences University of Birmingham, UK Why glacier mass changes? o Water resources o Energy
DRAFT. In preparing this WCRP Workshop program some key questions identified were:
 1 DRAFT What have we learnt from the Paleo/Historical records. Kurt Lambeck Background One of the aims of workshop is to identify and quantify the causes contributing to the present observed sea-level
Anthropogenic forcing dominates global mean sea-level rise since 1970
 Anthropogenic forcing dominates global mean sea-level rise since 1970 Aimée B. A. Slangen 1,2 *, John A. Church 1, Cecile Agosta 3, Xavier Fettweis 3, Ben Marzeion 4 and Kristin Richter 5 1 CSIRO Oceans
Product Validation and Intercomparison report
 Consortium Members ESA Sea Level CCI Product Validation and Intercomparison report Reference: Nomenclature: CLS-SLCCI-16-0034 SLCCI-PVIR-073_SL_cciV2 Issue: 1. 1 Date: Dec. 1, 16 CLS-SLCCI-16-0034 SLCCI-PVIR-073_SL_cciV2
Science of Global Warming and Climate Change
 Science of Global Warming and Climate Change Part 1 Science Dr. David H. Manz, P. Eng. University of Calgary May 2015 Weather vs. Climate Weather happens day to day (moment to moment) best forecast is
Sea Level Rise in Connecticut A Risk-Informed Approach
 GZA GeoEnvironmental, Inc. CAFM Conference October 25, 2017 Proactive By Design. Our Company Commitment Proactive By Design. Our Company Commitment Sea Level Rise in Connecticut A Risk-Informed Approach
Projecting regional sea-level changes for the 21 st century
 Projecting regional sea-level changes for the 21 st century Aimée Slangen Postdoctoral research fellow In collaboration with: Mark Carson (CEN Hamburg), Caroline Katsman (KNMI), Roderik van de Wal (IMAU),
Sea level projections with semiempirical and earth system models
 Sea level projections with semiempirical and earth system models John C. Moore College of Global Change and Earth System Science, Beijing Normal University, Beijing, China and Arctic Centre, University
Sea level over glacial cycles.
 Sea level over glacial cycles. T1: 1 m/century With short periods of with rates up to 4m/century LIG Sea level higher than today (+9m) Siddall et al. 2003 Very stable sea level in human history. Image
Summary for the Greenland ice sheet
 Contribution of Greenland and Antarctica to future sea level change Catherine Ritz, Gaël Durand, Fabien Gillet-Chaulet, Olivier Gagliardini, Vincent Peyaud EDGe team, LGGE, CNRS/UJF Grenoble, France Ice
Activity 2.2: Recognizing Change (Observation vs. Inference)
") Activity 2.2: Recognizing Change (Observation vs. Inference) Teacher Notes: Evidence for Climate Change PowerPoint Slide 1 Slide 2 Introduction Image 1 (Namib Desert, Namibia) The sun is on the horizon
Activity 2.2: Recognizing Change (Observation vs. Inference) Teacher Notes: Evidence for Climate Change PowerPoint Slide 1 Slide 2 Introduction Image 1 (Namib Desert, Namibia) The sun is on the horizon
Active microwave systems (2) Satellite Altimetry * the movie * applications
 Satellite Altimetry * the movie * applications") Remote Sensing: John Wilkin wilkin@marine.rutgers.edu IMCS Building Room 211C 732-932-6555 ext 251 Active microwave systems (2) Satellite Altimetry * the movie * applications Altimeters (nadir pointing
Remote Sensing: John Wilkin wilkin@marine.rutgers.edu IMCS Building Room 211C 732-932-6555 ext 251 Active microwave systems (2) Satellite Altimetry * the movie * applications Altimeters (nadir pointing
XVI. Warming and the cryosphere
 XVI. Warming and the cryosphere review temperature from thermometers, satellites, glacier lengths and boreholes all show significant warming in the 20th C+ reconstruction of past temperatures from corals,
Sea level variability in the North Indian Ocean
 Sea level variability in the North Indian Ocean M. Ravichandran ESSO-National Centre for Antarctic and Ocean Research (NCAOR) (Ministry of Earth Sciences, Govt. of India) Goa mravi@ncaor.gov.in U.Srinivasu
Ocean Climate Variability and Change around the Cook Is.
 Ocean Climate Variability and Change around the Cook Is. D. E. Harrison NOAA/PMEL & Univ. of Washington Mark Carson University of Hamburg International Workshop on Climate and Ocean Fisheries Rarotonga,
John A. Church, Kathleen L. McInnes, Didier Monselesan and Julian O Grady. 28 June 2016 Report for NCCARF
 Interpretation material to accompany SLR and allowance data for coastal councils around Sea-Level Rise and Allowances for Coastal Councils around Australia Guidance Material John A. Church, Kathleen L.
PUBLICATIONS. Geophysical Research Letters. An increase in the rate of global mean sea level rise since 2010 RESEARCH LETTER 10.
 Title An increase in the rate of global mean sea level ris Author(s)Yi, Shuang; Sun, Wenke; Heki, Kosuke; Qian, An CitationGeophysical Research Letters, 42(1): 3998-46 Issue Date 215-5-28 Doc URL http://hdl.handle.net/2115/6286
3. Climate Change. 3.1 Observations 3.2 Theory of Climate Change 3.3 Climate Change Prediction 3.4 The IPCC Process
 3. Climate Change 3.1 Observations 3.2 Theory of Climate Change 3.3 Climate Change Prediction 3.4 The IPCC Process 3.1 Observations Need to consider: Instrumental climate record of the last century or
Global sea level projections by Svetlana Jevrejeva National Oceanography Centre, Liverpool, UK
 Global sea level projections by 2100 Svetlana Jevrejeva National Oceanography Centre, Liverpool, UK sveta@noc.ac.uk Outline Cause of sea level rise/sea level budget Global sea level projections by 2100:
B. The Observed Changes in the Climate System
 gases (decades to centuries), and, as a result, their concentrations respond much more quickly to changes in emissions. Volcanic activity can inject large amounts of sulphur-containing gases (primarily
Modeling Sea Level Rise in Caribbean SIDS: The Need for Tide Gauge Data
 Modeling Sea Level Rise in Caribbean SIDS: The Need for Tide Gauge Data Michael Sutherland and Demi Singh Department of Geomatics Engineering and Land Management Faculty of Engineering University of the
Observations: Oceanic Climate Change and Sea Level
 5 Observations: Oceanic Climate Change and Sea Level Coordinating Lead Authors: Nathaniel L. Bindoff (Australia), Jürgen Willebrand (Germany) Lead Authors: Vincenzo Artale (Italy), Anny Cazenave (France),
Weather Forecasts and Climate AOSC 200 Tim Canty. Class Web Site: Lecture 27 Dec
 Weather Forecasts and Climate AOSC 200 Tim Canty Class Web Site: http://www.atmos.umd.edu/~tcanty/aosc200 Topics for today: Climate Natural Variations Feedback Mechanisms Lecture 27 Dec 4 2018 1 Climate
The Global Geodetic Observing System (GGOS) of the International Association of Geodesy, IAG
 of the International Association of Geodesy, IAG") The Global Geodetic Observing System (GGOS) of the International Association of Geodesy, IAG Hans-Peter Plag (1), Markus Rothacher (2), Richard Gross (3), Srinivas Bettadpur (4) (1) Nevada Bureau of Mines
The Global Geodetic Observing System (GGOS) of the International Association of Geodesy, IAG Hans-Peter Plag (1), Markus Rothacher (2), Richard Gross (3), Srinivas Bettadpur (4) (1) Nevada Bureau of Mines
Past, present and future
 Southern New Jersey and Delaware sea levels: Past, present and future Benjamin P. Horton Sea Level Research Department of Marine and Coastal Science Rutgers University bphorton@marine.rutgers.edu DRIVERS
Oceanography from Space
 Why study the ocean? Oceanography from Space Paolo Cipollini National Oceanography Centre, Southampton, U.K. LOCAL drivers: fisheries, shipping, transportation, coastal erosion, leisure Norwegians know
Comparison of Comprehensive Tide Gauge and Satellite Data Sets. Bob Dean and Jim Houston
 Comparison of Comprehensive Tide Gauge and Satellite Data Sets Bob Dean and Jim Houston Satellite Altimetry Measures sea level from 1,330 km above Earth Measurements from - 65 degrees to + 65 degrees of
The science and impact of climate change.
 The science and impact of climate change. University of Puerto Rico-Mayaguez The National Science foundation sponsored: "Coastal Area Climate Change Education (CACCE) Partnership". Mayaguez, Puerto Rico
APPENDIX A: ABSOLUTE SEA LEVEL METHODS AND PROJECTION TABLES
 APPENDIX A: ABSOLUTE SEA LEVEL METHODS AND PROJECTION TABLES As described in the main body of this report, absolute sea level projections were developed using a slightly modified approach from Kopp et
Chapter 13: Sea Level Change
 First Order Draft Chapter IPCC WGI Fifth Assessment Report 0 0 0 0 0 Chapter : Sea Level Change Coordinating Lead Authors: John A. Church (Australia), Peter U. Clark (USA) Lead Authors: Anny Cazenave (France),
Quality assessment of altimeter and tide gauge data for Mean Sea Level and climate studies
 Quality assessment of altimeter and tide gauge data for Mean Sea Level and climate studies G. Valladeau, L. Soudarin, M. Gravelle, G. Wöppelmann, N. Picot Increasing and improving in-situ datasets Page
Ice Sheets and Sea Level -- Concerns at the Coast (Teachers Guide)
") Ice Sheets and Sea Level -- Concerns at the Coast (Teachers Guide) Roughly 153 million Americans (~53% of the US population) live in coastal counties. World wide some 3 billion people live within 200 km
Ice Sheets and Sea Level -- Concerns at the Coast (Teachers Guide) Roughly 153 million Americans (~53% of the US population) live in coastal counties. World wide some 3 billion people live within 200 km
An Introduction to Coupled Models of the Atmosphere Ocean System
 An Introduction to Coupled Models of the Atmosphere Ocean System Jonathon S. Wright jswright@tsinghua.edu.cn Atmosphere Ocean Coupling 1. Important to climate on a wide range of time scales Diurnal to