Global sea level projections by Svetlana Jevrejeva National Oceanography Centre, Liverpool, UK
|
|
|
- Aldous Webb
- 5 years ago
- Views:
Transcription


1 Global sea level projections by 2100 Svetlana Jevrejeva National Oceanography Centre, Liverpool, UK
2 Outline Cause of sea level rise/sea level budget Global sea level projections by 2100: 1. Process based approach 2. Probabilistic approach 3. Semi-empirical approach Uncertainties in sea level projections Short conclusion
3 Global sea level rise since 1700 Figure 13.27, AR5 IPCC ( 2013) Sea Level Expansion Glaciers Greenland Antarctica Land Water
4 S- sea level T- thermal expansion of the ocean Mg- mass loss from glaciers Gis Greenland ice sheet Ais- Antartcica ice sheet S nc- None climatic component Sea level budget
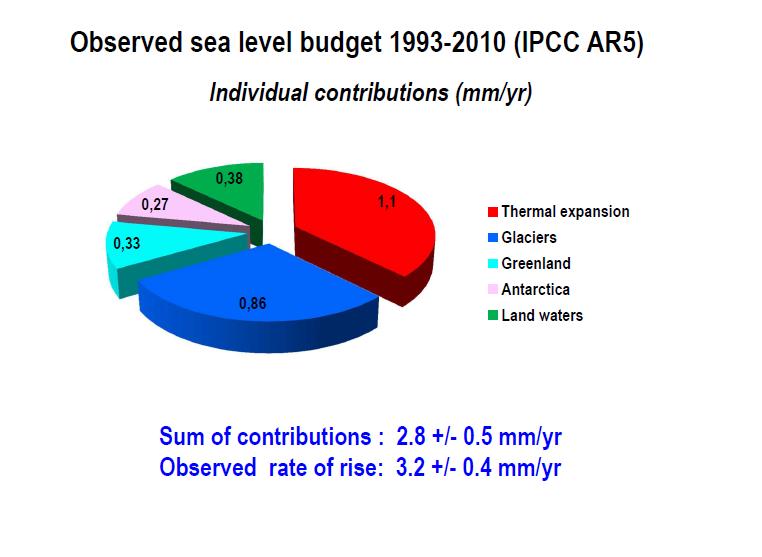
5 Sea level budget since 1993 From A. Cazenave,
6 Global sea level rise by 2100 Figure 13.27, AR5 IPCC ( 2013) Sea Level Expansion Glaciers Greenland Antarctica Land Water
7 Slangen et al., 2017 Processes contributing to sea level changes
8 Process based approach AR5 IPCC, Climate forcing Climate /emission scenarios Coupled Model Intercomparison Project (CMIP5), World Climate Research Programme (WCRP), Modelling of individual components of sea level (excluding land water storage, scenario independent) Challenges

9 Radiative forcing Radiative forcing (W/m 2 ) is the rate of energy change per unit area of the globe as measured at the top of the atmosphere Figure 8.18, AR5 IPCC

10 Where does the heat go? Amount of Heat Absorbed by Parts of Earth Climate System Over Past 40 Years Net Heat Input to Earth System 84% -- Saved by the oceans! (Levitus et al., GRL, 2004)
 GHG emissions continue to grow at current level RCP2.")
11 Scenarios: Representative Concentration Pathways (RCPs) RCP8.5 (Representative Concentration Pathways ) GHG emissions continue to grow at current level RCP2.6 Substantial reductions in emissions ( ) 3.7 C [ ] ( ) 1 C AR5 IPCC, 2013 [ ]
 referenced in 2005 for the 0 700-m layer Melet and Meyssignac,")
12 Thermal expansion: modelling vs observations (0-700m) Thermosteric sea level (mm) referenced in 2005 for the m layer Melet and Meyssignac, 2015
 referenced in 2005 for the full ocean depth Melet and Meyssignac,")
13 Thermal expansion the full ocean depth: modelling vs observations Thermosteric sea level (mm) referenced in 2005 for the full ocean depth Melet and Meyssignac, 2015


14 Thermal expansion: modelling vs observations Slangen et al., 2017
 RCP 4.5, (middle) RCP 8.")
15 Projections: Thermal expansion (CMIP5) Global mean steric sea level change (zossga) over 21st century relative to 2006 for CMIP5 models for experiments (left) RCP 4.5, (middle) RCP 8.5 and (right) multi-model ensemble mean and 2σ


16 Modelling of individual components: Glaciers Fig 4.12, AR5 IPCC Reviews of Geophysics Volume 51, Issue 3, pages , 24 SEP 2013 DOI: /rog
17 Contribution from glaciers (mass balance) Glaciers Slangen et al., 2016 Glaciers


18 Ice loss in Greenland The rate of mass loss, in cm/yr water equivalent thickness, determined from monthly GRACE gravity field solutions, from Khan et al, Straneo et al. 2012

19 Modelling contribution from Greenland ice sheet Reviews of Geophysics Volume 51, Issue 3, pages , 24 SEP 2013 DOI: /rog

20 Modelling of the 20 th century contribution from Greenland Slangen et al KK Kjeldsen et al. 2015

21 Future Greenland ice sheet contribution Slangen et al., 2016 [reproduced from Furst et al. (2015)].

22 Contribution from Antarctica ice sheet Reviews of Geophysics Volume 51, Issue 3, pages , 24 SEP 2013 DOI: /rog
 doi:10.")
23 Large Ensemble model analyses of future Antarctic contributions to GMSL R M DeConto et al. Nature 531, (2016) doi: /nature17145

24 Land water storage Historical and projected terrestrial water contributions to sea level rise Slangen et al., 2017 (based on Wada et al., 2012)

25 Modelled total sea level changes since 1900s Slangen et al., 2017

26 Global sea level projections by 2100 in AR5 IPCC AR5 IPCC, 2013

27 Median values and likely ranges for projections of global mean sea level (GMSL) rise and its contributions in metres in relative to for the four RCP scenarios and SRES A1B, GMSL rise in and 2100, and rates of GMSL rise in mm/yr in (AR5 IPCC, 2013).
 AR5 IPCC, 2013 Credits: Finnish Meteorological")
28 Uncertainties in global sea level projections Likely range (66% probability) AR5 IPCC, 2013 Credits: Finnish Meteorological Institute


29 Probabilistic approach Photo from Environment Agency, UK Photo from Environment Agency, UK
 AR5 IPCC, 2013 Jevrejeva et")
30 Probabilistic approach in global sea level projections Likely range (66% probability) AR5 IPCC, 2013 Jevrejeva et al, 2014
31 Probabilistic approach in global sea level projections Likely range (IPCC) Expansion Glacier Our study Greenland Antarctica Landwater Projected sea level contribution by 2100 (m) Jevrejeva et al, 2014

32 Semi-empirical approach Reviews of Geophysics Volume 51, Issue 3, pages , 24 SEP 2013 DOI: /rog

33 Semi-empirical model by Rafmstorf, 2007 Approach: Smooth GSL record ( ) Calculate dh/dt Linear regression against observed T. Use projected temperatures to project GSL
34 Model including a response time (Grinsted et al, 2010) S = at + b eq (eq. 1) S=f(T) Parameters: (τ, a, b, S 0 )

35 Inverse problem We know T (Temperature, 2000 yrs) We know S (Tide gauges, 300 yrs) We do not know the model parameters that allow us to calculate S from T: a, b, τ, S 0
36 Temperature model: S=f(T)

37 Likelihood of the model How well does S match observations taking into account the uncertainties in observed sea level C is the uncertainty covariance matrix. This takes into account that the observations are not independent

38 PDFs for model parameters
39 Sea level projections (Using A1B temperatures) AR4 IPCC A1B AR4 IPCC A1B Grinsted et al., 2010
 and process based models (grey colour) for (a) RCP2.6, (b) RCP4.5, (c) RCP6.0 and (d) RCP8.5. Figure 13.")
40 Projections from process based and semi-empirical approaches NOTE: Grey colour (process based) is 17-83% Blue and red (SE) are 5-95% Global mean sea level rise (metres) in relative to by semiempirical models (bars) and process based models (grey colour) for (a) RCP2.6, (b) RCP4.5, (c) RCP6.0 and (d) RCP8.5. Figure 13.12, AR5 IPCC
41 Limitations/Uncertainties 1. The largest uncertainties are associated with contribution from Greenland and Antarctica ice sheets: Ocean-ice sheet interaction Ice dynamics Limited number of models/observations 2. Glaciers: No ice dynamics, Limited number of models Limited number of observations to calibrate models 3. Thermal expansion Deep ocean Heat update by the ocean Lack of observations below 2000m Lack of observations prior 1955

42 Regional and local sea level projections by 2100 Svetlana Jevrejeva National Oceanography Centre, Liverpool, UK
43 Outline 1. Background (global regional- local) 2. Physical mechanisms for the regional changes: Ocean dynamics Gravitational forcing (fingerprints) Vertical land movement 3. Uncertainties in regional and local sea level projections 4. Conclusion

44 Global Regional Local AR5 IPCC, 2013 Cazenave and Llovel, 2010
45 Slangen et al., 2017 Processes contributing to sea level changes


46 Global Regional Local Fingerprints Tamisiea and Mitrovica, 2011
- dynamic sea-level change; (GLA)- glaciers ; (GRE)- Greenland ice sheet; (ANT)- Antarctic ice sheet; (LAN)- land-water storage; (GIA)- Glacial Isostatic Adjustment; (TECT)-")
47 Sea level in each grid point (SAL) - the impact of self-attraction and loading of the ocean upon itself; due to the long term alteration of ocean density changes; (STR)- globally averaged steric sea-level rise; (DSL)- dynamic sea-level change; (GLA)- glaciers ; (GRE)- Greenland ice sheet; (ANT)- Antarctic ice sheet; (LAN)- land-water storage; (GIA)- Glacial Isostatic Adjustment; (TECT)- tectonics; (NCLIM)- non-climatic land-motion Jackson and Jevrejeva, 2016
, c) Antarctica (Bamber & Riva, 2010) d) Land-water (Wada et al. 2012).")
48 Normalised pattern due to gravitational and Earth rotational effects a) Glaciers (Bamber & Riva, 2010), b) Greenland (Bamber & Riva, 2010), c) Antarctica (Bamber & Riva, 2010) d) Land-water (Wada et al. 2012). Jackson and Jevrejeva, 2016

49 Future contribution from cryosphere Jevrejeva et al., 2016

50 Ocean component (CMIP5) Jevrejeva et al., 2016
51 Model Number of realisations for RCP8.5 Reference bcc-csm1-1 1 Wu et al. (2010) bcc-csm1-1-m 1 Wu et al. (2010) CanESM2 5 Arora et al. (2011) CMCC-CESM 1 CMCC-CM 1 Scoccimarro et al. (2011) CMCC-CMS 1 CNRM-CM5 5 Voldoire et al. (2013) ACCESS1-0 1 BOM (2010) ACCESS1-3 1 BOM (2010) CSIRO-MK Rotstayn et al. (2010) EC-EARTH 12 Hazeleger et al. (2010) inmcm4 1 Volodin et al. (2010) IPSL-CM5A-LR 4 Dufresne et al. (2013) IPSL-CM5A-MR 1 Dufresne et al. (2013) IPSL-CM5B-LR 1 Dufresne et al. (2013) FGOALS-g2 1 Yongqiang et al. (2004) MIROC5* 3 Watanabe et al. (2010) MIROC-ESM 1 Watanabe et al. (2011) MIROC-ESM-CHEM 1 Watanabe et al. (2011) HadGEM2-CC 3 Martin et al. (2011) HadGEM2-ES 4 Collins et al. (2011) MPI-ESM-LR 3 Raddatz et al. (2007) MPI-ESM-MR 1 Raddatz et al. (2007) MRI-CGCM3 1 Yukimoto et al. (2001) GISS-E2-R* 3 Schmidt et al. (2006) CCSM4 6 Gent et al. (2011) NorESM1-M 1 Iversen et al. (2013) NorESM1-ME 1 Iversen et al. (2013) GFDL-ESM2G 1 Donner et al. (2011) GFDL-ESM2M 1 Donner et al. (2011) CESM1-BGC 1 Vertenstein et al. (2012) CESM1-CAM5 2 Vertenstein et al. (2012) CESM1-WACCM 3 Vertenstein et al. (2012) Total models 33 Total realisations 83 AOGSMs from CMIP5

52 Regional sea level projections with RCP8.5 by 2100 Global Regional Local Median Median 95% 95% Jevrejeva et al, 2016
53 Sea level rise with RCP8.5 along the coastlines Jevrejeva et al, 2016 Ratio of projected local (1 grid cells close to coastline) median and upper limit (50%/95%) sea level rise to global median sea level rise

54 Carson et al., 2016 Coastal sea level: RCP4.5
55 Sea level projections for Individual locations RCP8.5 Sea level projections by 2100 for the UK locations 5% 50% 95% 99% Grinsted et al, 2015 Belfast Newlyn Cardiff Edinburgh Liverpool Aberdeen London
56 Sea level rise for individual cities by 2100 (RCP8.5) 95% 50% Guangzhou Miami Maldives Jevrejeva et al, 2016
57 Uncertainties at individual locations (New York) Thermal expansion Greenland ice sheet Antarctica ice sheet Kopp et al, 2014 Earth's Future Volume 2, Issue 8, pages , 21 AUG 2014 DOI: /2014EF


58 Uncertainties in sea level projections Jevrejeva et al., 2016 global Kopp et al., 2014 Kopp et al., 2014 New York Jevrejeva et al., 2016 Earth's Future Volume 2, Issue 8, pages , 21 AUG 2014 DOI: /2014EF

59 Uncertainties due to GIA (Glacial Isostatic Adjustment) corrections ICE 5G- ICE 4G ICE 5G- ICE 3G ICE 5G- ICE 1 ICE 5G- KL05 Jevrejeva et al, 2014


60 King et al, 2012 Credits to Deltares
61 Sea level projections (median, 50%) without local vertical land movement Sea level projections (median, 50%) with local vertical land movement Top ten cities of each scenario listed in each panel are coloured whilst all other cities are plotted in grey

62 Probabilistic projections of extreme sea levels (sea level rise +waves+storm surges) Return period of the present day 100-year ESL under RCP4.5 and RCP8.5 in 2050 and 2100 Vousdoukas et al., 2018
 Vousdoukas et al.")
63 Probabilistic projections of extreme sea levels (sea level rise + waves + storm surges) Vousdoukas et al., 2018
64 Conclusion (regional and local sea level projections) 1. Sea level community is making a substantial progress in understanding of global and regional sea level rise and variability 1. The key uncertainties (global/regional/local) are a) emission scenarios b) contribution from ice sheets 3. The largest uncertainties in regional and local sea level projections associated with ocean dynamics and the vertical land movement 4. The main challenges for coast projections: AOGSMs do not have resolution, physical mechanisms, topography to resolve coastal processes on the shelf Semi-enclosed seas (e.g. Mediterranean) are not resolved in AOGSMs Decadal variability in ocean dynamics Local vertical land movement
65 The main challenges for coast projections (continue): 5. Probabilistic sea level projections in coastal areas is a valuable solution for the risk assessment and decision making about the adaptation. However, probabilistic approach (or conventional approach) do not consider interaction between the components. 6. Challenges: interaction between physical mechanisms (e.g. river runoff with waves, tides, rainfall, storm surges, sediment transport, erosion) is available for specific events or short term simulations. Combined effect on the coast is not quantified. 7. Impact of sea level rise in the coastal areas is already seen and every 10 cm by 2100 could result in additional global annual flood damages of US$ 1.5 trillion per year (0.25% of global GDP) without adaptation. For many countries (e.g. China, EU countries) >1% GDP for every 10 cm sea level rise. 8. The large part of the coast is not covered with observations (tide gauges, waves, vertical land movement), we urgently need a novel instruments.
66 Sea flood damage costs with the sea level rise by 2100 Global sea floods cost, Million US$ per year Global sea floods cost, % of GDP (global) Sea flood cost for China, % of GDP (China) 1.5 degree RCP8.5 RCP8.5J14 China, flood cost in 2100 US$ 3.4 trillion per year (5.8 % GDP) with warming of 1.5 degree (0. 5 m sea level rise) US$ 4.6 trillion per year (7.8% GDP) with RCP8.5 (0. 8 m sea level rise) US$ 8.5 trillion per year (14 % GDP) with RCP8.5J14 (1.8 m sea level rise) Jevrejeva et al., 2018
67 Sea flood damage costs with the sea level rise by 2100 Global sea flood cost, Million US$ per year Global sea flood cost, % of GDP (global) UK sea flood cost, % of UK GDP UK flood cost in 2100 US$ 241 billion per year (2.5 % UK GDP) with warming of 1.5 degree (0. 5 m sea level rise) US$ 619 billion per year (6.5% UK GDP) with RCP8.5 (0. 8 m sea level rise) US$ 1.1. trillion per year (11.1 % UK GDP) with RCP8.5J14 (1.8 m sea level rise) Jevrejeva et al., 2018
Significant anthropogenic-induced changes. of climate classes since 1950
 Significant anthropogenic-induced changes of climate classes since 95 (Supplementary Information) Duo Chan and Qigang Wu * School of Atmospheric Science, Nanjing University, Hankou Road #22, Nanjing, Jiangsu,
Desert Amplification in a Warming Climate
 Supporting Tables and Figures Desert Amplification in a Warming Climate Liming Zhou Department of Atmospheric and Environmental Sciences, SUNY at Albany, Albany, NY 12222, USA List of supporting tables
Supplemental Material
 Supplemental Material Copyright 2018 American Meteorological Society Permission to use figures, tables, and brief excerpts from this work in scientific and educational works is hereby granted provided
More extreme precipitation in the world s dry and wet regions
 More extreme precipitation in the world s dry and wet regions Markus G. Donat, Andrew L. Lowry, Lisa V. Alexander, Paul A. O Gorman, Nicola Maher Supplementary Table S1: CMIP5 simulations used in this
Anthropogenic forcing dominates global mean sea-level rise since 1970
 Anthropogenic forcing dominates global mean sea-level rise since 1970 Aimée B. A. Slangen 1,2 *, John A. Church 1, Cecile Agosta 3, Xavier Fettweis 3, Ben Marzeion 4 and Kristin Richter 5 1 CSIRO Oceans
Supplemental Material for
 Supplemental Material for Northern North Atlantic Sea Level in CMIP5 Climate Models: Evaluation of Mean State, Variability, and Trends against Altimetric Observations Kristin Richter, a Jan Even Øie Nilsen,
Early benefits of mitigation in risk of regional climate extremes
 In the format provided by the authors and unedited. DOI: 10.1038/NCLIMATE3259 Early benefits of mitigation in risk of regional climate extremes Andrew Ciavarella 1 *, Peter Stott 1,2 and Jason Lowe 1,3
Twenty-first-century projections of North Atlantic tropical storms from CMIP5 models
 SUPPLEMENTARY INFORMATION DOI: 10.1038/NCLIMATE1530 Twenty-first-century projections of North Atlantic tropical storms from CMIP5 models SUPPLEMENTARY FIGURE 1. Annual tropical Atlantic SST anomalies (top
Northern European Sea Level Rise. Aslak Grinsted Centre for Ice and Climate Niels Bohr Institute University of Copenhagen
 Northern European Sea Level Rise Aslak Grinsted Centre for Ice and Climate Niels Bohr Institute University of Copenhagen Global Sea Level Rise The world is warming and this causes sea level to rise because:
Supplement of Insignificant effect of climate change on winter haze pollution in Beijing
 Supplement of Atmos. Chem. Phys., 18, 17489 17496, 2018 https://doi.org/10.5194/acp-18-17489-2018-supplement Author(s) 2018. This work is distributed under the Creative Commons Attribution 4.0 License.
Understanding the regional pattern of projected future changes in extreme precipitation
 In the format provided by the authors and unedited. Understanding the regional pattern of projected future changes in extreme precipitation S. Pfahl 1 *,P.A.O Gorman 2 and E. M. Fischer 1 Changes in extreme
Sea-level change: A scientific and societal challenge for the 21 st century John Church International GNSS Service Workshop, Sydney, Feb 11, 2016
 Sea-level change: A scientific and societal challenge for the 21 st century John Church International GNSS Service Workshop, Sydney, Feb 11, 2016 OCEANS AND ATMOSPHERE NATIONAL RESEARCH FLAGSHIP Our coastal
Reconciling the Observed and Modeled Southern Hemisphere Circulation Response to Volcanic Eruptions Supplemental Material
 JOURNAL OF GEOPHYSICAL RESEARCH, VOL.???, XXXX, DOI:10.1002/, 1 2 3 Reconciling the Observed and Modeled Southern Hemisphere Circulation Response to Volcanic Eruptions Supplemental Material Marie C. McGraw
Drylands face potential threat under 2 C global warming target
 In the format provided by the authors and unedited. SUPPLEMENTARY INFORMATION DOI: 10.1038/NCLIMATE3275 Drylands face potential threat under 2 C global warming target Jianping Huang 1 *, Haipeng Yu 1,
S16. ASSESSING THE CONTRIBUTIONS OF EAST AFRICAN AND WEST PACIFIC WARMING TO THE 2014 BOREAL SPRING EAST AFRICAN DROUGHT
 S6. ASSESSING THE CONTRIBUTIONS OF EAST AFRICAN AND WEST PACIFIC WARMING TO THE 204 BOREAL SPRING EAST AFRICAN DROUGHT Chris Funk, Shraddhanand Shukla, Andy Hoell, and Ben Livneh This document is a supplement
Future freshwater stress for island populations
 Future freshwater stress for island populations Kristopher B. Karnauskas, Jeffrey P. Donnelly and Kevin J. Anchukaitis Summary: Top left: Overview map of the four island stations located in the U.S. state
Supplementary Figure 1 Current and future distribution of temperate drylands. (a b-f b-f
 Supplementary Figure 1 Current and future distribution of temperate drylands. (a) Five temperate dryland regions with their current extent for 1980-2010 (green): (b) South America; (c) North America; (d)
Robust Arctic sea-ice influence on the frequent Eurasian cold winters in past decades
 SUPPLEMENTARY INFORMATION DOI: 10.1038/NGEO2277 Robust Arctic sea-ice influence on the frequent Eurasian cold winters in past decades Masato Mori 1*, Masahiro Watanabe 1, Hideo Shiogama 2, Jun Inoue 3,
Anthropogenic forcing fingerprint on the tropical Pacific sea level trend pattern from the CMIP5 simulations of the XXI st century
 Anthropogenic forcing fingerprint on the tropical Pacific sea level trend pattern from the CMIP5 simulations of the XXI st century Benoît t Meyssignac 1, David Salas y Melia Anny Cazenave 1 1 LEGOS, CNRM/Météo
Beyond IPCC plots. Ben Sanderson
 Beyond IPCC plots Ben Sanderson What assumptions are we making? The Chain of Uncertainty: Heat waves Future Emissions Global Climate Sensitivity Regional Feedbacks Random variability Heat wave frequency
SUPPLEMENTARY INFORMATION
 doi:10.1038/nature11576 1. Trend patterns of SST and near-surface air temperature Bucket SST and NMAT have a similar trend pattern particularly in the equatorial Indo- Pacific (Fig. S1), featuring a reduced
Sea level projections with semiempirical and earth system models
 Sea level projections with semiempirical and earth system models John C. Moore College of Global Change and Earth System Science, Beijing Normal University, Beijing, China and Arctic Centre, University
Snow occurrence changes over the central and eastern United States under future. warming scenarios
 Snow occurrence changes over the central and eastern United States under future warming scenarios Liang Ning 1,2,3* and Raymond S. Bradley 2 1 Key Laboratory of Virtual Geographic Environment of Ministry
Supplementary Figure 1 A figure of changing surface air temperature and top-1m soil moisture: (A) Annual mean surface air temperature, and (B) top
 Annual mean surface air temperature, and (B) top") Supplementary Figure 1 A figure of changing surface air temperature and top-1m soil moisture: (A) Annual mean surface air temperature, and (B) top 1-m soil moisture averaged over California from CESM1.
Supplementary Figure 1 A figure of changing surface air temperature and top-1m soil moisture: (A) Annual mean surface air temperature, and (B) top 1-m soil moisture averaged over California from CESM1.
ASSESSING FUTURE EXPOSURE: GLOBAL AND REGIONAL SEA LEVEL RISE SCENARIOS FOR THE UNITED STATES
 ASSESSING FUTURE EXPOSURE: GLOBAL AND REGIONAL SEA LEVEL RISE SCENARIOS FOR THE UNITED STATES Chesapeake Bay Program Climate Resiliency Workgroup Conference Call May 15, 2017 William Sweet NOAA CO-OPS
Supporting Information for Relation of the double-itcz bias to the atmospheric energy budget in climate models
 GEOPHYSICAL RESEARCH LETTERS Supporting Information for Relation of the double-itcz bias to the atmospheric energy budget in climate models Ori Adam 1, Tapio Schneider 1,2, Florent Brient 1, and Tobias
The importance of ENSO phase during volcanic eruptions for detection and attribution
 Geophysical Research Letters Supporting Information for The importance of ENSO phase during volcanic eruptions for detection and attribution Flavio Lehner 1, Andrew P. Schurer 2, Gabriele C. Hegerl 2,
Supplemental material
 Supplemental material The multivariate bias correction algorithm presented by Bürger et al. (2011) is based on a linear transformation that is specified in terms of the observed and climate model multivariate
Sea level change recent past, present, future
 Sea level change recent past, present, future Anny Cazenave LEGOS-CNES Toulouse, France CCI_Colocation meeting, ESA/ESRIN Global mean sea level rise during the 20 th century (red : tide gauges; blue :
On the ability of CMIP3 and CMIP5 models in representing Caribbean current climate
 On the ability of CMIP3 and CMIP5 models in representing Caribbean current climate Sullyandro Oliveira Guimarães sullyandro@gmail.com Alexandre Araújo Costa Domingo Cassain Sales Universidade Estadual
SUPPLEMENTARY INFORMATION
 In the format provided by the authors and unedited. SUPPLEMENTARY INFORMATION DOI: 10.1038/NGEO2988 Hemispheric climate shifts driven by anthropogenic aerosol-cloud interactions Eui-Seok Chung and Brian
Global Warming Attenuates the. Tropical Atlantic-Pacific Teleconnection
 1 2 3 4 5 6 7 8 9 10 11 12 13 14 15 16 17 18 19 20 21 22 23 24 25 26 27 28 Supplementary Information for Global Warming Attenuates the Tropical Atlantic-Pacific Teleconnection Fan Jia 1, Lixin Wu 2*, Bolan
The Implication of Ural Blocking on the East Asian Winter Climate in CMIP5 Models
 The Implication of Ural Blocking on the East Asian Winter Climate in CMIP5 Models Hoffman H. N. Cheung, Wen Zhou (hncheung-c@my.cityu.edu.hk) City University of Hong Kong Shenzhen Institute Guy Carpenter
What we know about regional sea level rise and how we are affected by variations from the global mean
 regional sea level rise and variations from the global Magnus Hieronymus 2018 Regional and Global Sea level Global Density change: thermosteric Regional Density change: thermosteric+ halosteric Land Ice
Supplementary Figure 1 Observed change in wind and vertical motion. Anomalies are regime differences between periods and obtained
 Supplementary Figure 1 Observed change in wind and vertical motion. Anomalies are regime differences between periods 1999 2013 and 1979 1998 obtained from ERA-interim. Vectors are horizontal wind at 850
Supplementary Figure 1: Time series of 48 N AMOC maximum from six model historical simulations based on different models. For each model, the wavelet
 Supplementary Figure 1: Time series of 48 N AMOC maximum from six model historical simulations based on different models. For each model, the wavelet analysis of AMOC is also shown; bold contours mark
Changes in the El Nino s spatial structure under global warming. Sang-Wook Yeh Hanyang University, Korea
 Changes in the El Nino s spatial structure under global warming Sang-Wook Yeh Hanyang University, Korea Changes in El Nino spatial structure Yeh et al. (2009) McPhaden et al. (2009) Why the spatial structure
Oceans and Climate. Caroline Katsman. KNMI Global Climate Division
 Oceans and Climate Caroline Katsman KNMI Global Climate Division Aimée Slangen, Roderik van de Wal (IMAU, Utrecht University) Sybren Drijfhout, Wilco Hazeleger (KNMI, Global Climate) Bert Vermeersen (NIOZ/Delft
Research Article Detecting Warming Hiatus Periods in CMIP5 Climate Model Projections
 International Atmospheric Sciences Volume 6, Article ID 9657659, 7 pages http://dx.doi.org/.55/6/9657659 Research Article Detecting Warming Hiatus Periods in CMIP5 Climate Model Projections Tony W. Li
The Response of ENSO Events to Higher CO 2 Forcing: Role of Nonlinearity De-Zheng Sun, Jiabing Shuai, and Shao Sun
 The Response of ENSO Events to Higher CO 2 Forcing: Role of Nonlinearity De-Zheng Sun, Jiabing Shuai, and Shao Sun CIRES, University of Colorado & Earth System Research Laboratory, NOAA http://www.esrl.noaa.gov/psd/people/dezheng.sun/
Introduction to Climate Projections and Analysis
 Introduction to Climate Projections and Analysis Jack Katzfey, CSIRO Oceans and Atmosphere 1 June 2016 The project is being implemented by the Asian Development Bank through the technical assistance (TA
Sea level change around the Philippines
 Sea level Sea level around the Philippines Institute of Environmental Science for Social Change (ESSC) Conference on Internal Migration and Displacement Davao City, Philippines 20 May 2012 Regional How
APPENDIX A: ABSOLUTE SEA LEVEL METHODS AND PROJECTION TABLES
 APPENDIX A: ABSOLUTE SEA LEVEL METHODS AND PROJECTION TABLES As described in the main body of this report, absolute sea level projections were developed using a slightly modified approach from Kopp et
NetCDF, NCAR s climate model data, and the IPCC. Gary Strand NCAR/NESL/CGD
 NetCDF, NCAR s climate model data, and the IPCC Gary Strand NCAR/NESL/CGD NCAR s climate model data A bit of history... 1960s - 1990s Self-designed self-implemented binary formats 1990s-2000s netcdf-3
Paul W. Stackhouse, Jr., NASA Langley Research Center
 An Assessment of Actual and Potential Building Climate Zone Change and Variability From the Last 30 Years Through 2100 Using NASA s MERRA and CMIP5 Simulations Paul W. Stackhouse, Jr., NASA Langley Research
Recent Walker circulation strengthening and Pacific cooling amplified by Atlantic warming
 SUPPLEMENTARY INFORMATION DOI: 1.18/NCLIMATE2 Recent Walker circulation strengthening and Pacific cooling amplified by Atlantic warming Shayne McGregor, Axel Timmermann, Malte F. Stuecker, Matthew H. England,
BREA Final Results Forum Results from the Canadian Centre for Climate Modelling and Analysis
 BREA Final Results Forum Results from the Canadian Centre for Climate Modelling and Analysis Gregory M. Flato (PI), W. Merryfield, W.S. Lee, M. Sigmond, B. Pal, C. Reader Project Title: FORECASTING OCEAN
Contents of this file
 Geophysical Research Letters Supporting Information for Predictability of the Recent Slowdown and Subsequent Recovery of Large-Scale Surface Warming using Statistical Methods Michael E. Mann 1, Byron A.
Projecting regional sea-level changes for the 21 st century
 Projecting regional sea-level changes for the 21 st century Aimée Slangen In collaboration with Mark Carson (CEN Hamburg), Caroline Katsman (KNMI), Roderik van de Wal (IMAU), Armin Köhl (CEN Hamburg),
INVESTIGATING THE SIMULATIONS OF HYDROLOGICAL and ENERGY CYCLES OF IPCC GCMS OVER THE CONGO AND UPPER BLUE NILE BASINS
 INVESTIGATING THE SIMULATIONS OF HYDROLOGICAL and ENERGY CYCLES OF IPCC GCMS OVER THE CONGO AND UPPER BLUE NILE BASINS Mohamed Siam, and Elfatih A. B. Eltahir. Civil & Environmental Engineering Department,
Supplementary Information for Impacts of a warming marginal sea on torrential rainfall organized under the Asian summer monsoon
 1 2 3 4 5 6 7 8 9 10 11 Supplementary Information for Impacts of a warming marginal sea on torrential rainfall organized under the Asian summer monsoon 12 13 14 Atsuyoshi Manda 1, Hisashi Nakamura 2,4,
Evaluation of CMIP5 Simulated Clouds and TOA Radiation Budgets in the SMLs Using NASA Satellite Observations
 Evaluation of CMIP5 Simulated Clouds and TOA Radiation Budgets in the SMLs Using NASA Satellite Observations Erica K. Dolinar Xiquan Dong and Baike Xi University of North Dakota This talk is based on Dolinar
Century to multi-century sea level rise projections from CMIP5 models
 GEOPHYSICAL RESEARCH LETTERS, VOL. 39,, doi:10.1029/2012gl052947, 2012 Century to multi-century sea level rise projections from CMIP5 models Jianjun Yin 1 Received 28 June 2012; revised 5 August 2012;
Water Stress, Droughts under Changing Climate
 Water Stress, Droughts under Changing Climate Professor A.K.M. Saiful Islam Institute of Water and Flood Management Bangladesh University of Engineering and Technology (BUET) Outline of the presentation
Sea Level Rise in Connecticut A Risk-Informed Approach
 GZA GeoEnvironmental, Inc. CAFM Conference October 25, 2017 Proactive By Design. Our Company Commitment Proactive By Design. Our Company Commitment Sea Level Rise in Connecticut A Risk-Informed Approach
Understanding and projecting sea level change: improvements and uncertainties
 Understanding and projecting sea level change: improvements and uncertainties Jonathan Gregory On behalf of all the lead authors of Chapter 13, Sea level change John Church, Peter Clark, Anny Cazenave,
The final push to extreme El Ninõ
 The final push to extreme El Ninõ Why is ENSO asymmetry underestimated in climate model simulations? WonMoo Kim* and Wenju Cai CSIRO Marine and Atmospheric Research *Current Affiliation: CCCPR, Ewha Womans
Estimating sea level rise for Vietnam East Sea
 Estimating sea level rise for Vietnam East Sea Thuc Tran 1*, Xuan Hien Nguyen 1, Thi Lan Huong Huynh 1, Van Tra Tran 1, 2, Ngoc Tien Duong 1, Thi Thu Ha Doan 1 1 Vietnam Institute of Meteorology, Hydrology
9.7 Climate Sensitivity and Climate Feedbacks
 Evaluation of Models Chapter precipitation projections was explained by the differences in global model boundary conditions, although much of the spread in projected summer precipitation was explained
Sea Level. John Church WCRP Antarctic Climate and Ecosystems CRC Centre for Australian Weather and Climate Research
 Sea Level John Church WCRP Antarctic Climate and Ecosystems CRC Centre for Australian Weather and Climate Research Sea level rose by more than 120 m since the last glacial maximum 2 Church et al., 2008
Maritime Continent seasonal climate biases in AMIP experiments of the CMIP5 multimodel ensemble
 Clim Dyn DOI 10.1007/s00382-017-3641-x Maritime Continent seasonal climate biases in AMIP experiments of the CMIP5 multimodel ensemble Ying Ying Toh 1,2 Andrew G. Turner 1,3 Stephanie J. Johnson 1,3,4
PROCESSES CONTRIBUTING TO THE GLOBAL SEA LEVEL CHANGE
 Second Split Workshop in Atmospheric Physics and Oceanography PROCESSES CONTRIBUTING TO THE GLOBAL SEA LEVEL CHANGE Student: Maristella Berta Mentor: Prof. Stjepan Marcelja Split, 24 May 2010 INTRODUCTION
Projected strengthening of Amazonian dry season by constrained climate model simulations
 SUPPLEMENTARY INFORMATION DOI: 10.1038/NCLIMATE2658 Projected strengthening of Amazonian dry season by constrained climate model simulations Juan P. Boisier, Philippe Ciais, Agnès Ducharne and Matthieu
Climate Change Scenario, Climate Model and Future Climate Projection
 Training on Concept of Climate Change: Impacts, Vulnerability, Adaptation and Mitigation 6 th December 2016, CEGIS, Dhaka Climate Change Scenario, Climate Model and Future Climate Projection A.K.M. Saiful
An Assessment of IPCC 20th Century Climate Simulations Using the 15-year Sea Level Record from Altimetry Eric Leuliette, Steve Nerem, and Thomas Jakub
 An Assessment of IPCC 20th Century Climate Simulations Using the 15-year Sea Level Record from Altimetry Eric Leuliette, Steve Nerem, and Thomas Jakub Colorado Center for Astrodynamics Research and Department
Future sea level rise through 2100 and beyond
 Future sea level rise through 2100 and beyond Emma Stone Uncertain World Summit (Tuesday 20 October 2015) 1 Why are we interested in future sea level rise? How certain are we about the worst case scenario
Fewer large waves projected for eastern Australia due to decreasing storminess
 SUPPLEMENTARY INFORMATION DOI: 0.08/NCLIMATE Fewer large waves projected for eastern Australia due to decreasing storminess 6 7 8 9 0 6 7 8 9 0 Details of the wave observations The locations of the five
Karonga Climate Profile: Full Technical Version
 Karonga Climate Profile: Full Technical Version Prepared by: University of Cape Town November 2017 For enquiries regarding this Climate Profile, please contact Lisa van Aardenne (lisa@csag.uct.ac.za) or
Update on Cordex-AustralAsia domain
 Update on Cordex-AustralAsia domain J. Katzfey (CSIRO) Australia with contributions from J. Evans (UNSW) Bertrand Timbal (BoM) and others The Centre for Australian Weather and Climate Research A partnership
A revival of Indian summer monsoon rainfall since 2002
 In the format provided by the authors and unedited. SUPPLEMENTARY INFORMATION DOI: 10.1038/NCLIMATE3348 A revival of Indian summer monsoon rainfall since 2002 Qinjian Jin and Chien Wang* Center for Global
Regional and global trends
 SEA LEVEL RISE Regional and global trends OCEANOBS 2009 Plenary Paper A.Cazenave D. Chambers, P. Cipollini, J. Hurell, S. Nerem, L.L. Fu, H.P. Plag, C.K. Shum, J. Willis Venice, September 2009 Global mean
John A. Church, Kathleen L. McInnes, Didier Monselesan and Julian O Grady. 28 June 2016 Report for NCCARF
 Interpretation material to accompany SLR and allowance data for coastal councils around Sea-Level Rise and Allowances for Coastal Councils around Australia Guidance Material John A. Church, Kathleen L.
Prolog. Processes Causing Regional Sea Level Change
 Prolog Regional Variability: Causes for contemporary Regional Sea Level Changes Detlef fstammer Center für Erdsystemforschung und Nachhaltigkeit (CEN) Universität Hamburg Sea level is one of the climate
Projecting the uncertainty of sea level rise using climate models and statistical downscaling!
 Projecting the uncertainty of sea level rise using climate models and statistical downscaling! Peter Guttorp! Norsk Regnesentral! University of Washington! Outline! The importance of sea level rise! Measuring
Identifying the most extreme storms for wave impact at the UK coast
 SUCCESS K/O Feb 2017 Identifying the most extreme storms for wave impact at the UK coast JUDITH WOLF & LUCY BRICHENO NATIONAL OCEANOGRAPHY CENTRE, LIVERPOOL, UK WAVES, STORM SURGES AND COASTAL HAZARDS,
Ecole d Eté Altimétrie spatiale. Sea level variations at climatic time scales: observations & causes. Benoit Meyssignac
 Ecole d Eté 2014 Altimétrie spatiale Sea level variations at climatic time scales: observations & causes Benoit Meyssignac 1 Ecole d Eté 2014, Saint-Pierre d Oléron, 1-5 septembre 2014 Echelles climatiques
Model projections of Centuryscale change in Extreme Sea- Level for UKCP09 and UKCP18
 Model projections of Centuryscale change in Extreme Sea- Level for UKCP09 and UKCP18 SL SpaceWatch workshop 2016 03 22 Tom Howard, Matt Palmer, Jon Tinker, Jason Lowe,. Contents Overview of UKCP18 Marine
Future Sea Level Rise and its Implications for SIDS and LDCs
 Future Sea Level Rise and its Implications for SIDS and LDCs Bill Hare, Michiel Schaeffer, Mahé Perrette, Matthias Mengel COP17, Durban, 2 nd December Overview Part 1: Global sea level: past and future
Projecting regional sea-level changes for the 21 st century
 Projecting regional sea-level changes for the 21 st century Aimée Slangen Postdoctoral research fellow In collaboration with: Mark Carson (CEN Hamburg), Caroline Katsman (KNMI), Roderik van de Wal (IMAU),
Physical Dynamics of the Coastal Zone in the Mediterranean on Annual to Decadal Scales
 Physical Dynamics of the Coastal Zone in the Mediterranean on Annual to Decadal Scales Hans-Peter Plag Nevada Bureau of Mines and Geology and Seismological Laboratory University of Nevada, Reno, Nevada,
SUPPLEMENTARY INFORMATION
 SUPPLEMENTARY INFORMATION DOI: 10.1038/NGEO2517 Two distinct influences of Arctic warming on cold winters over North America and East Asia Jong-Seong Kug 1, Jee-Hoon Jeong 2*, Yeon-Soo Jang 1, Baek-Min
Climate Impacts Projections
 Climate Impacts Projections Guillaume Mauger Climate Impacts Group University of Washington David Rupp Oregon Climate Change Research Institute University of Oregon Climate Science in the Public Interest
Sea Level Rise and Coastal Inundation Thursday 11 th October, 2012, 1.00pm, With lunch in the Legislative Council Committee Room
 The Presiding Officers invite Parliamentarians and Staff to a Science Briefing on Sea Level Rise and Coastal Inundation Thursday 11 th October, 2012, 1.00pm, With lunch in the Legislative Council Committee
>200 LWP+IWP (g m 2 )
") Frequency (%) 1 9 8 7 6 5 4 3 2 CMIP5 RCM OBS SATELLITE RACMO2.3 CCSM4 CESM1_CAM4 CESM1_CAM5 CMCC CNRM CanESM2 GFDL_CM2.1 GFDL_CM3 GISS HadGEM2 IPSL_CM5A IPSL_CM5B MPI ESM NorESM1 bcc csm1 inmcm4 CMIP5
Frequency (%) 1 9 8 7 6 5 4 3 2 CMIP5 RCM OBS SATELLITE RACMO2.3 CCSM4 CESM1_CAM4 CESM1_CAM5 CMCC CNRM CanESM2 GFDL_CM2.1 GFDL_CM3 GISS HadGEM2 IPSL_CM5A IPSL_CM5B MPI ESM NorESM1 bcc csm1 inmcm4 CMIP5
High-resolution (10km) ensemble regional climate projections for SE Asia
 ensemble regional climate projections for SE Asia") High-resolution (10km) ensemble regional climate projections for SE Asia Jack Katzfey, CSIRO Oceans and Atmosphere May 2016 Kim NGUYEN, John MCGREGOR, Peter HOFFMANN, Suppiah RAMASAMY, Tim ERWIN, John
High-resolution (10km) ensemble regional climate projections for SE Asia Jack Katzfey, CSIRO Oceans and Atmosphere May 2016 Kim NGUYEN, John MCGREGOR, Peter HOFFMANN, Suppiah RAMASAMY, Tim ERWIN, John
Projection Results from the CORDEX Africa Domain
 Projection Results from the CORDEX Africa Domain Patrick Samuelsson Rossby Centre, SMHI patrick.samuelsson@smhi.se Based on presentations by Grigory Nikulin and Erik Kjellström CORDEX domains over Arab
On-Line Supplementary Material IPCC WGII AR5 Chapter 30
 Tables Table SM30-1: Table SM30-2: Table SM30-3: Table SM30-4: Percentage area of the Ocean, average primary productivity (SEAWiFS: 4 Sep 1997 30 Nov 2010) and fisheries productivity of key ocean sub-regions
Decreased monsoon precipitation in the Northern Hemisphere due to anthropogenic aerosols
 Decreased monsoon precipitation in the Northern Hemisphere due to anthropogenic aerosols Article Supplemental Material Polson, D., Bollasina, M., Hegerl, G. C. and Wilcox, L. J. (214) Decreased monsoon
SUPPLEMENTARY INFORMATION
 SUPPLEMENTARY INFORMATION DOI: 10.1038/NGEO1189 Different magnitudes of projected subsurface ocean warming around Greenland and Antarctica Jianjun Yin 1*, Jonathan T. Overpeck 1, Stephen M. Griffies 2,
Supporting Information for. [Strong dependence of U.S. summertime air quality on the decadal variability of Atlantic sea surface temperatures]
![Supporting Information for. [Strong dependence of U.S. summertime air quality on the decadal variability of Atlantic sea surface temperatures]](/thumbs/90/104348172.jpg "Supporting Information for. [Strong dependence of U.S. summertime air quality on the decadal variability of Atlantic sea surface temperatures]") [Geophysical Research Letter] Supporting Information for [Strong dependence of U.S. summertime air quality on the decadal variability of Atlantic sea surface temperatures] [L. Shen 1, L. J. Mickley 1,
[Geophysical Research Letter] Supporting Information for [Strong dependence of U.S. summertime air quality on the decadal variability of Atlantic sea surface temperatures] [L. Shen 1, L. J. Mickley 1,
SUPPLEMENTARY INFORMATION
 SUPPLEMENTARY INFORMATION DOI: 1.138/NGEO1799 Robust direct effect of carbon dioxide on tropical circulation and regional precipitation Sandrine Bony 1,, Gilles Bellon 2, Daniel Klocke 3, Steven Sherwood
Evaluation of the Global Climate Models in the CMIP5 over the Tibetan Plateau
 15 MAY 2013 S U E T A L. 3187 Evaluation of the Global Climate Models in the CMIP5 over the Tibetan Plateau FENGGE SU Key Laboratory of Tibetan Environment Changes and Land Surface Processes, Institute
Evalua&on, applica&on and development of ESM in China
 Evalua&on, applica&on and development of ESM in China Contributors: Bin Wang 1,2 1. LASG, Ins&tute of Atmospheric Physics, CAS 2. CESS, Tsinghua University 3. Beijing Normal University 4. Beijing Climate
SUPPLEMENTARY INFORMATION
 SUPPLEMENTARY INFORMATION DOI:.8/NCLIMATE76 Supplementary information for Changes in South Pacific rainfall bands in a warming climate Matthew J. Widlansky, Axel Timmermann,, Karl Stein, Shayne McGregor,
Unified Sea Level Rise Projections in Practice
 Unified Sea Level Rise Projections in Practice Jayantha Obeysekera, PhD, PE, D.WRE Chief Modeler, SFWMD South Florida Hydrologic Society Meeting, January 27, 2016 Outline Unified Sea Level Rise Projections
Low-level wind, moisture, and precipitation relationships near the South Pacific Convergence Zone in CMIP3/CMIP5 models
 Low-level wind, moisture, and precipitation relationships near the South Pacific Convergence Zone in CMIP3/CMIP5 models Matthew J. Niznik and Benjamin R. Lintner Rutgers University 25 April 2012 niznik@envsci.rutgers.edu
Intensification of landfalling typhoons over the northwest Pacific since the late 1970s
 SUPPLEMENTARY INFORMATION DOI:.8/NGEO79 Intensifiation of landfalling typhoons over the northwest Paifi sine the late 97s Wei Mei and Shang-Ping Xie Supplementary Figures Lifetime peak intensity (m/s)
Aspects of a climate observing system: energy and water. Kevin E Trenberth NCAR
 Aspects of a climate observing system: energy and water Kevin E Trenberth NCAR Tracking Earth s Global Energy Where has global warming from increased GHGs gone? Kevin E Trenberth NCAR Where did the heat
Potential Impacts of Climate Change on Precipitation over Lake Victoria, East Africa, in the 21st Century
 Water 4, 6, 64-659; doi:.9/w6964 Article OPEN ACCESS water ISSN 7-444 www.mdpi.com/journal/water Potential Impacts of Climate Change on Precipitation over Lake Victoria, East Africa, in the st Century
Projection of global and regional sea level change for the 21st century
 Projection of global and regional sea level change for the 21st century Jonathan Gregory 1,2 1 NCAS-Climate, University of Reading 2 Met Office Hadley Centre, Exeter Global mean sea level rise observed