SEISMIC TOMOGRAPHY CONSTRAINTS ON RECONSTRUCTING THE PHILIPPINE SEA PLATE AND ITS MARGIN
|
|
|
- Colin Strickland
- 6 years ago
- Views:
Transcription
1 SEISMIC TOMOGRAPHY CONSTRAINTS ON RECONSTRUCTING THE PHILIPPINE SEA PLATE AND ITS MARGIN A Dissertation by LINA HANDAYANI Submitted to the Office of Graduate Studies of Texas A&M University in partial fulfillment of the requirements for the degree of DOCTOR OF PHILOSOPHY December 2004 Major Subject: Geophysics
2 SEISMIC TOMOGRAPHY CONSTRAINTS ON RECONSTRUCTING THE PHILIPPINE SEA PLATE AND ITS MARGIN A Dissertation by LINA HANDAYANI Submitted to Texas A&M University in partial fulfillment of the requirements for the degree of DOCTOR OF PHILOSOPHY Approved as to style and content by: Thomas W. C. Hilde (Chair of Committee) Mark E. Everett (Member) Richard L. Gibson (Member) David W. Sparks (Member) William R. Bryant (Member) Richard L. Carlson (Head of Department) December 2004 Major Subject: Geophysics
3 iii ABSTRACT Seismic Tomography Constraints on Reconstructing the Philippine Sea Plate and Its Margin. (December 2004) Lina Handayani, B.S., Institut Teknologi Bandung; M.S., Texas A&M University Chair of Advisory Committee: Dr. Thomas W.C. Hilde The Philippine Sea Plate has been surrounded by subduction zones throughout Cenozoic time due to the convergence of the Eurasian, Pacific and Indian-Australian plates. Existing Philippine Sea Plate reconstructions have been made based primarily on magnetic lineations produced by seafloor spreading, rock magnetism and geology of the Philippine Sea Plate. This dissertation employs seismic tomography model to constraint the reconstruction of the Philippine Sea Plate. Recent seismic tomography studies show the distribution of high velocity anomalies in the mantle of the Western Pacific, and that they represent subducted slabs. Using these recent tomography data, distribution maps of subducted slabs in the mantle beneath and surrounding the Philippine Sea Plate have been constructed which show that the mantle anomalies can be related to the various subduction zones bounding the Philippine Sea Plate. The high velocity mantle anomalies are clearly coincident with Wadati- Benioff zones in the upper mantle. The lower mantle anomalies, although distributed in the transition zone ( km) as stagnant slabs in some cases, can clearly be
4 iv mapped as continuations of upper mantle subduction zones. Reconstructing the subduction of the slabs now in the mantle best fits Philippine Sea Plate reconstructions that involve the minimal or simplest rotations. Northward movement of the Philippine Sea Plate, WNW subduction of the Pacific Plate since Eocene time (~50 Ma), and northward subduction of the Indian/Australian Plate along Indonesia best explain the subducted slab mantle anomalies. The origin of the eastern plate boundary was a transform zone that evolved into a subduction zone a few million years before the Pacific Plate changed its movement. In addition, the initiation of this subduction zone might possibly be one of the triggers of the Pacific Plate motion changes. The 90 o rotation of the Philippine Sea Plate including southward plate subduction at its northern boundary proposed in the reconstruction by Hall (2002) is not supported by seismic tomography evidence for slab distribution in the mantle beneath the Philippine Sea region. A hypothesis of minimal rotation of the Philippine Sea Plate, supported by the seismic tomography, guides the reconstruction model presented.
5 v ACKNOWLEDGEMENTS I would like to express my sincere thanks to Dr. Thomas Hilde, chairman of my advisory committee, for his expert guidance and unceasing support throughout all stages of this study. I am also grateful to the other members of my committee: Dr. Mark Everett, Dr. David Sparks, Dr. Rick Gibson, and Dr. William Bryant, for all suggestions and critical reviews during the course of this research. I benefited from the fruitful discussion with Dr. Sparks on the mantle and subducting slab properties, with Dr. Everett and Dr. Gibson on the basic of seismology and seismic tomography in particular. I am deeply indebted to Dr. Sri Widiyantoro from the Department of Geophysics and Meteorology, Institut Teknologi Bandung, for the tomography model he has provided, without which my work is not possible. I would also like to thank the Department of Geology and Geophysics of Texas A&M University for the financial support I received since the start of my doctorate study until the end of my stay through the teaching assistantship and several fellowships. I could not go through this process without the never ending support and encouragement from my dear husband and the endless love and patience of my daughters that has brightened my way through.
6 vi TABLE OF CONTENTS Page ABSTRACT... ACKNOWLEDGEMENTS... TABLE OF CONTENTS... LIST OF FIGURES... LIST OF TABLES... iii v vi viii xi CHAPTER I INTRODUCTION... 1 Background... 1 Motivation... 3 Research Objective... 5 II PREVIOUS STUDIES... 7 Tectonic Setting... 7 Previous Reconstructions Seismic Tomography in Geodynamic Studies Geoid Anomalies over the Philippine Sea Plate III TOMOGRAPHY DATA ANALYSIS Tomography Models Cross Sections of Slab Images Japan Subduction Zone Izu-Bonin Subduction Zone Ryukyu Subduction Zone Mariana Subduction Zone Philippine Subduction Zone Java Subduction Zone Others Shallow Subducting Slab... 46
7 vii CHAPTER Page Tomography and Seismicity Maps Three Dimensional Slab Models Subducted Slab Distribution Map IV SUBDUCTED SLAB ANALYSIS Phase Change Rheological Structure of Subducted Slabs Trench Migration Horizontal Mantle Flow Density Distribution Sinking Rate of Descending Slab V SUBDUCTED SLABS BENEATH THE PHILIPPINE SEA PLATE 72 The Age of Subducted Slabs Relocation of Past Subduction Zones VI DISCUSSION Tomography Constraints and Tectonic Implications Philippine Sea Plate Rotation Pacific Plate and Indian-Australian Plate Subduction Izu-Bonin Mariana Subduction Zone Philippine Subduction Zone and Southern Philippine Sea Plate Reconstruction Reconstruction at 55 Ma Reconstruction at 40 Ma Reconstruction at 30 Ma Reconstruction at 25 Ma Reconstruction at 15 Ma Reconstruction at 5 Ma Present Tectonics VII CONCLUSIONS REFERENCES VITA
8 viii LIST OF FIGURES FIGURE Page 2.1 Main tectonic features of the Western Pacific region Magnetic lineations Evolution of Shikoku and Parece-Vela Basins Reconstruction based on the transform fault origin Hall s proposed positions of Philippine Sea Plate from 50 to 20 Ma Philippine Sea Plate reconstruction from Seno & Maruyama Map showing the age and location of subducted slabs in a hotspot reference frame during the past 120 my Western Pacific geoid map from altimetry The distribution of seismic stations and earthquake foci S wave map for km deep Locations of the cross sections of slab images Seismic tomography cross sections of WEPP P-wave seismic tomography cross sections across Japan (C), Izu-Bonin(D), Mariana (E) and Java (F) Tomography cross sections 1 to Seismicity of the Western Pacific region The P-wave velocity perturbation and seismicity maps The S-wave velocity perturbation and seismicity maps... 49
9 ix FIGURE Page 3.10 The 3-D view of the velocity perturbation at the Western Pacific region based on the P-wave model The 3-D view of the velocity perturbation at the Western Pacific region based on the S-wave model Subducted slab distribution map The thermal structure of descending slab Corn syrup experiment Christensen s numerical modeling Density distribution calculated from seismic velocity perturbation A sketch for calculating the depth of a subducting slab Sinking rate model An illustration of a subducting slab with trench rollback Subducted slab distributions with their approximate ages Possible past locations of subduction zones The passage of the subduction zone in Hall s reconstruction Trench migrations along the western part of the Pacific Plate based on the fixed hotspot model A sketch of Pacific Plate movement Illustration of the difference in evolution of the Izu-Bonin and Mariana subducting slabs Relative convergence rate around the Philippine Sea Plate
10 x FIGURE Page 6.6 Reconstruction at 55 Ma The relationship between duration of spreading in the West Philippine Basin and known backarc basins and proximity to subduction zones Perpendicular section of the transform fault before (A) and after (B) the initiation of subduction Reconstruction at 40 Ma Reconstruction at 30 Ma Reconstruction at 25 Ma Reconstruction at 15 Ma Arc-backarc basin volcanic cycle Reconstruction at 5 Ma Present tectonic features of the Philippine Sea Plate
11 xi LIST OF TABLES TABLE Page 5.1 Subducting slab properties The distance from Kilauea and age of Hawaiian hotspot chain volcanoes Depths and the ages of Japan Izu Bonin Mariana subducting zones Depths and ages of subducting slabs Shifting distance of a subducted slab from its origin
12 1 CHAPTER I INTRODUCTION Background The subduction of oceanic lithosphere is a key component of plate tectonic theory and has been investigated extensively. In fact, subduction is considered the primary driving force for plate motion. The mechanical behavior of lithosphere in the process of subduction has been extensively examined for its importance in understanding mantle dynamics related to plate motion at the Earth s surface. Subducting slab behavior has been explored ever since earthquake seismic records have been available. The shape of the subducting slab can be recognized from the distribution of the earthquake foci as the Wadati-Benioff zone. Earthquakes on the Wadati-Benioff zone terminate near a depth of 660 km (although some places have deeper earthquakes and others have shallower Wadati-Benioff zones). The question about whether the maximum depth of the Wadati- Benioff zone means the termination of subducting slabs persisted until the development of seismic tomography, leading to a new stage in Earth s science where we can see the inside of the Earth in 3 dimensions. Development of the seismic tomography method has revealed the distribution of subducted slabs in the mantle and shown that slabs behave differently. Some subducting slabs penetrate the lower mantle all the way to the core This dissertation follows the style and format of Tectonophysics.
13 2 mantle boundary, while others do not. Instead of sinking into the lower mantle, some slabs lay horizontally at the transition zone between the upper and lower mantle. The nature of the transition zone between the upper and lower mantle is still unclear. Seismic studies suggested the presence of a transition zone in the mantle, between two major seismic discontinuities at 400 km and 660 km deep. The discontinuities occur over a range of depths that might represent phase changes instead of compositional (chemistry) change that should result in a sharp change of the discontinuity (Schubert et al., 2001). The phase change between the upper and lower mantle cannot be too great because some slabs are able to penetrate the lower mantle. However, it has to be strong enough to inhibit some slabs from penetrating the boundary. Several previous studies have explored the reason why some slabs stagnate at the transition zone. Fukao et al. (2001) suggested that Western Pacific slabs are blocked and deflected at this zone due to the impermeable nature of the boundary, and that horizontal flow in the lower mantle s convection facilitates horizontal slab motion above the boundary. However, numerical and laboratory models of subducting slab shows that trench lateral migration has an influence in laying down of the slab at the transition zone (King, 2001; Christensen, 1996; van der Hilst & Seno, 1993). The subducted slab is also examined in its correlation with the geoid anomalies. Not only does the slab affect the geoid directly, as it is an anomalous body beneath the surface, it also drives a mantle flow that might alter distribution of phase changes (Zhong & Davies, 1999). Several previous studies in mantle dynamics flow models attempted to find viscosity variations within the mantle, using the distribution of velocity
14 3 anomalies from seismic tomography, and subduction zone boundaries as one of the constraints (e.g. King, 2002; King & Hager, 1994; Zhong and Davies, 1999; Zhang and Christensen, 1993; Hager, 1984). Results of these geodynamic models indicate a small variation of viscosity within the upper and lower mantle Even though the fate of the subducting slab within the lower mantle is not completely understood, we attempt to analyze the distribution of subducted slabs beneath the Western Pacific region relative to where subduction has occurred over time. Tectonic evolution of the Western Pacific region is complex and existing plate reconstructions have thus far been made exclusively from data at Earth s surface. The Philippine Sea Plate, surrounded on all sides by convergent margins, is a key and controversial component of all reconstructions for the region. Understanding its origin (spreading history) and motion (paleomagnetics) throughout the Cenozoic is essential for determining an accurate reconstruction of the region. To date, seafloor spreading magnetic lineations (e.g. Hilde and Lee, 1984; Okino et al., 1998, 1999; Otofuji, 1996) and paleomagnetic determinations from Islands arc rocks samples (e.g. Hall et al. 1995; Haston & Fuller, 1991; Fuller et al. 1983; McCabe et al. 1987) have been the primary data for studying Philippine Sea Plate development and motion through time. Motivation Various plate reconstruction scenarios of the Western Pacific region have been proposed. They can be classified in three main groups based on differences in Philippine
15 4 Sea Plate evolution and motion. The first group suggests a clockwise ~90 o rotation in the past 50 million years of the Philippine Sea Plate as it moved from south near the equator to the northeast (Deschamps, 2001; Hall et al., 1995; Hall, 2002). The second group agrees on a small amount of rotation along with the trench migration that formed several backarc basins in the Philippine Sea Plate (Seno & Maruyama, 1984; Honza, 1995). Finally, the third group (Lewis et al. 2002; Stern & Bloomer, 1992; Hilde et al, 1977; Uyeda & Ben-Avraham, 1972) has the Philippine Sea Plate migrating northward from its equatorial origin between major transform boundaries that became convergent boundaries (Philippine and Izu-Bonin-Mariana) when the Pacific Plate changed its motion from North to the Northwest at ~ 43 Ma. There are several problems in these theories. If we consider material properties of the subducting slab and mantle (or in this case the viscosity variation between them) the rotation scenario in the first group is very unlikely. It is difficult to imagine subducted slabs rotating laterally through the mantle at greater than known plate motion rates, which is required in these reconstructions, and without significant resistance from the mantle. In addition, the reasoning behind Hall s rotation scenario (1995) is based partly on suspect assumptions. Paleomagnetic data taken from several places within the Philippine Sea Plate indeed show some rotations. However, the size and direction of the rotations vary considerably from place to place, which is more likely associated with local rotations and not plate rotation as a whole (McCabe, 1984). The second theory is unnecessary complicated by suggesting an extinct North New Guinea Plate that has been entirely subducted (Seno & Maruyama, 1984). It is
16 5 difficult to confirm such a theory because of the lack of supporting data. The weakness of the third theory is that there is evidence of subduction activity along the eastern margin of the Philippine Sea Plate preceding the change of Pacific Plate motion at ~43 Ma (Clague, 1996). Geologic dating along the Izu-Bonin-Mariana trench indicates that the subduction along this zone has been active since ~50 Ma (Cosca et al. 1998; Deschamps & Lallemand, 2003). However, new studies of the age of the Hawaiian- Emperor hot spot seamount chain bend suggest the age of this bend may also be ~50 Ma (Sharp & Clague, 2002). Research Objective This dissertation seeks to evaluate the competing reconstruction models based on analysis of slab distribution from subduction at the margins of the Philippine Sea Plate. We use the distribution of subducted slabs in the region as an indication of the past position of Philippine Sea Plate convergent boundaries. The slab distribution was obtained from Widiyantoro s P and S wave seismic tomography models (personal communication) as well as from other seismic tomography images (Fukao et al. 2001, 1992; van der Hilst et al. 1997; Grand et al., 1997). We then develop the evolution of the Philippine Sea Plate from the maps of past subduction zones, inferred from the distribution of the subducted slab ages. Factors such as the length or the depth of subducted slab, the rate of the plate motion on the surface, and the approximate rates of the sinking slab in the upper and lower mantle are considered for tracing the movement
17 6 of the slab in the mantle. The slab subducted age estimation is then determined from the history of slab movement. The rest of this dissertation is organized as follows. The following chapter reviews previous studies on the plate tectonics and reconstruction history of the region. It also reviews previous use of tomography in plate tectonics and the correlation between the geoid and subducted slabs. In Chapter III, we discuss the reliability of existing tomography models. Subducted slab distribution analysis, in general, is presented in Chapter IV and the slab analysis beneath the Philippine Sea Plate is in Chapter V. Finally, in Chapter VI, all analysis results are integrated as constraints for a new reconstruction model.
18 7 CHAPTER II PREVIOUS STUDIES Tectonic Setting The Western Pacific has been one of the most complex tectonic regions on Earth throughout Cenozoic time due to the convergence of Eurasian, Pacific and Indian- Australian plates, numerous convergence zones, back arc basins and many small plates. The history of the Western Pacific region has been studied extensively (e.g. Deschamps & Lallemand, 2003, 2002a; Deschamps et al., 2002b, 2000; Deschamps, 2001; Hall, 2002; Hall et al., 1995; Okino & Fujioka, 2003; Fujioka et al., 1999; Hilde & Lee, 1984; Hilde et al., 1977; Seno & Maruyama, 1984; Seno, 1989; and many others). Following is an overview of the tectonics of the area. The main subject of this study is the Philippine Sea Plate, which is surrounded by subduction zones (see Figure 2.1). On the east margin, there are the Izu-Bonin and Mariana island arc systems where the Pacific Plate is subducting beneath the Philippine Sea Plate at the rate of about 85 mm/yr (Kato, 2003; Michel et al., 2001). At the north of the Philippine Sea Plate, the subduction toward the Southwest Japan has been active since at least early Cretaceous. Continued subduction subsequently included subduction of the Kula (or Izanagi) - Pacific Ridge (Uyeda & Miyashiro, 1974; Hilde et al., 1977). Current subduction of the Pacific Plate at the Japan and Kuril Trenches has a rate of ~ cm/yr (Zang et al., 2002).
.")
19 Figure 2.1. Main tectonic features of the Western Pacific region (CBSC = Central Basin Spreading Center). Source of topography map is Smith & Sandwell, Drawn using the GMT (Wessel and Smith, 1995). 8
20 9 The Japan Sea opening and rotation of the Japanese Islands away from Eurasia must be considered when investigating the motion and position of the Philippine Sea Plate relative to Japan. It is clear that related Mesozoic rocks exist in Japan and Korea have been separated by development of the Japan Sea, sometime in the Cenozoic (Hilde & Wageman, 1973). Mapping and modeling of Japan Basin magnetic lineations (Tamaki, 1995) establish backarc spreading for this part of the Japan Sea during Ma. The sediment thickness on the oceanic crust and uniformly high heat flow of the Japan Sea also suggest a relatively recent opening (Uyeda & Miyashiro, 1974). There are several models for the Japan Sea opening, all of which involve large rotation and lateral fault displacement of the Japanese Islands. Paleomagnetic data from the Japanese Islands suggest 45 o clockwise for Southwest Japan, 30 o counter-clockwise for Northeast Japan, and Central Japan by 10 o clockwise (Otofuji, 1996; Itoh & Kitada, 2003). All rotations are relative to the Korean Peninsula and occurred between 21 Ma and 14 Ma (Otofuji, 1996). Based on those paleomagnetic data, Otofuji (1996) suggested a double-door opening model as the mechanism for opening of the Japan Sea. However, Jolivet et al. (1995) and Altis (1999a) argued that most of the rotations are due to distributed local deformation, except the rotation of SW Japan that is a combination of rotation of southwest Japan as a whole and rotation due to internal deformation. Honza et al. (2004) presents a similar model that additionally involves large lateral displacements. Thus, these studies suggest a structural pull-apart mechanism in combination with backarc spreading between Ma for opening of the Japan Sea. Moreover, Altis (1999a) proposed that the Japan Sea opening is the result of extrusion
21 10 caused by the collision between the Eurasian and Okhotsk Plates. In addition, the Japan Sea opening motion transferred the Japan Islands southward and is perhaps responsible for the deformation at the south of Kyushu and the northern part of Okinawa Trough (Sibuet et al., 2002). Southwest Japan is the northern boundary of the Philippine Sea Plate along which are the northern Ryukyu Trench and SW Japan Trench (or Nankai Trough). Seno (1989) suggested that present subduction of the Philippine Sea Plate along southwest Japan has been only since 6-7 Ma, based on the activity of volcanoes along the margin. However, the abundant Miocene and older volcanic rocks at the southwest Japan Islands indicate subduction throughout the Cretaceous and into Cenozoic time (Byrne & DiTullio, 1992; Uyeda & Miyashiro, 1974). Along southwest Japan, the Kula plate was subducting until ~43 Ma according to Byrne & DiTullio (1992). The West Philippine Basin north of the Central Basin Spreading Center (CBSC) was a boundary of the Kula Plate until that time according to Hilde et al. (1977). Since Miocene time, the Philippine Sea Plate and Izu-Bonin arc have been subducted towards SW Japan and the South Fossa Magna on Honshu, respectively. The buoyant subduction of the Izu-Bonin ridge might cause the bending of the subduction zone at the south of Honshu. This subduction of the Izu Block is Miocene time also might initiate the deformation in the South Fossa Magna region (Matsuda, 1978). In the early Quaternary, the Izu-Bonin Arc collided with Honshu in the South Fossa Magna, created the high compression to the area and strong regional uplift (Hirahara, 1981;
22 11 Matsuda, 1978). Currently, the Philippine Sea Plate is subducting beneath the Southwest Japan region at a slow rate of 3 cm/yr (Zang et al., 2002). Three main oceanic backarc basins make up the Philippine Sea Plate: (1) the eastern most, youngest, active Mariana Basin, (2) the inactive Shikoku and Parece-Vela Basins in the east, and (3) the oldest, largest, inactive West Philippine Basin (Figure 2.1). (1) and (2) were formed by backarc spreading and (3) is considered a trapped ocean basin (Hilde et al., 1977). The spreading history for all the Philippine Sea basins is well documented by extensive mapping of the magnetic lineations (Figure 2.2). West Mariana Ridge is considered to be a remnant arc of the Mariana subduction zone that was active between 20 9 Ma (Scott and Kroenke, 1980). The relatively new Mariana Trough is an actively opening backarc basin at the eastern edge of the Philippine Sea Plate, located between West Mariana Ridge and Mariana volcanic arc. Mariana Trough formation started at about 6.5 Ma with initial rifting at a full-rate of ~2.15 cm/yr (Fryer, 1996). The basin is rifting apart E-W asymmetrically with the rate of about 15 mm/yr to the north and about 45 mm/yr to the south (Kato, 2003). To the north, behind the Bonin Arc, there is no sign of an active backarc spreading. However, the distribution of the backarc depressions and structure indicates an initial stage of backarc rifting is taking place (Honza & Tamaki, 1985). On the west of the West Mariana and South Honshu Ridges is the older complex of Shikoku and Parece-Vela Basins. Both basins, now extinct, formed by back arc spreading with similar evolutionary processes and time frames (Figure 2.3) (Okino et al., 1998). Spreading to form the Shikoku Basin started at 27 Ma in northern part with

23 Figure 2.2. Magnetic lineations (compilation from sources: Okino et al., 1994 and Hilde & Lee, 1984). Black circles show locations of DSDP holes. Doted and solid contours are 4000 m and 8000 m respectively. 12

24 13 spreading half-rate of 2.3 cm/yr. At 23 Ma, the opening direction changed from N70 o E to E-W and the spreading half-rate increased to 4.4 cm/yr during Ma period. Then the spreading rotated at 19 Ma in the NE-SW direction, with the spreading half-rate decreased to 2-3 cm/yr. During this period, the spreading ridge propagated to the south, resulting in curved transform faults and a fan-shaped sea floor spreading pattern (Okino et al., 1998). The opening of the Shikoku Basin ceased at 15 Ma. Figure 2.3. Evolution of Shikoku and Parece-Vela Basins (Okino et al. 1998). The spreading center to form Parece-Vela Basin dates from 30 Ma to 17 Ma (Okino et al., 1999; Isezaki & Okino, 1995). According to magnetic lineations analysis
25 14 (Fujioka et al., 2000), two episodes of spreading formed by the Parece-Vela Basin. In the first episode, the E-W spreading at a half-rate of 2.3 cm/yr propagated from the south to the north. This episode is also marked by a ridge-jump to the east (Okino et al., 1999). During the transition between episodes, about Ma, spreading was stable at a halfrate of 4.5 cm/yr. The second episode is marked by a change to NE-SW spreading at a slow half-rate of 2-3 cm/yr. Starting at about 20 Ma, spreading during the second episode ceased at about 15 Ma (Okino et al., 1999; Fujioka et al., 2000). To the south, the Philippine Sea Plate is bounded by the complex of the Yap - Palau Trenches and Ayu Trough. Yap Trench is considered as a part of proto-mariana Trench (Honza, 1991; Fujiwara, et al., 2000; Ohara et al., 2002). Even though the present convergence rate is apparently almost zero (Zang et al., 2002), subduction along the Yap Trench is apparently still active as indicated by the micro-seismicity in this region (Sato et al., 1997). The oldest arc volcanic found on the Yap Island are 25 Ma (Ohara et al., 2002). In addition, there is an indication of transient arc volcanic activity based on 11-7 Ma tholeiite basalts dredged from the upper Yap forearc (Beccaluva et al., 1980). The Shikoku and Parece-Vela Basins are separated from the West Philippine Basin by the N S Palau-Kyushu Ridge, the remnant arc of the initial Pacific Plate subduction along east margin of the Philippine Sea Plate (Uyeda & Ben-Avraham, 1972; Hilde et al., 1977; Beccaluva et al., 1980). The West Philippine Basin has several large topographic features. Amami Plateau and Daito Ridge Complex are located in the north of the basin. Daito and Oki-Daito Ridges are considered to be remnants of Ma old
26 15 magmatic arcs (Ozima et al., 1983; Seno & Maruyama, 1984). Urdaneta and Benham Plateaus (small mid-plate plateaus) are located in the central-western part of the basin, at equal distances to the north and south of the extinct Central Basin Spreading Center. The radiomateric age of basalts found in Benham Plateau is 49 Ma (Ozima et al., 1983), while the magnetic anomaly at Benham and Urdaneta Plateaus indicates Ma (Hilde & Lee, 1984). Reconstruction of the West Philippine Basin spreading history shows that these plateaus were formed together at the Central Basin Spreading Center by a single large volcanic event at ~46 Ma (Hilde & Lee, 1984). The Central Basin Spreading Center (CBSC) is a linear ridge/rift structure, made up of short EW ridge segments, offset by several N-S transform faults. The CBSC extends diagonally in an overall WNW direction from Palau-Kyushu Ridge to near the Gagua Ridge. West of Gagua Ridge, to Taiwan, the CBSC has been subducted beneath the Western most Ryukyu Arc (Hilde & Lee, 1984). The West Philippine Basin has been interpreted as both trapped ocean basin and backarc spreading produced lithosphere. Hilde & Lee (1984) suggested that it was formed by the spreading of the Central Basin Spreading Center, from about 60 to 35 Ma in two stages. During the first stage, the spreading was in a NE-SW direction (relative to present orientation) at a half rate of 44 mm/yr until about 45 Ma. The spreading direction then changed to N-S at a half rate of 18 mm/yr during the second stage, ceasing at 35 Ma. Based on the updated reversal time scale (Cande & Kent, 1995), and using the same magnetic correlations, Deschamps (2001) concludes that this spreading started at about 55 Ma and ceased at Ma. During the time of initial spreading, according to
27 16 Deschamps (2001), the basin was bordered by the northward subducting Australian Plate at the south and southward subduction of the Pacific Plate along its northern margin (Palau-Kyushu Ridge). On the west side of the West Philippine Basin, the Gagua Ridge is a N-S narrow linear ridge (300 km long, 4 km high) between northeast Luzon Island and the Ryukyu Trench and is currently being subducted beneath the Ryukyu Trench. Deschamps et al. (1998), based on the magnetic lineations of Hilde and Lee (1984), suggested that the Gagua Ridge is a fracture zone/transverse ridge uplifted in the middle Eeocene. How far the Gagua Ridge had been subducted beneath the Ryukyu Trench, however, has not yet been identified. The Ryukyu Trench and Philippine Arc mark the western boundary of the Philippine Sea Plate where the plate is subducting beneath the Eurasian Plate. The northwestern margin of the Philippine Sea Plate is bounded by the Ryukyu Trench, Arc, and Okinawa Trough, extending from the south of Kyushu Island to Taiwan. Subduction at the Ryukyu Trench has apparently been active since late Cretaceous (Kobayashi, 1985; Deschamps et al., 1998). More specifically, Kobayashi (1985) found five magmatic episodes along the Ryukyu Arc, with the oldest volcanic rocks age at Ma and the youngest (found only on the north part of the arc) of Pleistocene age. From the Southwest Japan to the southwest, the Ryukyu subduction zone merges into the Taiwan collision zone, where the north end of the Philippine Arc, attached to the Philippine Sea Plate, is colliding with the Eurasian Plate at the SW end of the Ryukyu Trench. The Philippine Sea Plate near Taiwan is converging towards the Eurasian Plate
28 17 at a rate between 56 mm/yr (Seno et al., 1993; Sibuet et al., 2002) and 70 mm/yr (Zang et al., 2002; Michel et al., 2001). Okinawa Trough is a young backarc basin, located behind the Ryukyu subduction zone. The rifting phase occurred since middle Miocene that developed an extension zone about 75 km wide and thinned the crust (Sibuet et al., 1998; Lee et al., 1980). Since late Pliocene, the southwestern half of Okinawa Trough is in the drifting (backarc spreading) stage, where intermittent intrusion of the igneous rock can be found along the trough s central rift (Lee et al., 1980). Taiwan is a complex collision zone that is located at the western boundary of the Philippine Sea Plate. According to Sibuet et al. (2002), the formation of the Taiwan mountain belt was driven by two lithospheric motions: the subduction of the Philippine Sea Plate beneath Eurasia (Ryukyu subduction zone) and the subduction of Eurasia beneath the Philippine Sea Plate (Luzon arc). The arc-arc collision model (Sibuet & Hsu, 1997) suggested that the Taiwan orogeny formed due to the collision of the Luzon arc with the now extinct part of the Ryukyu subduction zone, that extended southwest of the present-day position of Taiwan at about 6-9 Ma (Sibuet et al., 2002). The southwestern boundary of the Philippine Sea Plate is the Philippine Trench, where the Philippine Sea Plate is subducting beneath the Eurasian Plate along the Philippine Islands with relative motion of 85 mm/yr (Zang et al., 2002). The Benioff Zone of the Philippine subduction zone that extends only to 200 km deep and the lack of significant accretionary prism formed in the forearc region indicate that the subduction along the Philippine Trench is very young (Lewis & Hayes, 1983).
29 18 The Philippine Island Arc is trapped between two subduction zones: the Philippine Sea Plate subducting from the east (Philippine Trench) and the South China Sea (Eurasian) Plate subducting from the west (Manila Trench). The condition has resulted in a complex tectonic history for the Philippine Island Arc. The Manila Trench has been an active convergence zone since at least the early Miocene (Schweller et al., 1983), during which the westward subduction zone did not exist (Uyeda & McCabe, 1983). The subduction on the west side of the Philippine Islands moved the Philippine Sea Plate to the west. Later collision of the Palawan block on the west apparently ended spreading in the South China Sea (Uyeda & McCabe, 1983). This collision is perhaps connected to the ~20 o counterclockwise rotation of the northern Philippine Islands and clockwise rotation of Panay Island (middle Philippines) at early and middle Miocene time (Fuller et al., 1983). Northern Luzon experienced a clockwise rotation during the Pliocene, which is attributed to its collision with Taiwan (Fuller et al., 1983). Data from Luzon also indicate that the island was located at equatorial latitudes during Eocene time (Fuller et al., 1983) and was probably part of the Philippine Sea Plate until colliding with Eurasia to form Taiwan and the beginning of subduction along the Philippine Trench in the late Miocene (Uyeda & McCabe, 1983). The Manila Trench marks the eastern boundary of the South China Sea, where the South China Sea oceanic crust is subducted below the Philippine Arc. Before the Philippine Islands moved to their current location (before 5 Ma), the South China Sea Plate was subducting beneath the Philippine Sea Plate along the proto Manila Trench (Sibuet et al., 2002). Currently, the Luzon-Taiwan complex separates the South China
30 19 Sea and the Philippine Sea Plates. The South China Sea was formed by at least three stages of spreading (Ru-Ke, 1988). The first rifting of the western South China Sea probably began at about 65 Ma (late Cretaceous or early Paleocene) and the second spreading period started in the late Eocene (Ru-Ke, 1988; Taylor & Hayes, 1980). The eastern half of the South China Basin is the result of the last spreading. The seafloor spreading occurred ~32 17 Ma (Taylor & Hayes, 1983), about the same time as the formation of the Parece-Vela and Shikoku Basins. Previous Reconstructions Several Western Pacific reconstructions have been proposed in the attempt to explained the region s Cretaceous Cenozoic plate tectonic history. Some investigators have included the Western Pacific as a part of their global plate tectonic reconstructions (e.g. Scotese et al., 1988 and Zonenshain et al., 1985) and several studies have focused specifically on the complex Western Pacific Southeast Asia region (e.g. Hall, 2002; Lee and Lawver, 1995; Honza, 1991; Seno and Maruyama, 1984; Hilde et al, 1977; Uyeda and Ben-Avraham, 1972). The predicted plate motions vary considerably, especially for the evolution of the Philippine Sea Plate. Hilde et al. (1977) and Uyeda and Ben-Avraham (1972) suggest that the Izu-Bonin-Mariana subduction zone started along a transform fault between Kula and Pacific Plates when the motion of the Pacific Plate changed from NNW to WNW (see Figure 2.4). Moreover, the location of the subduction zone has not changed significantly since then, except for the trench rollback and backarc basin development along the Philippine Sea Plate eastern margin.
31 Figure 2.4. Reconstruction based on the transform fault origin (Uyeda & Ben- Avraham, 1972). 20
32 21 Lee and Lawver (1995) and Hall (2002) agree on positioning the origin of the Philippine Sea Plate near the equator. The difference is on how the plate moved to current location. According to Lee and Lawver, the plate moved straight northward, similar to the Hilde et al. (1977) reconstruction. Hall showed a major clockwise rotation of the Philippine Sea Plate. Hall (2002) suggested that a rotation of the Philippine Sea Plate occurred with two possible rotation poles during Cenozoic time (see Figure 2.5). During Ma, with a rotation pole 10 o N/150 o E, the plate rotated 50 o clockwise from its initial location at about the equator. After the rotation temporarily ceased between 40 and 25 Ma, the rotation continued, 34 o clockwise between 25 and 5 Ma about a 15 o N/150 o E pole. More recently, Deschamps (2001) suggested that the plate rotation continued from 5 Ma to present by 5-6 o at a rotation pole of about 48.2 o N/157 o E. Hall et al. (1995) presents a review of the paleomagnetic results from various locations on the Philippine Sea Plate that, according to them, indicate ~ 90 o of clockwise rotation since early Oligocene. However, those locations have different rotation records, which should be interpreted as local tectonic deformations and not as a product of entire plate rotation (McCabe and Uyeda, 1983). For example, the rotation of some islands along the Mariana Arc might be due to backarc basin opening (McCabe, 1984), which has occurred since the formation of the Palau-Kyushu Ridge in the Eocene. Furthermore, Hall et al. (1995) considered the region just north of the Sorong fault (Halmahera Plate) as a part of the Philippine Sea Plate and used the declination data from Halmahera Island to represent the western part of the Philippine Sea Plate. Based on its location, it is
 gives doubt to the paleomagnetic data obtained from Halmahera Island.")
33 22 possible to integrate Halmahera as a part of the Philippine Sea Plate. However, the complex nature of the region (Hamilton, 1979) gives doubt to the paleomagnetic data obtained from Halmahera Island. Additional paleomagnetic studies from the area are needed to confirm the movements and evolution of the Philippine Sea Plate. Figure 2.5. Hall s proposed positions of Philippine Sea Plate from 50 to 20 Ma (Deschamps, 2001). Seno and Maruyama (1984) have a similar interpretation to Honza (1991) for the development of the Philippine Sea Plate. Their reconstructions include a slight rotation of the Philippine Sea Plate as the effect of large trench migration and the formation of
34 23 backarc basins. Along the proto Izu-Bonin Arc, the trench migrated ~1000 km eastward between 30 Ma and 17 Ma and along the proto Mariana Arc, the trench migrated ~ 400 km between 30 Ma and 17 Ma (Seno and Maruyama, 1984). This scenario, with less rotation, is similar to Hall s reconstruction. However, they addressed the problem of southward subduction of the Pacific Plate while it was moving northward. Seno & Maruyama (1984) tried to solve that problem by positioning a hypothetical North New Guinea Plate at the north of the proto Izu-Bonin-Mariana Trench. The North New Guinea Plate is separated from the Pacific Plate by a spreading center (see Figure 2.6). While it might explain the possibility of the southward subduction along the north boundary of Philippine Sea Plate, this hypothesis is difficult to accept because of the lack of evidence for existence of a plate that has been completed subducted, without a trace, in their model. Seismic Tomography in Geodynamic Studies Development of the seismic tomography method in the last decade has revealed the distribution of subducted lithosphere in the mantle (e.g. van der Hilst et al., 1991; Fukao et al., 1992; Widyantoro & van der Hilst, 1996; Grand et al., 1997). The seismic tomography method involves inversion of travel time data for seismic waves from worldwide earthquake records to obtain three dimensional distribution of seismic velocity anomalies in the mantle with respect to an Earth model. Seismic tomography solutions are not unique; they depend on the data, the parameterization, the inversion


. Figure 2.6.")
35 24 methods, and the background Earth model used. The tomography models also depend on the resolution and the sampling of seismic ray paths. Data resolution in the Western Pacific region is relatively good considering the amount of earthquakes and seismic stations that covered the area (Inoue et al., 1990). Figure 2.6. Philippine Sea Plate reconstruction from Seno & Maruyama (1984).
36 25 The availability of seismic tomography offers another insight into the plate dynamics of a region. With the possibility of viewing 3D distribution of subducted slabs in the mantle, seismic tomography can reveal a record of previous plate convergence. Seismic tomography has been used to analyze the plate tectonics for some specific features or regions. van der Hilst and Seno (1993) used the tomography images to understand the differences in the deep structure of slabs below the Izu-Bonin and Mariana island arcs. Plate interaction around the Taiwan region was thoroughly examined using the tomography images by Lallemand et al. (2001) and Rau & Wu (1995). The tomography images beneath the North Pacific show the subducted slabs of the Kula Plate which lay horizontally between the 400 km and 660 km discontinuities beneath the Aleutian and Kuril-Kamchatka subduction zones, respectively (Gorbatov et al., 2000). Also, van der Voo et al. (1999) interpreted the tomography images beneath India to explain the subduction of the Paleo-Tethys Ocean lithosphere in the early Cretaceous. These investigations demonstrate that seismic tomography can improve our understanding of plate subduction histories. Seismic tomography models show that some subducted slabs have flattened at or near the 670-km discontinuity and some have plunged deep into the lower mantle. For instance, the Japan-Kuril and Izu-Bonin subducted slabs flatten near the 670 km boundary, extend below the Asia continent and thicken to km (Fukao et al., 2001, 1992). In Fukao et al. (2001), one example of the tomography beneath Japan shows a slab penetrating the lower mantle and reaching the core-mantle boundary. However, the perturbation is very weak (small magnitude) making it questionable to
37 26 interpret it as a slab. In another case, the Java subduction slab more convincingly dips into the lower mantle to a depth of about 1200 km (Fukao et al., 1992; Widiyantoro and van der Hilst, 1996). The Farallon slab (beneath the southern United States) penetrates the lower mantle and extends to the core-mantle boundary (Grand, et al, 1997). Fukao et al. (2001) tried to determine the possible significance of the stagnant slabs in transition zone for subduction histories. They suggested that during Eocene time there was a global fall through the transition zone, when many pre-eocene subducted slabs detached and sank into the deep lower mantle. They concluded that the detachment and fall changed the slab pull force, which influenced the subducting plate movement on the surface and resulted in a global plate motion change and re-organization. According to them, the global fall scenario is one possible explanation for the subduction slabs gap beneath Java (Widiyantoro and van der Hilst, 1996) and beneath the southern United States (Farallon slab) (Grand et al., 1997). However, many previous comprehensive geology/geophysics studies suggest different hypothese. For instance, the Java subducting slab s gap along eastern of Indonesia is perhaps related to the collision of the Australian continent with the Java Trench (Audley-Charles, 1984). In addition, based on the observation that the spreading ridge is very close to the Middle America Trench, Ferrari (2004) suggested that the Farallon slab detachment was initiated by the younger oceanic lithosphere coupling to the overriding North America plate, or conversion to a transform plate boundary. Tomography models, combined with geodynamic mantle flow models, also have been used to estimate plate tectonics evolutionary history. Figure 2.7 shows global
.")
38 27 subduction zone locations during the last 120 million years (Grand et al., 1997) based on the subduction history model from Lithgow-Bertelloni and Richards (1998). In the Figure 2.7. Map showing the age and location of subducted slabs in a hotspot reference frame during the past 120 my (Grand et al., 1997). Western Pacific region, since at least 80 Ma, the subduction zone of the Pacific Plate toward the Eurasia Plate has been located at the general current offshore east coast margin of the Asia continent (see the red box) and continuously migrated seaward. This hypothesis lacks details for the Philippine Sea Plate but is consistent with previously mentioned arguments that the Pacific Plate has been subducting along the Kuril-Japan-
39 28 Ryukyu subduction zones since Cretaceous (Byrne & DiTullio, 1992; Hilde et al., 1977; Uyeda & Miyashiro, 1974). Geoid Anomalies Over the Philippine Sea Plate The history of subduction zones can also be related to the geoid, which is the gravity equipotential field that coincides with sea level. Large anomalies of the geoid cannot be explained by topography or shallow depth features. Very large mass anomalies deep in the Earth are an alternative explanation. The Western Pacific is the site of a large geoidal height based on the satellite altimetry data (Figure 2.8). Bostrom et al. (1984) considered that the Philippine Sea back-arc region is a site where subducted slab material has been added to the asthenosphere, producing the high geoid. Several investigators have attempted to associate the geoid with plate tectonics. The correlation of the longwavelength geoid height with detailed plate tectonics features, based on the geoid map (Figure 2.8), seems unlikely. Nevertheless, Chase and Sprowl (1983) suggested that the broad Western Pacific geoidal height is located in the area of Cretaceous subduction zones. Geoid modeling, to date, cannot reliably suggest the structure of mantle viscosity in a great detail (Bercovici et al., 2000; Thoraval & Richards, 1997). However, viscosity variations along the slab and in the surrounding mantle have a large effect on geoid (King & Hager, 1994; Bowin, 2000). The relationship between subducted slab and the

40 Figure 2.8 Western Pacific geoid map from altimetry (Sandwell & Smith, 1997). Drawn using the GMT (Wessel and Smith, 1995). 29
41 30 geoid seems straightforward: the subducted lithosphere creates positive density anomalies in the mantle that will result in positive geoid. However, the subducted slab also causes depressions in the Earth s surface (trenches), marked by negative mass anomalies. A simple model then predicts a net negative geoid anomaly over the subduction zone (Hager, 1984). In addition, the subducted slab does not only affect the geoid directly, but also indirectly as it drives a mantle flow that might alter any internal density interfaces due to the phase changes. A mathematical model by Zhong & Davies (1999) suggested that slab viscosity has a small influence on the geoid from the upper to middle mantle, whereas the slabs near the bottom of the lower mantle may have more affect on the geoid and may result in positive geoid over deeply subducted slabs. Geoid height distribution (Figure 2.8) shows the high geoid concentration around the Papua New Guinea and the Philippine Sea Plate regions. The high geoid anomalies may indicate the accumulation of subducted slab in lower mantle. Consequently, we may suggest that this area is one of a few places in the Earth that has been the site of continuous subduction for a hundred million years or more (Engebretson et al., 1992; Chase & Sprowl, 1983).
42 31 CHAPTER III TOMOGRAPHY DATA ANALYSIS This chapter analyses the tomography models of the Philippine Sea and its surrounding area. The study employs two tomography models, developed by Fukao et al. (1992 & 2001), Widiyantoro & van der Hilst (1997), and Widiyantoro et al. (1998, 1999) for determining the slab structure. This chapter starts by briefly describing the sources of images as well as the specifics of the tomography modeling techniques. It then provides a detailed comparison of the two models in the cross section slab images. Next, we discuss seismicity in the Wadati-Benioff zone, followed by mapping the distribution of the subducted slab that combines the seismicity with the horizontal slices of tomography images. Finally, we briefly describe the slab distribution in 3D view and present the distribution map of subducted slabs combined from the two tomography models. Tomography Models The analysis used mainly tomography images from Fukao et al. (1992, 2001), van der Hilst et al. (1997), Obayashi et al. (1997) (as cited by Fukao et al., 2001) and Widiyantoro s model (Widiyantoro et al., 1998, 1999). These tomography models were produced using similar methods based on the arrival-time data of body waves. Obayashi model (WEPP2) and Fukao model (WEPP1) model are similar to each other except that
43 32 the former used four times more arrival-time data than those of the latter. The source of tomography images in van der Hilst et al. (1997) (P97) was Widiyantoro s tomography models. Fukao s and Widiyantoro s global tomography models are based on the arrivaltime data of P (Pp) and S (SKS) body waves. The body wave data are generally used for mantle analysis because they provide a better resolution than surface waves. Rather than using the ISC arrival-time data directly (Fukao et al., 1992), Widiyantoro employed the improved earthquake data by Engdahl et al. (1998). As a global reference model, Widiyantoro utilized model ak135 (Kennet et al., 1995) while Fukao applied the model based on his previous modeling (Inoue et al., 1990). The Earth global reference model is very important in linearized seismic tomography because an incorrect reference velocity leads to incorrect anomalies. Therefore, the reference model aspect needs to be considered in analyzing the tomography images. Even though ak135 is the most recent model that fit the times of a wide variety of seismic phases, the resolution in some zones is still weak, particularly at the bottom of the lower mantle, near the core-mantle boundary (Kennett et al., 1995). The reference model artifacts cause a decline in resolution between the 400 km and 660 km discontinuities. An experiment in using different reference models by van der Hilst & Spakman (1989) demonstrates that a continuity of velocity structure in the transition zone between 400 km and 660 km does not always mean a continuity of structure. For example, one long fast anomaly structure may consist of two independent slabs. We need to examine the detail of the magnitude of the perturbation thoroughly.
44 33 Both Fukao and Widiyantoro models employed similar inversion methods, the iterative conjugate gradient algorithm. The algorithm inverts the seismic wave traveltime data to obtain the velocity distribution in the mantle. The two models are parameterized in discrete blocks. The horizontal size of Widiyantoro s model is 2 o x 2 o and varies with depth (18 layers in depth, with a thickness of 100 km in the upper mantle and 200 km in the lower mantle). Fukao s model employed several sizes of blocks; the basic blocks have a horizontal size of 5.6 o x 5.6 o and different thicknesses, from 29 km just below the surface to 334 km just above the core mantle boundary. The smallest blocks used by Fukao in the Western Pacific are ¼ x ¼ x ½ of the basic blocks of 5.6 o x 5.6 o due to more data coverage in this region. In addition, the blocks around the smallest blocks are reduced to ½ x ½ x ½ of the original sizes. For model evaluation, both employed a checkerboard resolution test, calculated the synthesized data from the model and inverted to get the recovered tomography model. Both methods, after the inversion, result in a substantial loss of amplitude and a smearing effect, which produce very small amplitudes structures. Nevertheless, the original slab can still be inferred from the smeared image, although the real structure may be narrower than its appearance in the tomography images and the width of actual anomaly is difficult to determine (van der Hilst & Spakman, 1989). Figure 3.1 depicts the distribution of seismic stations and earthquake foci. As an area surrounded by subduction zones, the Philippine Sea Plate boundaries provide plentiful earthquake data. These data together with the large number of seismic stations
.")
45 34 Figure 3.1. The distribution of seismic stations and earthquake foci (Fukao et al. 2003). in the region provide a good resolution (i.e., ray path coverage) for the tomography results, particularly in the lower mantle (e.g. Widiyantoro et al., 2000; 1998; Inoue et al., 1990; Spakman et al., 1989). The nature of a ray path, which curves by refraction from a focus to a seismic station, leaves the uppermost part of the mantel un-crossed. The seismic ray paths also do not cross through shallow regions that are not close to the foci and seismic stations. As a result, the shallow depth region in the middle of the Philippine Plate, where there are neither earthquakes nor seismic stations, has poor ray path coverage.
. Figure 3.2 plots the ray path coverage at 100 200 km deep.")
46 35 Figure 3.2. S wave map for km deep. The shear wave model is plotted only in mantle regions sampled by seismic rays. The blank region in the middle of Philippine Sea Plate indicates poor ray path coverage at this depth (Widiyantoro et al., 2000). Figure 3.2 plots the ray path coverage at km deep. Blank regions indicate poor coverage and, as shown in the figure, the middle of the Philippine Sea Plate is among of these regions. With the dimension of the Philippine Sea Plate of about 25 o across, the deepest part that is possibly not crossed by an S-wave seismic ray path is about 600 km deep in the middle of the plate (Widiyantoro et al., 1998). The P-wave seismic ray path is different from the S-wave. Since, the P-wave is more direct, the ray path coverage at the upper mantle may be relatively better. In the global P-wave tomography study by Inoue et al. (1990), there is no ray path that hits the cells in the middle of the Philippine Sea Plate for the layer of km deep. However, the hit count map shows considerably better coverage for layers deeper than km. The resolution experiment by Spakman et al. (1989) indicates very poor coverage in the
47 36 middle of the Philippine Sea Plate to the depth of 500 km and even zero hit for the cells less than 200 km. As discussed in the previous chapter, these tomography models are unique due to the differences in the methods and data employed; they will not generate identical results. However, these models are also expected to expose similarities, which are substantial in interpreting the tomography models. For all tomography images presented in the rest of this chapter, subducted slabs are represented by fast velocity anomalies (displayed in blue). For reconstruction purposes, the high amplitude velocity anomalies (dark blue) will be given weighted consideration as subducted slabs, allowing progressively smaller amplitude contrasts to be evaluated for progressively deeper mantle. Cross Sections of Slab Images Figure 3.3 illustrates the location of the slices of the mantle shown in Figures The slices in Figure 3.4 are WEPP1 (Fukao et al., 1992) with perturbation magnitude scales of 2%. Figure 3.5 is taken from Fukao et al. (2001) with magnitude scales of 2% (WEPP2) and 1.5% (P97). The magnitude scales of cross sections in Figure 3.6, obtained from Widyantoro (personal comm.), are 1.5%. The depth of the cross section models in Figures 3.4 and 3.5 are the bottom of the lower mantle (~2800 km), but in Figures 3.6 the models are only 1700 km deep.

48 37 Figure 3.3. Locations of the cross sections of slab images. From all cross-section slices, one can see that the tomography profiles of most of these trenches show similar patterns of high velocity anomalies. The slab appears as a contrast between the yellow and red scaling at shallow depth (along the Wadati-Benioff zone), and the seismicity data confirm their existence. At about the transition zone, some slabs flatten and extend for about 2000 km from the trench to the west toward Eurasia. There are also high velocity bodies, whose origins are unclear, at the bottom of the mantle (above the core-mantle boundary). Those are perhaps the parts of older subducted slabs that have fallen to the lower mantle. The following sections briefly discuss the slab images correlated with each trench.


.")


49 Figure 3.4. Seismic tomography cross sections of WEPP1 (Fukao et al., 1992). Cross sections location is in Figure
50 39 C D E F Figure 3.5. P-wave seismic tomography cross sections across Japan (C), Izu- Bonin (D), Mariana (E) and Java (F). Top: WEPP2 mantle models from Obayashi et al. (1997) as cited by Fukao et al. (2001). Bottom: P97 models from van der Hilst et al. (1997). The number at the bottom right of each model is the amplitude scale. Circles represent hypocenters of earthquakes. Two parallel lines indicate 410 and 660 km depth. Cross sections location is in Figure 3.3.
51 Figure 3.6. Tomography cross sections 1 to 5. The P and S wave models are at the top and the bottom, respectively. Circles represent hypocenters of earthquakes. Two parallel lines indicate 410 and 660 km in depth. The bottom of diagram is 1700 km deep (Widiyantoro, personal comm.). Cross sections location is in Figure
52 41 Japan Subduction Zone All the cross sections across the Japan Trench (Figures 3.4 and 3.5) show the deflected slabs at about the transition zone. The slabs lay at the transition zone for about 2000 km distance westward beneath the Japan Sea and the Eurasian Continent. The western end parts of the slab sink into the lower mantle. The WEPP2 model in Figure 3.5 shows that more than half of the stagnant slab is below the 660 km in depth, while in the other models (WEPP1 and P97) only a small part of the slab is penetrating the lower mantle. Another interesting anomaly feature in these Japan cross sections is the large, strong fast anomaly deep in the lower mantle (see Figures 3.4A, 3.4B, 3.4C and 3.4C). No apparent connection is observed between this anomaly and the one laying at the transition zone, although the WEPP1 models reveal some weak anomalies between them. It is possible that the slab in the lower mantle is an older part of the slab at the transition zone (Ringwood & Irifune, 1988). Izu-Bonin Subduction Zone A deflected slab also appears in the cross sections across Izu-Bonin trenches (Figures 3.4D and 3.5D), with the stagnant slab of 2000 km length. There is an obvious connection between the slab sinking from the Izu-Bonin Trench and the flattened slab to the west. In WEPP1 (Figure 3.4D) model, the stagnant slab at the transition zone looks like one long slab, where the Ryukyu slab appears connected to the Izu Bonin slab. But in WEPP2 (Figure 3.5D), the slab beneath the Izu-Bonin has stronger magnitude than the slab beneath the Ryukyu Arc and an apparent separation exists. Going southward, Figure 3.6 (line #1) displays a very different picture. In the P model, the slab beneath the Izu
53 42 Bonin extends below the 660 km depth. Line #1 (Figure 3.6) cross as the boundary between the Izu Bonin and Mariana subduction zones, so the anomaly beneath this section is more likely related to the Mariana subducting slab. Ryukyu Subduction Zone Beneath the Ryukyu Trench, the fast anomaly that associated with the Wadati-Benioff zone of the Ryukyu subducting slab is shown in the models by a contrast in lower velocities than for deeper slabs (Figure 3.5D). The observation that the Ryukyu Trench lacks fast anomaly agrees with previous tomography studies (Li and Romanowicz, 1996; Su et al., 1994). At shallower depths of most of the subduction zones, the slabs are surrounded by wide slow anomalies (red in the models). The slab-related fast anomaly is probably less obvious because the fast and slow anomalies tend to be canceled out through low-pass filtering (Fukao et al., 2001). Another possible cause may be the large size of the grid cells used in the global tomography inversion that was larger than the dimension of the lithospheric slab. Similar phenomena also appear at other subduction zones. Although weaker in magnitude than the fast anomaly beneath the Izu-Bonin arc, all models (Figure 3.4D, 3.5D) show the stagnant slab at the transition zone beneath the Ryukyu arc. At the western end of the stagnant slab, a part of the fast anomaly exists below the transition zone. It is consistent with the geological data that suggests subduction along the Ryukyu since Cretaceous time (Kobayashi, 1985).
54 43 Mariana Subduction Zone The magnitude anomalies beneath the Philippine Sea between the Philippine and Mariana Trenches are generally low velocity and discontinuous compared to small subducted-slab correlated high velocity anomalies. In the WEPP1 model (Figure 3.4E), below the Mariana Trench, the fast anomaly can be seen to below 670 km in depth. The anomalies are generally low in magnitude but Figure 3.5E shows a fairly distinct slab anomaly. Below the Mariana Arc, the WEPP2 model (top) shows apparent slab accumulation at and below the transition zone. It has apparently spread out beneath the 660 km depth. The P97 model (Figure 3.5E bottom) shows similar results. Widiyantoro s model shows a different pattern for the Mariana subduction zone (see Figure 3.6 line #2). The P model shows a few hundred kilometers of slab accumulation to the east and west of the Mariana Arc located beneath the 660 km depth. The subducting slab at the Wadati-Benioff zone appears more distinctly at Mariana subduction zones in the S model. The fast anomaly appears to the depth of 410 km and seems connected to the one at the transition zone. In the lower mantle (depth ~ km), there is also a large fast anomaly body beneath the Mariana, perhaps related to the current subducting slab. If that anomaly is an older part of the Mariana subducting slab, this infers that the subduction zone has been in its current location for a long time. Philippine Subduction Zone In WEPP1 model (Figure 3.4E), fast anomalies below the Philippine Trench at the depth of about 300 km spread to the depth of about 900 km. The same pattern as Mariana slab
55 44 can also be seen below the Philippine Arc in Figure 3.5E (both top and bottom). Two parts of slab accumulations appear at and below the transition zone. In the P model (Figure 3.6 line #2), a bit of fast stagnant anomaly is observed at the transition zone below the Philippine arc (south of Gagua Ridge). The subducting slab at the Wadati- Benioff zone appears at the Philippine subduction zones in the S model and stops at ~300 km depth, which is consistent with the hypothesis that the Philippine Trench only recently formed (Uyeda & McCabe, 1983). Java Subduction Zone As in other previous studies, no continuous fast anomaly is observed along the Indonesian Wadati-Benioff zone shallower than 660 km. However, a fast anomaly appears at the transition zone (Figures 3.4F and 3.5F) and penetrates the lower mantle to the depth of ~1200 km. This anomaly in the lower mantle dips to the north for a horizontal distance of ~2000 km and is ~500 km thick (see also Figure 3.6 line #3). There is also a strong fast anomaly at the Java trench to about 50 km in depth. It appears the Indian-Australia slab has been broken by the collision and non-subduction of Australia as proposed by Audley-Charles (1984). The cross section slice 3 in Figure 3.6 crosses the Java subduction zone, extends north parallel to the Philippine Trench, across the Ryukyu Trench, and through the Korean peninsula to the Asia continent. While the strong fast anomaly at the shallow upper mantle, for certain, belongs to Eastern Indonesian Indian-Australian Plate subduction, the slab at 660 km deep is ambiguous/complicated.
56 45 Others Cross sections #4 and #5 in Figure 3.6 are parallel to the Izu-Bonin and Mariana subduction zones and cut across the strike of the subducting slab. For instance, cross section #4 shows a small magnitude fast anomaly beneath the Mariana arc at the depth of 660 km, indicates a N-S varying dip of the Pacific subducting slab. As shown in lines #4 and #5 (Figure 3.6), a long N-S slab is present beneath the Southwest Japan Trench and Bonin Arc. This slab can be associated with the subducting Pacific Plate beneath the Izu- Bonin Arc and beneath the very northern Philippine Sea Plate. An important observation is that in other profiles, across the central and southern portion of the West Philippine Basin there is no evidence in the tomography for subducted slabs. Subducted slab beneath the central Philippine Sea is found only beneath the very northern central part of the basin, and it is clearly related to the Pacific Plate subducted at the Izu-Bonin Trench. Shallow Subducting Slab Shallow subducting slabs rarely appear as high velocity anomalies in tomography models although the existence of such slabs is evident from the earthquakes within the slabs. Current tomography models, as shown previously in the cross sections, often show only a contrast in relatively low velocity anomalies at the beginning of some subduction zones. At least two factors can help explain this. First, Widiyantoro s modeling of global tomography applied relatively large grids (2 o x2 o ) in the tomography inversion. Consequently, thinner slabs, such as the subducting lithospheric plates at the upper mantle, are not well resolved in the model. During the descent, the subducting slab experiences a thickening process with increasing viscosity (Karáson, 2002). Therefore,

57 Figure 3.7. Seismicity of the Western Pacific region. Color circles represent depth in km. We can consider the seismicity as the distribution of slab mass from the trench to the deepest earthquake s depth. 46
58 47 most slabs start to be detected more clearly at more than 300 km deep because their dimensions are large enough to be captured by the model. It is true especially at the transition region between 410 km and 660 km where the descent is apparently slowed by a factor of ~ 4, due to the high viscosity jump (Karáson, 2002; Grand 1994), allowing the slab to thicken. The second possible factor is that the relatively thin fast velocity slabs at shallow depths is usually surrounded by anomalously slow velocity mantle. In that situation, according to Fukao et al. (2001), the low-pass filtering in the modeling process cancels out or diminishes the fast anomalies expected for relatively thin, cold and high velocity plates in initial subduction. Wadati-Benioff zone earthquakes can be used to map subducting slabs at subduction zones at least down to the depths of 300 km (deeper in many zones). Figure 3.7 illustrates the seismic activity of the Western Pacific region. The color shades of circles indicate the depth of the earthquakes. The earthquake data for generating the figure was obtained from IRIS-NEIC (National Earthquake Information Center) for all depths with the magnitude of more than 5, spanning years 1970 to The seismicity data are incorporated with tomography models in the horizontal depth sections presented in the following analysis. Tomography and Seismicity Maps Figures 3.8 and 3.9 present the distribution maps of P and S velocity perturbations, as well as the seismicity, at various depths. From the top layer (150 km) down to 590 km, slabs at all existing subduction zones are defined by the tomography and/or earthquakes.
59 Figure 3.8. The P-wave velocity perturbation and seismicity maps. The bold numbers at the upper left corner are the depths of these horizontal maps. The scale is in % relative to ak
60 Figure 3.9. The S-wave velocity perturbation and seismicity maps. The bold numbers at the upper left corner are the depth of these horizontal maps. The scale is in % relative to ak
61 50 A wide spread slab to the west of Japan is shown at 465 km and 590 km deep (Figure 3.8 and 3.9) in both the P and S wave models. The large area of fast anomaly is located along the west of Ryukyu Trench area northward to the west of Japan, extending westward beneath the Eurasia Continent, extending as much as 2500 km north-south and being 1000 km wide (east-west). The P and S wave maps at the depth of 740 km also display a similar pattern of velocity distribution, even though it is not as extensive as at shallower depths. This anomalous mass is the westward extension of Pacific Plate subduction along the Kuril-Japan and Izu-Bonin subduction zones. A fast anomaly also extends between Korean Peninsula and Taiwan Island at the depths of 465 km 740 km. The zone between Korea and Taiwan and south to the northern Philippines may represent older subduction of the western margin of Philippine Sea lithosphere. At the 740 and 910 km deep of the P and S wave models (Figure 3.8 and 3.9), detect a fast anomaly beneath the Mariana Arc and the Izu-Bonin Arc and spreads to the south (Yap-Palau Trench), which represents subducted Pacific Plate. The 590 km deep and deeper anomalies that extended east-west beneath the Java Sea and as far north as beneath the Philippine Islands (South China Sea) and beneath the Caroline Basin area are likely Indian-Australian Plate subducted northward before the collision of Australia with the eastern Indonesia subduction zone. From all the maps at various depths, there is no apparent subducted slab material that exists beneath the central and southern West Philippine Basin. All fast anomalies found beneath current subduction zones, extend westward beneath the overriding plates, and can be associated with current subducting plates.
62 51 At the 740 and 910 km deep of the P and S wave models (Figure 3.8 and 3.9), detects a fast anomaly beneath the Mariana Arc and the Izu-Bonin Arc and spreads to the south (Yap-Palau Trench), which represents the Pacific subducting plate. The 590 km deep and deeper anomalies that extended east-west beneath the Java Sea and as far north as beneath the Philippine Islands (South China Sea) and beneath the Caroline Basin area are likely subducted Indian-Australian Plate subducted northward before the collision of Australia with the eastern Indonesia subduction zone. From all the maps at various depths, there is no apparent subducted slab material that exists beneath the central and southern West Philippine Basin. All fast anomalies found beneath current subduction zones, extend westward beneath the overriding plates, and can be associated with current subducting plates. Three Dimensional Slab Models Figures 3.10 and 3.11 present the 3-D views of the subducted slabs based on the P and S wave models, respectively. In these particular images, a slab is identified from a group of connected cells that (1) have anomalies of at least 0.3% and (2) contain at least one cell with anomaly of 0.9% or higher. This objective of this selection is the reasonable grouping of the anomalies to show the anomalies as slabs. The top picture in each figure displays the 3-D slab models as tetrahedron mesh plot with color-coded depth, and the bottom image provides the iso-surface of fast velocity perturbation. In the P-wave model (Figure 3.10), we can see the stagnant slab between 465 km and 740 km deep below East Asia that is associated subduction beneath Japan. In


63 Figure The 3-D view of the velocity perturbation at the Western Pacific region based on the P-wave model. The base of the diagram is 1500 km deep. 52


64 Figure The 3D view of the velocity perturbation at the Western Pacific region based on the S-wave model. The base of the diagram is km deep. 53
65 54 addition, the stagnant slab beneath the Ryukyu Arc appears deeper than beneath Japan. The Izu-Bonin-Mariana subducted slab appears at the depth of 740 km in the shape of the current subduction zone. From this particular point of view, we only see the upper part of the slabs, especially at the Japan region and to the west. However, horizontal maps (Figure 3.8) do not show any major fast anomalies beneath the 740 km deep either. In the S-wave model (Figure 3.11), the Izu-Bonin-Mariana subducting slab is visible to the depth of 910 km. The S-wave model detects the slab at the Core Mantle Boundary as well. We would expect a smaller velocity contrast at the bottom of the lower mantle due to heating of subducting slabs with depth. However, the anomalies shown in S model have quite high magnitudes. It is difficult to find the reasonable connection between the slabs at the bottom of the lower mantle with the slabs at the shallower depth, added the fact that there is a gap between them. The surface contouring image in Figure 3.11 (B) is complex, mostly because the fast anomalies in S-wave model are more sporadic and smaller (see Figure 3.9) and because the contrast threshold is probably too low. The lighter blue indicates the horizontal surface and the dark blue indicates the vertical features. This shows the steplike subducted slab bodies from the east coast of Asia to the west. In the east, the dark blue area between Izu-Bonin and Mariana Trenches represents subducted slab gap beneath the Philippine Sea. Some details of anomalies in the 3D tomography images may be artifacts, because the calculation process incorporates some interpolation.
66 55 Subducted Slab Distribution Map To further analyze the subducted slab distribution, the P-wave and S-wave models are interpreted and re-drawn as slab distribution, presented as a single map per layer. Figure 3.12 shows these maps. As already mentioned in previous sections, seismic tomography has a limited ability in representing mantle s velocity distribution due to variable ray path distribution and possible imperfections in the model. Some of anomalies maybe artifacts while some regions of subducted slabs probably may not imaged. Given these considerations, the distribution map is generated by selecting the high magnitude fast anomalies and for progressively deeper mantle, accepts lower magnitude anomalies that have geometric continuity with the more definitive anomalies. Wadati-Benioff zone earthquakes were also used to represent slabs in the upper mantle.


67 Figure Subducted slab distribution map. Light gray from seismicity, gray from P wave tomography, dark gray from S wave tomography. 56
68 57 CHAPTER IV SUBDUCTED SLAB ANALYSIS This chapter reviews what we know about geometries of subducted slabs, particularly horizontal components or so-called slab stagnation, the physical properties of subducting slabs and the mantle, and models for slab subduction. Of particular interest is what happens in the transition zone and at the 660 km phase change; whether or not slabs penetrate this boundary and what causes slab stagnation. There are many controversies regarding how the subducting slab can accumulate in the transition zone. In this chapter, we discuss four aspects of mantle properties and slab dynamics that may be related to slab stagnation: (1) the resistance in the transition zone due to the phase change, (2) rheology of the subducting slab that allows the slab to deflect, (3) rollback trench migration which could be either the result of or the cause of stagnant slab, and (4) horizontal mantle flow in the transition zone. These are then followed by analysis of the density distribution in the mantle and a review of the sinking rate of the subducting slab. Phase Change The major seismic discontinuities at 400 km and 660 km deep are not sharp boundaries but occur within ~30 km range (Shearer 2000; Wicks and Richards, 1993; Davies and Richards, 1992). Therefore, the discontinuities are supposed to indicate phase changes
69 58 instead of compositional changes, which it is generally assumed should be represented by sharp discontinuities. The part of the mantle between the 400 km and 660 km discontinuities is considered to be the transition zone. Fukao et al. (2001) assessed that the transition region is between 400 km and 1000 km deep. However, their theory is not generally accepted. Even though there are seismic studies that suggested another possible seismic discontinuity between km deep (Niu et al. 2003; Niu and Kawakatsu, 1997; Kawakatsu and Niu, 1994), it is minor compared to the upper mantle discontinuities. The upper mantle discontinuities have been shown to affect the physical properties of the subducting slab. Schubert et al. (1975) calculated the thermal structure of descending lithosphere, showed phase change displacements along the subducting slab and evaluated their importance for slab dynamics (Figure 4.1). The displacement of the phase boundaries results in buoyancy forces that strongly affect the sinking slab. The phase changes at the depth of 400 km and 660 km are different in character. Phase change displacement in subducting slabs is upward for the olivine-spinel phase change boundary at 400 km depth and downward at the spinel-perovskite phase change boundary at 660 km depth. The olivine-spinel phase change at 400 km is exothermic (releasing heat when the less dense olivine transforms to the more dense spinel), creating an extra load to the slab and contributing to pulling the subducting plate downward. The spinel-perovskite phase change at 660 km is endothermic (absorbing heat in transforming the less dense spinel into the more dense perovskite) and effectively contributes to slowing slab descent. At 660 km, the slab is still sinking under its own
70 59 weight but at a slower sinking rate than at 400 km deep, creating compression in between the phase change boundaries. Consequently, the slabs are flattened temporarily between the two phase-change boundaries. Slowly, after some mass accumulation above the 660 km phase boundary, the slabs should be pulled into the lower mantle (Ringwood and Irifune, 1988; Fukao et al., 2001; Christensen, 1996). The question is what are the rates and magnitudes of slab dynamics modification in response to the phase change. Figure 4.1. The thermal structure of descending slab. The heavy lines represent the phase changes. Elevation of the olivine-spinel phase change (410 km) resulted in the increase of body force and the depression of the spinel-perovskite phase change (660 km) resulted in the decrease of body force (Schubert et al. 1975).
71 60 Rheological Structure of Subducted Slabs Karato et al. (2001) argued that the subducting slab would not be able to bend unless the slab is in a weak condition. Yet, the definition of a weak slab is uncertain. Instinctively, the strength of slab depends on the slab temperature. A warmer material will be easier to deform than a colder one. However, that is not what we observe from various tomography models of subducted slabs. A relatively older and colder subducting slab along Japan arc appears to deform (deflect) in the transition zone. On the other hand, younger and warmer subducted lithosphere in the eastern Pacific penetrates the lower mantle (Grand et al. 1997). The previous section discussed how mantle phase changes generally influence the thermal structure of a subducting slab. The thermal perturbation associated with mantle phase transformations might change the grain size, crystal structure, and internal stress of the subducting slab (Castle and Creager, 1998; Bina et al. 2001; Karato et al. 2001; Karato, 2003). Mineral physics observations by Karato et al. (2001) suggest that both cold and warm slabs are weak. Warm slabs are weak because the viscosity is low and negative buoyancy forces are too small to cause penetration of the 660 km boundary, so the slabs may deform in the transition zone. Cold slabs are also weak and can be deformed due to the small spinel grain size and large external forces above the 660 km boundary. According to the results of Karato et al. (2001), only slabs that have an intermediate thermal parameter (i.e. moderately high) can apparently resist the deformation and can penetrate the lower mantle.
72 61 The Izu-Bonin and Mariana slabs, which are both the descending Pacific Plate, demonstrate the possibility for different deformation to occur within the same subducting slab. The tomography models show that those slabs behave differently. In particular, seismic tomography models indicate that the Izu Bonin subducting slab is stagnant in the transition zone while the Mariana slab does not show similar deformation. What causes those differences is inconclusive. We need to also consider the dynamic factors in the subduction process and the plate kinematics (e.g. trench migration, subduction rate, trench geometry) to find likely explanations for the differences we observe between the Izu-Bonin and Mariana subducted slabs. Trench Migration Many authors (e.g. Funiciello et al. 2003; Christensen, 1996; van der Hilst and Seno, 1993) have observed that there is a correlation between slab stagnation in the transition zone and trench rollback. Numerical and laboratory experiments suggest that the fast trench rollback has caused slabs to lie down in the transition zone (Griffiths et al., 1995; Christensen, 1996). Conversely, if the trench moves seaward very slowly or not at all, the associated slabs may be more likely to sink into the lower mantle. In addition, Christensen s mathematical modeling (1996) concluded that the age of slabs has no influence on penetration, contrary to Ringwood and Irifune s theory (1988) in that the older slab penetrates more easily into the lower mantle.
73 62 There are two theories about the origin of stagnant slabs. The first one, so-called was proposed by Fukao et al. (2001) and Karato et al. (2001), who According to this theory, the trench may migrate seaward (rollback) if the deflecting slab anchors in the transition zone. The second hypothesis is he laying down slab theory. This theory agrees that the phase boundary condition restrains the slab from penetration the lower mantle directly, but it emphasizes the importance of trench rollback migration as the cause of the slab to lie down in the transition zone (Christensen, 2001; Griffiths, et al. 1995). From these two theories arises the following question: is it the deflecting slab that causes trench rollback or is it trench rollback that causes slabs to lay down on the boundary? There is no satisfying answer to this question yet. However, there is an agreement to the facts that some slabs are stagnant in the transition zone and that the trench rollback migration has an important role in the descent of slabs. Figure 4.2 illustrates a laboratory experiment using dyed corn syrup to model the effect of trench migration on a subducting slab when it reaches the transition zone (Guillou-Frottier et al. 1995). In Figure 4.2 (a) (b), trench migration leads to the stagnant slab at about 660 km depth. When migration ceases (c), slab material accumulates and then sinks into the lower mantle (d). The illustration in (d) is comparable to the subducted slab beneath the Mariana arc. Tomography cross sections across the Mariana Trench (Figures 3.4, 3.5 and 3.7) indicate quite wide slabs beneath the 660 km discontinuity.
, then the rollback stops (c) causing the slab material to accumulate below the trench and later sink into the lower mantle (d).")
74 63 Figure 4.2. Corn syrup experiment (Guillou-Frottier et al. 1995). Initial rapid trench rollback leads to a flattened slab (a & b), then the rollback stops (c) causing the slab material to accumulate below the trench and later sink into the lower mantle (d). Figure 4.3 shows a different model, the result from numerical modeling by Christensen (2001). He used various rates of trench rollback, which resulted in different outcomes of subducting slab behavior when the slab met resistance in the transition zone. If the trench rollback rate is very small, the slab continuously penetrates the lower mantle (a). If the rate of the rollback is more than half of the subduction rate, the slab is flattened in the transition zone (b). In the case where the rollback rate has been increased with time, the leading edge penetrates the lower mantle followed by flattening of the slab (c). The penetration of the slab was held back when the rollback rate is slightly less than a half of subduction rate (d). Both experiments above show that trench rollback is necessary for slab stagnation. Nevertheless, the rheology factor may add the possibility of the deformation.
75 64 Horizontal Mantle Flow The other possible mechanism for slab stagnation is asthenospheric flow, which allows the slab to move horizontally above the 660 km phase boundary (Fukao et al. 2001). This possibility, although seemingly reasonable, is perhaps more uncertain. To date, a mechanism for lateral slab movement in the mantle is not well supported by either evidence, physical or theoretical models. Existing mathematical models for simulating the mantle flow did not consider a horizontal flow as a part of the calculation (e.g. Richards and Engebretson, 1992; Davies and Richards, 1992; Bercovici et al. 2000; Figure 4.3. Christensen s numerical modeling (Christensen, 2001). The plate velocity is 5 cm/yr. (a) trench migration 1 cm/yr, (b)trench migration 3 cm/yr, (c) trench migration has been increased with time, (d) trench migration 2 cm/yr.
76 65 Richards et al. 2000). The only broad agreement on a horizontal flow is for wholemantle convection that is tied to the plate motion model. The possibility of a layered mantle convection, which will allow the existence of horizontal flow beneath the transition zone, is still in dispute (Turcotte, 2003; Albarède and van der Hilst, 1999). Stratified convection (i.e. upper and lower mantle convections) is possible if there is a large viscosity difference between upper and lower mantle (Schubert et al. 2001). However, most studies conclude that the phase change between the upper and lower mantle is too small to restrain convection through the boundary (Morgan and Shearer, 1993; Machetel and Weber, 1991; O Nions and Tolstikhin, 1996). One reason for excluding the horizontal flow is the existence of hotspots. Hotspots move relatively very slow, and can be assumed as motionless on a 100 million year time scale (Lithgow-Bertelloni & Richards, 1998). This observation implies that slab deflection or stagnation is not caused by lateral mantle flow, independent of general mantle convection. Subducting slabs are part of the convection system. Density Distribution The slab of subducted lithosphere differs in composition, density, temperature and bulk composition from the mantle; any of these properties may affect slab seismic wave speeds. Seismic tomography models provide us the distribution of the seismic wave velocities, in which the seismic velocity anomalies represent anomalous bodies within the mantle. Nonetheless, we might gain some additional information about the subducted
77 66 slabs if we calculate the density distribution. Density can be calculated from velocity distribution of the tomography model using the Birch s linear law of correlation between the velocity of P-waves and density ( velocity density systematic ) for mantle: v = ρ (4.1) p with v p in km/s and ρ in g/cm 3. The equation above was developed with an assumption that mantle is chemically homogeneous with one common mean atomic mass. This is a reasonable assumption given that most mantle oxides and silicates have very similar atomic numbers (Birch, 1961). Figure 4.4 displays the density distribution in the mantle beneath and surrounding the Philippine Sea Plate calculated by the velocity-density systematic equation above from the seismic velocity distribution. The density distribution illustrates the lateral variation for each horizontal layer. As the correlation between velocity and density in the equation is linear, the distribution of both values can be expected as comparable. The density and tomography figures appear slightly different because of different scales used in the graphic presentation. The lateral density variation is very small, from 0.09 to 0.12 gr/cm 3 in the upper mantle and from 0.04 to 0.07 gr/cm 3 in the lower mantle. In general, the density distribution maps (Figure 4.4) more apparently display the mass of subducted slabs than do the velocity anomaly distribution maps. While the scaling used to present these results is the primary reason for the distinct contrast between more and less dense region, this exercise is included to illustrate the obvious


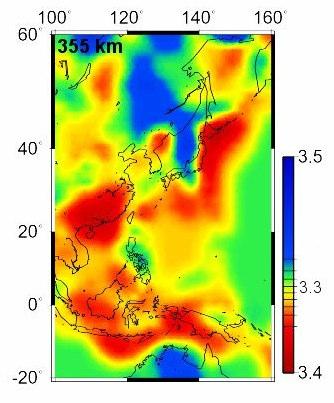


78 67 Figure 4.4. Density distribution calculated from seismic velocity perturbation. Scale is in gr/cm 3.
79 68 distribution of denser (subducted slab) regions. Subducted slabs are obvious beneath the Philippine Islands at 590 km deep, beneath the northern Philippine Sea Plate at 740 km and 1300 km deep, beneath the Caroline Ridge and Mariana Trench at 910 km deep, and beneath Japan and Eurasia to the west at all depths. These maps also clearly illustrate dominant long term and deep subduction of the Pacific and Indian-Australian Plates in the broader region. Sinking Rate of Descending Slab Knowing the age of a subducted slab that is located in a certain depth in the mantle is of great importance in the effort to trace the subduction history. The term age of a subducted slab here represents the period of time passed since the beginning of sinking of a slab (at the trench) to its present location in the mantle. However, our knowledge of the subducting slab rate is very limited. The age of a subducted slab at a certain depth can be estimated from the slab s sinking rate and dip angle. The sinking rate of a subducting slab can be influenced by factors such as the age/thickness of the lithosphere and the convergence rate of the plate. Dip angles in subduction zones also affect the time taken by slabs to reach a certain depth. Figure 4.5 outlines a simple method for calculating the age of a sinking slab at a certain depth if the sinking rate is equal to the present convergence rate. The subducted slab at x 1 has been subducting for T million years:
80 69 d T = (4.2) sinα V c where α is the dip angle of the Wadati-Benioff zone (the subducting slab) and d is the depth of the slab. x d α L t1 L t2 x1 Figure 4.5. A sketch for calculating the depth of a subducting slab. L is the distance from the trench to a certain depth of the subducting slab or the distance between two points where the plate has been moved from time t 2 to t 1. d is the depth, α is the dip angle and Vc is the convergence rate. Previous studies show that, due to the increased viscosity, the sinking rate of the subducting slab decreases with depth (e.g. Hager et al., 1995; Moresi and Gurnis, 1996). Lithgow-Bertelloni and Richards (1998), who developed a geodynamic model for 120 million years of subduction history, employed a sinking rate in the upper mantle similar to the plate convergence rate, but a reduced slab sinking rate by a constant factor in the
81 70 lower mantle. From a study of the Faralon slab and its subduction history, Grand (1994) suggested that the slab s sinking rate in the lower mantle is about 1.5 cm/yr or one sixth the rate as in the upper mantle. Additionally, a tomography study on the distribution of slabs in lower mantle suggested that an average sinking speed in the lower mantle is 1.7 cm/yr (Steinberger, 2000). The studies of the sinking rate mentioned above do not related to a particular age or thickness of the subducted slab. More recently, Karáson (2002) proposed a sinking rate model based on the numerical flow modeling method. His model involved the plate reconstruction of the Java subduction zone and a tomography model as references for his subduction flow modeling. The modeling result shows that the slab needs only ~ 5 million years to reach the 660 km deep but requires about 40 million years to reach 1400 km deep (Figure 4.6a). The sinking rate increases to the depth of about 400 km, where it reaches the maximum velosity of ~ 13 cm/yr. It then slows down to about 1 cm/yr at 660 km (Figure 4.6b). From 660 km to 1400 km deep, the rate slowly increases to about 2 cm/yr. This model is in accord with the phase change circumstances described in previous sections.
82 71 Figure 4.6. Sinking rate model (Karáson, 2002). (a) Depth to the leading tip of the slab as function of time before present. (b) Sinking rate of the leading tip of the slab for different depths
83 72 CHAPTER V SUBDUCTED SLABS BENEATH THE PHILIPPINE SEA PLATE In this chapter, we investigate how the properties and models discussed in Chapter IV apply to the subducted slabs beneath and surrounding the Philippine Sea. The purpose is to find the possible historical timeline of the subducting slabs and the past locations of the corresponding subduction zones. The definition of the age of the slab at a certain depth or the age of a subducted slab that will be used throughout this chapter is the period of time that slabs have been in subduction, for selected depths, since they began subduction at the trench. The Age of Subducted Slab This section analyses the depths and the ages of five major subducting slabs: Ryukyu Trench, Mariana Trench, Izu-Bonin Trench, Philippine Trench, and Japan Trench. Although a part of the Philippine Sea Plate boundary, the Yap Trench is not included because insufficient data is available and only a small amount of recent seismic activity has occurred along this arc. Specifically, seismicity of Yap subduction zone does not show any earthquakes deeper than 40 km and the Benioff zone of the Yap Trench consists of only several clusters near the surface. Hence, no significant evidence of a subducting slab is observed for this trench. However, previous studies suggest that the Yap Trench was a continuation of the proto-mariana Trench (e.g. Fryer et al., 2003;
84 73 Honza, 1995). Therefore, at least, until about ~25 Ma (before collision of the Philippine Sea Plate and the Caroline Plate) the Yap trench can be considered as a part of Mariana Izu - Bonin subduction zone. Table 5.1. Subducting slabs properties. Trench Lithohspheric Age (my) Thickness (km) Deep slab dip angle Convergence rate (mm/yr) Trench migration rate (mm/yr) Izu-Bonin Mariana Ryukyu Philippine Japan Age is based on the magnetic lineation closest to the trench. Thickness is calculated by 2.26 κt, where κ is thermal diffusivity coefficient (3.15x10⁻⁷ m 2 /s) and t is the lithospheric age. Slab dips are deduced from Wadati-Benioff zone. Convergence rates are from Kato (2003) and Michel et al. (2001). Trench migration rates are from Jarrard (1986) and Karato et al. (2001). Table 5.1 lists the properties of these subducting slabs derived from available information. The second column of the table presents the age of lithosphere at the trench, predicted based on the nearest magnetic lineation to the trench. Slab dip angles are measured by the slope of the Wadati-Benioff Zone obtained from seismicity. Convergence rates are acquired from GPS observation at several GPS sites at Mariana (Kato, 2003), Taiwan and Philippine Islands (Michel et al., 2001). The trench migration velocities were obtained from subduction parameters compilation and estimations by Jarrard (1986) and Karato et al. (2001). Convergence rate, as discussed earlier in previous chapter, is considered the most important factor in the sinking rate of subducting slab at the beginning of the plunge
85 74 down to the 660 km deep. Trench migration rollback rate adds to the rate of the sinking slab. Figure 5.1 illustrates a simple geometry of a subducting slab for calculating the slab s age at a certain depth. After T million years, the depth of the slab can be calculated as: ( Lc Lt) sinα with assumption that the dip angle is constant. d = + (5.1) Vt x t1 L t t2 α L c +L t d Vc x1 L c = Vc.T L t = V t.t sd = distance x to t1 Figure 5.1. An illustration of a subducting slab with trench rollback. α is the dip angle of the Wadati-Benioff Zone, Vc is convergence rate, Vt is trench migration rate. For the Japan Izu Bonin Mariana subduction zone, we use Pacific Plate absolute motion rates from the Hawaiian seamount chain to calculate the past convergence rate. Table 5.2 provides these data for islands and seamounts along the Hawaiian Ridge with their distances from Kilauea (presently an active volcano) and their
86 75 dated ages (Clague, 1996). The distances represent the length of subducting slab (Lc in Equation 5.1), which is the distance of the plate after moving for T million years at Vc convergence rate. Table 5.3 presents the calculated depths and ages of the Japan Izu Bonin Mariana subduction slabs, using the slab dip angles and trench migration rates from Table 5.1 and the data from Table 5.2. Table 5.2. The distance from Kilauea and age of Hawaiian hotspot chain volcanoes. Volcano Name Distance Lc (km) Age (my) Kilauea 0 0 West Maui West Molokai Waianae Kauai Nihoa Necker La Perouse Pinnacles Laysan Midway Distance is from Kilauea. Data source: Clague (1996). The history of the convergence rate of the Philippine Sea Plate along the Philippine and Ryukyu subduction zones are less known. At these subduction zones, their present convergence rates are used for estimating their slab ages at depth. The age of subducting slab T at a given depth d (less than 600 km) can be calculated as follows: T d = (5.2) ( Vc + Vt) sinα
87 76 Table 5.3. Depths and the ages of Japan Izu Bonin Mariana subduction zones. Depths are calculated using Equation 5.1. Age Subducting Slab Depth (km) (my) Length (=Lc) Izu-Bonin Japan Mariana At the depth of 660 km or more, the viscosity change has more impact on the sinking rate of the slab. From this transition zone down to the 1300 km deep, therefore, Karáson s (2002) sinking rate model is employed for estimating the ages of all subduction zones. As depicted in Figure 4.7, Vs (the sinking rate from Karáson) slowly increases from 1 cm/year at 660 km to 2 cm/year at 1400 km. Assuming that the increase of Vs is linear, its value at a depth d (between 660 km and 1400 km), denoted by Vs d, can be formulated by ( d 660) ( ) km 2 Vsd = 1 cm / yr + ( 2 1 ) cm / yr = ( d ) 10 km / my km (5.3) Starting from a calculated age at 660 km in depth, the slab age deeper than 660 km is extrapolated from the slab age previously calculated at the lower depth and the depth increment, or:
88 77 T t dt d = Tt 1 + Vs d t 1 t 1 (5.4) where d 0 = 660 km, T 0 is the slab age at d 0, and d t > d t 1. Table 5.4 shows the calculated slab ages for depths within the upper and lower mantle for subducting plates at the five main trenches if the slabs sinks continuously into the lower mantle (the case of stagnant slab will be discussed later). The depth in the first column has been aligned to the available depth in the tomography models described in Chapter III. For the Mariana, Izu-Bonin and Japan subduction zones, the slab ages at the Table 5.4. Depths and ages of subducting slabs. The shaded numbers are the approximate ages if the slabs continuously sink through 1300 km deep, which is not applicable for these cases. Depth Age (million years) (km) Mariana Izu-Bonin Ryukyu Philippine Japan * * * * *the estimated ages at the top (590 km) and the bottom (740 km) layer, at the corner of the stagnant slab
89 78 upper mantle are linearly interpolated from those given by Table 5.3. As an example, the age of Mariana slab at 150 km depth (0.8 my) is an interpolated value of this slab s ages from Table 5.3 for the depths of 0 km (0 my) and km (1.3 my). The slab ages in the Ryukyu and Philippine subduction zones in the upper mantle (Table 5.4) are calculated using Equation 5.2 (based on current convergence rate and trench migration rate), while all slab ages in the lower mantle rows are derived from Equation 5.4 (based on Karáson s model). Not all slabs sink through the mantle directly. In particular, some slabs are stagnant at the transition zone before proceeding to sink downward to the lower mantle. The tomography models in Chapter III and the slab ages in Table 5.4 suggest that the Izu-Bonin and Japan subducting slabs are stagnant above 740 km at 13 Ma and 20 Ma, respectively. It is well known that the Pacific Plate has been continuously subducted northward since Cretaceous and then northwest for about the last 50 Ma (Sharp & Clauge, 2002), implying that the deeper slabs (Izu-Bonin and Japan) also might have been stagnant since Cretaceous. This observation suggests that the estimated ages of these slabs at the depths of 590 km and 740 km, as shown in Table 5.4, are only applicable for the corner part of the slab where the slab is deflected to the horizontal position. The age for the far ends of stagnant slabs could be calculated by taking into account the horizontal movement of the subducting slabs in the transition zone, which poses a difficult problem because the mechanism and therefore rate of the horizontal slab movement in the transition zone is poorly known. In the following we attempt to estimate the age of the horizontal slab s leading edge based on the assumption that the
90 79 stagnant slab is caused by trench rollback and the slab is laying down (not moving horizontally). The rollback trench migration rate of the Japan Izu Bonin subduction zone is ~37 mm/yr (Table 5.1). Taking this migration rate into account, we can calculate the age of the horizontal slab s leading edge from the length of the stagnant slab. From the tomography cross sections and the horizontal maps (590 km and 740 km deep), the length of the Japan Izu Bonin stagnant slab measured as ~ km. Dividing this length by the rollback s rate, then the west end of the slab is about million years older than the deflected corner part of the slab. By incorporating the slab age when it arrived in the transition zone, the age of the leading edge of the stagnant slab is probably about million years. This age is probably under-estimated, because the slowing and thickening factors for the slab in the transition zone were not considered. Figures 5.2 maps the estimated slab ages on the subducted slab distribution for various depths. The slab distribution is developed based on fast anomalies with perturbation more than 0.3% of the P and S wave seismic tomography (Widiyantoro s model) and hypocenters of earthquakes from associated depth. In this figure, the ages of the slabs (small numbers) are superimposed on the corresponding slabs. Because of the difference in the convergence rate and the dip angle of the subducting slabs, the ages of the subducted slabs at given depth vary from one place to another. As expected, the transition zone at about 660 km creates a big jump in the age differences as the slabs are arrested in this zone for several million years before they
91 80 Figure 5.2. Subducted slab distributions with their approximate ages. Light gray, gray and dark gray are from seismicity, P wave tomography, and from S wave tomography, respectively. The bold numbers on the upper left corner are the depth in km. The small numbers are the approximate age of the subducted slab in million years.
92 81 continue to sink deeper to lower mantle. The ages of the anomalies in the lower mantle were only plotted for Mariana subducting slab with the assumptions that it is a continuation of the subducting slab from the upper mantle and that the slab continued to sink vertically. The accurate history of the fast anomalies buried in lower mantle without any connection to the present subducting slab is hardly known. There are two possibilities; the slab is a remnant of a former trench, unrelated to the present subducting slab, or the slab was previously attached to the present subducting slab, but mantle dynamics or some change in plate tectonics caused it to sink (Fukao et al., 2001). Because there is no evidence of extinct subduction zones in this region in the last 60 million years (if the slab had sunk continuously, the age of the slab at 1300 km deep is a little less than 60 Ma), all the fast anomalies in lower mantle will be considered as related to the current subduction zones. The subducted slab has been moving throughout history and the present subducted slab location is not necessarily the location of the subduction zone million years ago. Tracking the past trench location is useful for plate reconstruction. In this section, we attempt to estimate the past location of subduction zones. We employ the trench rollback factor for approximating previous trench locations relative to current position. Trench rollback involves the processes of slabs
93 82 both sinking downward and their lateral movement. Figure 5.1 illustrates the movement of a part of the subducted lithosphere. In the following approach we assume that the dip angle of the subducting slab is constant. The effect of thickening or the accumulation of the slab material at the transition zone is omitted. Suppose that in T million years the trench migrates with the migration rate Vt. Since the slab also sinks downward, the black dot on the lithosphere moves from t 1 to x 1 beneath the x point. In Figure 5.1, t 1 is the former location of the trench while x is the current position of the subducted slab at d km depth. Hence, the distance between t 1 and x measures the shifting distance of the former trench relative to the associated subducted slab. If the depth d of the subducted slab is known, then the shifting distance, denoted by sd, is sd = ( Lc + Lt) cosα Lt (5.5) where Lc = Vc. T and Lt = Vt. T. Table 5.5 summarizes the shifting distances of all subducting slabs at various depths, calculated using Equation 5.5 above. For instance, the dip angle of the Izu-Bonin subducting slab, as given in Table 5.1, is ~60 o. At 5 Ma (see also Table 5.4 for agedepth relationship), the former trench was about 149 km west of the 660 km deep Izu- Bonin slab. The shifting distance of Mariana subducted slab in upper mantle (at ~5 Ma) is very small because the dip angle is almost 90 o. It indicates that the former trench is probably located at about the same location as that of the current trench. The estimates at lower mantle are not applicable for Japan, Izu-Bonin and Ryukyu slabs, which are
94 83 stagnant at the 660 km boundary. Similarly, the Philippine subduction zone is still very young (Lewis & Hayes, 1983) so the subducting slab is not as deep as the others in the area and the estimation of its past location is limited down to 355 km depth. Table 5.5. Shifting distance of a subducted slab from its origin. Depth Shifting Distance (km) (km) Japan Izu-Bonin Mariana Ryukyu Philippine Positive value for seaward shifting, negative for landward. The distances are not calculated in lower mantle for stagnant slabs (Izu Bonin, Ryukyu, Japan) and for very young subduction zone (Philippine). Figure 5.3 illustrates the locations of the estimated past subduction zones (red dashed lines) based on the calculations in Table 5.5. These results are mostly in agreement with previous plate tectonic studies. For instance, the 41 my old subducted slab beneath the Mariana is relocated to ~500 km westward (see Figure 5.3, 1100 km deep map), which is about the location of the Palau Kyushu Ridge. The Palau Kyushu Ridge is believed an active island arc at Ma (Beccaluva et al., 1980). Still, beneath the Mariana arc, the ~14 my old subducted slab (Figure 5.3, 740 km deep map) is shifted to the location of the West Mariana Ridge, another remnant forearc that was
95 84 Figure 5.3. Possible past locations of the subduction zones. Black straight lines are current plate tectonics boundaries. Red dashed lines are predicted former trench location.
96 85 active at 20 9 Ma (Scott and Kroenke, 1980). Additionally, the estimated past locations of the Japan subduction zone (Figure 5.3, 150 km km deep map) are similar to the trench migration evolution based on the fixed hotspot model (Garfunkel et al., 1986) although this is limited to ~11 Ma because the older slab has been stagnant in the transition zone. Unfortunately, several slabs (such as the anomaly beneath the northern Philippine Sea Plate at 1300 km deep and the anomalies beneath the Caroline Ridge at the 910 km and 1100 km deep) cannot be plainly related to existing subduction zones. For these cases, their ages are not estimated. Their existence will be discussed in Chapter VI on the tectonic implication of the subducted slab analysis. Certainly, this method has weaknesses. There are several details that have been omitted: the subduction geometry that changes overtime (slab dip is likely not constant), the thickening of the slab during it s descend, and the effect of the transition zone on the slab s movement. We need a completely different method if we want to include all of those aspects. Nevertheless, the result of the current calculations is an important contribution to our research objectives.
97 86 CHAPTER VI DISCUSSION Tomography Constraints and Tectonic Implications Tomography and the subducted slab analysis presented in the previous chapters has led to several observations on the subducted slab distribution beneath and surrounding the Philippine Sea Plate that can be related to the regional tectonics. In this section we will discuss the distribution of subducted slabs with respect to current tectonic understanding and provide our interpretation of how the subducted slab distribution constrains reconstruction of the Philippine Sea Plate. Philippine Sea Plate Rotation The large rotation of the Philippine Sea Plate (90 o ) proposed to have occurred in a short period (~50 million years), as suggested by Hall (2002), seems unnecessarily complicated. The improbability of Philippine Sea Plate rotation can be observed from the tomography models. In particular, the lack of a remnant slab beneath the middle of Philippine Sea Plate is inconsistent with Hall s proposed reconstruction (Hall, 2002). According to Hall s reconstruction theory, the Izu-Bonin-Mariana subduction zone has moved over 20 o of latitude northward and rotated from an E-W orientation at ~50 Ma to an almost N-S trend currently (see Figure 6.1). If we consider the trench

98 87 Figure 6.1. The passage of the subduction zone in Hall s reconstruction (modified from Hall, 2002). Color lines represent the subduction zones at the indicated times. rollback migration has been the main influence on the motion of the Izu-Bonin-Mariana subduction zone, it should involve a stagnant slab in the transition zone that will create a large amount of subducted slab in the mantle beneath its passage. However, what we observe from the tomography models is only the stagnant slab of Izu-Bonin subducting slab beneath the north of the Philippine Sea Plate, not beneath the central and southern Philippine Sea Plate. The mantle of the subduction zone s hypothesized path according to Hall lacks any fast anomalies in the lower mantle (see Figure 3.8 and 3.9). Specifically, the tomography images do not show any subducted slab traces consistent with Hall s reconstruction.
USU 1360 TECTONICS / PROCESSES
 USU 1360 TECTONICS / PROCESSES Observe the world map and each enlargement Pacific Northwest Tibet South America Japan 03.00.a1 South Atlantic Arabian Peninsula Observe features near the Pacific Northwest
What Forces Drive Plate Tectonics?
 What Forces Drive Plate Tectonics? The tectonic plates are moving, but with varying rates and directions. What hypotheses have been proposed to explain the plate motion? Convection Cells in the Mantle
ANOTHER MEXICAN EARTHQUAKE! Magnitude 7.1, Tuesday Sept. 19, 2017
 ANOTHER MEXICAN EARTHQUAKE! Magnitude 7.1, Tuesday Sept. 19, 2017 Why is there no oceanic crust older than 200 million years? SUBDUCTION If new oceanic crust is being continuously created along the earth
10. Paleomagnetism and Polar Wandering Curves.
 Map of ocean floor Evidence in Support of the Theory of Plate Tectonics 10. Paleomagnetism and Polar Wandering Curves. The Earth's magnetic field behaves as if there were a bar magnet in the center of
Continental Margin Geology of Korea : Review and constraints on the opening of the East Sea (Japan Sea)
") Continental Margin Geology of Korea : Review and constraints on the opening of the East Sea (Japan Sea) Han-Joon Kim Marine Satellite & Observation Tech. Korea Ocean Research and Development Institute
Continental Margin Geology of Korea : Review and constraints on the opening of the East Sea (Japan Sea) Han-Joon Kim Marine Satellite & Observation Tech. Korea Ocean Research and Development Institute
Lab 1: Plate Tectonics April 2, 2009
 Name: Lab 1: Plate Tectonics April 2, 2009 Objective: Students will be introduced to the theory of plate tectonics and different styles of plate margins and interactions. Introduction The planet can be
Plate Tectonics. entirely rock both and rock
 Plate Tectonics I. Tectonics A. Tectonic Forces are forces generated from within Earth causing rock to become. B. 1. The study of the origin and arrangement of Earth surface including mountain belts, continents,
PLATE TECTONICS. Continental Drift. Continental Drift. Continental Drift. Continental Drift- Wegener s Evidence
 Continental Drift PLATE TECTONICS E.B. Taylor (1910) and Alfred Wegener (1915) published on Continental Drift. Continental Drift Wegener s evidence 1. Fit of the Continents 2. Fossil Evidence 3. Rock Type
Prentice Hall EARTH SCIENCE
 Prentice Hall EARTH SCIENCE Tarbuck Lutgens Chapter 9 Plate Tectonics 9.1 Continental Drift An Idea Before Its Time Wegener s continental drift hypothesis stated that the continents had once been joined
Prentice Hall EARTH SCIENCE
 Prentice Hall EARTH SCIENCE Tarbuck Lutgens Chapter 9 Plate Tectonics 9.1 Continental Drift An Idea Before Its Time Wegener s continental drift hypothesis stated that the continents had once been joined
Crustal Boundaries. As they move across the asthenosphere and form plate boundaries they interact in various ways. Convergent Transform Divergent
 Name: Date: Period: Plate Tectonics The Physical Setting: Earth Science CLASS NOTES Tectonic plates are constantly moving and interacting As they move across the asthenosphere and form plate boundaries
Continental Drift and Plate Tectonics
 Continental Drift and Plate Tectonics Continental Drift Wegener s continental drift hypothesis stated that the continents had once been joined to form a single supercontinent. Wegener proposed that the
Plate Tectonics. Structure of the Earth
 Plate Tectonics Structure of the Earth The Earth can be considered as being made up of a series of concentric spheres, each made up of materials that differ in terms of composition and mechanical properties.
A) B) C) D) 4. Which diagram below best represents the pattern of magnetic orientation in the seafloor on the west (left) side of the ocean ridge?
 B) C) D) 4. Which diagram below best represents the pattern of magnetic orientation in the seafloor on the west (left) side of the ocean ridge?") 1. Crustal formation, which may cause the widening of an ocean, is most likely occurring at the boundary between the A) African Plate and the Eurasian Plate B) Pacific Plate and the Philippine Plate C)
1. Crustal formation, which may cause the widening of an ocean, is most likely occurring at the boundary between the A) African Plate and the Eurasian Plate B) Pacific Plate and the Philippine Plate C)
2 The Geology and Tectonics of the Tohoku Region
 2 The Geology and Tectonics of the Tohoku Region Japan is part of the "Ring of Fire," the belt of earthquakes and volcanic activity that distinguishes the active margins of the Pacific Ocean from the passive
Plate Tectonics. Essentials of Geology, 11 th edition Chapter 15
 1 Plate Tectonics Essentials of Geology, 11 th edition Chapter 15 2 3 4 5 6 7 8 9 10 11 12 13 14 15 Plate Tectonics: summary in haiku form Alfred Wegener gave us Continental Drift. Fifty years later...
North America subducted under Rubia. Are there modern analogs for Hildebrand s model of North America subducting under Rubia?
 North America subducted under Rubia Are there modern analogs for Hildebrand s model of North America subducting under Rubia? In the Geological Society of America Special Papers Did Westward Subduction
Practice Questions: Plate Tectonics
 Practice Questions: Plate Tectonics 1. Base your answer to the following question on The block diagram below shows the boundary between two tectonic plates. Which type of plate boundary is shown? A) divergent
Full file at
 Essentials of Oceanography, 10e (Trujillo/Keller) Chapter 2 Plate Tectonics and the Ocean Floor Match the term with the appropriate phrase. You may use each answer once, more than once or not at all. A)
1. I can describe evidence for continental drift theory (e.g., fossil evidence, mountain belts, paleoglaciation)
") Science 10 Review Earth Science Vocabulary asthenosphere continental drift theory converging plates diverging plates earthquakes epicentre fault hot spot inner core lithosphere mantle mantle convection
Science 10 Review Earth Science Vocabulary asthenosphere continental drift theory converging plates diverging plates earthquakes epicentre fault hot spot inner core lithosphere mantle mantle convection
CHAPTER 2 THE WAY THE EARTH WORKS: EXAMINING PLATE TECTONICS
 CHAPTER 2 THE WAY THE EARTH WORKS: EXAMINING PLATE TECTONICS Coverage of plate tectonics is required early in introductory Geology as context for the mineralogy, petrology, structure, internal processes,
Chapter 2 Plate Tectonics and the Ocean Floor
 Chapter 2 Plate Tectonics and the Ocean Floor Matching. Match the term or person with the appropriate phrase. You may use each answer once, more than once or not at all. 1. hydrothermal vents A. convergent
Lecture Outline Friday January 12 Friday January 19, 2018
 Lecture Outline Friday January 12 Friday January 19, 2018 Questions?? Key Points for today The structure of the Earth Introduction to Plate Tectonic Theory and Convection Chapter 2 Development of the Plate
Geology 300, Physical Geology Spring 2019 Quiz Ch 19, Plate Tectonics Name
 Geology 300, Physical Geology Spring 2019 Quiz Ch 19, Plate Tectonics Name MULTIPLE CHOICE. Choose the one alternative that best completes the statement or answers the question. 1) The portion of a fracture
Chapter 2 Plate Tectonics and the Ocean Floor
 Chapter 2 Plate Tectonics and the Ocean Floor Chapter Overview Much evidence supports plate tectonics theory. The plate tectonics model describes features and processes on Earth. Plate tectonic science
Civilization exists by geologic consent, subject to change without notice William Durant
 89.325 Geology for Engineers Plate Tectonics Civilization exists by geologic consent, subject to change without notice William Durant Properties of the Planets Size Density Distance from sun Chemistry
Spatial and temporal evolution of the subducting Pacific plate structure along the western Pacific margin
 JOURNAL OF GEOPHYSICAL RESEARCH, VOL. 111,, doi:10.1029/2005jb003705, 2006 Spatial and temporal evolution of the subducting Pacific plate structure along the western Pacific margin M. S. Miller, 1 B. L.
OCN 201 Seafloor Spreading and Plate Tectonics. Question
 OCN 201 Seafloor Spreading and Plate Tectonics Question What was wrong from Wegener s theory of continental drift? A. The continents were once all connected in a single supercontinent B. The continents
5/24/2018. Plate Tectonics. A Scientific Revolution Unfolds
 1 Plate Tectonics A Scientific Revolution Unfolds 2 3 4 5 6 7 8 9 10 11 12 Chapter 2 Plate Tectonics From Continental Drift to Plate Tectonics Prior to the late 1960s, most geologists believed that the
Beneath our Feet: The 4 Layers of the Earty by Kelly Hashway
 Beneath our Feet: The 4 Layers of the Earty by Kelly Hashway The Earth is more than a giant ball made up of dirt, rocks, and minerals. The Earth may look like a giant ball from when looking at it from
Mountain Building. Mountain Building
 Mountain Building Mountain building has occurred during the recent geologic past American Cordillera the western margin of the Americas from Cape Horn to Alaska Includes the Andes and Rocky Mountains Alpine
The Lithosphere and the Tectonic System. The Structure of the Earth. Temperature 3000º ºC. Mantle
 The Lithosphere and the Tectonic System Objectives: Understand the structure of the planet Earth Review the geologic timescale as a point of reference for the history of the Earth Examine the major relief
Chapter. Graphics by Tasa Graphic Arts. Inc.
 Earth Chapter Plate Science 9 Tectonics Graphics by Tasa Graphic Arts. Inc. 1 I. Earth s surface is made up of lithospheric plates. A. Lithospheric plates are composed of the crust and part of the upper
Plate Tectonics: A Scientific Revolution Unfolds
 Chapter 2 Lecture Earth: An Introduction to Physical Geology Eleventh Edition Plate Tectonics: A Scientific Revolution Unfolds Tarbuck and Lutgens From Continental Drift to Plate Tectonics Prior to the
Full file at
 Chapter 2 PLATE TECTONICS AND PHYSICAL HAZARDS MULTIPLE-CHOICE QUESTIONS 1. What direction is the Pacific Plate currently moving, based on the chain of Hawaiian Islands with only the easternmost island
OCN 201: Seafloor Spreading and Plate Tectonics I
 OCN 201: Seafloor Spreading and Plate Tectonics I Revival of Continental Drift Theory Kiyoo Wadati (1935) speculated that earthquakes and volcanoes may be associated with continental drift. Hugo Benioff
Alfred Wegener gave us Continental Drift. Fifty years later...
 CHAPTER 2 Plate Tectonics and the Ocean Floor Plate Tectonics: summary in haiku form Alfred Wegener gave us Continental Drift. Fifty years later... Words Chapter Overview Much evidence supports plate tectonics
The anomalous high transverse ridge developed along a transform fault. Speaker: Yen-Fu Chen
 The anomalous high transverse ridge developed along a transform fault Speaker: Yen-Fu Chen Reference Anne E. Deschamps, Serge E. Lallemand, and Jean-Yves Collot, 1998, A detailed study of the Gagua Ridge:
Whole Earth Structure and Plate Tectonics
 Whole Earth Structure and Plate Tectonics Processes in Structural Geology & Tectonics Ben van der Pluijm WW Norton+Authors, unless noted otherwise 4/5/2017 14:45 We Discuss Whole Earth Structure and Plate
Plate Tectonics: A Unifying Theory
 Plate Tectonics: A Unifying Theory What is Plate Tectonics? - 7 large tectonic plates and many smaller ones that break up the lithosphere - Plates are brittle and float on asthenosphere and glide past
Essentials of Oceanography Eleventh Edition
 Chapter Chapter 1 2 Clickers Lecture Essentials of Oceanography Eleventh Edition Plate Tectonics and the Ocean Floor Alan P. Trujillo Harold V. Thurman Chapter Overview Much evidence supports plate tectonics
Convergent plate boundaries. Objective to be able to explain the formation and key features of these zones.
 Convergent plate boundaries Objective to be able to explain the formation and key features of these zones. Destructive plate margins When plates collide due to convection currents/slab pull in the asthenosphere
Questions and Topics
 Plate Tectonics and Continental Drift Questions and Topics 1. What are the theories of Plate Tectonics and Continental Drift? 2. What is the evidence that Continents move? 3. What are the forces that
Review participation point: The evidence for a fluid outer core is:
 DDA1 Continental Drift to Plate Tectonics PS 100 Chapter 28 Review participation point: The evidence for a fluid outer core is: A. Average density of the earth is greater than the density of the crust.
Dynamic Crust Practice
 1. Base your answer to the following question on the cross section below and on your knowledge of Earth science. The cross section represents the distance and age of ocean-floor bedrock found on both sides
Learning Objectives (LO)! Lecture 11: Plate Tectonics II! No Homework!! ** Chapter 3 **! What we ll learn today:!
! Lecture 11: Plate Tectonics II! No Homework!! ** Chapter 3 **! What we ll learn today:!") Learning Objectives (LO)! Lecture 11: Plate Tectonics II! No Homework!! ** Chapter 3 **! What we ll learn today:! 1. List the three types of tectonic plate boundaries! 2. Describe the processes occurring
Learning Objectives (LO)! Lecture 11: Plate Tectonics II! No Homework!! ** Chapter 3 **! What we ll learn today:! 1. List the three types of tectonic plate boundaries! 2. Describe the processes occurring
The Structure of the Earth and Plate Tectonics
 The Structure of the Earth and Plate Tectonics Agree or Disagree? 1. The Earth if made up of 4 different layers. 2. The crust (where we live) can be made of either less dense continental crust or the more
Introduction to Subduction Zones
 PAGEOPH, Vol. 128, Nos. 3/4 (1988) 0033~4553/88/040449-0551.50 + 0.20/0 9 1988 Birkh/iuser Verlag, Basel Introduction to Subduction Zones LARRY J. RUFF j and HIROO KANAMORI 2 Subduction zones present many
Introduction to Oceanography. Chapter 2: Plate Tectonics Overview
 Introduction to Oceanography Chapter 2: Plate Tectonics Overview Much evidence supports plate tectonics theory. The plate tectonics model describes features and processes on Earth. Plate tectonic science
Chapter Overview. Evidence for Continental Drift. Plate Tectonics. Evidence for Continental Drift. Evidence for Continental Drift 9/28/2010
 Chapter Overview CHAPTER 2 Plate Tectonics and the Ocean Floor Much evidence supports plate tectonics theory. Different plate boundaries have different features. Tectonic plates continue to move today.
Plates Moving Apart Types of Boundaries
 Plates Moving Apart Types of Boundaries PLATE TECTONICS IS The theory that the Earth s crust is broken into slabs of rock that move around on top of the asthenosphere. How fast are plates moving? The Arctic
Refer to the map on page 173 to answer the following questions.
 Chapter 8-1 Plate Tectonics 1. Brainstorm the type of evidence that would indicate a climate change and how this evidence supports the theory of continental drift. Tropical fossils in cold regions Evidence
Geology 101 Reading Guide for Plate Tectonics
 Geology 101 Reading Guide for Plate Tectonics Name The readings for plate tectonics will be in four different chapters: 2, 4, 10 and 11. If you have questions, please let me know. Chapter 2: Plate Tectonics:
6. In the diagram below, letters A and B represent locations near the edge of a continent.
 1. Base your answer to the following question on the cross section below and on your knowledge of Earth science. The cross section represents the distance and age of ocean-floor bedrock found on both sides
Introduction To Plate Tectonics Evolution. (Continents, Ocean Basins, Mountains and Continental Margins)
") Introduction To Plate Tectonics Evolution (Continents, Ocean Basins, Mountains and Continental Margins) Geo 386 (Arabian Shield Course) Dr. Bassam A. A. Abuamarah Mohanna G E O 3 8 6 A R A B I A N G E
Introduction To Plate Tectonics Evolution (Continents, Ocean Basins, Mountains and Continental Margins) Geo 386 (Arabian Shield Course) Dr. Bassam A. A. Abuamarah Mohanna G E O 3 8 6 A R A B I A N G E
3. The diagram below shows how scientists think some of Earth's continents were joined together in the geologic past.
 1. The map below shows the present-day locations of South America and Africa. Remains of Mesosaurus, an extinct freshwater reptile, have been found in similarly aged bedrock formed from lake sediments
12/3/2014. Plate Tectonics: A Scientific Revolution Unfolds Earth Science, 13e Chapter 7. Continental drift: an idea before its time
 Plate Tectonics: A Scientific Revolution Unfolds Earth Science, 13e Chapter 7 Stanley C. Hatfield Southwestern Illinois College Continental drift: an idea before its time Alfred Wegener First proposed
Global Tectonics. Kearey, Philip. Table of Contents ISBN-13: Historical perspective. 2. The interior of the Earth.
 Global Tectonics Kearey, Philip ISBN-13: 9781405107778 Table of Contents Preface. Acknowledgments. 1. Historical perspective. 1.1 Continental drift. 1.2 Sea floor spreading and the birth of plate tectonics.
Laboratory #7: Plate Tectonics
 Materials Needed: 1. Pencil 2. Colored Pencils 3. Metric/Standard Ruler 4. Calculator 5. Tracing Paper Laboratory #7: Plate Tectonics Plate Tectonics The Earth is composed of layers. At the center is a
The influence of short wavelength variations in viscosity on subduction dynamics
 1 Introduction Deformation within the earth, driven by mantle convection due primarily to cooling and subduction of oceanic lithosphere, is expressed at every length scale in various geophysical observations.
Chapter 4: Plate Tectonics
 Chapter 4: Plate Tectonics K2 in the Himalaya, inset round submersible (beneath the submarine) that went to the Marianas Trench in 1960 http://www.nydailynews.com/news/world/james-cameron-presents-record-setting-deep-sea-expedition-article-1.1215139
The Structure of the Earth and Plate Tectonics
 The Structure of the Earth and Plate Tectonics Structure of the Earth The Earth is made up of 4 main layers: Inner Core Outer Core Mantle Crust Crust Mantle Outer core Inner core The Crust This is where
Physical Geology, 15/e
 Lecture Outlines Physical Geology, 15/e Plummer, Carlson & Hammersley Plate Tectonics: The Unifying Theory Physical Geology 15/e, Chapter 19 Plate Tectonics Plate Tectonics Earth s surface is composed
Plate Tectonics: The New Paradigm
 Earth s major plates Plate Tectonics: The New Paradigm Associated with Earth's strong, rigid outer layer: Known as the lithosphere Consists of uppermost mantle and overlying crust Overlies a weaker region
UNIT 6 PLATE TECTONICS
 UNIT 6 PLATE TECTONICS CONTINENTAL DRIFT Alfred Wegner proposed the theory that the crustal plates are moving over the mantle. He argued that today s continents once formed a single landmass, called Pangaea
In the space provided, write the letter of the definition that best matches the term or phrase.
 Skills Worksheet Directed Reading Section: The Changing Continents 1. What is the result of slow movements of tectonic plates? RESHAPING EARTH S CRUST In the space provided, write the letter of the definition
General Oceanography Geology 105 Expedition 10 - Whole Lotta Shakin' Goin' On
 General Oceanography Geology 105 Expedition 10 - Whole Lotta Shakin' Goin' On Name Not attempting to answer questions on expeditions will result in point deductions on course workbook (two or more blank
How do we explain Wegener s observations? With the Theory of Seafloor Spreading. So, in which way was Wegener correct?
 So, in which way was Wegener correct? A. His hypothesis of Continental Drift was correct: continents move through the ocean basins. B. He was correct that continents move. C. He was correct that the continents
Plate Tectonics Unit II: Plate Boundaries (3.5 pts)
") T. James Noyes, El Camino College Plate Tectonics Unit II: The Plate Boundaries (Topic 11A-2) page 1 Name: Section: Plate Tectonics Unit II: Plate Boundaries (3.5 pts) Plate Boundaries We will now discuss
T. James Noyes, El Camino College Plate Tectonics Unit II: The Plate Boundaries (Topic 11A-2) page 1 Name: Section: Plate Tectonics Unit II: Plate Boundaries (3.5 pts) Plate Boundaries We will now discuss
Plate Tectonics. Continental Drift Sea Floor Spreading Plate Boundaries
 Plate Tectonics Continental Drift Sea Floor Spreading Plate Boundaries Continental Drift 1915, Alfred Wegener - Pangea hypothesis: suggested Earth s continents were part of a large super-continent 200
Plate Tectonics Lab II: Background Information
 Plate Tectonics Lab II: Background Information This lab is based on a UW ESS101 Lab. Note: Hand in only the Answer Sheet at the back of this guide to your Instructor Introduction One of the more fundamental
3. PLATE TECTONICS LAST NAME (ALL IN CAPS): FIRST NAME: PLATES
: FIRST NAME: PLATES") LAST NAME (ALL IN CAPS): FIRST NAME: PLATES 3. PLATE TECTONICS The outer layers of the Earth are divided into the lithosphere and asthenosphere. The division is based on differences in mechanical properties
LAST NAME (ALL IN CAPS): FIRST NAME: PLATES 3. PLATE TECTONICS The outer layers of the Earth are divided into the lithosphere and asthenosphere. The division is based on differences in mechanical properties
Unit 11: Plate Tectonics
 Unit 11: Plate Tectonics A. Alfred Wegner 1. Continental drift hypothesis a. single supercontinent called Pangaea b. 200 million years ago Pangaea (all land) began to break up and started drifting to their
GCSE Geology Plate Tectonics: Features and Processes
 GCSE Geology Plate Tectonics: Features and Processes A) DIVERGENT BOUNDARIES: 1. O-O Divergence, Example: The Mid-Atlantic Ridge, Iceland The North American and Eurasian Plates are moving away from each
Captain s Tryouts 2017
 Captain s Tryouts 2017 Dynamic Planet Test Written by: Araneesh Pratap (Chattahoochee High School) Name: Date: Answer all questions on the answer sheet. Point values are given next to each question or
Lecture 24: Convergent boundaries November 22, 2006
 Lecture 24: Convergent boundaries November 22, 2006 Convergent boundaries are characterized by consumption of oceaninc crust in subduction zones, with attendant arc volcanism, metamorphism and uplift.
12. The diagram below shows the collision of an oceanic plate and a continental plate.
 Review 1. Base your answer to the following question on the cross section below, which shows the boundary between two lithospheric plates. Point X is a location in the continental lithosphere. The depth
1. Name at least one place that the mid-atlantic Ridge is exposed above sea level.
 Interpreting Tectonic and Bathymetric Maps. The purpose of this lab is to provide experience interpreting the bathymetry of the seafloor in terms of tectonic and geologic settings and processes. Use the
SIO 226: Introduction to Marine Geophysics
 SIO 226: Introduction to Marine Geophysics Plate Tectonics Dave Chadwell Plate Tectonics, Sea-Floor Spreading and Continental Drift Main Parody Plate Geography Lineated Magnetic Anomalies in the Oceanic
Dynamic Earth A B1. Which type of plate boundary is located at the Jordan Fault? (1) divergent (3) convergent (2) subduction (4) transform
 divergent (3) convergent (2) subduction (4) transform") Dynamic Earth A B1 1. The edges of most lithospheric plates are characterized by (1) reversed magnetic orientation (2) unusually rapid radioactive decay (3) frequent volcanic activity (4) low P-wave and
Dynamic Earth A B1 1. The edges of most lithospheric plates are characterized by (1) reversed magnetic orientation (2) unusually rapid radioactive decay (3) frequent volcanic activity (4) low P-wave and
5: ABSOLUTE PLATE MOTIONS & HOTSPOTS
 5-1 5: ABSOLUTE PLATE MOTIONS & HOTSPOTS 1 Relative motions between plates are most important In some applications important to consider absolute plate motions, those with respect to the deep mantle ABSOLUTE
GENERAL GEOLOGY Fall Chapter 18: The Sea Floor. Partial Examination IV Study Guide Dr. Glen S. Mattioli
 GENERAL GEOLOGY 1113-005 Fall 2008 Partial Examination IV Study Guide Dr. Glen S. Mattioli Note that these are NOT questions, but rather are a list of topics that we have covered either in class or are
Chapter 02 The Sea Floor
 Chapter 02 The Sea Floor Multiple Choice Questions 1. One of the following is not one of the world's major ocean basins: A. Atlantic Ocean B. Arctic Ocean C. Indian Ocean D. Antarctic Ocean E. Pacific
The continental lithosphere
 Simplicity to complexity: The continental lithosphere Reading: Fowler p350-377 Sampling techniques Seismic refraction Bulk crustal properties, thickness velocity profiles Seismic reflection To image specific
Plate Tectonics. 1)The plate tectonic system 2)A theory is born 3) Early evidence for continental drift 4) Continental drift and paleomagnetism
The plate tectonic system 2)A theory is born 3) Early evidence for continental drift 4) Continental drift and paleomagnetism") Plate Tectonics Plate boundaries 1)The plate tectonic system 2)A theory is born 3) Early evidence for continental drift 4) Continental drift and paleomagnetism 6)History and future of plate motions system
Plate Tectonics Plate boundaries 1)The plate tectonic system 2)A theory is born 3) Early evidence for continental drift 4) Continental drift and paleomagnetism 6)History and future of plate motions system
The Theory of Plate Tectonics Name
 The Theory of Plate Tectonics Name Intermediate Version Block CHAPTER 1 INTRODUCTION 1. The scientific theory that describes the movement of Earth s outer layer is called. CHAPTER 2 CONTINENTAL DRIFT:
Earth Science Lesson 3 Dynamic Earth Processes (Grades 8-12 ) Instruction 3-3 Plate Boundaries
 Instruction 3-3 Plate Boundaries") As we told you in a recent Instruction, much of the Earth's lithosphere (its Crust and the top layer of its Outer Mantle) is made up of moving masses of rock called tectonic plates (tectonic means moving).
As we told you in a recent Instruction, much of the Earth's lithosphere (its Crust and the top layer of its Outer Mantle) is made up of moving masses of rock called tectonic plates (tectonic means moving).
Thermal Structure of Subducting Slab along the Java Arc and Its Significance to the Volcanoes Distribution
 ITB J. Sci. Vol. 42 A, No. 2, 2010, 127-134 127 Thermal Structure of Subducting Slab along the Java Arc and Its Significance to the Volcanoes Distribution Lina Handayani Research Center for Geotechnology,
Late 20 th Century Tests of the Continental Drift Hypothesis
 Late 20 th Century Tests of the Continental Drift Hypothesis 5 Characteristics of the Ocean Trenches Unless otherwise noted the artwork and photographs in this slide show are original and by Burt Carter.
UNIT 11 PLATE TECTONICS
 UNIT 11 PLATE TECTONICS A. ALFRED WEGENER 1. Continental drift hypothesis Single supercontinent called Pangaea 200 million years ago Pangaea (all land) began to break up and started drifting to their present
LAB: PLATE TECTONICS GOAL: Calculate rates of plate movement
 Name LAB: PLATE TECTONICS GOAL: Calculate rates of plate movement Rates of plate movement are calculated by measuring the distance rocks have moved since they formed. Rates are expressed in cm per year
Plate Tectonics - Demonstration
 Name: Reference: Prof. Larry Braile - Educational Resources Copyright 2000. L. Braile. Permission granted for reproduction for non-commercial uses. http://web.ics.purdue.edu/~braile/indexlinks/educ.htm
The Theory of Continental Drift. Continental Drift Discovery
 The Theory of Continental Drift Continental Drift Discovery The World ALFRED WEGENER THEORY OF CONTINENTAL DRIFT Found evidence for PANGAEA and proposed the theory of continental drift. Continental Drift
PLATE TECTONICS. SECTION 17.1 Drifting Continents
 Date Period Name PLATE TECTONICS SECTION.1 Drifting Continents In your textbook, read about continental drift. Circle the letter of the choice that best completes each statement. 1. Early mapmakers thought
Before Plate Tectonics: Theory of Continental Drift
 Before Plate Tectonics: Theory of Continental Drift Predecessor to modern plate tectonics Shape and fit of the continents was the initial evidence Snider-Pelligrini (1858) Taylor (1908) Wegner (1915) Fig.
Plate Tectonics on a Plane. Observations related to plate tectonics " " Plate tectonic theory types of plate boundaries!
 Plate Tectonics on a Plane Scripps Inst. Of Oceanography" Observations related to plate tectonics " Ocean and continent topography, hypsometry, and crustal thickness. Global seismicity, Benioff zones,
Earth s Continents and Seafloors. GEOL100 Physical Geology Ray Rector - Instructor
 Earth s Continents and Seafloors GEOL100 Physical Geology Ray Rector - Instructor OCEAN BASINS and CONTINENTAL PLATFORMS Key Concepts I. Earth s rocky surface covered by of two types of crust Dense, thin,
4 Deforming the Earth s Crust
 CHAPTER 7 4 Deforming the Earth s Crust SECTION Plate Tectonics BEFORE YOU READ After you read this section, you should be able to answer these questions: What happens when rock is placed under stress?
What Are Tectonic Plates?
 Plate Tectonics The theory that the Earth s outermost layer is fragmented into a dozen or more large and small plates that move relative to one another as they ride on top of hotter, more mobile material.
Foundations of Earth Science Seventh Edition
 Chapter 5 Lecture Outline Foundations of Earth Science Seventh Edition Plate Tectonics: A Scientific Revolution Unfolds Natalie Bursztyn Utah State University From Continental Drift to Plate Tectonics