The 2007 Stromboli eruption: event chronology and effusion rates using thermal infrared data
|
|
|
- Eunice Marsh
- 6 years ago
- Views:
Transcription
1 The 2007 Stromboli eruption: event chronology and effusion rates using thermal infrared data Calvari S. (1), Lodato L. (1), Steffke A. (2), Cristaldi A. (1), Harris A.J.L. (3), Spampinato L. (1), Boschi E. (1) (1) Istituto Nazionale di Geofisica e Vulcanologia, sezione di Catania (INGV-CT), Piazza Roma 2, Catania, Italy (2) HIGP/SOEST, University of Hawaii, 1680 East West Road, Honolulu, Hawaii, 96822, USA (3) Laboratoire Magmas et Volcans, Université Blaise Pascal, 5 Rue Kessler, Clermont Ferrand, France Abstract Using thermal infrared images recorded by a permanent thermal camera network maintained on Stromboli volcano (Italy), together with satellite and helicopter-based thermal image surveys, we have compiled a chronology of the events and processes occurring before and during Stromboli s 2007 effusive eruption. These digital data also allow us to calculate the effusion rates and lava volumes erupted during the effusive episode. At the onset of the 2007 eruption, two parallel eruptive fissures developed within the North East crater, eventually breaching the NE flank of the summit cone and extending along the eastern margin of the Sciara del Fuoco. These fed a main effusive vent at 400 m a.s.l. to feed lava flows that extended to the sea. The effusive eruption was punctuated, on 15 March, by a paroxysm with features similar to the 5 April paroxysm that occurred during the effusive eruption. A total of between 3.2 x 10 6 m 3 and 11 x 10 6 m 3 of lava was erupted during the 2007 eruption over 34 days of effusive activity. More than half of this volume was emplaced during the first 5.5 days of the eruption. Although the 2007 effusive eruption had a comparable erupted volume to the previous ( ) effusive eruption, it had a shorter duration and thus a mean output rate (= total volume divided by eruption duration) that was one order of magnitude greater than the event (~2.4 m 3 s -1 compared with 0.32±0.28 m 3 s -1 ). In this paper, we discuss similarities and differences between these two effusive events, and interpret the processes occurring in 2007 in terms of the recent dynamics witnessed at Stromboli. 1. Introduction Typical eruptive activity at Stromboli (Aeolian Islands, Italy, Fig. 1a-b) consists of persistent, mildly explosive events occurring every 5 to 20 minutes. Typically, these Strombolian events erupt small volumes of ejecta to heights of between 150 and 300 m above the active vents [Harris and Ripepe, 2007a] (Fig. 1c-d). The summit crater area (the crater terrace) is an elliptical depression ~300 m long and ~50 m wide (Fig. 1c). The crater terrace is at ~750 m a.s.l., which places it ~170 m below Il Pizzo (918 m a.s.l., Fig. 1c). The crater terrace comprises three craters, whose geographic position has remained remarkably constant over at-least 100 years [e.g. Washington, 1917; Calvari et al., 2005a, 2005b; Harris and Ripepe, 2007a]. Effusive eruptions at this volcano have a frequency of 5 to 15 years [Barberi et al., 1993], with lava flows erupted during the last two millennia being confined to the Sciara del Fuoco (SDF), a collapse scar on the NW flank of the volcano (Fig. 1b-c). 1
2 Since 2001, the monitoring of effusive and explosive eruptions at Stromboli has increasingly involved use of thermal imagery obtained from hand-held thermal infrared cameras. Data collected from fixed stations and helicopter-based surveys have played four roles. First, they have allowed checking of the temperature variations at, as well as the number, position and morphology of active vents within the crater terrace [Calvari et al., 2005a, 2005b; Burton et al., 2008], as well as the location and opening of eruptive fractures [Ripepe et al., 2009]. Second, they have allowed mapping of active lava flow fields and the development of lava flow features [Calvari et al., 2006; Lodato et al., 2007]. Third, they have been used to derive heat fluxes and effusion rates during effusive events [Harris et al., 2005b; Calvari et al., 2005a, 2005b; Lodato et al., 2007]. Fourth, they have been used to study the eruption dynamics during persistent explosive activity [Harris and Ripepe, 2007a; Patrick, 2007; Patrick et al., 2007; Zanon et al., 2009], gas puffing [Harris and Ripepe, 2007b], and paroxysms [Calvari et al., 2006; Harris et al., 2008]. Thermal camera s were used for the first time during an effusive event at Stromboli during the eruption. This eruption produced a number of different phenomena such as tsunami [Bonaccorso et al., 2003; Tinti et al., 2005], sliding of portions of the SDF [Tommasi et al., 2008], flank collapses and opening of fractures and eruptive vents [Bonaccorso et al., 2003; Calvari et al., 2005a, 2005b], paroxysmal explosive events [Calvari et al., 2006; Rosi et al., 2006; Harris et al., 2008], and emplacement of compound lava flow fields on steep slopes [Calvari et al., 2005a, 2005b; Lodato et al., 2007; Spampinato et al., 2008a]. The later stages of the eruption were characterized by low effusion rates (typically <1 m 3 s -1 ; Calvari et al., 2005a, 2005b; Harris et al., 2005b; Lodato et al., 2007] and a transition back to the typical strombolian activity experienced by Stromboli [Ripepe et al., 2005]. As a result of the event, monitoring systems deployed on the volcano were significantly expanded to allow improved forecasting capabilities in the event of new and potentially dangerous eruptive events. Consequently, instrumentation was in place and operational at the onset of the 2007 effusive event. The 2007 eruption began on 27 February 2007 and lasted 34 days until 2 April, and has previously been the topic of a Journal of Volcanogical and Geophysical Research special issue [Scandone et al., 2009] in which Barberi et al. [2009] provided a chronological overview of events. In this paper, we discuss the dynamics of Stromboli s 2007 effusive eruption providing a chronology of the events based on qualitative and quantitative analyses of thermal infrared images recorded by fixed web-cameras operated by the Istituto Nazionale di Geofisica e Vulcanologia, sezione di Catania (INGV-CT). Lava effusion rate is also a key parameter when forecasting maximum lava flow length and estimating volcanic hazard [e.g., Kilburn, 1993; Calvari and Pinkerton, 1998; Harris and Rowland, 2009], as well as in assessing the depressurisation state and eruption mechanisms operating during an effusive eruption [e.g., Wadge, 1981; Harris et al., 2000; Rowland et al., 2003]. We thus also present effusion rates calculated from thermal images acquired using Forward Looking InfraRed spectrometer (FLIR) thermal infrared cameras, as well as those estimated using two satellite-based sensors: the Advanced Very High Resolution Radiometer (AVHRR) and MODerate resolution Imaging Spectroradiometer (MODIS). 2. The INGV-CT thermal camera monitoring system at Stromboli During and following Stromboli s effusive eruption, the INGV-CT thermal monitoring system was greatly improved. As a result, during the 2007 effusive eruption, we were able to collect a high temporal 2
3 resolution thermal data set to allow assessment of the daily variation in eruptive events from the onset of the eruption. Here, we describe the camera network installed on Stromboli, the instrument characteristics and methodology, as well as use of helicopter- and satellite-based thermal imaging. All data were then used for near-real-time thermal surveillance of the eruptive events Web-camera network Prior to 2002, the INGV-CT camera network consisted of a visual camera located at Il Pizzo, a location at 918 m a.s.l. that overlooks the crater terrace (Fig. 1c). From this location the camera captured images for the entire crater terrace (~170 m below the camera location) over a downward looking line of sight with a camera-to-target distance of between 250 and 300 m (Fig. 1c-d). This enabled imaging of the explosive events, the estimation of the height attained by the products to a maximum limit of ~200 m (the upper limit of the image field of view), as well as discrimination between predominant ejecta types (ash, lapilli, bombs or blocks). Between the end of the effusive eruption and the onset of the 2007 eruption, the INGV-CT visual monitoring system was greatly improved with the installation of four additional cameras. These included one visual camera and one thermal infrared camera (SPI) at Il Pizzo, plus one visual camera (SQV400) and one thermal infrared camera (SQT400) at the 400 m elevation. The latter two cameras were located on the eastern flank of SDF ~800 m from the crater terrace. From this location the cameras provided a view of the NE crater and the eastern sector of SDF (Fig. 1c). This location is crucial because the eruptive fissures that opened during the last four effusive episodes (1975, , and 2007) breached the NE flank of the crater terrace [Capaldi et al., 1978; De Fino et al., 1988; Calvari et al., 2005a, 2005b; Marchetti et al., 2009] and thus fed activity in this sector. Additionally, on 12 March 2007 while lava effusion was still ongoing, a fifth thermal infrared camera was installed on the eastern margin of the SDF at the 190 m elevation (SCT190, Fig. 1c). From this location the number and position of active lava flows, as well as the development of lava flow field features, could be tracked. Thermal camera SPI is an OPGAL EYE-M320B, and SQT400 is a FLIR ThermoVision 320M. Both cameras are sensitive across the 8 to 14 µm waveband and have an uncooled microbolometer as the detector. Although they both give 320 x 240 pixel images, which we sample every 2 seconds, SPI has a 60 x 45 field of view (FOV) and SQT400 a 24 x 18 FOV. These correspond to pixel sizes of ~0.2 m over a minimum distance of 250 m (for SPI), and to 1.1 m at a distance of 800 m (for SQT400). The thermal infrared camera installed at the 190 m elevation (SCT190) was a FLIR A40. This gives an inclined view of the SDF and the zone of effusive vents over a mean distance of 300 m. The main difference between the OPGAL camera and the two FLIR cameras is that the OPGAL camera provides just a visual representation of the thermal infrared energy, whereas the FLIR cameras provide radiometric information, i.e., data are calibrated so that temperature information can be extracted for each pixel. All images also record date in the format dd/mm/yy and time in the format hh:mm:ss. All times are given in UTC Hand-held thermal imagery Ground-based thermal imaging was first used at Stromboli during a preliminary deployment at Il Pizzo in 2001 by Dehn et al. [2001]. Further deployments proceeded campaign style, with camera s being deployed 3
4 for a few days every year between 2001 and 2004 to examine the dynamics of the Strombolian eruptions [Patrick et al., 2007]. With the onset of the effusive eruption, as during the 2007 eruption, thermal surveys were performed daily using a FLIR S65 thermal infrared camera during helicopter flights organised by Protezione Civile Regione Siciliana and Protezione Civile Nazionale. These helicopter-based deployments are described in Calvari et al. [2005a, 2005b], Harris et al. [2005b] and Lodato et al. [2007]. During the 2007 eruption, such helicopter-based surveys occurred on at least a daily basis between 27 February 2007 and 6 May Like the permanently installed FLIR thermal infrared cameras, the S65 model used for the helicopterbased surveys consists of an uncooled microbolometer detector array sensitive across the 8 to 14 µm waveband. It has a 18 x 24 lens and provides 320 x 240 pixel images at up to 60 frames per second. The stated precision of the instrument is ±2%, and the thermal sensitivity is <0.08 C at 30 C. The S65 is equipped with an extra filter to detect maximum temperatures up to 1500 C, and can record data in one of three temperature ranges: -40 to 120 C, 0 to 500 C, and 350 to 1500 C. The camera software completes internal calibration and atmospheric correction, so that input emissivity, path length, air temperature and relative humidity allows output of apparent temperatures corrected for emissivity and atmospheric effects. While atmospheric parameters and path length are routinely measured during each thermal survey, we used an emissivity of 0.95, a value which is typical for basalt at Stromboli in the 8 to 14!m waveband [Harris and Stevenson, 1997]. Based on thermal measurements made during effusive eruptions at Etna, as well as on Stromboli during , we performed thermal surveys early in the morning to avoid solar heating problems [Calvari and Pinkerton, 2004], tried to capture images from the zenith position [Ball and Pinkerton, 2006], and repeated the same flight-path every day so as to obtain images that had comparable geometries [Calvari et al., 2005a, 2005b; Harris et al., 2005b]. Corrections resulting from pixel size differences due to varying distances to the target, estimated from the difference between the helicopter location obtained using onboard GPS and locations of known ground-control points, were applied following Harris et al. [2005b]. The method of Harris et al. [2005b] was also applied to estimate effusion rates from the thermal camera data. Apparent temperatures will still be affected by the presence of aerosols, volcanic gases, and airborne volcanic ash along the path length. This will result in an error in the estimate of true surface temperature [Calvari et al., 2005a, 2005b; Sawyer and Burton, 2006; Spampinato et al., 2008b, 2009]. 2.3 AVHRR and MODIS satellite thermal data For satellite-derived effusion rates we have used data from AVHRR and MODIS, two sensors flown on polar orbiting satellites capable of detecting hot spots due to volcanic activity as well as providing data, which can be applied to estimate the area, heat flux and effusion rate of active lava flows [e.g., Harris et al., 1997; Wright et al., 2001; Hirn et al., 2009]. Both detectors have previously been used to provide effusion rates for the and effusive eruptions of Stromboli by Harris et al. [2000, 2005b], Calvari et al. [2005a, 2005b], Ripepe et al. [2005] and Lodato et al. [2007]. For effusion rate extraction, all images were examined manually, so that radiances for all pixels identified as being thermally anomalous in images of suitable quality (no cloud cover) were extracted. Extracted radiances were then converted to effusion rate following the methodology of Harris et al. [1997] and as applied to AVHRR data for Stromboli by Harris et al. [2000] and Calvari et al. [2005a, 2005b]. The extraction process results in the generation of an effusion rate range for 4
5 each image within which the true, field-measured, value usually lies [see Harris et al. 2007b for full review and assessment]. Dragoni and Tallarico [2009] have recently reviewed the assumptions underlying the relationship between effusion rate and heat flux, with Harris and Baloga [2009] clarifying the methodology and assumptions as applied to low spatial resolution satellite data. Following Wright et al. [2001] and Harris and Baloga [2009], the extracted value relates to a time-averaged value, not to an instantaneous (effusion rate) value, so that time-averaged discharge rate is likely a better term for the derived value. 3. Explosive activity between the and 2007 effusive eruptions At the onset of the effusive eruption, the floor of the crater terrace collapsed to leave a ~50 m deep elongate crater. Explosive activity died out at the crater terrace during the first four months of the eruption, with the free-surface and explosive activity recovering as the rate of effusion declined [Ripepe et al., 2005]. As a result, by the end of the effusive eruption (in July 2003) strombolian activity had resumed at the crater terrace. Following the effusive eruption, persistent explosive activity generated spatter, scoria and ash that steadily filled the collapse feature that had formed at the onset of the effusive event. Thus, the elongate crater evolved into a platform on which hornitos and cinder cones developed. To achieve this fill we estimate that an approximate volume of 1.5 x 10 6 m 3 of material had to have been deposited between July 2003 and February 2007, resulting in a mean fill rate of ~0.01 m 3 s -1. It is worth noting that, as described in previous papers [e.g. Washington, 1917; Calvari et al., 2005a, 2005b; Harris and Ripepe, 2007a], the position of the active vents has remained almost constant during the last century, even after major morphological changes such as the collapse events of and subsequent refilling by tephra. The rate of explosive activity, and hence filling of the collapse feature, was not constant with time. To obtain a semi-quantitative description of the eruptive activity during this time, we used the images recorded by camera SPI (which views the entire crater area) to calculate a daily mean for the number of explosions per hour. To do this we simply counted the total number of events observed during each day of cloud-free observation, and divided by 24 hours. Figure 2 shows the pattern of explosive activity from 24 October 2003 until the onset of the 2007 eruption. The period between 17 September 2006 and 21 January 2007 lacks data owing to camera malfunction. A few peaks, when the number of explosions reached 10 to 18 per hour, can be identified between the end of October 2003 and February After this we observe a stable level, with the number of explosions remaining below 10 per hour from the end of March 2004 until November- December During January 2005 the average number of explosions increased to between 25 and 30 per hour. Between March 2005 and the onset of the 2007 eruption, a general increasing trend in the number of explosions per hour can be observed. This is punctuated by five peaks in December 2005, January 2006, April 2006 (01/04/06), July 2006 (15/07/06) and 16 February 2007 (16/02/07). The number of explosions increased to a climax of between 25 and 30 explosions per hour twelve days before the start of the 2007 eruption (Fig. 2). These values compare with a typical rate of 8-9 explosions per hour [Harris and Ripepe, 2007a; Ripepe et al., 2009]. 4. Chronology of the eruption 5
6 Onset of the 2007 effusive activity Between the end of December 2006 and February 2007, an increase in volcanic tremor was recorded by the Osservatorio Vesuviano (INGV-OV) seismic network. In addition, the frequency of VLP (Very Long Period) seismic events increased, with event locations clustered at ~200 m below the summit craters [Martini et al., 2007], a location typical for Stromboli [Chouet et al., 2003]. In January 2007, the ground-based linear synthetic aperture radar (GB-InSAR), installed on the eastern flank of the SDF, showed a progressive acceleration in the deformation on the NE crater [Casagli et al., 2009]. In addition, tremor, pressure recorded by infrasonic sensors and the number of explosive events per hour began to increase from January onwards [Ripepe et al., 2009]. By the first half of February deformation had spread to also involve the upper portion of the SDF [Casagli et al., 2009]. When the eruption began on 27 February 2007, the deformation rates recorded by the GB-InSAR were higher than the measurement capability of the radar device [Casagli et al., 2009]. At ~9:00 on the same day and about four hours before the start of the onset of effusive activity, the INGV-OV seismic network recorded several signals associated with landslides, sometimes superimposed on the volcanic tremor [Martini et al., 2007]. Landslides continued during the next few hours, and at 12:39 a stronger landslide was recorded [Martini et al., 2007]. An effusive fracture was then observed as opening within the northern rim of the NE crater at 12:49, with the fracture quickly propagating NE [Marchetti et al., 2009]. An air-based thermal survey using the helicopter of Protezione Civile Regione Siciliana was promptly arranged. As a result, the initial effusive phases of the 2007 eruption could be reconstructed from the images recorded by the INGV-CT webcameras as well as from thermal images collected during the helicopter surveys carried out during the afternoon of 27 February. Early on 22 February 2007, just before the onset of effusive activity, explosive activity was almost continuous at the NE and Central craters (Fig. 1d), with more than 20 events per hour (Fig. 2). Images recorded by SPI at 10:38 on 27 February, showed an elongate thermal anomaly consistent with the development of a fracture that, after 11:40, propagated gradually NE from vent bn 2 towards bn 1 (Fig. 3a-b). This was accompanied by an increase in the intensity of explosive activity within the SW crater with explosions reaching ~200 m above the vents. The bs 1 vent of the SW crater (Fig. 1d) was a hornito-like structure producing jets of spatter, and vent bs 2 (Fig. 1d) fed ash-rich explosions without incandescent ejecta. Ash emissions from bs 2 always followed explosions from the Central and NE craters. At 12:01 a small portion of the bn 2 hornito collapsed (Fig. 3b). After ~12:00, explosions at vent bn 1 were persistent and ballistics reached heights up to a few meters, resulting in fast accumulation of spatter around the vent. At 12:23, SQT400 revealed a persistent hot spot on the NE rim of bn 1. This marked the continuation of fracture propagation between bn 2 and bn 1, with the fracture system now extending to the outer rim of the crater terrace. At the same time, a second fracture opened within the NE crater, developing parallel to the previous fracture. By 12:24 the vent bn2 was emitting a small lava flow. This flow remained confined within the NE crater, ponding in the saddle between vents bn 2 and bn 1 (Fig. 3c). At 12:32, a second hot spot appeared on the NE crater rim marking the intersection of the second fracture with the outer rim of the crater terrace. Analysis of 6
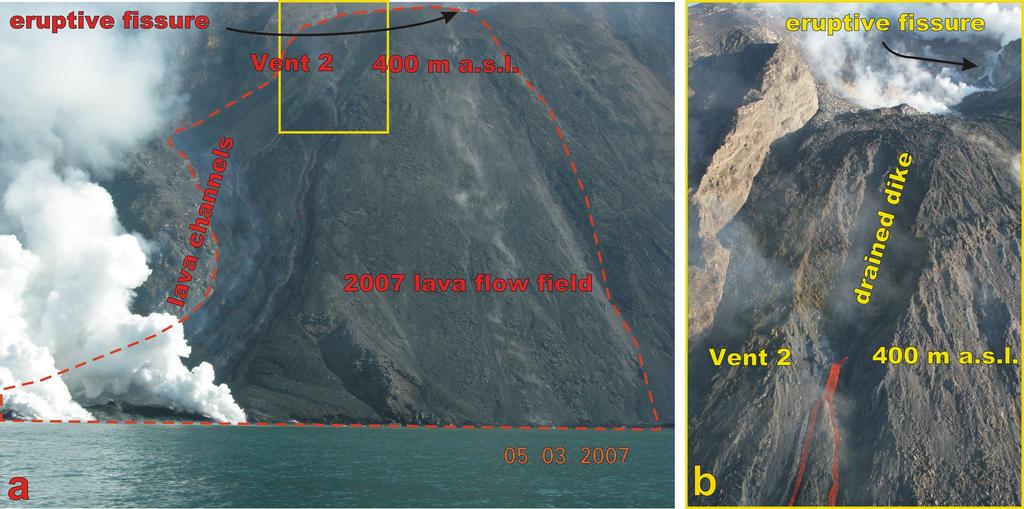
7 data recorded by camera SPI allowed us to assess the direction of fracture development. The first and northernmost fissure within the NE crater propagated NE (i.e., from bn 2 to bn 1 ), whereas the southernmost fissure opened later and propagated SW (i.e., from bn 1 to bn 2 ). Between 12:32 and 12:43, both fractures propagated towards the NE, with propagation being accompanied by explosions, and by gas/steam emission from the NE crater that eventually obscured visibility at SPI. At 12:48, SQT400 captured the opening of a vent (Vent 1, Fig. 1c and Fig. 3d) and the emplacement of a lava flow (Fig. 3e) on the lava shield (Pianoro) located on the upper SDF at ~650 m a.s.l. This fed the first lava flow (FL1, Figs. 3e-i, 4, 5) that was emplaced northwards down the SDF. By 12:59 this had spread across the break in slope at the top of the SDF (Fig. 3f-g) and reached the sea around 13:03, when SQV400 showed a vapour cloud rising above the sea entry (Fig. 3h-i). This means that the flow travelled a distance of 1.2 km (the distance from the vent to the coast) in 15 minutes, so that the mean speed of the flow front was ~1.3 m s -1. This lava flow emplaced on the >30 steep SDF slope, and its velocity was comparable with the 28 December 2002 lava flow reported by Lodato et al. [2007]. Lava flow emplacement was accompanied by little landslides that were active on the SDF at any elevation below the summit craters (Fig. 4). FL1 was fed at least until 15:00. Explosive activity at bn 1 lasted until 12:56, when activity at this vent died out. At 13:05 the rapidly deposited spatter around bn 1 collapsed to form a small landslide of hot debris, as revealed by SQT400. At 12:48 and 13:32, single bursts of hot gas were observed at the base of the eruptive fissure on the Pianoro and then along the NE fissure until 13:25. After 13:32, no more explosive activity occurred either at the summit craters or at the base of the eruptive fissure (~650 m a.s.l.). At 14:57, a new lava flow (FL2, Fig. 4) was erupted from the base of the NE fissure. This initially spread across the Pianoro. At 15:01, this flow descended the steep slopes on the eastern margin of the SDF to reach the sea in just a few minutes, where it generated a second sea entry and associated vapour cloud. With the formation of FL2, supply to FL1 ceased and this flow began to cool. At 15:35 a third lava flow (FL3) appeared in a central position between the two previous flows. This was probably an overflow from the main channel formed along FL2 (Fig. 4). Evidence for this is the fact FL3 had already stopped moving at 15:44. Channel overflows are usually short-lived [e.g., Bailey et al., 2006; Harris et al., 2009], so that the short life of this flow appears to support it s origin as an overflow. After 16:00, all three lava flows appeared to be no longer supplied and were cooling. Although incandescent blocks detaching from the margins still exposed the hot inner portions of the cooling flows (Fig. 5a-b), a thermal helicopter survey at 16:30 showed FL1 to be cooling and surrounded by landslides. At the same time FL2 was only slowly moving, although the incandescent front of FL3 was visible between dust clouds, and two vapour columns were apparent where flows were entering the sea (Fig. 4). Between 16:00 and 18:00, SQT400 showed glow, possibly due to weak explosive activity within the SW crater of the crater terrace. Between 18:00 to 18:36, a small and slow moving lava flow was emplaced over FL3 and FL2, but activity appeared to be waning Effusion from the 400 m vent (Vent 2) 7
8 At 18:25:59 on 27 February, a thick ash and vapour column was recorded by SQV400 (Fig. 5a-f). This heralded the opening of a new effusive vent on the SDF at the 400 m elevation (Vent 2, Fig. 1c). The opening of this vent was recorded also by SQT400 that imaged initial explosions from this site immediately followed by the formation of hot debris flows. As also occurred in [Pioli et al., 2008], debris reached the sea within a few minutes, forming a dense vapour cloud that obscured visibility. At 18:25:59, SQV400 recorded the first lava flow (FL4, Fig. 5c-e) erupted from this vent. This flow reached the sea within minutes. After 19:00, vigorous, pulsing, degassing started at Vent 2 (Fig. 1c). This become more vigorous with time. At 20:34:02, SQT400 recorded a sudden gas explosion in the area of Pianoro. The apparent effusion rate from Vent 2, evaluated on the basis of the glow observed from SQV400, dropped on 28 February after 1:38. This was matched by a decline in the frequency of gas pulses from the same vent. Between 04:00 and 05:00, Vent 2 deepened by a few meters, so that it was no longer visible from SQV400, with this camera just showing the gas cloud released from the vent to be spreading southwards. On 28 February, a helicopter-based thermal survey at ~08:30 revealed a depression just above Vent 2, and a number of degassing fractures on Pianoro, just at the base of the NE crater (Fig. 6a-b). Vent 2 remained active until the final day of the eruption on 2 April, with lava emitted by Vent 2 accumulating along the shore to significantly modify the coastline, forming a bench that extended seawards by several tens of meters. This bench was particularly prominent in early March Collapses within the crater terrace, 4-9 March From 4 March, large blocks were seen falling from the crater rim to the crater floor. Onset of rock fall activity could have been earlier, but could not be confirmed due to poor weather conditions which hampered visual and thermal observations. By this time, a field of concentric, arcuate fractures had also opened around the craters. Rock falls became more common in the following days to cause a significant widening of the crater rim and a thick accumulation of debris on the crater floor. At the same time there was a visible widening of the concentric fractures surrounding the craters. Rock falls were mostly concentrated around the NE crater. Images from SPI showed how this rock fall activity modified the profile of the crater rim (Fig. 7a-c), especially at the NE sector (in the foreground of Fig. 7c) whose rim became sufficiently low to allow viewing inside the crater. A helicopter-based thermal survey on 7 March showed that the fractures were beginning to extend into the craters, following the main (NE-SW) structural trend of the island. The fractures evolved rapidly during the next two days, when large blocks collapsed into the craters to form a thick pile of debris on the crater floor. The volume of material accumulated on the crater floor through collapses was estimated at 1-2 x 10 6 m 3 [Neri and Lanzafame, 2009]. Deep explosive activity from below the debris deposit continued to occurr, with rock falls within the craters often accompanied by ash emissions and gas-rich explosions from the vents still active below the 8
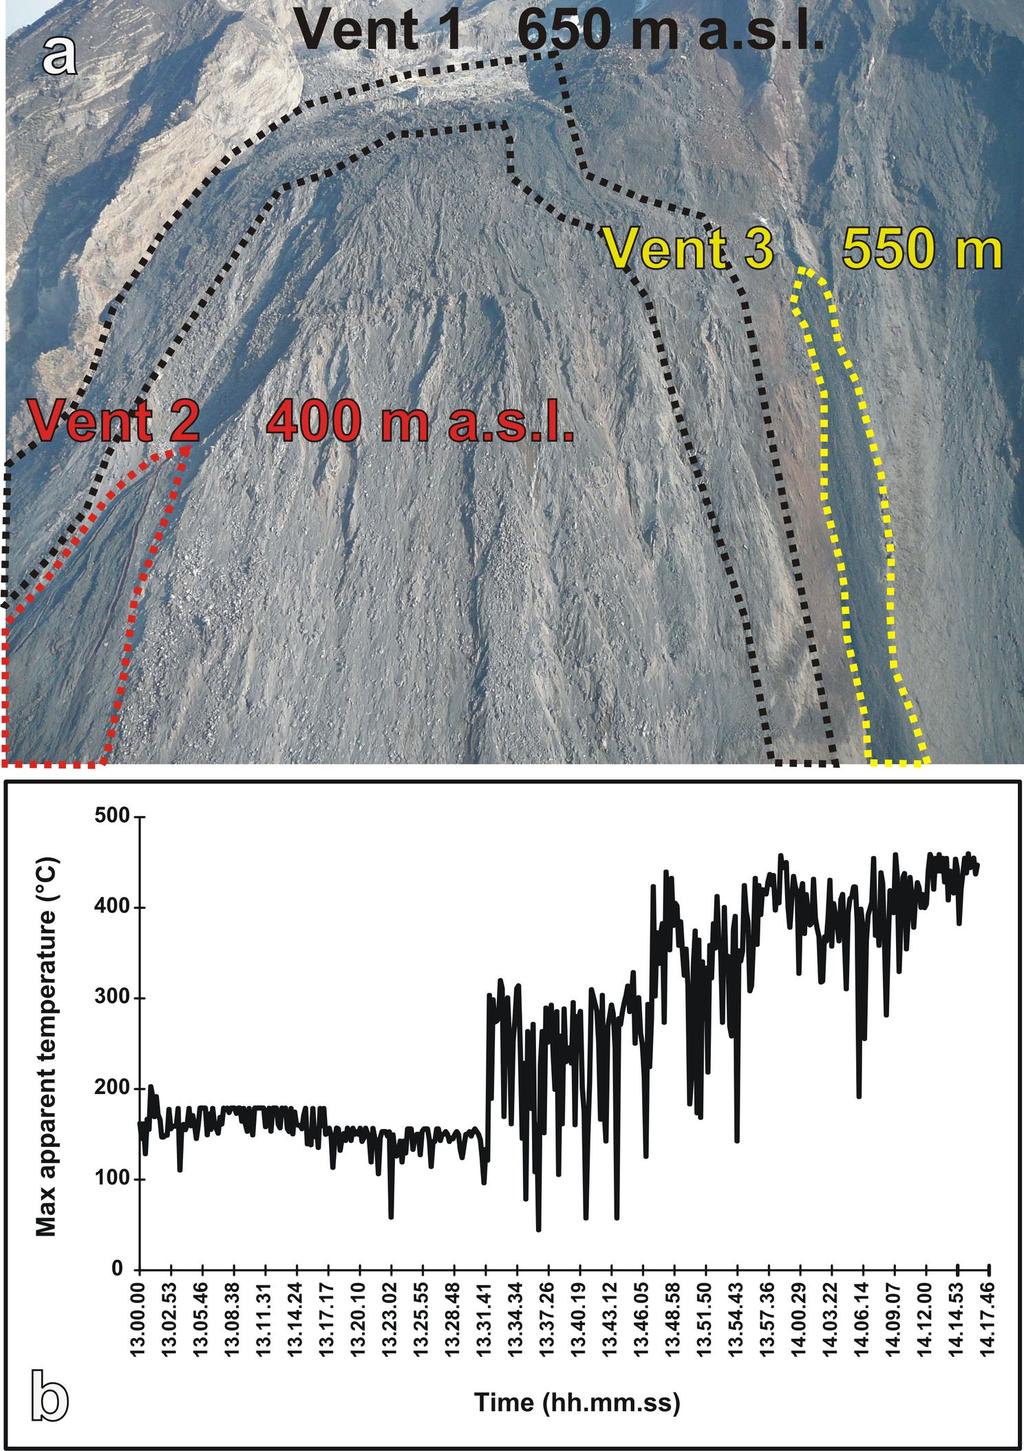
9 debris carpet. No change was observed in the position of the vents within the crater terrace when compared to the pre-eruptive distribution. The persistence of explosive activity at the crater terrace suggested that magma was still present at a shallow depth below the debris carpet, and that the debris was not causing complete obstruction of the vents. Collapses continued even after the end of the effusive eruption, persisting at least until the end of June Shut down of Vent 2, development of the 550 m elevation vent (Vent 3), and reactivation of Vent Between 7 and 8 March, the output rate from Vent 2 decreased, with effusion from this vent completely shutting down on the afternoon of 8 March. On 9 March a new vent (Vent 3, Figs. 1c and 8a) opened at 550 m a.s.l. on the N flank of the NE crater, in the same position as the 550 m elevation vent of the eruption as mapped by Calvari et al. [2005a, 2005b]. A few minutes before 15:00 on 9 March, the Guardia di Finanza Guides reported rock falls, landslides and gas emissions coming from the middle of the SDF, where Vent 3 soon opened to immediately feed lava flow. Analysis of the thermal images recorded by SQT400 allowed us to plot maximum apparent temperature against time for the lower portion of the SDF (Fig. 8b). Although the area covered by the camera did not include the location of Vent 3, which was behind the lava flow field, Figure 8b shows a sudden increase in maximum apparent temperature at 13:31:55, with values of ~300 C. This increase we attribute to the presence of lava fed from Vent 3. Lava reached the sea at 17:43, giving rise to a thick vapour cloud. Vent 3 remained active for less than 24 hours. While Vent 3 was closing down, effusive activity at Vent 2 renewed. Vent 2 remained active until 2 April, when the eruption ceased in the early afternoon. Vent 3 produced just a narrow lava flow in the middle of the SDF (Figs. 1c and 8a). This lava flow soon disintegrated so that it was no longer visible just a few days after its emplacement. Such crumbling behaviour and volume loss is typical of lava flows emplaced on Stromboli s steep slopes [Lodato et al., 2007]. The steep topography and the loose, fine-grained material that made up the surface at this location accelerated the disintegration of the flow. The location of the flow was also rapidly covered by debris tumbling from sources located higher on the SDF, as was observed during the eruption [Calvari et al., 2005a, 2005b] The paroxysm of 15 March On 15 March, while lava output from Vent 2 was still ongoing, a major, paroxysmal, explosion occurred at 20:38:16 from the crater terrace. The explosion was recorded by the three INGV-CT web-cameras installed on the upper part of the volcano; each offered different views and details of the event (Fig. 9). Camera SPI gave a good overall view of the vents within the crater terrace with a frame rate of 2 seconds (Fig. 9a-d) but, being ~250 m away from the vents, was soon destroyed by fallout from the eruption cloud. However, it showed that the explosion started with small volume collapses from the inner crater rim and emission of a dilute ash cloud (Fig. 9a). Two seconds later a dense, hot cloud of bombs, lapilli and lithics was erupted from 9
10 the NE crater (Fig. 9b), with a muzzle velocity of ~100 m s -1 [Andronico et al., 2007]. This opening sequence of events was very similar to that recorded at the onset of the 5 April 2003 paroxysm at Stromboli [Calvari et al., 2006; Harris et al., 2008]. The explosion then propagated across the crater terrace to also involve the SW crater (Fig. 9c-d). The paroxysm, observed from SQT400 (Fig. 9e-h) showed two clouds produced by the two crater regions (N and S; Fig. 9f). These two clouds spread in opposite directions (Fig. 9f-g) to reach heights of well over 500 m above the craters (Fig. 9g-h), i.e., they extended beyond the field of view of our camera which covered a zone 500 m above the craters. A maximum height of m a.s.l. was estimated from satellite images [Spinetti et al., 2007], which translates to ~ m above the craters. Camera SQT400 also showed four other similarities with the 5 April 2003 paroxysm as described by Calvari et al. [2006], Rosi et al. [2006] and Harris et al. [2008]: (1) The eruption was characterized by multiple explosions from the three summit crater zones, packaged into three distinctive events (Fig. 9h), as revealed by peaks in the maximum apparent temperature record derived from SQT400 thermal images (Fig. 9i). (2) Column collapse fed pyroclastic flows extending up to Bastimento (Fig. 9h). (3) The paroxysm continued for ~7 minutes, with fire fountaining shifting to the SW crater region as the event developed and becoming less intense, with the number and intensity of events gradually decreasing. (4) The paroxysm erupted lithic blocks and juvenile material that reached a lowest elevation of 300 m a.s.l. Several hot blocks triggered vegetation fires, and a shower of ash and lapilli covered the villages of Ginostra and Stromboli. The paroxysm caused a further widening of the crater terrace, with a large portion of the South rim being removed by the explosion Lava flow activity after 15 March After the 15 March paroxysm, a general decreasing trend was observed in the lava flow output from Vent 2, until 20 March. This decrease was reflected by lava flow bifurcation and the development of many active lobes that often did not reach the sea, as was observed during periods of decreased output at the flow field [Calvari et al., 2005a, 2005b; Lodato et al., 2007]. On 20 March, an apparent increase in output was recorded by SQT190, which showed a second lava flow extending down the SDF. An increase in output was also suggested by the fact that the lava flows also began to lengthen to again reach the sea. A further decrease in output in the following days was reflected in the formation of lava tubes in the upper part of the lava flow field, and by piling up of flows above the lava delta that had formed at the coast. Lava tubes progressively extended between 20 and 24 March, with continued decrease in output from Vent 2 causing the lava flow fronts to halt at progressively higher elevations. On 31 March, an increase in output from Vent 2 again caused the flow fronts to reach the sea, triggering the formation of thick steam columns. This increase lasted only a few hours, so that by the afternoon of 31 March there was a new regression, with flow fronts 10
11 stopping short of the sea. Output decreased again over the following days, with the effusive eruption completely stopping between ~ 9:00 and ~16:00 of 2 April. In fact, three small flows were still active during the helicopter survey carried out at 9:00, whereas just vent incandescence was observed during the next survey carried out at 16:00 5. Effusion rates from thermal data Effusion rates estimated from helicopter- and satellite-collected data during Stromboli s 2007 were, generally, in good agreement (Table 1 and Fig. 10), with errors typically being ±40%, a value which is comparable to errors affecting field-based measurements [e.g., Harris and Neri, 2002; Calvari et al., 2003, 2005a, 2005b; Lautze et al., 2004; Bailey et al., 2006; Harris et al., 2007]. On 4 March, we were able to apply a different approach to extract effusion rates and cross-check the thermal-data-derived values. On this day we could estimate channel dimensions and, by taking images collected at known times and tracking blocks moving on the channel surface, estimate a flow surface velocity of 1.7 m s -1. Hence, using a velocity value that was 2/3 of the surface velocity (as suggested by Calvari et al. [2003]), and considering a channel width of 3 m and depth of 1 m, we obtained an effusion rate of ~3 m 3 s -1. This was consistent with both satelliteand FLIR-derived values for the same day (Fig. 10a). Multiple helicopter-based measurements performed on the same day also allowed us to track small fluctuations in effusion rate and check the repeatability of our measurements. On 26 March, for example, we carried out measurements three times: at 7:00, 10:45 and 14:00. These thermal camera data yielded effusion rates of 0.7±0.4, 0.8±0.5, and 0.9±0.5 m 3 s -1, respectively Effusion rate chronology from the thermal image time series The 2007 eruption was first evident as a major thermal anomaly in AVHRR imagery acquired at 20:06 on 27 February About an hour later, at 21:00, the first eruption-related thermal anomaly was detected by MODIS. Throughout the effusive event, a total of 219 AVHRR and 118 MODIS images were acquired. Of these, 20 AVHRR and 18 MODIS images had sufficient quality to allow hot spot analysis and conversion to effusion rate. Within the dataset, four periods (spanning 28 February 4 March, 6 11 March, March, and 2 11 April) suffered prolonged cloud cover, so that no images of suitable quality for analysis were available during these periods. Effusion rates obtained from the FLIR, AVHRR and MODIS data are given in figure 10a and table 1. Data derived from the three data sets show identical trends, with values peaking between 17 and 19 m 3 s -1 during February (Fig. 10a). This peak was followed by a decline to 1 to 4 m 3 s -1 by 4 March. Effusion rates remained at similar, low, levels throughout the remainder of the eruption, with mean values and standard deviations during the cloud-free periods of 2.0±1.2 m 3 s -1 (4 6 March, 6 images), 1.4±1.4 m 3 s -1 (11 17 March, 17 images), 1.2±1.0 m 3 s -1 (26 29 March, 10 images), and 1.2±0.9 m 3 s -1 (31 March 1 April, 6 images). Thus, except for the short effusion rate peak at the onset of the eruption, activity was characterised by a dominant phase of low effusion rates. However, as observed during previous effusive eruptions at Stromboli [Harris et al., 2005b; Lodato et al., 2007] and Etna [Lautze et al., 2004; Harris et al., 2005a; Bailey et al., 2006; James et al., 2007], even apparently steady, low effusion rate eruptions undergo variations over 11
12 time scales of minutes-to-hours. During the 2007 eruption for example, the generally steady effusion rate trend recorded between 11 and 17 March showed variations ranging between 5.0 and 0.2 m 3 s -1 (Fig. 10a) and displayed three effusion rate cycles. Each cycle was characterised by a relatively high effusion rate phase followed by a low effusion rate phase. The first cycle began with a maximum of 5.3 m 3 s -1, as recorded on 11 March. This was followed by a decrease to 0.5 m 3 s -1 by 12 March (Table 1). The onset of the second cycle was marked by a recovery to 4.7 m 3 s -1 by 21:00 on 13 March. Effusion rates declined again to 0.6 m 3 s - 1 by 00:58 on 15 March. The last cycle began with an increase to 5.0 m 3 s -1 (observed at 12:24 on 16 March) followed by a final decrease. Such lava effusion rate cycles were also observed during the effusive eruption at Stromboli by Harris et al. [2005b] and were ascribed to recovery of the magma level in the central column during low effusion rate periods. Such recovery will increase the hydrostatic head in the conduit. An increase in the hydrostatic head then results in an increase in the effusion rate from the dike tapping the conduit at a lower level, which then results in drainage of the shallow system so that the cycle begins anew. Integration of effusion rates over time yielded cumulative volumes (Fig. 10b) and gave a final erupted volume of between 3.2 x 10 6 and 11 x 10 6 m 3. The mean volume of 7.1 x 10 6 m 3, when erupted over 34 days, gives a mean output rate of 2.4 m 3 s -1. This is an order of magnitude higher than the mean output rates calculated during Stromboli s eruption (0.32±0.28 m 3 s -1, Lodato et al., 2007) and eruption (0.34±0.05 m 3 s -1, Harris et al., 2000). The cumulative volume plot of figure 10b reveals the decline in effusion rate after the first 5.5 days from an inflexion between 28 February and 4 March. As a result, we move from a period of a high rate of volumetric increase (6.6 x 10 5 m 3 d -1 ) during the first 5.5 days of the eruption to a low rate of increase (1.2 x 10 5 m 3 d -1 ) thereafter. This means that 51% of the total volume was erupted over the first 5.5 days, or 16% of the eruption by time. 5. Discussion As was observed prior to the eruption [Calvari et al., 2005a, 2005b; Burton et al., 2008], explosive activity at the crater terrace increased to relatively high levels prior to the onset of Stromboli s 2007 effusive eruption. Calvari et al. [2005a, 2005b], Burton et al. [2008] and Ripepe et al. [2009] have argued that the number of explosions per hour is an indirect measure of magma input rate and magma level within the conduit, where an increasing magma level can be associated with more violent and frequent explosive activity. Hence, we interpret the increase in the number of explosions per hour prior to the 2007 effusive eruption as being a result of an increase in the level of the magma free-surface within the conduit. This is consistent with other geophysical (seismic and infrasonic) data which showed explosion rate, pressure and tremor increasing after January 2007 [Giudicepietro et al., 2009; Ripepe et al., 2009]. This increase was interpreted by Ripepe et al. [2009] as evidence for increased magma supply to the shallow system. The main phases of the 2007 eruption are sketched in figure 11. The intense explosive activity and increased magmastatic pressure within the conduits promoted the breaching of the conduit system and extension of a dike to the NE [Marchetti et al., 2009; Neri and Lanzafame, 2009]. The observed SW-NE propagation direction of the dike is consistent with our thermal camera based observations of the shifting location and style of activity within the crater terrace, where hot fractures and activity were observed to propagate to the NE in the hours prior to the onset of effusion (Fig. 11a-b). Dikes extending from the central conduit fed effusive vents in the same location during the and eruptions [De Fino et al., 1988; Calvari 12
13 et al., 2005a, 2005b]. Thus, the NE flank of the crater terrace currently appears prone to failure during times of increased activity and magmastatic pressure. In addition to the propagation direction of the eruptive fissure and location of the initial effusive vent, a number of other similarities were observed between the opening phases of the and 2007 effusive eruptions. For example, as in , opening of effusive vents were heralded by landslides spreading along the SDF. These formed the dust clouds apparent in figures 3, 4 and 5. These landslides were also detected by the INGV-OV seismic network [Martini et al., 2007] and can be considered among the precursors to effusive activity and the opening of effusive vents at Stromboli. Effusion then typically begins with a short, high effusion rate peak as the central conduit is tapped, followed by a longer waning period over which small variations in effusion can be observed. As previously discussed for Stromboli by Lodato et al. [2007] and Harris et al. [2005b], both the long and short time scales of variation have implications for the magma dynamics of the shallow system. For example, following Wadge [1981] the short waxing and long waning phase observed in the effusion rate trend can be interpreted as tapping of a pressurized source. However, the effusion rate variations were not smooth, where the front of FL3 showed pulsating movements and stopped a short time before the opening of Vent 2 (Fig. 5a-b). We interpret this behaviour as the result of small variations of magma level within the feeder dike during its propagation to force short-term variations in the effusion rate from that dike (Fig. 11c-d). As during , high effusion rates at the onset of the eruption led to rapid drainage of the shallow system and triggered summit collapses. Collapses propagated to NE along the feeder dike, causing blockage of Vent 2, which stopped erupting on the afternoon of 8 March (Fig. 11e). This probably caused an accumulation of magma and overpressure in the upper conduit, resulting in the opening of a new vent (Vent 3) at the 550 m elevation on the following day (Figs. 8, 11e). The position of Vent 3 was very close to the conduit, where a similar sequence of vent opening was observed at the onset of the effusive eruption [Calvari et al., 2005a, 2005b]. The blockage in the feeder dike must have been removed quite quickly, because Vent 3 erupted for less than 24 hours, with activity at Vent 2 resuming on the following day and lasting until the end of the eruption (Fig. 11f). But why was the main active vent during 2007 as low as 400 m a.s.l., whereas in 1975, and the main active vent was located at , 650, or 670 m a.s.l.? We believe that there is a simple explanation for this. The eruption had began with small volume flank failures which left a collapse scar in the SDF [Bonaccorso et al., 2003]. The eastern margin of the SDF continued a sliding movement after the eruption [Tommasi et al., 2005; 2008; Bonforte et al., 2008], with a greater displacement in the upper part of the SDF and smaller velocities at the lowest benchmarks [Bonforte et al., 2008]. This likely resulted from the formation of a sliding block whose south-eastern margin was used by the intrusion of the 2007 dike (Fig. 12a-b). We thus suggest that the 2007 dike opened along the sliding surface (marked by the yellow dotted line in Fig. 11d-f, and by the green dotted line in Fig. 12b), and that both Vents 2 and 3 formed at the intersection between the topographic slope and the eastern and western margins of the sliding block, respectively (Figs. 11d-f, 12b). Effusion rates were higher than during the effusive eruption, as seen from the mean output rates which were 0.32±0.28 m 3 s -1 during the eruption [Lodato et al., 2007] as opposed to ~2.4 m 3 s -1 during the 2007 eruption. The lower elevation of the main effusive vent during the 2007 eruption, i.e. 400 m a.s.l. in 2007, compared with m during , may have caused the higher effusion rates during 13
14 The increased hydrostatic head resulting from a lower vent elevation in 2007 may, for example, have resulted in higher effusion rates during initial tapping and drainage of the shallow system. Conduit drainage may, in turn, have been responsible for de-pressurisation of the system facilitating up-rise of gas-rich magma to cause the 15 March paroxysm. Such de-pressurisation is consistent with ground deformation data that was revealed by continuous deflation during the entire 2007 eruption [Bonaccorso et al., 2009]. The 15 March 2007 paroxysm itself was very similar to that of 5 April The main similarities are as follows: (i) Both paroxysms occurred after a phase of no explosive activity at the summit craters due to conduit emptying during an effusive eruption. (ii) Both began with a short phase of lithic ash emission. (iii) During both paroxysms explosive activity propagated from the NE crater to the SW crater with time. (iv) Both events involved the eruption of lithics, high-porphyric scoria, and low-porphyric pumice [Bertagnini et al., 1999; Francalanci et al., 2008; Landi et al., 2009]. (v) Both events had similar durations, with the 5 April 2003 event lasting 6-9 minutes [Calvari et al., 2006; Harris et al., 2008], and the 15 March 2007 event ~7 minutes. (vi) Both events comprised several eruptive pulses. However, the 15 March 2007 event was characterised by fire fountaining that formed distinct columns over each of the three crater zones, as was well visible from the SQT400 camera (Fig. 9). In comparison thermal and digital camera data for the 5 April 2003 paroxysm revealed pulsating ash columns [Calvari et al., 2006]. Also, prior to the 5 April 2003 paroxysm Calvari et al. [2006] recorded an increase in maximum apparent temperature within the crater terrace. No significant increase in the maximum apparent temperature was detected within the crater terrace before the paroxysm of However, distance and viewing angle may be significant factors in preventing detection of subtle temperature variations within the crater terrace, especially when considering data from cameras that do not have a view into the craters, as is the case for camera SQT Concluding remarks The 2007 effusive eruption of Stromboli showed similar features to those observed during the previous effusive event of Both eruptions began after a precursory phase of increasing explosive activity, and were heralded by a peak in the number of explosions per hour at the summit craters. Both eruptions began with the opening of an eruptive fissure on NE flank of the crater terrace, and both involved paroxysms that occurred during lava effusion. However, some important differences were observed in These were: 1 The opening of two parallel fissures on the NE flank of the crater terrace; 2 The lower elevation (400 m) of the main effusive vent; 3 The higher mean output rate in 2007, which was an order of magnitude higher than those of the two previous eruptions ( and ). We suggest that these differences were influenced by the structural dynamics of SDF, which had been sliding between the and 2007 eruptions [Tommasi et al., 2005; 2008; Bonforte et al., 2008]. Opening of Vents 1, 2, and 3 occurred at the intersection between the SDF slope and the upper, eastern and 14
15 western margins of the sliding block, respectively. In addition, the lower elevation of the 2007 main effusive vent likely caused faster drainage and depressurisation of the shallow system, and facilitated uprise of the batch of magma that caused the March 2007 paroxysmal event. Acknowledgements We wish to thank S. Cocina of the Protezione Civile Regionale Siciliana for promptly making available the helicopter for the thermal surveys, the pilot G. Maurici and his team for the many flights carried out during the initial phases of the eruption in harsh and difficult conditions; G. Bertolaso and the Protezione Civile Nazionale for their assistance and support during the whole eruption, and the helicopter pilots C. Geri, C. Cullurà, S. Princiotta, E. Zanetti, L. Laudadio and L. Zanazzo. Special thanks to our INGV colleagues from sezione di Catania, Napoli, Palermo, Pisa, Roma and Milano who helped during data collection during the eruption, and especially to G. Lanzafame and M. Neri for the fruitful discussions on the mechanisms of opening of eruptive fissures, and to M. Neri for making Fig. 1. We wish to thank the former Director of INGV sezione di Catania A. Bonaccorso for his continuous encouragement and support to our activities. This work has been possible thanks to the installation and maintenance of the INGV-CT web-camera network carried out by E. Pecora, E. Biale, D. Condarelli, and D. Reitano. This paper was partially supported by a grant to S. Calvari (Project INGV-DPC Paroxysm V2/03, ) funded by the Istituto Nazionale di Geofisica e Vulcanologia and by the Italian Civil Protection. Satellite-based effusion rate work by A. Steffke and A. Harris was supported by NASA grant NNG04GO64G "New Tools for Advanced Hot Spot Tracking". The authors wish to thank the reviews by M. James, M. Patrick, R. Arculus, and L. Glaze for their many suggestions that greatly improved the paper. References Andronico, D., A. Cristaldi, and J. Taddeucci (2007), Eruzione Stromboli 2007: evento parossistico del 15 marzo. INGV-CT report, Prot. Int. UFVG2007/116, 1-7. Bailey, J.E., A.J.L. Harris, J. Dehn, S. Calvari, S.K. Rowland (2006), The changing morphology of an open lava channel on Mt. Etna, Bull. Volc., DOI /s , 68, 6, Ball, M., and H. Pinkerton, (2006), Factors affecting the accuracy of thermal imaging cameras in volcanology. J. Geophys. Res., 111, B11203, doi: /2005jb Barberi, F., M. Rosi, and A. Sodi (1993), Volcanic hazard assessment at Stromboli based on review of historical data, Acta Vulc., 3, Barberi, F., L. Civetta, M. Rosi, and R. Scandone (2009), Chronology of the 2007 eruption of Stromboli and the activity of the Scientific Synthesis Group, J. Volc. Geoth. Res., 182, Bertagnini, A., M. Coltelli, P. Landi, M. Pompilio, and M. Rosi (1999), Violent explosions yield new insights into dynamics of Stromboli volcano, Eos, Am. Geoph. Union Trans., 80 (52), Bonaccorso, A., S. Calvari, G. Garfì, L. Lodato, and D. Patané (2003), December 2002 flank failure and tsunami at Stromboli volcano inferred by volcanological and geophysical observations. Geophys. Res. Lett., 30(18),
16 Bonaccorso, A., A. Bonforte, S. Gambino, M. Mattia, F. Guglielmino, G. Puglisi, and E. Boschi (2009), Insight on recent Stromboli eruption inferred from terrestrial and satellite ground deformation measurements, J. Volc. Geoth. Res., doi: /j.jvolgeores Bonforte, A., M. Aloisi, G. Antonello, N. Casagli, J. Fortuny-Guash, L. Guerri, G. Nunnari, G. Puglisi, A. Spata, and D. Tarchi (2008), Movements of the Sciara del Fuoco, in The Stromboli Volcano: An integrated study of the Eruption, edited by S. Calvari, S. Inguaggiato, G. Puglisi, M. Ripepe and M. Rosi, AGU Geophysical Monograph Series, 182, Burton, M.R., S. Calvari, Spampinato L., Lodato L., Pino N.A., Marchetti E., and Murè F. (2008), Volcanic and seismic activity at Stromboli preceding the eruption, in The Stromboli Volcano: An integrated study of the Eruption, edited by S. Calvari, S. Inguaggiato, G. Puglisi, M. Ripepe and M. Rosi, AGU Geophysical Monograph Series, 182, Calvari, S., and H. Pinkerton (1998), Formation of lava tubes and extensive flow field during the eruption of Mount Etna, J. Geophys. Res., 103, B11, Calvari, S., and H. Pinkerton (2004), Birth, growth and morphologic evolution of the "Laghetto" cinder cone during the 2001 Etna eruption. J. Volc. Geoth. Res., 132, , doi: /s (03) Calvari, S., M. Neri, and H. Pinkerton (2003), Effusion rate estimations during the 1999 summit eruption on Mt. Etna, and growth of two distinct lava flow fields. J. Volc. Geoth. Res., 119, , S (02) , ISSN Calvari, S., L. Spampinato, and L. Lodato (2006), The 5 April 2003 vulcanian paroxysmal explosion at Stromboli volcano (Italy) from field observations and thermal data. J. Volc. Geoth. Res., 149, , doi: /j.jvolgeores Calvari, S., L. Spampinato, L. Lodato, A.J.L. Harris, M.R. Patrick, J. Dehn, M.R. Burton, and D. Andronico (2005a), Chronology and complex volcanic processes during the flank eruption at Stromboli volcano (Italy) reconstructed from direct observations and surveys with a handheld thermal camera. J. Geophys. Res., 110, B02201, doi: /2004jb Calvari, S., L. Spampinato, L. Lodato, A.J.L. Harris, M.R. Patrick, J. Dehn, M.R. Burton, and D. Andronico (2005b), Correction to Chronology and complex volcanic processes during the flank eruption at Stromboli volcano (Italy) reconstructed from direct observations and surveys with a handheld thermal camera. J. Geophys. Res., 110, B02201, doi: /2005jb Capaldi, G., I. Guerra, A. Lo Bascio, G. Luongo, R. Pece, A. Rapolla, R. Scarpa, E. Del Pezzo, M. Martini, M.R. Ghiara, L. Lirer, R. Munno, and L. La Volpe (1978), Stromboli and its 1975 Eruption, Bull. Volc., 41 (3), Casagli, N., A. Tibaldi, A. Merri, C. Del Ventisette, T. Apuani, L. Guerri, J. Fortuny-Guasch, and D. Tarchi (2009), Deformation of Stromboli Volcano (Italy) during the 2007 crisis by radar interferometry, numerical modeling and field structural data, J. Volc. Geoth. Res., 182, Chouet, B., P. Dawson, T. Ohminato, M. Martini, G. Saccorotti, F. Giudicepietro, G. De Luca, G. Milana, and R. Scarpa (2003), Source mechanisms of explosions at Stromboli Volcano, Italy, determined from moment-tensor inversions of very-long-period data, J. Geoph. Res., 108, B1, 2019, doi: /2002jb
17 De Fino, M., L. La Volpe, S. Falsaperla, G. Frazzetta, G. Neri, L. Francalanci, M. Rosi, and A. Sbrana (1988), The Stromboli eruption of December 6, April 25, 1986: volcanological, petrological and seismological data, Rend. Soc. It. Min. Petr., 43, Dehn, J., Harris, A., and M. Ripepe (2001), Infrared Imaging of Strombolian Eruptions, Annual American Geophysical Union Meeting, San Francisco, CA, USA, December 10-14, Dragoni, M., and A. Tallarico (2009), Assumptions in the evaluation of lava effusion rates from heat radiation, Geophys. Res. Letters, 36, L08302, doi: /2009gl Francalanci, L., A. Bertagnini, N. Métrich, A. Renzulli, R. Vannucci, P. Landi, S. Del Moro, M. Menna, C.M. Petrone, and I. Nardini (2008), Mineralogical, Geochemical, and Isotopic Characteristics of the Ejecta From the 5 April 2003 Paroxysm at Stromboli, Italy: Inferences on the Preeruptive Magma Dynamics, in The Stromboli Volcano: An integrated study of the Eruption, edited by S. Calvari, S. Inguaggiato, G. Puglisi, M. Ripepe and M. Rosi, AGU Geophysical Monograph Series, 182, Giudicepietro, F., L. D'Auria, M. Martini, T. Caputo, R. Peluso, W. De Cesare, M. Orazi, and G. Scarpato (2009), Changes in the VLP seismic source during the 2007 Stromboli eruption, J. Volc. Geoth. Res., 182, Harris, A.J.L., J.E. Bailey, S. Calvari, and J. Dehn, (2005a), Heat loss measured at a lava channel and its implications for down-channel cooling and rheology, Geol. Soc. Am. Spec. Paper, 396, Harris, A.J.L., and S.M. Baloga (2009), Lava discharge rates from satellite-measured heat flux, Geophys. Res. Letters, 36, L19302, doi: /2009gl Harris, A.J.L., A.L. Butterworth, R.W. Carlton, I. Downey, P. Miller, P. Navarro, and D.A. Rothery (1997), Low-cost volcano surveillance from space: case studies from Etna, Krafla, Cerro Negro, Fogo, Lascar and Erebus, Bull. Volc., 59, Harris, A.J.L., J. Dehn, and S. Calvari (2007), Lava Effusion Rate Definition, Measurement and Operational Requirements: A Review, Bull. Volc., 70, 1-22, doi: /s y. Harris, A.J.L., J. Dehn, M. Patrick, S. Calvari, M. Ripepe, and L. Lodato (2005b), Lava effusion rates from hand-held thermal infrared imagery: an example from the June 2003 effusive activity at Stromboli, Bull. Volc., 68, , doi: /s Harris, A.J.L., M. Favalli, F. Mazzarini, and C.W. Hamilton (2009), Construction Dynamics of a Lava Channel, Bull. Volc., 71, , doi: /s Harris, A.J.L., and M. Neri (2002), Volumetric observations during paroxysmal eruptions at Mount Etna: pressurized drainage of a shallow chamber or pulsed supply? J. Volc. Geoth. Res., 116, Harris, A.J.L., J.B. Murray, S.E. Aries, M.A. Davies, L.P. Flynn, M.J. Wooster, R. Wright, and D.A. Rothery (2000), Effusion rate trends at Etna and Krafla and their implications for eruptive mechanisms, J. Volc. Geoth. Res., 102, Harris, A.J.L., and M. Ripepe (2007a), Synergy of multiple geophysical approaches to unravel explosive eruption conduit and source dynamics A case study from Stromboli. Chemie der Erde, 67, Harris, A.J.L., and M. Ripepe (2007b), Temperature and dynamics of degassing at Stromboli. J. Geophys. Res., 112, B03205, doi: /2006jb Harris, A.J.L., M. Ripepe, S. Calvari, L. Lodato, and L. Spampinato (2008), The 5 April 2003 Explosion of Stromboli: Timing of Eruption Dynamics Using Thermal Data, in The Stromboli Volcano: An integrated 17
18 study of the Eruption, edited by S. Calvari, S. Inguaggiato, G. Puglisi, M. Ripepe and M. Rosi, AGU Geophysical Monograph Series, 182, Harris, A.J.L., and S.K. Rowland (2009), Effusion rate controls on lava flow length and the role of heat loss: A review, in Studies in Volcanology: The Legacy of George Walker, edited by T. Thordarson, S. Self, G. Larsen, S.K. Rowland, and A. Hoskuldsson, Special Publications of IAVCEI, 2, Harris, A.J.L., and D.S. Stevenson (1997), Thermal observations of degassing open conduits and fumaroles at Stromboli and Vulcano using remotely sensed data. J. Volcanol. Geothem. Res., 76, Hirn, B., C. Di Bartola, and F. Ferrucci (2009), Combined use of SEVIRI and MODIS for detecting, measuring, and monitoring active lava flows at erupting volcanoes, IEEE Trans. Geosci. Remote Sensing, doi: /TGRS James, M., H. Pinkerton, and S. Robson (2007), Image-based measurement of flux variation in distal regions of active lava flows. Geochem., Geophys., Geosyst., 8, Q03006, doi: /2006gc Kilburn, C.R.J. (1993), Lava crust, aa flow lengthening and the pahoehoe-aa transition, in Active lavas: monitoring and modelling, edited by C.R.J. Kilburn and G. Luongo, UCL Press, London, Landi, P., R.A. Corsaro, L. Francalanci, L. Civetta, L. Miraglia, M. Pompilio, and R. Tesoro (2009), Magma dynamics during the 2007 Stromboli eruption (Aeolian Islands, Italy): Mineralogical, geochemical and isotopic data, J. Volc. Geoth. Res., doi: /j.jvolgeores Lautze, N.C., A.J.L. Harris, J.E. Bailey, M. Ripepe, S. Calvari, J. Dehn, S. Rowland, and K. Evans-Jones (2004), Pulsed lava effusion at Mount Etna during 2001, J. Volc. Geoth. Res., 137, , doi: /j.jvolgeores Lodato, L., L. Spampinato, A.J.L. Harris, S. Calvari, J. Dehn, and M. Patrick (2007), The Morphology and Evolution of the Stromboli Lava Flow Field: An Example of Basaltic Flow Field Emplaced on a Steep Slope, Bull. Volc., 69, , doi: /s Marchetti, E., R. Genco, and R. Ripepe (2009), Ground deformation and seismicity related to the propagation and drainage of the dyke feeding system during the 2007 effusive eruption at Stromboli volcano (Italy), J. Volc. Geoth. Res., 182, Martini, M., F. Giudicepietro, L. D Auria, A.M. Esposito, T. Caputo, R. Curciotti, W. De Cesare, M. Orazi, G. Scarpato, A. Caputo, R. Peluso, P. Ricciolino, A.T. Linde, and S. Sacks (2007), Seismological monitoring of the February 2007 effusive eruption of the Stromboli volcano, Ann. Gephys., 50, 6, Neri, M., and G. Lanzafame (2009), Structural features of the 2007 Stromboli eruption, J. Volc. Geoth. Res., 182, , doi: /j.jvolgeores Patrick, M.R. (2007), Dynamics of strombolian ash plumes from thermal video: Motion, morphology, and air entrainment, J. Geophys. Res., 112, B06202, doi: /2006jb Patrick, M.R., A.J.L. Harris, M. Ripepe, J. Dehn, D.A. Rothery, and S. Calvari (2007), Strombolian explosive styles and source conditions: insights from thermal (FLIR) video, Bull. Volc., 69, , doi: /s Pioli, L., M. Rosi, S. Calvari, L. Spampinato, A. Renzulli, and A. Di Roberto (2008), The eruptive activity of 28 and 29 December 2002, in The Stromboli Volcano: An integrated study of the Eruption, edited by S. Calvari, S. Inguaggiato, G. Puglisi, M. Ripepe and M. Rosi, AGU Geophysical Monograph Series, 182,
19 Ripepe, M., D. Delle Donne, G. Lacanna, E. Marchetti, and G. Ulivieri (2009), The onset of the 2007 Stromboli effusive eruption recorded by an integrated geophysical network, J. Volc. Geoth. Res., 182, Ripepe, M., E. Marchetti, G. Ulivieri, A.J.L. Harris, J. Dehn, M.R. Burton, T. Caltabiano, and G.G. Salerno, (2005), Effusive to explosive transition during the 2003 eruption of Stromboli volcano, Geology, 33, 5, Rosi, M., A. Bertagnini, A.J.L. Harris, L. Pioli, M. Pistolesi, and M. Ripepe, (2006), A case history of paroxysmal explosion at Stromboli: Timing and dynamics of the April 5, 2003 event, Earth Plan. Sci. Letters, 243, Rowland, S.K., A.J.L. Harris, M.J. Wooster, F. Amelung, H. Garbeil, L. Wilson, and P. Mouginis-Mark (2003), Volumetric characteristics of lava flows from interferometric radar and multispectral satellite data: the 1995 Fernandina and 1998 Cerro Azul eruptions in the western Galàpagos, Bull. Volc., 65, Sawyer, G.M., and M.R. Burton, (2006), Effects of a volcanic plume on thermal imaging data, Geophys. Res. Lett., 33, L14311, doi: /2005gl Scandone, R., F. Barberi, and M. Rosi (2009), The 2007 eruption of Stromboli: Preface, J. Volc. Geoth. Res., 182, v. Spampinato, L., S. Calvari, A.J.L. Harris, and J. Dehn (2008a), Evolution of the lava flow field, in The Stromboli Volcano: An integrated study of the Eruption, edited by S. Calvari, S. Inguaggiato, G. Puglisi, M. Ripepe and M. Rosi, AGU Geophysical Monograph Series, 182, Spampinato, L., S. Calvari, C. Oppenheimer, and L. Lodato (2008b), Shallow magma transport for the Mt. Etna eruption inferred from thermal infrared surveys, J. Volc. Geoth. Res., 177, , doi: /j.jvolgeores Spampinato, L., S. Calvari, C. Oppenheimer, L. Lodato, and E. Boschi (2009), Revisiting the use of infrared thermal cameras for the surveillance of active volcanoes. Earth-Sci. Rev., in review. Spinetti, C., M.F. Buongiorno, F. Doumaz, M. Musacchio, V. Lombardo, A.J.L. Harris, A. Steffke, and S. Amici (2007), Rapporto eruzione Stromboli 9-16 marzo 2007, pp. 1-9, Tinti, S., A. Manucci, G. Pagnoni, A. Armigliato, and F. Zaniboni (2005), The 30 December 2002 landslideinduced tsunamis in Stromboli: sequence of the events reconstructed from the eyewitnesses accounts, Nat. Haz. Earth Sys. Sci., 5, Tommasi, P., P. Baldi, F.L. Chiocci, M. Coltelli, M. Marsella, M. Pompilio, and C. Romagnoli (2005), The Landslide Sequence Induced by the 2002 Eruption at Stromboli Volcano, in Landslide - Risk analysis and sustainable disaster management, edited by K. Sassa, H. Fukuoka, F.W. Wang, and G. Wang, Springer Verlag, Berlin, pp Tommasi, P., P. Baldi, F.L. Chiocci, M. Coltelli, M. Marsella, and C. Romagnoli (2008), Slope failures induced by the December 2002 eruption at Stromboli volcano, in The Stromboli Volcano: An integrated study of the Eruption, edited by S. Calvari, S. Inguaggiato, G. Puglisi, M. Ripepe and M. Rosi, AGU Geophysical Monograph Series, 182, Washington, H.S. (1917), Persistence of vents at Stromboli and its bearing on volcanic mechanism, Geol. Soc. Am. Bull., 28,
20 Wadge, G. (1981), The variation of magma discharge during basaltic eruptions, J. Volc. Geoth. Res., 11, Wright, R., S. Blake, A.J.L. Harris, and D.A. Rothery (2001), A simple explanation for the space-based calculation of lava eruption rates, Earth Plan. Sci. Letters, 192, Zanon, V., M. Neri, and E. Pecora (2009), Interpretation of data from the monitoring thermal camera of Stromboli volcano (Aeolian Islands, Italy), Geol. Mag., 146 (4), Figure Captions Figure 1 - (a): Location of the Aeolian Volcanic Arc (AVA) and Stromboli. (b): Island of Stromboli with the outline of the Sciara del Fuoco (SDF) marked by the blue line. The area enlarged in (c) is also located. (c): The 2007 lava flow field (in red) with the feeding vents (in yellow) and location of the INGV-CT web-cameras: SPI (Stromboli Infrared thermal camera at Il Pizzo), SQT400 (Stromboli infrared Thermal camera at 400 m elevation), SQV400 (Stromboli Visible camera at 400 m elevation), and SCT190 (Stromboli infrared Thermal camera at 190 m elevation). CR1 and CR3 mark the South-West and North-East craters. (d): The position of the active vents within the crater terrace as could be seen from the SPI camera located at Il Pizzo, where S, C and N mark the SW, Central and NE craters, within which bs 2, bs 1, bc, bn 2, and bn 1 locate the active vents within each crater as of February Images (a) to (c) are courtesy of M. Neri [modified after Neri and Lanzafame, 2009]. Figure 2 Graph showing the daily average frequency of explosions per hour at the crater terrace between 24 October 2003 and 27 February 2007, reconstructed using images recorded camera SPI (see figure 1c for camera location). Figure 3 Images taken from camera SPI (a-c), SQT400 (d-f) and SQV400 (g-i) (see Fig. 1c for camera locations) showing the crater terrace and flow field during the opening phase of the 2007 effusive eruption. The chronological sequence of the images given in (d-i) tracks emplacement of lava flows fed by the fissure opening on the NE flank of the crater terrace. (a) Location and names of active vents as of 26 February 2007 (one day before the start of the 2007 effusive eruption). Red-dashed circle locates vent bn 1 which collapsed the next day. (b) Image acquired during fissure propagation on 27 February Red-dashed circle indicates location of upslope-propagating fissure, opening between bn 2 and bn 1. Movement on this fissure caused, one minute later, a small failure of the SE rim of vent bn 2. (c) Image showing lava flow extending across the saddle between vents bn 1 and bn 2. (d) Image obtained during the opening of Vent 1 on the NE flank of the crater terrace. The yellow-dotted line outlines the craters and the white-dotted line traces the profile of Pianoro (~650 m a.s.l.). (e) Image showing spreading of the first lava flow (FL1) across the lava shield (white-dotted line). (f) Image obtained after flow FL1 had begun to extend down the upper Sciara del Fuoco itself. White arrow indicates the position of the active lava flow front. (g) Image of FL1 spreading across the middle of the Sciara del Fuoco. The location of the active flow front is marked by the red arrow (black arrow shows previous position in (f) - distance between the two arrows is approximately 150 m). (h-i) Images acquired as the flow front extended onto the lower Sciara del Fuoco, where it excavated the ground 20
21 [Calvari et al., 2005a, 2005b] producing an increasingly thick ash cloud which obscured visibility, to finally enter the sea. The red square in (g) shows the area imaged in (d-f). Figure 4 View from West side of the Sciara del Fuoco at 16:30 on 27 February 2007 showing the first lava flows reaching the sea. Note the eruptive fissure on the NE flank of the crater terrace releasing white steam and gas, and the white columns of steam rising from the lava flow fronts where they meet the sea. Brown dust rising around and above Flow 1 (FL1) result from ground excavation and landslides triggered by lava flow advance. Photo taken from the helicopter of Protezione Civile Regione Siciliana by S. Calvari. Figure 5 Sequence of frames recorded by camera SQV400 (see Fig. 1c for location). (a-b) Images of lava flow activity. (c-f) Images charting the initial stages of the opening of Vent 2 (see Fig. 1c for location) in the afternoon of 27 February Images given in (c-f) also record the emission of the FL4 lava flow, debris flow and associated dust clouds. (g) Graph showing the maximum apparent temperature recorded by camera SQT400 revealing variation due to the pulsing movement of the FL3 front, followed by an increase due to the opening of Vent 2. Maximum temperature is sampled every 10 seconds. Figure 6 (a): Photo of the Sciara del Fuoco taken from the NNE during a boat-based survey performed on 5 March 2007 showing Vent 2 and the it s lava flow field (outlined using a dotted red line). The flow has reached the sea to generate thick steam clouds. The yellow box shows the area imaged in (b). (b): Photo of the Sciara del Fuoco taken from the NE during a helicopter survey on 4 March 2007 showing Vent 2 on the eastern Sciara del Fuoco, and the depression above the vent region caused by dike drainage. The line of fume apparent in the upper right of the image marks the eruptive fissure on the NE flank of the crater terrace. The white steaming area below this marks the location of lava flows of erupted during opening phase. Photo s courtesy of Dipartimento di Protezione Civile. Figure 7 Sequence of images of the crater terrace recorded by camera SPI between 4 and 7 March 2007 showing widening of the crater rim by repeated collapses. The coloured-dotted lines indicate changes in the position of the crater rim. Increasing darkness and decreasing quality of the images are the result of ash emission during collapses. Figure 8 (a): Photo of the Sciara del Fuoco taken from the NW showing the position of Vents 1, 2 and 3, as well as the flow fields that they fed (Vent 1 flow field: black dotted outline; Vent 2 flow field: red dotted outline; Vent 3 flow field: yellow dotted outline). Note the deep elongated depressions above Vents 2 and 3 due to dike drainage. (b): Graph of maximum apparent temperature recorded by camera SQT400 during 9 March (sampling rate is 10 seconds). The increase in temperature at 13:31:49 relates to the opening of Vent 3 at 550 m a.s.l. Figure 9 Sequence of images recorded by camera SPI during the 15 March 2007 paroxysm. (a) Image recording pre-explosion collapses from the inner crater walls. (b) Image recording the initial phase of the paroxysm at the NE crater at 20:38:18. (c) Image acquired at 20:38:20 showing explosion source propagation to the Central crater. (d) Image acquired at 20:38:22 showing propagation to the SW crater. (e, 21
22 h): The same sequence of events recorded from camera SQT400. From this camera we see the craters from below and from the NE. The first image in the series (e) shows that just a small thermal anomaly was visible from below at the onset of the paroxysm. The second image (f) shows that, when the paroxysm began, two diverging eruptive clouds formed and extended out of the top of the camera field of view. The image in (h) shows three fire fountains from each of the three crater zones and pyroclastic flows spreading up to Bastimento (located using black arrow). (i): Graph of the maximum apparent temperature recorded on 15 March 2007 by camera SQT400 showing the sudden start of the 15 March paroxysm and several peaks caused by fire fountain activity and pyroclastic flows. The thermal signal caused by pyroclastic flows spreading on the Pianoro is highlighted by the arrow. Figure 10 (a): Graph plotting effusion rates obtained from thermal camera, AVHRR, and MODIS data, showing high initial values followed by a roughly steady trend punctuated by small pulses. (b): Graph of the maximum and minimum cumulative volumes calculated from data in (a). Figure 11 Cross-section sketches of Stromboli (viewed from North) summarizing our interpretation of the chronology of the 2007 effusive eruption. (a): Enhanced magma and gas flux (red) ascends the conduit (brown) during the weeks preceding the onset of the effusive eruption (N, C and S mark the NE, Central and SW craters). (b): The eruptive fissure opens within the NE crater due to increased magmastatic pressure. (c): The eruptive fissure intersects the NE flank of the crater terrace (black line) and Vent 1 (red dot) opens at 650 m a.s.l. to produce a lava flow (purple) that extends to the sea. (d): Magma level within the conduit drops so that Vent 1 and its lava flow becomes inactive (dark grey). The feeder dike propagates down slope along the detachment surface beneath the sliding portion of the SDF (yellow dotted line). Vent 2 opens at 400 m.s.l. to feed lava flow (purple) to the sea. (e): Effusion rate at Vent 2 declines until the vent closes. Magma level within the feeder dike backs up (along the line of the detachment surface - yellow dotted line), and Vent 3 re-opens at 550 m to feed lava flow to the sea. (f): Magma level within the conduit drops causing Vent 3 to close (grey). Magma fills the feeder dike so that Vent 2 becomes active and lava spreads from this vent to the sea. Figure 12 (a): Photo taken in August 2003 showing the crater terrace (source of white steam in top right) and the eruptive fissure (red dotted line) that opened on the NE flank of the crater terrace during the effusive eruption. (b): Photo taken in June 2007 from NE showing the two eruptive fissures (red dotted lines) that opened during the 2007 effusive eruption. The positions of Vents 1, 2 and 3 are also marked (yellow dots). The uppermost fissure in (b) is interpreted as the reactivation of the fissure, whereas the lower vents form on the upper boundary of a block that had been sliding since the start of the effusive eruption. The green dotted line marks the boundary of the sliding block, and the green arrow shows its direction of movement. The 2007 effusive Vents (1, 2 and 3, yellow dots) are located along the intersection of the sliding block with topography. Tables 22
23 Table 1 Effusion rate data from AVHRR and MODIS satellite data and from FLIR helicopter surveys Table 2 Cumulative volumes calculated from AVHRR, MODIS and FLIR data. 23

24
25

26

27

28
29

30
31

32
33

34

35
The 7 September 2008 Vulcanian explosion at Stromboli volcano: Multiparametric characterization of the event and quantification of the ejecta
 JOURNAL OF GEOPHYSICAL RESEARCH, VOL. 117,, doi:10.1029/2011jb009048, 2012 The 7 September 2008 Vulcanian explosion at Stromboli volcano: Multiparametric characterization of the event and quantification
Recent activity. Current episode 12 years Transition between styles 4 periods of dome growth Since 2003, Vulcanian explosions (4 25 per day)
") Recent activity Current episode 12 years Transition between styles 4 periods of dome growth Since 2003, Vulcanian explosions (4 25 per day) 02 December 09 Explosions originating from dome e.g. 10 Jan 2010
Recent activity Current episode 12 years Transition between styles 4 periods of dome growth Since 2003, Vulcanian explosions (4 25 per day) 02 December 09 Explosions originating from dome e.g. 10 Jan 2010
Thirty years of satellite derived lava discharge rates at Etna: Implications for steady volumetric output
 JOURNAL OF GEOPHYSICAL RESEARCH, VOL. 116,, doi:10.1029/2011jb008237, 2011 Thirty years of satellite derived lava discharge rates at Etna: Implications for steady volumetric output Andrew Harris, 1 Andrea
Supporting the response to the 2018 lower East Rift Zone and summit collapse at Kīlauea Volcano, Hawaiʻi
 Hawaiʻi Supersite success story Supporting the response to the 2018 lower East Rift Zone and summit collapse at Kīlauea Volcano, Hawaiʻi Since 1983, Kīlauea Volcano, on the Island of Hawaiʻi, has actively
Application of differential SAR interferometry for studying eruptive event of 22 July 1998 at Mt. Etna. Abstract
 Application of differential SAR interferometry for studying eruptive event of 22 July 1998 at Mt. Etna Coltelli M. 1, Puglisi G. 1, Guglielmino F. 1, Palano M. 2 1 Istituto Nazionale di Geofisica e Vulcanologia,
Volcanic and seismic activity at Stromboli preceding the
 Volcanic and seismic activity at Stromboli preceding the 0-0 eruption Burton M., Calvari S., Spampinato L., Lodato L., Pino N.A., Marchetti E., Murè F. Abstract Regular surveys with a PM FLIR thermal imaging
JOURNAL OF GEOPHYSICAL RESEARCH, VOL. 110, B02201, doi: /2004jb003129, 2005
 JOURNAL OF GEOPHYSICAL RESEARCH, VOL. 110,, doi:10.1029/2004jb003129, 2005 Correction published 7 April 2005 Chronology and complex volcanic processes during the 2002--2003 flank eruption at Stromboli
Nick Varley Universidad de Colima, Mexico
 Nick Varley Universidad de Colima, Mexico nick@ucol.mx Remote sensing often is the first signal of a new eruption for remote volcanoes Fumarole direct temperature measurements Spring water temperatures
SUMMARY OF ACTIVITIES CARRIED OUT OFFSHORE SCIARA DEL FUOCO IN THE FRAMEWORK OF THE GNV PROJECT #15
 SUMMARY OF ACTIVITIES CARRIED OUT OFFSHORE SCIARA DEL FUOCO IN THE FRAMEWORK OF THE GNV PROJECT #15 Immediately after the tsunami event which occurred on December 30, researchers involved in the GNV Project
3D temporal evolution of displacements recorded on Mt. Etna from the 2007 to 2010 through the SISTEM method
 3D temporal evolution of displacements recorded on Mt. Etna from the 2007 to 2010 through the SISTEM method Bonforte A., Guglielmino F.,, Puglisi G. INGV Istituto Nazionale di Gofisica e vulcanologia Osservatorio
Pavlof. Alaska Peninsula N, W; summit elev. 2,519 m. All times are local (= UTC - 9 hours)
") Pavlof Alaska Peninsula 55.42 N, 161.887 W; summit elev. 2,519 m All times are local (= UTC - 9 hours) Eruption in May-June 2013 with lava flows and ash emissions to ~8.5 km a.s.l. Pavlof, the most active
Pavlof Alaska Peninsula 55.42 N, 161.887 W; summit elev. 2,519 m All times are local (= UTC - 9 hours) Eruption in May-June 2013 with lava flows and ash emissions to ~8.5 km a.s.l. Pavlof, the most active
Thermal anomalies at Stromboli volcano from MODIS data
 Mem. S.A.It. Suppl. Vol. 12, 60 c SAIt 2008 Memorie della Supplementi Thermal anomalies at Stromboli volcano from MODIS data D. Piscopo 1, D. Coppola 1, D. Delle Donne 2, C. Cigolini 1, and M. Di Martino
EAS 116 Earthquakes and Volcanoes
 EAS 116 Earthquakes and Volcanoes J. Haase Forecasting Volcanic Eruptions Assessment of Volcanic Hazard Is that volcano active? Mount Lassen: 12000 BP and 1915 Santorini, IT: 180,000 BP, 70,000 BP, 21000
Report on the field campaign to Guatemala, Fuego and Santiaguito volcanoes, in June-July By Jose Luis Palma and John Lyons
 Report on the field campaign to Guatemala, Fuego and Santiaguito volcanoes, in June-July 2008 By Jose Luis Palma and John Lyons Other participants of the field campaign: Kyle Brill (PCMI), Jemile Erdem
M 7.2 Earthquake along Iraq Iran border Sunday, November 12, Close to boundary of the Arabian and Eurasian Plates
 M 7.2 Earthquake along Iraq Iran border Sunday, November 12, 2017 Close to boundary of the Arabian and Eurasian Plates Length of Lava Flows Since the path of a lava flow is controlled by topography it
A bowl shaped depression formed by the collapse of a volcano is called a. Magma that has left the vent of a volcano is known as. Lava.
 Magma that has left the vent of a volcano is known as Lava A bowl shaped depression formed by the collapse of a volcano is called a Caldera This can form in a caldera when magma starts to come back up
( ) USGS (United States Geological Survey) Watch Green. Normal. alert level 1 Normal
 USGS (United States Geological Survey) Watch Green. Normal. alert level 1 Normal") (200610.1) USGS (United States Geological Survey) 1014 alert level 1 Normal Watch Green Normal USGS WARNING WATCH ADVISORY NORMAL SUMMARY OF VOLCANIC-ALERT LEVELS Highly hazardous eruption underway or
(200610.1) USGS (United States Geological Survey) 1014 alert level 1 Normal Watch Green Normal USGS WARNING WATCH ADVISORY NORMAL SUMMARY OF VOLCANIC-ALERT LEVELS Highly hazardous eruption underway or
Near real-time monitoring of the April-May 2010 Eyjafjöll s ash cloud
 Near real-time monitoring of the April-May 2010 Eyjafjöll s ash cloud Labazuy P. and the HotVolc Team Observatoire de Physique du Globe de Clermont-Ferrand, CNRS, Université Blaise Pascal 13th International
NSF-MARGINS Expedition to Anatahan Volcano March 2005
 1 NSF-MARGINS Expedition to Anatahan Volcano March 2005 According to the Emergency Management Office (EMO) report distributed in February 2005, the third historical eruption of Anatahan began on January
LECTURE #11: Volcanoes: Monitoring & Mitigation
 GEOL 0820 Ramsey Natural Disasters Spring, 2018 LECTURE #11: Volcanoes: Monitoring & Mitigation Date: 15 February 2018 I. What is volcanic monitoring? the continuous collection of one or more data sources
Why was this eruption important?
 Mount St. Helens Mount St. Helens has a long geological history (>3,000 yrs) of explosive eruptions. The 1980 Events: Initial relatively mild steam and ash (Vulcanian) eruptions. Sustained plinian eruption
Linked frequency and intensity of persistent volcanic activity at Stromboli (Italy)
") GEOPHYSICAL RESEARCH LETTERS, VOL. 40, 3384 3388, doi:10.1002/grl.50652, 2013 Linked frequency and intensity of persistent volcanic activity at Stromboli (Italy) J. Taddeucci, 1 D. M. Palladino, 2 G. Sottili,
GEOPHYSICAL RESEARCH LETTERS, VOL. 40, 3384 3388, doi:10.1002/grl.50652, 2013 Linked frequency and intensity of persistent volcanic activity at Stromboli (Italy) J. Taddeucci, 1 D. M. Palladino, 2 G. Sottili,
Visualizing Earth Science. Chapter Overview. Volcanoes and Eruption Types. By Z. Merali and B. F. Skinner. Chapter 9 Volcanism and Other
 Visualizing Earth Science By Z. Merali and B. F. Skinner Chapter 9 Volcanism and Other Igneous Processes Volcanoes types and effects of eruption Chapter Overview Melting and cooling of rocks Geological
Pahoehoe flow cooling, discharge, and coverage rates from thermal image chronometry
 GEOPHYSICAL RESEARCH LETTERS, VOL. 34, L19303, doi:10.1029/2007gl030791, 2007 Pahoehoe flow cooling, discharge, and coverage rates from thermal image chronometry Andrew J. L. Harris, 1 Jonathan Dehn, 2
A - Piton de la Fournaise activity
 OVPF-IPGP September 2018 Page 1/10 Monthly bulletin of the Piton de la Fournaise Volcanological Observatory ISSN ISSN 2610-5101 A - Piton de la Fournaise activity PITON DE LA FOURNAISE (VNUM #233020) Latitude:
Monthly Volcanic Activity Report (July, 2012)
") Monthly Volcanic Activity Report (July, 2012) Tokachidake [Alert Level: 1] Volcanic glows have been observed in the Taisho crater with a high-sensitivity camera at night from the night of June 30th to
Monthly Volcanic Activity Report (July, 2012) Tokachidake [Alert Level: 1] Volcanic glows have been observed in the Taisho crater with a high-sensitivity camera at night from the night of June 30th to
Hands-on Activity Predicting Eruptions on Montserrat
 Hands-on Activity Predicting Eruptions on Montserrat Predicting Eruptions No one can predict exactly when a volcano might explode. There are, however, common clues to look for to let people know that the
Major effusive eruptions and recent lava fountains: Balance between expected and erupted magma volumes at Etna volcano
 GEOPHYSICAL RESEARCH LETTERS, VOL. 40, 6069 6073, doi:10.1002/2013gl058291, 2013 Major effusive eruptions and recent lava fountains: Balance between expected and erupted magma volumes at Etna volcano A.
Earth has more than 600 active volcanoes. An active volcano is one that has erupted within recorded history.
 Volcanoes A volcano is an opening in Earth s surface that erupts gases, ash, and lava. These materials pile up in layers around the opening, forming volcanic mountains. Earth has more than 600 active volcanoes.
Introduction to Earth s s Spheres The Benchmark
 Introduction to Earth s s Spheres The Benchmark Volcanism Volcanic eruptions Effusive: lavas (e.g., Kilauea) Volcanism Volcanic eruptions Explosive: pyroclastic rocks (e.g., Krakatau) Factors Governing
Monthly Volcanic Activity Report (February 2016)
") Monthly Volcanic Activity Report (February 2016) Japan Meteorological Agency Azumayama (Alert Level: 2) Fumarolic activity at the Oana crater has remained at relatively high levels. Aerial observation
Monthly Volcanic Activity Report (February 2016) Japan Meteorological Agency Azumayama (Alert Level: 2) Fumarolic activity at the Oana crater has remained at relatively high levels. Aerial observation
From Punchbowl to Panum: Long Valley Volcanism and the Mono-Inyo Crater Chain
 From Punchbowl to Panum: Leslie Schaffer E105 2002 Final Paper Long Valley Volcanism and the Mono-Inyo Crater Chain Figure 1. After a sequence of earthquakes during the late 1970 s to the early 1980 s
Debris Avalanches. Debris avalanche deposits on a volcano in Chile. All of the area in the foreground is buried by a thick debris avalanche.
 Debris Avalanches Volcanoes are not very stable structures. From time to time, they collapse producing large rock and ash avalanches that travel at high speeds down valleys. Collapse maybe caused by an
Magma. Objectives. Describe factors that affect the formation of magma. Compare and contrast the different types of magma. Vocabulary.
 Magma Objectives Describe factors that affect the formation of magma. Compare and contrast the different types of magma. Vocabulary viscosity Magma Magma The ash that spews from some volcanoes can form
Igneous and Metamorphic Rock Forming Minerals. Department of Geology Mr. Victor Tibane SGM 210_2013
 Igneous and Metamorphic Rock Forming Minerals Department of Geology Mr. Victor Tibane 1 SGM 210_2013 Intrusive and Effusive Rocks Effusive rocks: rapid cooling small crystalls or glas Lava & ash Magmatic
UGRC 144 Science and Technology in Our Lives/Geohazards
 UGRC 144 Science and Technology in Our Lives/Geohazards Session 5 Magma and Volcanism Lecturer: Dr. Patrick Asamoah Sakyi Department of Earth Science, UG Contact Information: pasakyi@ug.edu.gh College
Introduction. The output temperature of Fumarole fluids is strongly related to the upward
 Heat flux monitoring of steam heated grounds on two active volcanoes I.S. Diliberto, E. Gagliano Candela, M. Longo Istituto Nazionale di Geofisica e Vulcanologia, Sezione di Palermo, Italy Introduction.
Pyroclastic Flows. Lesson 6
 Pyroclastic Flows Lesson 6 P yroclastic flows are one of the most dangerous natural events that occur on our planet. They can at hurricane speeds down the slopes of a mountain, destroying everything in
Lava effusion - A slow fuse for paroxysms at Stromboli volcano?
 Lava effusion - A slow fuse for paroxysms at Stromboli volcano? S. Calvari, L. Spampinato, A. Bonaccorso, Clive Oppenheimer, E. Rivalta, E. Boschi To cite this version: S. Calvari, L. Spampinato, A. Bonaccorso,
Igneous Rocks. Magma molten rock material consisting of liquid rock and crystals. A variety exists, but here are the end members:
 Igneous Rocks Magma molten rock material consisting of liquid rock and crystals. A variety exists, but here are the end members: Types of Magma Basaltic, Basic or Mafic very hot (900-1200 C) very fluid
THERMAL REMOTE SENSING OF ACTIVE VOLCANOES
 THERMAL REMOTE SENSING OF ACTIVE VOLCANOES A User s Manual Active volcanoes emit heat through lava flows and erupting vents. Remote measurements of heat emission from such active features can provide insights
Geophysical Classification of Strombolian Explosive eruption
 Geophysical Classification of Strombolian Explosive eruption Ripepe M. and E. Marchetti Department of Earth Sciences, University of Firenze, Firenze - Italy Monitoring Centre for Civil Protection - Italian
GSNL - Geohazard Supersites and Natural Laboratories. Biennial report for Candidate/Permanent Supersite. Hawaiʻi Supersite. Annex to report
 Introduction Biennial report for Candidate/Permanent Supersite Hawaiʻi Supersite Annex to 2014 2016 report During 2014 2016, the Hawaiʻi Supersite achieved a number of noteworthy results. This annex details
Introduction to volcanoes. Volcano: an opening in the earth s surface through which lava, hot gases, and rock fragments erupt
 Introduction to volcanoes Volcano: an opening in the earth s surface through which lava, hot gases, and rock fragments erupt Origin of Volcanoes 1. Magma 50-100 miles below the earth s surface slowly begins
Effusion rate trends at Etna and Krafla and their implications for eruptive mechanisms
 Journal of Volcanology and Geothermal Research 102 (2000) 237 270 www.elsevier.nl/locate/jvolgeores Effusion rate trends at Etna and Krafla and their implications for eruptive mechanisms A.J.L. Harris
Dipartimento di Scienze Geologiche, Palazzo delle Scienze, Corso Italia 55, I Catania, Italy
 Small scale rifting during paroxysmal eruptive episodes at the South East Crater of Mount Etna (Sicily) Marco Fulle & Boris Behncke Osservatorio Astronomico, Via Tiepolo 11, I 34131 Trieste, Italy Dipartimento
REFERENCE: The Blue Planet An Introduction to Earth System Science. Brian J. Skinner and Barbara W. Murck (2011) Third Edition. John Wiley and Sons
 Third Edition. John Wiley and Sons") REFERENCE: The Blue Planet An Introduction to Earth System Science. Brian J. Skinner and Barbara W. Murck (2011) Third Edition. John Wiley and Sons Inc. PLATE BOUNDARIES OCEAN FLOOR SEISMIC ACTIVITY WORLD'S
REFERENCE: The Blue Planet An Introduction to Earth System Science. Brian J. Skinner and Barbara W. Murck (2011) Third Edition. John Wiley and Sons Inc. PLATE BOUNDARIES OCEAN FLOOR SEISMIC ACTIVITY WORLD'S
A. What is a volcano?
 VOLCANISM THE ROCK CYCLE I. Introduction From: Roman god of fire, Vulcan A. What is a volcano? A conical mountain formed around a vent where lava, pyroclastic materials, and gases are erupted. I. Introduction
Your web browser (Safari 7) is out of date. For more security, comfort and the best experience on this site: Update your browser Ignore
 is out of date. For more security, comfort and the best experience on this site: Update your browser Ignore") Your web browser (Safari 7) is out of date. For more security, comfort and the best experience on this site: Update your browser Ignore VO L CANIC CO NE For the complete encyclopedic entry with media resources,
Your web browser (Safari 7) is out of date. For more security, comfort and the best experience on this site: Update your browser Ignore VO L CANIC CO NE For the complete encyclopedic entry with media resources,
Volcanic Plumes. JOHN WILEY & SONS Chichester New York Weinheim Brisbane Singapore Toronto
 Volcanic Plumes R. S. J. SPARKS University of Bristol, UK M. I. BURSIK State University of New York, USA S. N. CAREY University of Rhode Island, USA J. S. GILBERT Lancaster University, UK L. S. GLAZE NASA/Goddard
Recent Kilauea Status Reports, Updates, and Information Releases
 Page 1 of 15 deformation images timelapse movies maps Pu`u `O`o webcam July 21 webcam Recent Kilauea Status Reports, Updates, and Information Releases Kilauea Daily Update issued Feb 28, 2008 09:38 HST
Physical Geography. Tectonics, Earthquakes, and Volcanism. Chapter 12 GEOGRAPHY Earthquakes and Volcanoes. What are Earthquakes?
 Physical Geography GEOGRAPHY 1710 DAVID R. SALLEE Tectonics, Earthquakes, and Chapter 12 Earthquakes and Volcanoes Earthquakes? The shaking or trembling caused by the sudden release of energy Usually associated
Objectives: Describe how volcanoes can affect people. Describe conditions that cause volcanoes. Describe the relationship between volcanoes and Earth
 Objectives: Describe how volcanoes can affect people. Describe conditions that cause volcanoes. Describe the relationship between volcanoes and Earth s moving plates. Inside of Old Smokey, All covered
Evolution of an active lava flow field using a multitemporal LIDAR acquisition
 JOURNAL OF GEOPHYSICAL RESEARCH, VOL. 115,, doi:10.1029/2010jb007463, 2010 Evolution of an active lava flow field using a multitemporal LIDAR acquisition M. Favalli, 1 A. Fornaciai, 1 F. Mazzarini, 1 A.
Geology of the Hawaiian Islands
 Geology of the Hawaiian Islands Class 4 22 January 2004 Turn in Homework #1 Any Questions? IMPORTANT Big Island Field Trip We need a $162 payment for airfare BEFORE January 29 th Description of logistics,
Assessment Schedule 2015 Earth and Space Science: Demonstrate understanding of the causes of extreme Earth events in New Zealand (91191)
") NCEA Level 2 Earth and Space Science (91191) 2015 page 1 of 6 Assessment Schedule 2015 Earth and Space Science: Demonstrate understanding of the causes of extreme Earth events in New Zealand (91191) Evidence
NCEA Level 2 Earth and Space Science (91191) 2015 page 1 of 6 Assessment Schedule 2015 Earth and Space Science: Demonstrate understanding of the causes of extreme Earth events in New Zealand (91191) Evidence
FOUNDATIONS OF GEOLOGY CHAPTER 2
 FOUNDATIONS OF GEOLOGY CHAPTER 2 2.3A- VOLCANOES Volcanoes all share common characteristics. Vent- a central channel through which gases, ash and rock are ejected. Magma- molten rock which lies several
Living in the shadow of Italy's volcanoes
 Living in the shadow of Italy's volcanoes Where is Mount Etna? Mount Etna is located on the east coast of Sicily roughly midway between Messina and Catania (Figure 1). It is the largest and tallest volcano
Effects of Eruptions. Most active in the world Kilauea, Hawaii.
 Inside of Old Smokey, All covered with snow, Lurk tons of hot magma, Getting ready to blow, Objectives: From deep in the chamber, Describe how volcanoes can affect people. Up a vent to the top, Describe
Monthly Volcanic Activity Report (March, 2011)
") Monthly Volcanic Activity Report (March, 2011) Japan Meteorological Agency Yakedake[ Alert Level : 1] Just after "The 2011 off the Pacific coast of Tohoku Earthquake" on 11th March, seismicity became higher
Monthly Volcanic Activity Report (March, 2011) Japan Meteorological Agency Yakedake[ Alert Level : 1] Just after "The 2011 off the Pacific coast of Tohoku Earthquake" on 11th March, seismicity became higher
CHAPTER 2 NOTES -FOUNDATIONS OF GEOLOGY-
 CHAPTER 2 NOTES -FOUNDATIONS OF GEOLOGY- LESSON 2.1A: LAYERS OF THE EARTH GEOLOGY Geology- LAYERS OF THE EARTH Earth has 3 major layers based on their composition: o - the outer layer, made of solid rock.
Monthly Volcanic Activity Report (August 2015)
") Monthly Volcanic Activity Report (August 2015) Japan Meteorological Agency Meakandake (Alert Level: 2) Volcanic seismicity in shallow parts under the area around the Ponmachineshiri crater began to fluctuate
Monthly Volcanic Activity Report (August 2015) Japan Meteorological Agency Meakandake (Alert Level: 2) Volcanic seismicity in shallow parts under the area around the Ponmachineshiri crater began to fluctuate
Chapter 18. Volcanism
 Chapter 18 Volcanism Ring of fire contains 66% of world s active volcanoes Convergent : Divergent: Icelandic Eruption Mount Etna Different Kinds of eruptions: Volcanic activity is controlled by plate tectonics,
Erupted and killed approximately 15,000 people 200 years ago
 1 2 3 4 5 6 7 8 Introduction to Environmental Geology, 5e Chapter 8 Volcanic Activity Volcanoes: summary in haiku form A volcano forms. Magma comes to the surface - explodes, if felsic. Case History: Mt.
Degassing processes and recent activity at Volcán de Colima. Universidad de Colima, Mexico Corresponding author
 Degassing processes and recent activity at Volcán de Colima Nick Varley * & Gabriel Reyes Dávila Universidad de Colima, Mexico Corresponding author email: nick@ucol.mx Volcán de Colima is currently in
68. Izu-Torishima. Summary. Latitude: 30 29'02" N, Longitude: '11" E, Elevation: 394 m (Ioyama) (Elevation Point) (68.
 (Elevation Point) (68.") 68. Izu-Torishima Latitude: 30 29'02" N, Longitude: 140 18'11" E, Elevation: 394 m (Ioyama) (Elevation Point) Izu-Torishima taken from southeast side on August 12, 2002. Courtesy of the Maritime Safety
68. Izu-Torishima Latitude: 30 29'02" N, Longitude: 140 18'11" E, Elevation: 394 m (Ioyama) (Elevation Point) Izu-Torishima taken from southeast side on August 12, 2002. Courtesy of the Maritime Safety
! Profile of Mauna Loa in Hawaii. Mauna Loa is one of five huge shield volcanoes that make up the island of Hawaii.
 - Shield Volcanoes - Low, rounded profiles; slope angles 2-10 ; composed of numerous flows of mafic composition and little explosive activity - Largest of all volcanoes! Shield volcanoes consist of numerous
Directed Reading. Section: Volcanic Eruptions. light in color is called a. felsic. b. oceanic. c. mantle. d. mafic. dark in color is called
 Skills Worksheet Directed Reading Section: Volcanic Eruptions 1. Lava provides an opportunity for scientists to study a. the nature of Earth s inner core. b. the nature of Earth s tectonic plates. c. temperatures
GEOS 606 Physical Volcanology GEOS 606 CRN credits
 GEOS 606 Physical Volcanology GEOS 606 CRN 74060 3 credits September 1th December 17 th, 2011 Mondays, Wednesdays and Fridays MWF 10:30-11:30 Irving 208 and Elvey 101 Dr. Jonathan Dehn office: WRRB 108G,
Continuously Monitored by JMA. Latitude: 24 45'02" N, Longitude: '21" E, Elevation: 169 m (Suribachiyama) (GSI Measuring Point)
 (GSI Measuring Point)") 74. Ioto Continuously Monitored by JMA Latitude: 24 45'02" N, Longitude: 141 17'21" E, Elevation: 169 m (Suribachiyama) (GSI Measuring Point) Overview of Ioto taken from northwest side on July 29, 2008
74. Ioto Continuously Monitored by JMA Latitude: 24 45'02" N, Longitude: 141 17'21" E, Elevation: 169 m (Suribachiyama) (GSI Measuring Point) Overview of Ioto taken from northwest side on July 29, 2008
UGRC 144 Science and Technology in Our Lives/Geohazards
 UGRC 144 Science and Technology in Our Lives/Geohazards Session 6 Volcanic Hazards Lecturer: Dr. Patrick Asamoah Sakyi Department of Earth Science, UG Contact Information: pasakyi@ug.edu.gh College of
Subaerial Felsic Lava Flows and Domes
 Subaerial Felsic Lava Flows and Domes Occurrence Alone or in linear and arcuate chains up to 20 km long Margins of calderas or volcanic depressions. Feeder occupies synvolcanic fault (ring fracture). Extrusion
Goal 2.1 Forces in the Lithosphere. Volcanic Activity
 Goal 2.1 Forces in the Lithosphere Volcanic Activity Lesson 3 Volcanoes, Part 1 Think About It What happens when you shake a can of soda and then open it? Focus Question How does the composition of magma
Vulcanicity. Objectives to identify the basic structure of volcanoes and understand how they form.
 Vulcanicity Objectives to identify the basic structure of volcanoes and understand how they form. Some key terms to start.. Viscosity how well a substance (lava) flows. Acid lavas have a high viscosity,
Ch12&13 Test. 3. Where does the first motion of an earthquake occur? a. fault c. epicenter b. focus d. locus
 Ch12&13 Test Multiple Choice Identify the choice that best completes the statement or answers the question. 1. What is the epicenter of an earthquake? a. the location along a fault where the first motion
A - Piton de la Fournaise activity
 OVPF-IPGP August 2018 Page 1/7 Monthly bulletin of the Piton de la Fournaise Volcanological Observatory ISSN ISSN 2610-5101 A - Piton de la Fournaise activity PITON DE LA FOURNAISE (VNUM #233020) Latitude:
3.2 Notes: Volcanoes Form as Molten Rock Erupts
 3.2 Notes: Volcanoes Form as Molten Rock Erupts Think about What happens when a volcano erupts? Volcanoes erupt many types of material Earth s thin outer layer is, but most of Earth is extremely hot rock
Magma. Objectives. Describe factors that affect the formation of magma. Compare and contrast the different types of magma. Vocabulary.
 Magma Objectives Describe factors that affect the formation of magma. Compare and contrast the different types of magma. Vocabulary viscosity Magma Magma The ash that spews from some volcanoes can form
Figure 8-21 Distribution of Lava Flow for the Model
 Figure 8-21 Distribution of Lava Flow for the Model 2) Pyroclastic Flow The energy cone model was used for the simulation. a. The angle of inclination of Energy Line, φ, from the summit was 5.3 degrees
A relation between lava discharge rate, thermal insulation, and flow area set using lidar data
 GEOPHYSICAL RESEARCH LETTERS, VOL. 37,, doi:10.1029/2010gl044683, 2010 A relation between lava discharge rate, thermal insulation, and flow area set using lidar data Andrew Harris, 1 Massimiliano Favalli,
Monthly Volcanic Activity Report (November 2015)
") Monthly Volcanic Activity Report (November 2015) Japan Meteorological Agency Meakandake (Alert Level: 1) Alert level downgrade from 2 to 1 on 13 November A field survey conducted from 2 to 5 November showed
Monthly Volcanic Activity Report (November 2015) Japan Meteorological Agency Meakandake (Alert Level: 1) Alert level downgrade from 2 to 1 on 13 November A field survey conducted from 2 to 5 November showed
Constructive & Destructive Forces
 Constructive & Destructive Forces Intro: Constructive Forces Processes that create landforms. Destructive Forces Processes that destroy landforms. Intro: Constructive Forces Volcanoes Deposition Landslides
Continuous Caldera Changes in Miyakejima Volcano after Hiroyuki HASEGAWA, Hiroshi P. SATO and Junko IWAHASHI
 Continuous Caldera Changes in Miyakejima Volcano after 2001 60 Hiroyuki HASEGAWA, Hiroshi P. SATO and Junko IWAHASHI Abstract This study investigated the evolvement of the caldera at Miyakejima volcano
Detection from Space of Active Volcanism on Earth and, Potentially, on Venus and Rocky Exoplanets
 Detection from Space of Active Volcanism on Earth and, Potentially, on Venus and Rocky Exoplanets Pete Mouginis Mark Hawaii Institute Geophysics and Planetology University of Hawaii Overview Styles of
Engineering Geology ECIV 2204
 Engineering Geology ECIV 2204 2017-2016 Chapter (4) Volcanoes Chapter 4: Volcanoes and Other Igneous Activity cataclysmic relating to or denoting a violent natural even Eventually the entire
Requirements for a survey system of active volcanoes based on muon radiography
 Requirements for a survey system of active volcanoes based on muon radiography Philippe LABAZUY on behalf of the TOMUVOL Collaboration http://www.tomuvol.fr/ Laboratoire Magmas et Volcans, Laboratoire
Monthly Volcanic Activity Report (March 2013)
") Monthly Volcanic Activity Report (March 2013) Hakoneyama (Alert Level: 1) Shallow earthquake activity from the area near Mt. Komagatake to Sengokuhara has largely remained at low levels since the middle
Monthly Volcanic Activity Report (March 2013) Hakoneyama (Alert Level: 1) Shallow earthquake activity from the area near Mt. Komagatake to Sengokuhara has largely remained at low levels since the middle
Diverse deformation patterns of Aleutian volcanoes from InSAR
 Diverse deformation patterns of Aleutian volcanoes from InSAR Zhong Lu 1, Dan Dzurisin 1, Chuck Wicks 2, and John Power 3 U.S. Geological Survey 1 Cascades Volcano Observatory, Vancouver, Washington 2
A Volcano is An opening in Earth s crust through
 Volcanoes A Volcano is An opening in Earth s crust through which molten rock, gases, and ash erupt. Also, the landform that develops around this opening. Kinds of Eruptions Geologists classify volcanic
Avalanches. Avalanche s
 Avalanches Avalanche s Avalanches were first imagined as giant snowballs which increased in size from accretion of underlying snow What are avalanches? They are flows which move under the influence of
Physical Geology, 15/e
 Lecture Outlines Physical Geology, 15/e Plummer, Carlson & Hammersley Copyright McGraw-Hill Education, Inc. Permission required for reproduction or display. Volcanism and Extrusive Rocks Physical Geology
and their risks A look at volcano risk for young students. Produced by the MED-SUV project.
 and their risks A look at volcano risk for young students. Produced by the MED-SUV project. Volcano Shapes: A volcano is a place (on Earth and OTHER PLANETS) where magma comes to the surface. This event
Section 10.1 The Nature of Volcanic Eruptions This section discusses volcanic eruptions, types of volcanoes, and other volcanic landforms.
 Chapter 10 Section 10.1 The Nature of Volcanic Eruptions This section discusses volcanic eruptions, types of volcanoes, and other volcanic landforms. Reading Strategy Previewing Before you read the section,
19. Esan Continuously Monitored by JMA
 19. Esan Continuously Monitored by JMA Latitude: 41 48'17" N, Longitude: 141 09'58" E, Elevation: 618 m (Esan) (Triangulation Point) Overview of Esan, taken from east side on March 13, 2009 by the Japan
Journal of Volcanology and Geothermal Research
 Journal of Volcanology and Geothermal Research 193 (2010) 143 160 Contents lists available at ScienceDirect Journal of Volcanology and Geothermal Research journal homepage: www.elsevier.com/locate/jvolgeores
When Mount St. Helens erupted, trapped gases caused the north side of the mountain to explode. Volcanic ash was ejected high into the atmosphere.
 When Mount St. Helens erupted, trapped gases caused the north side of the mountain to explode. Volcanic ash was ejected high into the atmosphere. A volcano is a mountain that forms when magma reaches the
Foundations of Earth Science, 6e Lutgens, Tarbuck, & Tasa
 Foundations of Earth Science, 6e Lutgens, Tarbuck, & Tasa Fires Within: Igneous Activity Foundations, 6e - Chapter 7 Stan Hatfield Southwestern Illinois College The nature of volcanic eruptions Characteristics
Topic 1: Modeling SFU: (JVGR 1992)
") Topic 1: Modeling SFU: (JVGR 1992) 1. Were different chamber top shapes used other than flat, i.e. convex, concave, convoluted / ridged? What is the sensitivity of your models to this? Also, was there
Topic 1: Modeling SFU: (JVGR 1992) 1. Were different chamber top shapes used other than flat, i.e. convex, concave, convoluted / ridged? What is the sensitivity of your models to this? Also, was there
TEMPORAL VARIABILITY OF ICE FLOW ON HOFSJÖKULL, ICELAND, OBSERVED BY ERS SAR INTERFEROMETRY
 TEMPORAL VARIABILITY OF ICE FLOW ON HOFSJÖKULL, ICELAND, OBSERVED BY ERS SAR INTERFEROMETRY Florian Müller (1), Helmut Rott (2) (1) ENVEO IT, Environmental Earth Observation GmbH, Technikerstrasse 21a,
Chapter 10: Volcanoes and Other Igneous Activity Section 1: The Nature of Volcanic Eruptions I. Factors Affecting Eruptions Group # Main Idea:
 Chapter 10: Volcanoes and Other Igneous Activity Section 1: The Nature of Volcanic Eruptions I. Factors Affecting Eruptions Group # A. Viscosity Group # B. Dissolved Gases Group # II. Volcanic Material