DEVELOPMENT OF SELF-CLEANING BOX CULVERT DESIGNS
|
|
|
- Brianne Lyons
- 6 years ago
- Views:
Transcription
1 FINAL REPORT FOR IHRB TR-545 DEVELOPMENT OF SELF-CLEANING BOX CULVERT DESIGNS Sponsored by: The Iowa Highway Research Board The Iowa Department of Transportation Research and Technology Bureau 800 Lincoln Way, Ames, Iowa Investigators: M. Muste (PI), R. Ettema (Co-PI), H-C. Ho (RA), S. Miyawaki (RA) The University of Iowa IIHR-Hydroscience & Engineering College of Engineering Iowa City, IA Phone: Fax: IIHR Technical Report #475 Iowa City, June 2009
2 About the IIHR- Hydroscience & Engineering IIHR, a unit of The University of Iowa s College of Engineering, is one of the nation s premier and oldest fluids research and engineering laboratories. Situated on the Iowa River in Iowa City, Iowa, IIHR seeks to educate students and to conduct research in the broad fields of hydraulics and fluid mechanics. Disclaimer Notice The contents of this report reflect the views of the authors, who are responsible for the facts and the accuracy of the information presented herein. The opinions, findings and conclusions expressed in this publication are those of the authors and not necessarily those of the sponsors. The sponsors assume no liability for the contents or use of the information contained in this document. This report does not constitute a standard, specification, or regulation. The sponsors do not endorse products or manufacturers. Trademarks or manufacturers names appear in this report only because they are considered essential to the objective of the document. The opinions, findings, and conclusions expressed in this publication are those of the author and not necessarily those of the Iowa Department of Transportation Statement of Non-Discrimination Federal and state laws prohibit employment and/or public accommodation discrimination on the basis of age, color, creed, disability, gender identity, national origin, pregnancy, race, religion, sex, sexual orientation or veteran s status. If you believe you have been discriminated against, please contact the Iowa Civil Rights Commission at or Iowa Department of Transportation's affirmative action officer. If you need accommodations because of a disability to access the Iowa Department of Transportation s services, contact the agency's affirmative action officer at Non-Discrimination Statement The University of Iowa does not discriminate on the basis of race, color, age, religion, national origin, sexual orientation, gender identity, sex, marital status, disability, or status as a U.S. veteran. Inquiries can be directed to the Director of Equal Opportunity and Diversity at the University of Iowa, (319) ii
3 Summary The main function of a roadway culvert is to effectively convey drainage flow during normal and extreme hydrologic conditions. This function is often impaired due to the sedimentation blockage of the culvert. This research sought to understand the mechanics of sedimentation process at multi-box culverts, and develop self-cleaning systems that flush out sediment deposits using the power of drainage flows. The research entailed field observations, laboratory experiments, and numerical simulations. The specific role of each of these investigative tools is summarized below: a) The field observations were aimed at understanding typical sedimentation patterns and their dependence on culvert geometry and hydrodynamic conditions during normal and extreme hydrologic events. b) The laboratory experiments were used for modeling sedimentation process observed insitu and for testing alternative self-cleaning concepts applied to culverts. The major tasks for the initial laboratory model study were to accurately replicate the culvert performance curves and the dynamics of sedimentation process, and to provide benchmark data for numerical simulation validation. c) The numerical simulations enhanced the understanding of the sedimentation processes and aided in testing flow cases complementary to those conducted in the model reducing the number of (more expensive) tests to be conducted in the laboratory. Using the findings acquired from the laboratory and simulation works, self-cleaning culvert concepts were developed and tested for a range of flow conditions. The screening of the alternative concepts was made through experimental studies in a 1:20 scale model guided by numerical simulations. To ensure the designs are effective, performance studies were finally conducted in a 1:20 hydraulic model using the most promising design alternatives to make sure that the proposed systems operate satisfactory under closer to natural scale conditions. iii
4 ACKNOWLEDGEMENTS The field, laboratory, and numerical simulation work associated with the present project were funded by the Iowa Highway Research Board, as Research Project TR-545. A Technical Advisory Committee, provided advice and recommendations during the project development. The members of the Committee and their affiliations are listed below: David Claman Roger Schletzbaum Jon Ites Iowa Department of Transportation Marion County, Iowa Buena Vista County, Iowa Conduct of the project was coordinated with Mark Dunn, Iowa Department of Transportation. iv
5 TABLE OF CONTENTS 1. Introduction Study Background Study Objects and Approaches Literature Review Culvert Definition Expansion and Contraction in Open Channel Culvert Hydraulics Sedimentation at Culvert Culvert Design Considerations Numerical Modeling of Culvert Hydraulics Field Visit of Culverts in Iowa Johnson County Marion County Buena Vista County Laboratory and numerical modeling Introduction Baseline tests Model 1:20 Configuration and Operation Baseline test Baseline test Baseline test Screening tests for the self-cleaning designs Fillets (F) Vanes Numerical simulation of flow through culverts Simulation cases Computational grid Flow modeling Post processing Numerical model testing Numerical simulation for the self-cleaning design FA Performance Tests Introduction Laboratory experiment for the reference culvert model LSPIV experiments in the 1:5 culvert model Performance tests for the selected self-cleaning design Conclusion and recommendation References v
6 LIST OF FIGURES Figure 1-1. Culvert site at Iowa City, blue arrow indicates flow direction: a) upstream view from the culvert, b) downstream view from the channel left bank... 3 Figure Typical Iowa culvert (near Solon, Iowa)... 5 Figure Cross drains usually connect road ditches on the side of a roadway... 5 Figure Contraction effect of the culvert... 6 Figure Classification of culvert flow... 9 Figure Types of inlet control Figure Culvert entrance acts like a weir Figure Culvert entrance acting as a submerged sluice gate Figure Types of outlet control Figure Culvert with submerged upstream and downstream Figure Culvert with unsubmerged upstream and downstream Figure 2-5-1: Culvert retrofitting using uneven inverts: a) pre-construction condition in 1992, b) post-construction in Figure Iowa Map indicate the counties which were visited in this research Figure Three-box culverts in Johnson County: the yellow markers are field visit locations and red marker is USGS stream station in this county Figure Marion County: the yellow markers are field visit locations and red marker is USGS stream station in this county Figure Buena Vista County Map: the yellow markers are field visit locations and red marker is USGS stream station in this county Figure Overview of the flume Figure Layout of the culvert model Figure Sediment feeder Figure Trial flow conditions of the experiment Figure Sediment accumulation upstream of the culvert inlet Figure Sediment load distribution Figure Sediment accumulation over 6 hours of observation Figure Rate of sediment accumulation in the expansion and three barrels Figure Dune height variation with time from one-hour to six-hours Figure Layout of the culvert model B Figure Flow condition in baseline test vi
7 Figure Surface flow field for case B (HW/D=0.5): (a) Velocity vectors, (b)velocity vectors and velocity magnitude contour, (c) Streamlines Figure Surface flow field for Flatbed C with headwater depth 0.382ft: (a) Velocity vectors, (b)velocity vectors and velocity magnitude contour, (c) Streamlines Figure Rate of sediment accumulation in the culvert area for flow Case B Figure Hourly sediment accumulation in the expansion area for flow case B Figure Sedimentation pattern compare to the baseline test result Figure Sedimentation pattern compare to the baseline test result Figure Sedimentation pattern compare to the baseline test result Figure Sedimentation pattern compare to the baseline test result Figure Sedimentation pattern compare to the baseline test result Figure Sedimentation pattern compare to the baseline test result Figure Calculation domains for numerical simulation: (a) domain for model 1/20B, (b) domain for model 1/20B+FA design Figure Near-surface flow field in flow Case B obtained with numerical simulations: (a) streamlines, (b) streamwise velocity, (c) out of plane vorticity Figure Sediment transport characteristics in flow Case B obtained from numerical simulations : (a) shear velocity, (b) sediment paths Figure Surface flow field for flow case B obtained in laboratory tests with LSPIV and imagery: (a) Streamline and velocity magnitude contour at the free surface, (b) streamwise velocity at the free surface, (c) vorticity at the free surface, and (d) sedimentation (Relevant comparisons: a, b, and c with a, b, and c, respectively and 4-4-3b with 4-4-5d.) Figure Near surface flow field for flow case C obtained with numerical simulations: (a) streamlines (b) streamwise velocity (c) out of plane vorticity Figure Surface flow field for flow case C obtained in laboratory test with LSPIV: (a) Streamline and velocity magnitude contour, (b) streamwise velocity, (c) vorticity Figure The mesh resolution: (a) the numerical model mesh, (b) the LSPIV analysis mesh 88 Figure Comparison of average velocities error betweennumerical simulations (with FLUENT) andexperimental results (with LSPIV) :(a) flow Case B, and (b) flow Case C Figure Simulated near-surface flow field for flow case B over the fillets FA set in the expansion: (a) streamlines, (b) streamwise velocity, (c) out of plane vorticity Figure Simulated sediment transport characteristics for flow case B over fillets FA set in the expansion: (a) shear velocity, (b) sediment paths Figure Schematic View of the physical model Figure Upstream view of the model Figure Sediment deposition patterns: a) Initial condition, b) Case A, c) Case B, d) Case C vii
8 Figure Elevation of sediment deposition at the cross-section under different flow conditions Figure Streamlines condition: a) reference model, b) FA design model Figure Velocity contour: a) reference model, b) FA design model Figure Self-cleaning fillet geometry Figure Sediment deposition patterns for the culvert fitted with fillets FA: a) Initial condition, b) flow Case A, c) flow Case B, d) flow Case C LIST OF TABLES Table 1-1 Department of Transportation Multi-barrel Culvert Survey Result... 1 Table Culvert types and numbers in Johnson County Table Summary of Design FA Table Summary of Design FB Table Summary of Design FC Table Summary of Design FD Table Summary of Design VA Table Summary of Design VB Table Simulation case (HW= water depth, D=depth of the culvert, FA= type FA filletbased self-cleaning design set in the upstream expansion area, A,B,C= flow conditions in case A,B,C see Figures and ) viii
9 LIST OF PLATES Plate 1: J_Site 1: Culvert on Hwy # Plate 2: J_Site 2: Culvert on Hwy # Plate 3: J_Site 3: Culvert on Racine Ave Plate 4: J_Site 4: Culvert on Hwy # Plate 5: J_Site 5: Culvert on Black Hawks Ave Plate 6: J_Site 6: Culvert on Sand Road Plate 7: J_Site 7: Culvert on 480 th St Plate 8: J_Site 8: Culvert on Kansas Ave Plate 9: J_Site 9: Culvert on Newport Rd Plate 10: J_Site 10: Culvert on Prairie Du Chien Rd Plate 11: M_Site1: Culvert on Hwy. G-76 East and Hwy Plate 12: M_Site2: Culvert on Hwy. G-76 West and Hwy. S Plate 13: M_Site 3: Culvert on Lisbon St. and Hwy. S Plate 14: M_Site 4: Culvert on 200 Ave North and Beardsley St Plate 15: M_Site 5: Culvert on Hwy G-28 and Hwy. T-15 South Plate 16: M_Site 6: Culvert on 218 th Ave and Hwy. T-17 East Plate 17: BV_Site 1: Culvert on 580 th St and 70 th Ave Plate 18: BV_Site 2: Culvert on 565 th St Plate 19: BV_Site 3: Culvert on 640 th St and 10 th Ave Plate 20: BV_Site 4: Culvert on Hwy 71 and 500 th St ix
 or a single culvert pipe. Typically, larger flows and road embankment heights entail the use of multi-barrel culverts.")
10 1. Introduction 1.1 Study Background A culvert traditionally has been the economical means of conveying drainage flows across road cross-sections. Culverts may comprise multiple culvert pipes (a multi-barrel culvert) or a single culvert pipe. Typically, larger flows and road embankment heights entail the use of multi-barrel culverts. The advantage of a multi-barrel culvert is that the requirement of upstream headwater is smaller than for a single-barrel culvert. Further, building a multibarrel culvert formed by several smaller-diameter pipes is more economical than a relatively large single-barrel culvert. A survey of state transportation engineers conducted in February 2007, revealed that multi-barrel culverts are commonly used throughout the U.S. (Table 1-1). Table 1-1 Department of Transportation Multi-barrel Culvert Survey Result (Gary, 2008) The transition between a natural approach channel and a culvert may vary considerably. The design of a transition structure (expansion/contraction) is required for culvert design. In cases where the channel width is larger than the geometry of culvert, the normal design of channel transition for culverts involves contraction of the channel upstream of the openings, and expansion to the natural channel width on the downstream side. Extensive literature exists for these conditions, especially with regard to backwater effects and use of backwater stage to estimate channel discharge for flood analyses. In another case where the design procedure suggests that required size and geometry of culverts extend beyond the width of the natural channel, channel transitions are also required to convey drainage flow to and from the culvert. An expansion is needed upstream of the culvert, and a contraction is downstream 1
11 of the culvert. The transitions, though, may disturb the channel s balance of water flow and sediment transport, and have undesirable consequences such as sediment deposition immediately upstream of, and through, the culvert. In many areas of Iowa, drainage flow through box culverts is minimal throughout most of the year. Box culverts are generally designed to handle events with a 50-year return period. For multi-barrel culverts, it is not uncommon for one barrel to carry the flow most of the time, when flows are reduced. Over many years of lower flow, sediment deposition can cause some of the barrels of multi-box culverts to silt-in and become partially filled with sediment. Figure 1-1 shows a three-barrel box culvert at Iowa City, Iowa, as viewed from the road and upstream channel. Each barrel has 10ft height and 10ft wide. The picture was taken approximately through the center line of the culvert. The width of the approach channel is narrower than the culvert span. Figure 1-1(a) shows an expansion region between the channel and the culvert that is contrary to the normal culvert design in which the culvert width is smaller than the channel. Figure 1-1 (b) shows sediment accumulated in the expansion region and barrels. It is common for multi-barrel culverts, designed to handle flood events, to accumulate sediment within and upstream the culvert during lower flow conditions. Sediment accumulation reduces flow capacity, and decreases safety, because the culvert will not have its design flow capacity. 1.2 Study Objectives and Approaches The research findings obtained by Bodhaine (1968) and Normann (1985) are widely used for culvert design. Culverts are designed to pass a design discharge associated with a certain return-period flood, such as 50-year return period. Further, culvert flows are classified as either low-head or high-head flows. At large flow-rate, culverts may have a contraction upstream the culvert and an expansion downstream the culvert. This is the normal assumption and a standard analysis for culvert designers. From low to moderate flows, however, culverts can perform in an opposite way: an expansion at the entrance and a contraction at the exit. Consequently, sediment movement and deposition associated with lower flow may occur differently than during large flood events. 2

12
13 2. Literature Review 2.1 Culvert Definition In general terms, a culvert is a closed conduit or pipe located transversely under a roadway or embankment so as to facilitate flow drainage from a natural channel or drainage ditch. Culvert flow is an open channel flow when the culvert flows partially full. For the purpose of culvert design and maintenance, various definitions for the culvert are used. Different agencies, and geographic regions, distinguish culverts from bridges in accordance with various criteria. The most common criterion is based on culvert span. For example, a drainage construction with an interior width of 6.1 ft or less is defined as a culvert by New York State Department of Transportation (NYSDOT), whether there are single or multiple spans of this dimension. Any structure with a span or diameter less than 10ft when measured parallel to the centerline of the roadway is defined as a culvert by the Ohio Department of Transportation (ODOT). A culvert is any structure under the roadway with a clear opening of 20 ft or less measured along the center of the roadway between inside of end walls, otherwise, it is defined as bridges by Washington State Department of Transportation (WSDOT) and Texas Department of Transport (TxDOT). Another categorization is based on construction. A structure that passes flow and has a paved bottom is defined by the Maryland Department of the Environment as a culvert. This definition is also used by Maryland State Highway Administration (SHA). For the present study, a culvert is simply defined as a hydraulically short conduit under the roadway that transports stream from one side of the embankment to the other (a definition developed by Chow, 1959). A culvert is usually covered with embankment, and is composed of structural material around the entire perimeter (Figure 2-1-1). It can be supported on spread footings with the streambed or concrete riprap channel serving as the bottom. A specific type of culvert is called a runoff management culvert. It is strategically placed to 4

14
15
16 b b y y y y y y Fr (2) where 1 Fr is Froude number at section 1. Equation (2) is the general form of channel transition to specify the flow condition. A primary design criterion usually is to avoid supercritical flow occurring in a transition which may have oblique wave problems. The energy loss can be represented: ) 2 ( ) 2 ( g V y g V y E (3) Energy losses can be separated into two parts: friction loss and eddy loss. The former loss is due to bed friction within channel transitions, the other loss is associated with expansion or contraction of the flow. Friction loss can be assessed by means of Manning s equation. Approaches to quantify these expansion and contraction losses vary. Even with the assumption of one-dimensional flow, exact solutions are not available. If flow condition remains subcritical through sudden expansion, Henderson (1966) presented the following approximate result for energy loss: ) ( b b b b Fr b b g V E (4) In the limit for small Froude numbers, equation (4) can be simplified: g V V E 2 ) ( (5) Chow (1956) also shows the similar result for subcritical condition: g V V E 2 ) ( (6)
17 where is a coefficient for sudden expansions. A sudden expansion or contraction, however, is not always used between different channel sections. Sometimes a smooth or faired transition is used to decrease excessive energy losses. This energy loss depends on the shape of the transition and is expressed as: E C L h v (7) in which C L is loss coefficient and should be determined experimentally, h L is the difference of velocity head. 2.3 Culvert Hydraulics The design hydraulics and input hydrology for culverts essentially involves the optimal selection of the barrel cross-section that passes the design discharge. Culvert construction reflects considerations of requisite structural strength, hydraulic roughness, durability, and corrosion/abrasion resistance for a culvert. Culvert hydrologic analysis seeks to estimate a design discharge, and hydraulic analysis is required for sizing the culvert to pass the design flow. A complete description of the hydrologic and hydraulic analyses for culverts is beyond the scope of the present report. It is important to comment that flow regimes vary from culvert to culvert, and even vary with flow rate for a given culvert. Bodhaine (1982) classified culvert flow into six types during the peak flow. The types are illustrated in the Figure 2-3-1, which differentiates them on the basis of the location of the flow control section and the relative height of the headwater and tailwater elevations. Three flow types (1, 2, and 3) are for low-head flow, when the ratio of headwater depth and the opening of culvert is less than 1.5. Two types are for high-head flow (5, and 6) when the ratio is larger than or equal to 1.5. The remaining flow type is for fully submerged flow through a culvert. 8

18 Figure Classification of culvert flow (Bodhaine, 1982) The National Bureau Standards (NBS) completed a series of culvert studies, sponsored by Federal Highway Administration (FHWA), in early 1950 s. These reports provide a comprehensive analysis of culvert hydraulics under various flow conditions. They were used to develop culvert design graphs or nomographs for use in sizing culverts for various types of flow control and then design for the control which produces the minimum performance. In their research, flow conditions include the cross-section of a culvert flowing full and partially full. The former condition is pressure flow and the other is free-surface flow. Normann (1985) classified two basic types of flow control from the preceding result of NBS and FHWA: inlet and outlet control. The concept used to classify culverts is the location of the control section. The classification, summarized below, is presented in Hydraulic Design of Highway Culverts (Normann, 1985) and is widely used in the culvert design. 1. Culverts with inlet control have supercritical flow in barrels and the control section is near inlet. 2. Culverts with outlet control have subcritical flow in barrels and the control section is 9
19 at the downstream end of the culvert. 3. Culverts, with inlet and outlet submerged conditions, perform as a conduit. However, the hydrodynamic of culvert is regarded as open channel if culverts have either inlet or outlet in unsubmerged condition. 4. Culvert may operate under either inlet or outlet control with a given flowrate, so the actual operating condition is not easily determined. Instead, the concept of the culvert minimum performance is used to design a culvert under the peak discharge. Figure illustrates four different examples of inlet control that depends upon the submergence of inlet and outlet ends of the culvert. In Figure 2-3-2a, neither the inlet nor the outlet of the culvert is submerged. The control section just downstream of the entrance and the flow in the barrel is supercritical. Partly full flow occurs through the barrel, and approaches normal depth at the outlet. Figure 2-3-2b shows that the outlet is submerged and inlet is unsubmerged. In this case, flow just downstream of the inlet is supercritical and a hydraulic jump occurs in the barrel. Figure 2-3-2c is a typical design situation. The inlet is submerged and the outlet flows freely. The flow in the barrel is supercritical and partially full over its length. Critical depth is located just downstream of the culvert entrance, and the flow is approaching normal depth at the downstream end. Figure 2-3-2d shows an unusual condition illustrating the fact that even submergence of both the inlet and the outlet ends of the culvert does not have full flow through the barrel. In this case, a hydraulic jump may form in the barrel; the median inlet provides ventilation of the culvert barrel. A culvert under inlet control performs as weir when the inlet is unsubmerged, and as orifice when it is submerged. If the entrance is unsubmerged, the inlet control section is near the entrance of the culvert. Application of the energy equation, neglecting head loss at control section (figure 2-3-3), gives y c 2 Vc 2 g E c HW (8) 10
20 Figure Types of inlet control, (Normann, 1985) In equation (8), y c is critical depth near the entrance of culvert, V c is critical velocity, E c is critical specific energy, and HW is headwater. HW y c Figure Culvert entrance acts like a weir 11
21 For critical flow in a rectangular box culvert, y 2 3E, as derived by Charbeneau (2006) using equation (8) assuming V Q C By ) c ( b c c c, where Q= barrel discharge, C b = coefficient expressing effective width contraction associated with the culvert entrance edge conditions, and B = width (span) of culvert. Therefore, equation (8) can be written as HW D Cb 2 3 Q A gd 2 3 (9) In equation (9), D=culvert rise (height); and A=full culvert cross section area (A=BD for a box culvert). If head loss is considered and the distance between entrance and control section is substantial, energy equation at control section yields HW ' E h LS (10) c L ' In equation (10), hl is head loss, L is distance between entrance and control section, and S is channel slope. For rectangular box culvert, the above equation could be written as HW D ' 3 1 Q hl L S 2 C (11) b A gd D D Based on studies of NBS, FHWA developed two equations for unsubmerged inlet control performance similar in form to equation (9): M HW E Q c M / 2 Kg 0.5S (12) D D A gd 12
22 HW D Kg M / 2 Q A gd In equation (12) and (13), S is slope of the culvert, K and M are the coefficients based on the culvert configuration. Equation (12) could be modified for rectangular box culvert (Charbeneau, 2002): HW D 2 / 3 M (13) 3 Q Q M / 2 Kg 0.5S (14) 2 A gd A gd M According to Normann (1985), the constant M = 0.667) for a rectangular culvert box. Then, HW D Kg 1 3 Q A gd 2 3 (15) When a culvert inlet is submerged, the culvert performs as either an orifice or as a sluice gate. For orifice performance (Norman, 1985) Q C A 2gh C BD 2g( HW 1 d d D) (16) 2 In equation (16), C d is a discharge coefficient that must be evaluated for different inlet conditions, A is the culvert inlet full area, h is the head on the culvert centroid, and H is the upstream headwater. The discharge coefficient Cd = 0.6 for square-edge entrance conditions. The equation resulting when the culvert acts as a sluice gate is similar. For a sluice gate the performance equation is (Henderson, 1966): Q C BD 2g( HW C D) (17) c c In equation (17), Cc is a contraction coefficient. The above equations can be expressed as the performance equation. Charbeneau (2006) applied energy equation with HW representing the headwater specific energy shown in Figure 2-3-4: 13
23 HW 2 v 2 g en C c D (18) In equation (18), v en =velocity within the culvert entrance; and C c =contraction coefficient associated with flow passing the culvert entrance. Energy losses can be neglected and be included within coefficients. With the equation (18), the discharge is calculated from: Q ( C B)( C D) v C C A 2g( HW C D) (19) b c en b c c Equation (19) could be written as a performance equation: HW D 1 2( C C ) b c 2 Q A gd 2 C c (20) For submerged inlet conditions, Normann (1985) have been fit the data from experiments performed by National Bureau of Standards an equation: HW D 2 Q Y cg 0.5S (21) A gd In equation (21), Y and c are constants based on the culvert configuration. Figure Culvert entrance acting as a submerged sluice gate (Charbeneau, 2006) 14
24 For culvert flows with outlet control, critical depth does not occur near the entrance, and the flow condition in the culvert barrel is subcritical. Figure illustrates five examples of outlet control in which all cases have the control section at the outlet end or further downstream. Outlet control occurs when the barrel is incapable of conveying as much flow as the inlet opening. Figure 2-3-5a represents the classic full flow condition, with both inlet and outlet submerged. The barrel is in pressure flow throughout its length. This condition is often assumed in calculations, but seldom actually exists. Figure 2-3-5b depicts the outlet submerged with the inlet unsubmerged. For this case, the headwater is shallow enough so that the inlet crown is exposed as the flow contracts into the culvert. Figure 2-3-5c shows the entrance submerged to such a degree that the culvert flows full throughout its entire length while the exit is unsubmerged. This is a rare condition, requiring an extremely high headwater to maintain full barrel flow with no tailwater. The outlet velocities are usually high under this condition. Figure 2-3-5d is the typical condition. The culvert entrance is submerged by the headwater and the outlet end flows freely with a low tailwater. For this condition, the barrel flows partly full over at least part of its length (subcritical flow) and the flow passes through critical depth just upstream of the outlet. Figure 2-3-5e is another typical condition, with neither the inlet nor the outlet end of the culvert submerged. The barrel flows partly full over its entire length, and the flow profile through the barrel is subcritical. The outlet-control flow condition can be described using the energy equation. Full flow, as depicted in Figure 2-3-6, is typical for outlet control culverts. The culvert flow full can be computed between section 1 and 4. Neglecting the velocity head in section 1, and friction loss between 1 and 2, and between 3 and 4, the energy equation gives 2 V4 H S0L TW h 2g h L 23 h ex (22) In equation (22), H is water depth at section 1 that can be replaced as HW, TW is water depth at section 4, h L is loss due to entrance contraction, h2 3 is friction loss between 2 and 3, and hex is loss due to sudden expansion between 3 and 4. According to Jain (2001), 15
25 h 1 C V g and h ex V 2g V 2g L d , where C d is discharge coefficient. 2 2 Based on Manning discharge formula, h 3 23 could be written into n LV R of equation (22) can be modified as a performance equation: An expression HW D TW n Lg Q 1 Q L S 2 0 (23) D R A gd 2C d A gd D 2 In equation (23), R0 is hydraulic radius in the barrel, and n is Manning coefficient. Compared to the formulation for inlet control, the HW and discharge relationship under outlet control is affected not only entrance geometry of the culvert, but also TW and roughness in the barrel. Normann (1985) considered the full flow culvert and calculated the outlet control flow condition with energy equation. 2 2 V1 V4 HW TW 2g 2g H loss neglected the approaching velocity and exit velocity, and obtained: Where H loss is total loss and represented as: H loss (24) HW TW (25) H loss 2 2 2gn L V 1 K e 4 3 R (26) 0 2g In equation (26), barrel. Ke is a coefficient varying with inlet configuration, and V is velocity in the 16
26 Figure Types of outlet control (Normann, 1985) Figure Culvert with submerged upstream and downstream 17
27 If a culvert s upstream and downstream ends are both unsubmerged, the flow with mild channel slope can have free-surface flow in the culvert (figure 2-3-7). The control section would occur at the outlet end or further downstream. The flow is partly full in the culvert and can be described by the energy equation between section 1 and 3 if control section is at section 3 in Figure V1 V3 H S0L y3 hl h1 2 h23 (27) 2g 2g Figure Culvert with unsubmerged upstream and downstream If the control section were at the further downstream, the energy equation should apply between section 1 and 4: 2 2 V1 V4 H S0L y4 hl h1 2 h23 (28) 2g 2g However, for the inlet to remain unsubmerged, the depth in section 3 is equal to that in section 4. Therefore, the above two equations can be similarly analyzed. In equation (27), the water depth at section 3 can be replaced as TW (Jain, 2001), head loss 1 C 2 2 1V g h L 2 due to entrance, 23 3 h could be written into Q 2 / K K L 2 3, and h 12 can be neglected V1 1 V3 LQ HW TW (29) 2 2g C 2g K K d
28 From the studies of NBS and FHWA, the outlet control flow conditions were only analyzed for full barrel flow. If free-surface flow is occurring as Figure 2-3-7, the factors along the culvert all influence the performance of the culvert. Equation (28) cannot easily be written into a performance equation. It is necessary to calculate the backwater profile based on the tailwater depth. 2.4 Sedimentation at Culvert Site condition, steam characteristics, or economic considerations can require that a culvert have multiple barrels. Multi-barrel box culverts are more economical than a single widespan culvert because the structural requirements of a long span are costly. Experience, however, has shown that significant problems may arise at multi-barrel culvert sites, including erosion at the inlet and outlet, sediment buildup in the barrels, and clogging of the barrels with debris. Attention to the effects of these interactions between the stream channel and the culvert is necessary in the culvert design. The balance of forces associated with flow and sediment transport in natural streams and manmade channels can be locally disrupted by culvert presence. One outcome of the disruption is the deposition of transported sediment, or scour of sedimentary boundaries at the ends of the culvert. Sedimentation is a common occurrence at culvert inlets. Sedimentation of a culvert entrance, and within a culvert, could be influenced by the many factors, including the size and characteristics of material of which the channel is composed, the hydraulic characteristics generated under different hydrology events, the culvert geometry design, channel transition design, and the vegetation around the channel. Most hydraulic manuals provide only clear water designs for culverts; few may comment that sediment might deposit at normal flow condition and then be flushed out during storm events. Culverts commonly are usually constructed on relative mild channels to avoid supercritical flow upstream the entrance. The relative mild slope will increase the potentiality of sedimentation even during storm events. Sediment deposition building up through the culvert can decrease the discharge capacity of the culvert. This decrease in the 19
29 capacity of the culvert ultimately can lead to flooding under some specific hydrology events. Vassilios (1995) indicates a significant rainfall occurred in the winter and spring of 1992, and resulted sediment deposition in the reinforced concrete box culvert constructed in 1991 under 10 th Street West in California. The city maintenance placed sandbags around the area of inlet of the culvert as a temporary freeboard which were used to provide additional head water and prevent the coming storm. They expected the coming storm can flush out sediment in the barrel, but this did not occur. The coming large rainfall occurred in May As the flow and sediment moving through, the culvert was entirely silted and blocked, causing local flooding and creating maintenance difficulties for the city. Sediment deposition in culverts could occur as sediment laden storm water passes through a culvert; the sediment falls out of suspension and collects. Richards and Zeller (1996) presented two analytical methods to estimate sediment conveyance and deposition potential in the culvert. It compared the sediment discharge rates for the upstream channel and through the culvert. If the sediment discharge rate through the culvert is less than the upstream sediment discharge rate for the channel, sedimentation of the culvert can be expected to occur. The first method involves calculating the actual bed-material sediment discharge rate for the channel and culvert with existing equations for sediment transport. The other method calculates the ratio of bed-material sediment transport rates of the approach channel and the designed culvert. 2.5 Culvert Design Considerations Well established methods exist for sizing culverts. In general, culvert design procedure includes the follow steps (Iowa Stormwater Management Manual, 2007): 1. Determine design data; 2. Trial culvert size; 3. Calculate assuming inlet control; 4. Calculate assuming outlet control; 5. Compare HW values for step 3 and 4 (the higher HW governs); 6. Try an alternate culvert size and repeat step 3; and 7. Compute outlet velocity. 20
30 The design considers culvert hydraulic performance during prescribes flood events. However, there are certain situations that require more advanced analysis; hence recursion is made to computer programs to complete the culvert design (ex, Iowa Culvert Hydraulics V2.0). The procedure is a combination of hand calculations, charts and nomographs used to evaluate a culvert. The software programs can be relatively easy to use but the methods used are not always fully understood by the user. The general concept is used primarily on either inlet or outlet flow conditions for the hydraulic analysis. There are several basic steps that must be completed. Culvert design is an iterative design procedure; therefore, the steps are often repeated several times for a given design discharge. The effect of sediment transport, mentioned in previous section, became an important subject which is needed to consider for the culvert design. In 1992, the Maryland State Highway Administration (SHA) initiated new design considerations to limit the impact of constructing culverts and bridges in stream. They started to update the SHA design manual to address consideration of stream morphology. The design manual is still under elaboration. The driving design concept is to construct a stream configuration at the location of the culvert that is stable and that neither scours nor aggrades. Elements of this approach include maintaining the consistency of dimension, pattern, and profile of the stream with particular attention given to maintaining bankfull width and width/depth ratio. Flood plain culverts are provided where appropriate to relieve the hydraulic load on the main channel culvert to limit downstream scour and erosion. Andrzej el. (2001) presented that SHA proposed a replacement of culvert over Beaverdam Run because of sediment buildup at the upstream reach and scour at the downstream reach in The sedimentation caused fish blockage under normal flow condition. Figure 2-5-1a shows its deteriorated condition. SHA engineers replaced a pipe arch in the channel with its invert buried 0.6 m below the streambed to provide for fish passage. This culvert will accommodate flows up to the bankfull flow. The inverts of the flanking pipe arch and 3-m round structural plate pipes were placed at the bankfull elevation, approximately 0.6 m above the streambed to convey the out-of-bank flows. The construction of replaced culvert was finished in 1994 (figure 2-5-1b). During 6 years of post-construction monitoring, the new design has no scour hole downstream and 21
31 forms a well-defined thalweg with in the center of the stream. Fish have been observed passing through the structure. a) b) Figure 2-5-1: Culvert retrofitting using uneven inverts: a) pre-construction condition in 1992, b) post-construction in Numerical Modeling of Culvert Hydraulics Numerical simulation of culvert performance under different flow condition has been widely studied with one- and two-dimensional models. Langlinais (1992) discussed a computer aided design tool called DRAINCALC, which performs drainage runoff calculations and open channel, culvert, or storm drainage design calculations, eliminating the need for cumbersome charts, tables, data sets, and nomographs. With this tool, culverts may be designed as flowing under full flow conditions or partial flow conditions. The software has been successfully field-tested. Ferguson and Deak (1994) found that the area upstream of a culvert acts as a reservoir, which retains incoming runoff while earlier runoff is passing 22
32 through the culvert opening. They use a computer model of a culvert entrance based on the orifice equation (Cd = 0.8) to route storm hydrographs with different flow volumes and peak rates through culverts in studying the increase in upstream stage with increase in flow volume. Charbeneau (2002) showed that FESWMS can accurately simulate surface water flows of culverts with expansion upstream. The recirculation was found in expansion region. Based on the six-box culvert, the model showed that with increasing expansion ratio (expansion length: width of one side) the size of the recirculation decreases. Jones (2005) wrote the software, Iowa DOT culvert program, which incorporate three methods for computing design discharges and then sizing culvert geometry for inlet and outlet control. With this application, performance of culvert under design discharges can be calculated to help decide the geometry of the culvert. HEC-RAS, widely used one dimensional open channel flow model, has the capability of analyzing culvert performance within the framework of one-dimensional flow calculations using the energy and momentum equations. Within HEC-RAS, the culvert equations developed for FHWA are utilized. Along with specifying the shape, size, material type, and location of the culvert system within the cross section, the user must specify the appropriate chart number and scale number so that appropriate coefficients are selected for computation. Vassilios (1995) used HEC-6 to simulate sediment transport through the culvert. The culvert was simulated as open channel, since HEC-6 does not have the capability to compute the pressure flow. Two hydrological flow conditions were simulated. Both results showed that the culvert trap a major portion of the supplied sediment in the culvert. 23

33

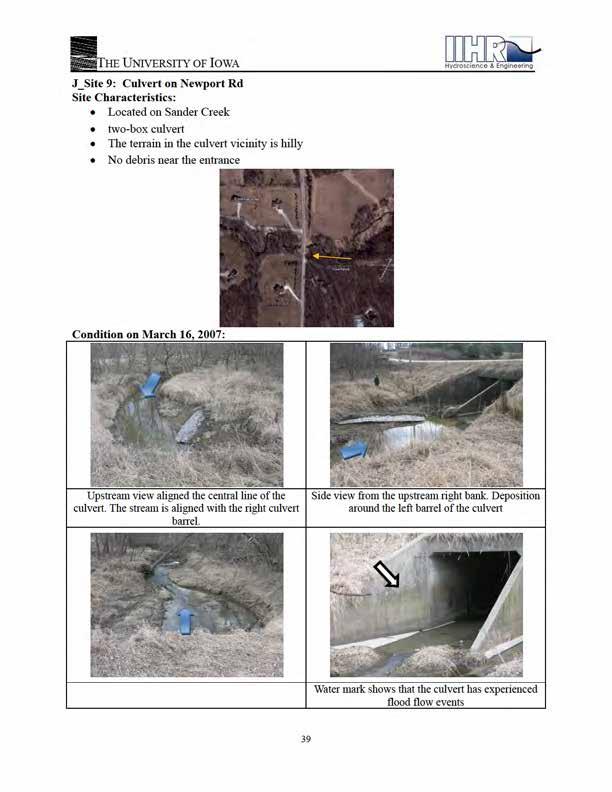
34 culverts. Sediment accumulation at culverts was found to be a significant problem at all sites. The problem being severely reduced flow capacity of sedimented culverts. Evidently the culverts require frequent maintenance to remove sediment deposits and the vegetation that then grows on them. From photographs taken in 2007, three-box culverts are noticeably prone to accumulate sediment. A useful finding is that twin-box culverts seem to have less problem sedimentation. Table Culvert types and numbers in Johnson County (Johnson county Secondary Road Department) RCB culvert type Number Twin 49 Three 5 Figure Three-box culverts in Johnson County: the yellow markers are field visit locations and red marker is USGS stream station in this county 25

35

36
37
38
39

40
41

42
43

44
45
46
47
48
49

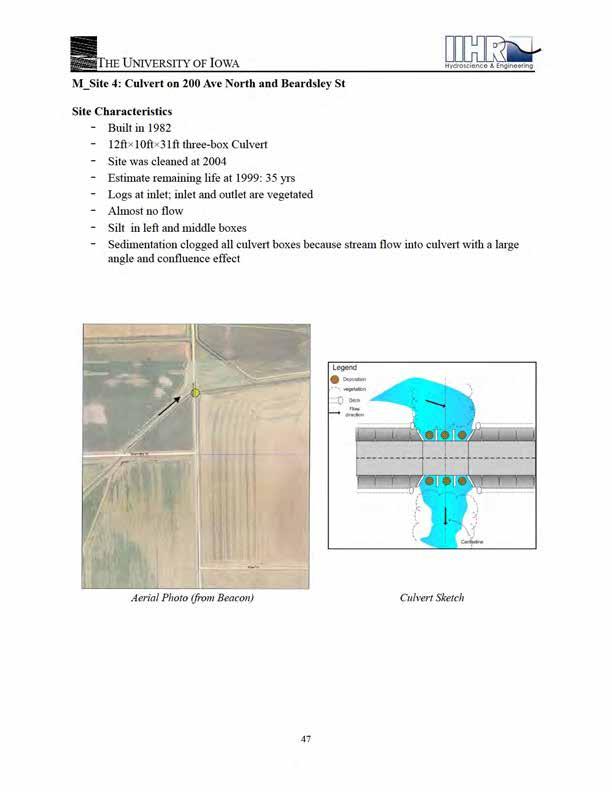
50 3.2 Marion County The field visit in Marion County was conducted during August Six culvert sites were visited (Figure 3-2-1). Five were multi-barrel culverts, and one was a single-barrel culvert. The vicinity of inlet and outlet was heavily vegetated. Substantial sediment and debris deposits had formed at all the sites, and had adversely affected the hydraulic performance of the culvert at the sites. Though a detailed hydrologic investigation was not conducted, it was evident that the sedimentation processes in this county were evolving fast. For example at site #4, the culvert was last cleaned in 2004, but at the time of the visit all of the culvert s barrels were clogged. From the USGS data it was observed that the area experienced a small flood in May 2005, which might explain the debris upstream the culvert. The stream flow was very shallow at this hydrological condition. The invert at the culvert entrance was higher than the water depth, and thereby blocked low-flow drainage. Figure Marion County: the yellow markers are field visit locations and red marker is USGS stream station in this county 41
51
52

53 M_Site 2: Culvert on Hwy. G-76 West and Hwy. S-45 Site Characteristics - Built in ft 10ft 90ft two-box culvert - Drift was removed at Estimate remaining life at 2004: 15 yrs - Inlet was blocked by drift; scour at outlet - Almost no flow; dry channel 44

54
55
56
57

58
59

60 3.3 Buena Vista County On June 22th 2006, six culverts were visited in Buena Vista County. Four sites had box culverts. The other culverts had circular barrels.. Figure shows four locations with box culverts. Three sites displayed sediment built up, but none of the culverts was obstructed by debris. For some sites, maintenance efforts had removed the sediment. It was reported, however, that two culvert sites indeed have serious and continuous sedimentation problems. Figure Buena Vista County Map: the yellow markers are field visit locations and red marker is USGS stream station in this county 51
61

62
63
64
65
66
67
68 4. Laboratory and numerical modeling 4.1 Introduction This chapter describes the laboratory and numerical modeling conducted to investigate flow and sediment transport performance of multi-barrel culverts with an approach-channel expansion. The modeling also sought to evaluate way to control sedimentation at culvert sites. The multi-barrel culvert model design is considered because such culverts typically are prone to sedimentation problems, as illustrated in the preceding chapter. The model culverts were connected to a channel expansion upstream and channel contraction downstream. An important aspect of experiments was the simulation of sediment movement to and through the model culverts. The sediment movement was as bedload transport, defined as sediment moving on, or near, the bed by rolling, saltation, or sliding. Suspended load is defined as sediment moves in suspension. Generally, sediment would mostly move by bed load transport when velocity is relatively low, but by suspended load transport when velocity is relatively high. The tests examined sediment movement under normal flow discharges; therefore, only bed load transport was considered in the laboratory study. The main practical objective of the laboratory and numerical modeling was to develop selfcleaning designs for multi-box culverts. This objective entailed first understanding the hydraulics and the propensity of sediment. The investigations comprised baseline, screening, and performance test phases. For the baseline tests, two physical models were used (scale ratio 1/20, labeled as model 1/20A and 1/20B, as described below) with fixed boundary. The numerical model simulated model 1/20B. Screening tests were only conducted for model 1/20A. The size of the flume s cross section made tests convenient for quickly checking the possible effectiveness of the self-cleansing concepts, and eliminating concepts found not to hold good promise for being effective. The performance tests, discussed in the next chapter, involved a large physical model (scale ratio 1/5) with loose boundary and fitted with a candidate self-cleaning system. The numerical model simulated the physical model with fixed boundary and the self-cleaning system. 59
69 4.2 Baseline tests The baseline tests simulate different hydrological conditions in un-submerged culvert situation for two physical models and the numerical model. The physical models (model 1/20A and 1/20B) were built in IIHR s Model Annex, at the University of Iowa. Model 1/20A was a 1/20 scale, three-box culvert model without a wingwall connection to the expansion and the rectangular stream channel. Model 1/20B was also a 1/20 scale culvert model, but with wingwall connection and a compound stream channel (see Figure and 4.2.2). Model 1/20A had a simplified geometry retaining the essential features of the streamculvert system. Following recommendations from the meeting with the Technical Advisory Committee, it was decided to more accurately replicate the details of the channel and culvert geometry. Model 1/20B was built based on the design blueprints provided by David Claman at Iowa Department of Transportation. The geometry of this configuration is provided in Figure A numerical model was developed only for this model as it accurately replicated the geometry of the stream in field conditions. All models were analyzed under flow conditions that do not submerge the culvert model Model 1/20 Configuration and Operation Figure and figure detail the layout of the model. The flume included three sections: channel, culvert model, and tailgate. The channel is a rectangular channel and 120- in long. Figure details the headbox and the three-box culvert of the physical model 1/20A. The water used for models 1/20A and 1/20B was pumped from the reservoir underground the laboratory through a 3hp pump. A valve located before the diffuser was used to control the magnitude of discharge. The diffuser and flow straighteners were installed in the headbox to stabilize the flow before entering the flume channel. There were eight holes uniformly located on the diffuser to flow out the water. The magnitude of discharge through each hole was supposed to be similar in order to stabilize the flow. However, the magnitude of discharge through each hole was different which made the flow unstable entering the channel. The magnitude of discharge in the middle holes was much strong than in the side 60


70 holes. Four holes in the middle were blocked to have the magnitude of water through each hoe was equal. The water depth in this model was maintained with a tailgate set. Figure Overview of the flume Figure Layout of the culvert model Sediment was added into the channel by the feeding machine (figure 4-2-3). A number of holes were uniformly drilled on the cylinder to allow sand pass through. A motor which can be adjusted speed was used to control the amount of sediment added into the channel. Sediment mobility through the test culvert forms was tested in this model. The flow 61

71 conditions needed to ensure sediment movement were set iteratively. Provision was made to trap all the released sediment in order to accurately quantify the sediment transport during the tests. The measurements needed for all laboratory experiments were water depth, discharge, velocity distribution, and the amount of sedimentation. Water depth was measured typically by point gauge in front of the culvert barrels. This device is a pointer that can measure the elevation of water surface. Discharge was measure by the difference of hydraulic head and calculate based on hydraulic principles, discharge varies as the square root of the head differential: Q Cd h where C d is the calibration coefficient Velocity measurement was done by image-based technique. Large-Scale Particle Image Velocimetry (LSPIV) was used to measure the velocity distribution around the culvert. The velocities near the culvert were measured simultaneously and showed in the two-dimension. For 1/20A and 1/20B, the amount of sediment deposited in the interested regions was collected by scoop and measured the weight with the typical soil process. The sand was dried for 24 hours in the oven and weighted with the electronic scale. For 1/5B, the evaluation of sedimentation in the expansion was measured with the image-based technique. The in-house software, Digital Mapping, can delineate the edge of the sediment deposit geometry and plot into the physical coordinate. Figure Sediment feeder 62

72 4.2.2 Baseline test 1 To examine sediment mobility through the model culvert, four flow conditions were tested (Figure 4-2-4). Flow velocities in the approach channel were varied from 1.32 ft/s to 0.92 ft/s, with a constant sediment load added in the channel by the cylinder. T he sediment served essentially as a tracer to delineate the potential region of sediment accumulation. The investigated areas were focused in the expansion and culvert barrels. If sediment accumulated in the channel, the velocity was not sufficient to transport sediment and not be considered for the following experiments. Observations from the four cases are presented in the Figure Figure Trial flow conditions of the experiment Cases A and B had flow velocities 1.36 ft/s and 1.28 ft/s in the approach channel. Sediment did not accumulate, but constantly moved in the channel for both flow conditions, even though dunes developed in it. Local sediment accumulation was observed in the expansion at the channel inlet. Figures (a) and (b) show the results of tests A and, respectively, B that ran for one hour. Sediment prone to deposit and accumulate in the right and left region was observed. The flow for Case C had a velocity of 1.15 ft/s in the approach channel. Sediment mobility in the channel was lower than for cases A and B. Sediment accumulated in the channel; less sediment load was transported into the culvert model section compared to the above cases. 63

73

74 load in the expansion, and three barrels were separately collected (figure 4-2-6). Figure Sediment load distribution The elevations of dunes formed by sediment accumulated were also quantitatively recorded. Figure shows sediment load in different zones and after different running times, and Figure shows the change in the elevation of dunes with time at the highest deposition point. Figure shows that sediment deposition in the central barrel was constant, but sediment gradually accumulated in the right and left barrels. The accumulation in the expansion increased from the first hour to the fourth hour, and then became constant. The analogous result was confirmed by determining the variation of dune height in right and left parts in the expansion in figure The above investigation indicates the following observations: 1. Flow has the capacity to transport sediment in the center; 2. Sedimentation in the side barrels would increase and then deteriorate the performance of the culvert; and, 3. Sediment accumulation in expansion would reach an equilibrium condition. 65


75 1hr 4hr 2hr 5hr 3hr 6hr Figure Sediment accumulation over 6 hours of observation 66
76 Figure Rate of sediment accumulation in the expansion and three barrels Figure Dune height variation with time from one-hour to six-hours 67
77 4.2.4 Baseline test 3 The aforementioned tests were aimed at investigating the propensity of sediment mobility through the culvert. Baseline test 3 was conducted to better understand sediment deposition in the expansion and culvert barrels. A slight unevenness in the sediment deposits accumulated in the expansion area was observed in baseline tests 1 and 2, revealing that the velocity distribution in the model was not quite uniform. Therefore, the Large-Scale Particle Image Velocimetry (LSPIV) technique was applied to obtain surface velocity distribution, and adjust the flow distribution. The measurements with LSPIV confirmed that the velocity distribution was slightly asymmetric though without significant implication for the modeling conclusions. During tests 3, a new culvert-channel configuration was designed and implemented to include the culvert wingwalls that are associated with the standard box-culvert designed by Iowa Department of Transport (IDOT). The model channel geometry consists of two trapezoidals with a 1:1 slope for the walls of the main channel and a 4:3 slope for flood channel. Wingwalls were connected to the edge of culvert barrels. Figure shows the layout of model 1/20B. The test operated under three hydrological conditions tested before in Baseline tests 1 and 2. All the modeled flows were with the culvert in an unsubmerged control situation whereby the water depth does not higher than the depth of the culvert (figure ). The depth of the culvert was 0.5ft in the model corresponding to 10ft of the prototype. Three water depths were investigated. The design discharges based on the water depth were calculated from equation (13) in the chapter 2. Three cases were used to present three hydrological events from small to large. Case A was ¼ depth of the culvert (HW/D=0.25), case B was half depth of it (HW/D=0.5), and case C was ¾ depth of it (HW/D=0.75). 68


78 Figure Layout of the culvert model B Figure Flow condition in baseline test 3 69
79 Sediment transport is directly dependent on water depth and velocity. As discussed above, an uneven sediment accumulation was observed that suggest to the need to check and adjust the water velocity distribution. LSPIV again was used to measure velocity distribution for all tests in this research. A digital camcorder (Sony HDR-HC1) was used to record successive images (30 fps) and in-house developed software was used to analyze velocity field. The results are presented into three forms to delineate the secondary current on the water surface: average velocity vector distribution, average velocity contour, and streamlines. Figure shows the result of case B, and Figure is for case C. The flow distributions on the water surface for both cases were similar. The velocity distribution in the expansion was not uniform. Flow entering the expansion acted like a jet. Secondary circulation was observed in the sides of the expansion which denotes that sediment particles would deposit in these zones. Moreover, the result shows that velocity was much greater in the central barrel than in the side barrels. This observation meant that the discharge through the central barrel is much greater than through the other barrels. From conventional culvert design, the discharge distribution should be uniform. However, it is clear that discharge per barrel is not the same. The performance of multi-barrel culvert based on the assumption of uniform discharge distribution has to be corrected. A subsequent test examined bed-sediment movement through the culvert over an extended time interval of 6 hours. This test was only operated for case B. Sediment moved smoothly and did not accumulate in the channel. Photography of sedimentation pattern was taken every hour. The results are shown in Figure and The sediment load in the expansion, and three barrels were separately collected as described in the baseline test 2. Figure shows that sediment deposition in the central barrel was constant. Sediment, however, gradually accumulated in the expansion and the side barrels with time. 70


80 a) b) c) Figure Surface flow field for case B (HW/D=0.5): (a) Velocity vectors, (b)velocity vectors and velocity magnitude contour, (c) Streamlines 71

81


82 1hr 4hr 2hr 5hr 3hr 6hr Figure Hourly sediment accumulation in the expansion area for flow case B 73
83 4.3 Screening tests for the self-cleaning designs The object of these tests was to develop and performance evaluate several self-cleaning systems for the culvert models, and then to decide upon the best effective self-cleaning culvert design. The baseline tests indicated that sediment deposited unevenly in the streamwise direction and in the cross sections because of the uneven velocity distribution. The channel expansion led to the culvert inducing a significant secondary current, which is the flow feature exacerbating sediment deposition. A number of self-cleaning systems were investigated as to their capacity to inhibit sediment deposition. The strategy in designing the self-cleaning system was to implement a geometry that redistributed the velocity in the expansion such that forces the water and sediment into the central box. Practically, the design tried to mimic the shape of the pre-construction bed of the stream, which was limited to one (typically trapezoidal) channel. As a consequence, the self-cleaning designs increased the carrying capacity of the flow in the expansion area facilitating the transport of the incoming sediment downstream the culvert. Two conceptual design concepts were tested: 1. Fillets set in the expansion and/or the culvert barrels; and, 2. Guiding vanes set in the expansion. The configuration and actions of the two design approaches were designed such that the approaches can be retrofitted the culverts, rather than being design concepts that can be only implemented at the time the culvert is constructed. The screening tests were conducted at a discharge of ft 3 /s and 0.250ft flow depth, corresponding to Case B on the culvert performance curve (see Figures and ) Fillets (F) This method required placing a fillet in the expansion or culvert barrels so as to increase flow velocity. The construction of the fillet elevated the bed. The conveyance power of flow then was increased by tapering slope bed and reducing of the cross-section of flow. Four designs were used to test the performance for mitigating the sedimentation problem. The first design fitted the tapered fillet in the expansion. The subsequent designs placed the fillets so as to reduce the cross sections of culvert barrels. All screening tests were under the same flow condition that had caused major sediment deposition in the expansion in the baseline tests. 74

84

85

86

87

88 The resulting sediment deposition compared to the traditional culvert model is represented in Figure Sediment accumulation in side barrels did not occur, because of the effect of the elevated fillets. This design encouraged sediment to flow in the central; sedimentation in the central could be flushed out if encounter larger discharge. a) b) Figure Sedimentation pattern compare to the baseline test result The series of tests conducted with progressive alternation of the original fillet-based designs led to the conclusion that the optimal geometry for the self-cleaning design was FA. For this configuration: 1) the sediment transport was driven downstream the culvert 2) the sediment deposited in the expansion area was minimum 3) the deposited sand in the three boxes was equally distributed and at a low overall total volume. The selected fillet-based geometry requires less field-implementation effort because the existing deposited sand in the culvert area can be used to build the fillet base. The fillets surface can be rip-rap - ed and possibly grouted. An FA-based self-cleaning design will be further tested in the numerical model and the performance experiments. 79

89
90
.")
91 a) b) Figure Sedimentation pattern compare to the baseline test result 4.4 Numerical simulation of flow through culverts Simulation cases Numerical simulations were aimed to help the understanding the complex flow processes related to sedimentation at culverts. The commercial software FLUENT was used to analyze the culvert model. The calculation domains for numerical simulation were developed for two different culvert designs (Figure 4-4-1). One domain was developed for model 1/20B, as described in the section Baseline Test 3. Modeling was used to analyze the flow dynamics of the reference culvert (the one without self-cleaning system). The other model configuration investigated the effect of the self-cleaning system placed in the expansion. Two tapered fillets were added in the side parts of the expansion to increase the power of flow which could flush sediment out, using the FA-based design fillet tested in the screening tests. Validation and verification of the numerical modeling was made by comparing the simulations output with the free-surface velocity distributions obtained in the laboratory experiments with LSPIV measurements. The numerical simulations and laboratory experiments were conducted for the cases summarized in Table
92
93 These numbers may vary depending of the simulation cases, e.g., smaller N V for a shallower case. Database and projection functions in Gridgen were used to mesh on complex surface; e.g., channel banks in the expansion region before the culverts Flow modeling The FLUENT numerical model required as input data on flow rates entering the system, the outflow setting at the downstream end, channel bad, bank, and piers as the wall, and water surface defined as symmetry. A turbulence model component was used to calibrate FLUENT to the three-dimension flow at the culvert. The important turbulence parameters κ and ω were evaluated to test this turbulence model component. Once the numerical model was able to reproduce the flow field data obtained from LSPIV, the FLUENT model was applied it to self-cleaning system for culverts to get reasonable results that would take much longer to obtain in the laboratory Post processing The commercial software Tecplot was used for the post processing flow field data obtained from FLUENT. The Particle Tracking function in FLUENT was used to predict the paths of sediments around culverts with the following parameters. Gravitational acceleration = Particle number = 20 Particle location = close to the bottom and half way of the incoming channel Particle velocity = local velocity (obtain from the solution) Particle size = (= 0.5 mm = sediment size used in the experiment) Particle density = 2.65 Maximum number of steps = Step length factor = 5 Wall boundary condition = reflect Even if this visualization tool is not an actual modeling of the sedimentation process, the sediment traces indicate the areas where the sediment can build up and deposit. The validity of the modeling approach was proven by the good agreement with the experiments. 84


94 4.4.5 Numerical model testing Use of the numerical model extended the findings from the laboratory tests. To compare the results of numerical simulations with those of experiments; flow characteristics, 2D streamlines, streamwise velocity contours, and out of plane vorticity contours on the horizontal plane close to the free surface were obtained for each case. These flow data reveal significant aspects about how the flow conveys sediment and deposits it at the culvert inlet, and within the culvert. Two laboratory experiment data, collected from Baseline Test 3, were used for numerical model validation. The numerical results are compared to measurements conducted with LSPIV in laboratory tests for homologous geometry. Comparison of average velocity in the expansion between the laboratory and the numerical model shows minor differences near the culvert piers and expansion entrance. Figures and show the near-surface flow field, shear velocity contours, and sediment paths obtained from the numerical model for the flow Case B (HW/D=0.5). Figure shows the near-surface flow field obtained with LSPIV and sedimentation documented in the laboratory experiment. (a) (b) (c) Figure Near-surface flow field in flow Case B obtained with numerical simulations: (a) streamlines, (b) streamwise velocity, (c) out of plane vorticity 85

95

.")

")
 b) c) Figure 4-4-6 Surface")
 Streamline and")
96 Figure shows the near-surface flow field, shear velocity contours, and sediment paths for the numerical model applied to Flow case C (HW/D= 0.75). Figure shows the comparable values from the laboratory experiment obtained with LSPIV. Figure Near surface flow field for flow case C obtained with numerical simulations: (a) streamlines (b) streamwise velocity (c) out of plane vorticity a) b) c) Figure Surface flow field for flow case C obtained in laboratory test with LSPIV: (a) Streamline and velocity magnitude contour, (b) streamwise velocity, (c) vorticity 87

97

98


 streamwise velocity, (c)")
 Figure 4-4-10 Simulated")

 shear")
99 (a) (b) (c) Figure Simulated near-surface flow field for flow case B over the fillets FA set in the expansion: (a) streamlines, (b) streamwise velocity, (c) out of plane vorticity (a) (b) Figure Simulated sediment transport characteristics for flow case B over fillets FA set in the expansion: (a) shear velocity, (b) sediment paths 90

100 5. Performance Tests 5.1 Introduction The performance tests were conducted using a model channel fitted in a large, sedimentrecirculating flume, 65.7ft long, 9.3ft wide, and 2ft deep. The flume, shown in Figure 5-1-1, was designed and built specifically for the project, and trapezoidal a compound channel; i.e., main channel with side slope 1:1, and flood plain with 4:3. The model is divided into three main sections. The upstream channel leading from the headbox is a compound channel with erodible bed. The culvert section contains an expansion, a contraction, and a three-barrel culvert. The expansion bed and contraction bed were erodible. The culvert was fitted with a fixed wood bed. The last section is a short erodible channel connecting to tailgate and two circulate pumps. As the slope of the flume itself was fixed at zero, the hydraulic gradient of the flow was controlled by the difference in water surface elevations between the head box and the tail box; given the flume s relatively short length compared to flume width and depth, the difference in elevation did not adversely affect the flow field locally around the culvert. Figure Schematic View of the physical model The variable patterns of sediment accumulation at culvert sites were simulated by means of tests with the model channel configured in the following arrangements: 1. No Self-Cleaning System fitted. Three different flow conditions (Q, HW) were scaled replicating the flow modeled in the Baseline Tests 3, specifically flow cases 91

101 A, B, and C are tested: A(2.08, 0.5), B(5.22,1.0), C(11.62, 1.53) 2. Self-Cleaning Systems fitted in the model. Three flow condition case A, B, and C are tested the function of the self-cleaning system. Figure Upstream view of the model 5.2 Laboratory experiment for the reference culvert model Three flow conditions were tested using a reference three-box culvert model to investigate sediment accumulation in the expansion. The geometry of the culvert-channel system was the same as for tests series 1/20B, but the scale which for these tests was considerably increased to 1/5. The flow condition tested were the same as those described in Section (see Figure 4-2-4). A qualitative method for evaluating sediment transport and deposition in the expansion area was conceived. The method is simple and quick, and is based on the imaging of a pole set horizontally in the model at a critical cross section as shown in Figure After each test, the pole was set in position so as to keep all the imaging conditions the same. The overall intensity of light in recorded images was kept the same by using the same bulbs for the illumination of the model area. The images were taken at the end of each test from the same distance at an oblique angle, from the same position. Images taken from an oblique angle are generally distorted due to the inherent geometrical distortion. However, for the qualitative 92
 is the initial condition.")


102 evaluation, it was possible to compare sediment transport modeled cases without removing the image distortion. Using the shadow of a pole projected on the model bed, the difference between different tests is observed. Figure 5-2-1(a) is the initial condition. Figures (b), (c), and (d) are sediment deposition situation after the experiments operated 12 hours for case a, b, and c. The 12 hours test time for each experiment was established by monitoring the development of the sediment transport processes in the model over time. For this purpose a series of preliminary tests were ran with increasing duration and in observations of the sediment deposition in the culvert area were observed until an equilibrium situation was reached. The equilibrium denoted the stage when the deposition-scour process was relatively unchanged. a) b) c) d) Figure Sediment deposition patterns: a) Initial condition, b) Case A, c) Case B, d) Case C 93

103
.")
104 5.3 LSPIV experiments in the 1:5 culvert model LSPIV was used to measure velocity distribution for the reference culvert model and for the FA self-cleaning culvert design. The discharge in the 1:5 scale model was ft 3 /s and the water depth was 1.0ft, corresponding to flow case B (see Figure ). Figure 5-3-1a and 5-3-1b show the streamline for the reference culvert model and FA design culvert model, respectively. It can be noted that addition of the lateral fillets in the expansion area considerably weakened the secondary currents formed in the expansion corners. Moreover, the isovelocity contours plotted in Figure illustrate that the velocity magnitude was considerably increased throughout the center area of the expansion leading to an increased flow power that enhances the transport of sediment incoming toward the culvert. The LSPIV measurements undoubtedly demonstrate that water and sediment are forced to the central culvert box when the self-cleaning fillets are set in the expansion. The conclusions provided by the LSPIV measurements are congruent with the long-term tests conducted to monitor the sedimentation process. Figure 5-4-2(b), provided in the next section, illustrates that the sediment did not accumulate in the expansion in the tests with the fillets set in the lateral expansion areas. Both series of tests complementary validate the efficiency of the self-cleaning design conceived through the present study. The design is simple to implement in any stage of the culvert lifetime and it can be mostly constructed with local material, i.e., sediment deposited at the culvert prior to the culvert conditioning. Figure Streamlines in the 1:5 model: a) reference condition, b) FA design model 95

105 Figure Velocity contours in the 1:5 model: a) reference condition, b) FA design model 5.4 Performance tests for the selected self-cleaning design The basic concept of a self-cleaning system for sediment control is to increase the flow velocities and concentrate the flow to the main channel. The fillets upstream of the culvert were designed based on the numerical simulation described in Section (see also Figure 4-4-1). The configuration of the filled-based cleaning design is shown in Figure The results of the runs with simulated flows for the cases A, B, and C (see Figure 4-2-4) are shown in Figure The efficiency of the self-cleaning designs was established using the empirical approach described in Section 5.2. Photographs of sediment deposition were taken from the same distance at an oblique angle using a reference in the images (the horizontal pole). The images allow to observe that the sedimentation that occurs in the critical area of the upstream culvert expansion where deposition occurs at the highest rates and with the most detrimental impacts. Visual inspection of the sequence of images in Figure shows that the selfcleaning fillets set in the expansion have the following effects: 1) direct the sediment through the central barrel of the multi-box culvert 2) maintain their effectiveness over a range of flows 3) do not obstruct the sediment transport within the culvert boxes even for the highest flow tested in the experiments, when small sediment deposits were observed 4) the sediment deposition within the conditioned culvert boxes does not significantly change in comparison with the reference conditions indicating that most of the sediment 96
 b) Figure")
 b) c)")

 Initial")
 flow Case B, d)")
106 is passed through the culvert a) b) Figure Self-cleaning fillet geometry a) b) c) d) Figure Sediment deposition patterns for the culvert fitted with fillets FA: a) Initial condition, b) flow Case A, c) flow Case B, d) flow Case C 97
PRELIMINARY CULVERT ANALYSIS REPORT FOR CULVERT NO. 008-C OREGON AVENUE OVER PINEHURST CREEK
 PRELIMINARY CULVERT ANALYSIS REPORT FOR CULVERT NO. 008-C OREGON AVENUE OVER PINEHURST CREEK Prepared for The District of Columbia Department of Transportation Washington, D.C. Prepared by Parsons Transportation
Basic Hydraulics June 2007
 Basic Hydraulics www.concrete-pipe.org June 2007 2007 Overview Open Channel Flow Manning Equation Basic Culvert Design Sanitary Sewer Design Flow, Velocity Stormwater Sewer Design Flow, Velocity 2 Open
Lateral Inflow into High-Velocity Channels
 Lateral Inflow into High-Velocity Channels by Richard L. Stockstill PURPOSE: This Coastal and Hydraulics Engineering Technical Note (CHETN) investigates lateral flow discharging into a high-velocity channel.
CONCEPTS Conservational Channel Evolution and Pollutant Transport System
 CONCEPTS Conservational Channel Evolution and Pollutant Transport System Eddy J. Langendoen Watershed Physical Processes Research Unit National Sedimentation Laboratory USDA Agricultural Research Service
Investigation of unsteady and non-uniform flow and sediment transport characteristics at culvert sites
 University of Iowa Iowa Research Online Theses and Dissertations Fall 2010 Investigation of unsteady and non-uniform flow and sediment transport characteristics at culvert sites Hao-Che Ho University of
Lecture Note for Open Channel Hydraulics
 Chapter -one Introduction to Open Channel Hydraulics 1.1 Definitions Simply stated, Open channel flow is a flow of liquid in a conduit with free space. Open channel flow is particularly applied to understand
Fish Passage at Road Crossings
 Fish Passage at Road Crossings 1 Crossing Design Workshop Outline 1:00 to 2:00 Intro, Design Overview, Channel Width 2:00 to 2:15 Break 2:15 to 3:15 No-Slope, Stream Simulation Design 3:15 to 3:30 Break
Degradation Concerns related to Bridge Structures in Alberta
 Degradation Concerns related to Bridge Structures in Alberta Introduction There has been recent discussion regarding the identification and assessment of stream degradation in terms of how it relates to
Stage Discharge Tabulation for Only Orifice Flow
 Stage Discharge Tabulation for Only Orifice Flow DEPTH STAGE DISCHARGE (meters) (feet) (meters) (feet) (m 3 /s) (ft 3 /s) 0 0.20 0.40 0.60 0.80 1.00 1.20 1.40 1.60 1.80 2.00 0.7 1.3 2.0 2.6 3.3 3.9 4.6
Pressure Head: Pressure head is the height of a column of water that would exert a unit pressure equal to the pressure of the water.
 Design Manual Chapter - Stormwater D - Storm Sewer Design D- Storm Sewer Sizing A. Introduction The purpose of this section is to outline the basic hydraulic principles in order to determine the storm
PENNSYLVANIA DEPARTMENT OF TRANSPORTATION ENGINEERING DISTRICT 3-0
 PENNSYLVANIA DEPARTMENT OF TRANSPORTATION ENGINEERING DISTRICT 3-0 LYCOMING COUNTY S.R.15, SECTION C41 FINAL HYDROLOGIC AND HYDRAULIC REPORT STEAM VALLEY RUN STREAM RELOCATION DATE: June, 2006 REVISED:
Section 4: Model Development and Application
 Section 4: Model Development and Application The hydrologic model for the Wissahickon Act 167 study was built using GIS layers of land use, hydrologic soil groups, terrain and orthophotography. Within
Storm Water Best Management Practice: Development of Debris Filtering Structure for Supercritical Flow
 Storm Water Best Management Practice: Development of Debris Filtering Structure for Supercritical Flow Jungseok Ho 1, Todd Marti 2, and Julie Coonrod 3 1 Department of Civil Engineering, University of
Open Channel Flow Part 2. Ch 10 Young, notes, handouts
 Open Channel Flow Part 2 Ch 10 Young, notes, handouts Uniform Channel Flow Many situations have a good approximation d(v,y,q)/dx=0 Uniform flow Look at extended Bernoulli equation Friction slope exactly
MODELING OF LOCAL SCOUR AROUND AL-KUFA BRIDGE PIERS Saleh I. Khassaf, Saja Sadeq Shakir
 ISSN 2320-9100 11 International Journal of Advance Research, IJOAR.org Volume 1, Issue 8,August 2013, Online: ISSN 2320-9100 MODELING OF LOCAL SCOUR AROUND AL-KUFA BRIDGE PIERS Saleh I. Khassaf, Saja Sadeq
Summary of Hydraulic and Sediment-transport. Analysis of Residual Sediment: Alternatives for the San Clemente Dam Removal/Retrofit Project,
 Appendix N SUMMARY OF HYDRAULIC AND SEDIMENT-TRANSPORT ANALYSIS OF RESIDUAL SEDIMENT: ALTERNATIVES FOR THE SAN CLEMENTE DAM REMOVAL/RETROFIT PROJECT, CALIFORNIA the San Clemente Dam Removal/Retrofit Project,
Rock Sizing for Batter Chutes
 Rock Sizing for Batter Chutes STORMWATER MANAGEMENT PRACTICES Photo 1 Rock-lined batter chute Photo 2 Rock-lined batter chute 1. Introduction In the stormwater industry a chute is a steep drainage channel,
DEPARTMENT OF CIVIL AND ENVIRONMENTAL ENGINEERING Urban Drainage: Hydraulics. Solutions to problem sheet 2: Flows in open channels
 DEPRTMENT OF CIVIL ND ENVIRONMENTL ENGINEERING Urban Drainage: Hydraulics Solutions to problem sheet 2: Flows in open channels 1. rectangular channel of 1 m width carries water at a rate 0.1 m 3 /s. Plot
Open Channel Flow I - The Manning Equation and Uniform Flow COURSE CONTENT
 Open Channel Flow I - The Manning Equation and Uniform Flow Harlan H. Bengtson, PhD, P.E. COURSE CONTENT 1. Introduction Flow of a liquid may take place either as open channel flow or pressure flow. Pressure
CASE STUDIES. Introduction
 Introduction The City of Winston-Salem faces the challenge of maintaining public infrastructure (e.g., water and sewer lines, storm drains, roads, culverts and bridges) while minimizing the potential impacts
Closed duct flows are full of fluid, have no free surface within, and are driven by a pressure gradient along the duct axis.
 OPEN CHANNEL FLOW Open channel flow is a flow of liquid, basically water in a conduit with a free surface. The open channel flows are driven by gravity alone, and the pressure gradient at the atmospheric
Rock Sizing for Waterway & Gully Chutes
 Rock Sizing for Waterway & Gully Chutes WATERWAY MANAGEMENT PRACTICES Photo 1 Rock-lined waterway chute Photo 2 Rock-lined gully chute 1. Introduction A waterway chute is a stabilised section of channel
Closed duct flows are full of fluid, have no free surface within, and are driven by a pressure gradient along the duct axis.
 OPEN CHANNEL FLOW Open channel flow is a flow of liquid, basically water in a conduit with a free surface. The open channel flows are driven by gravity alone, and the pressure gradient at the atmospheric
Prototype hydroinformatics-based system for supporting decision making in culvert design and monitoring
 University of Iowa Iowa Research Online Theses and Dissertations 2015 Prototype hydroinformatics-based system for supporting decision making in culvert design and monitoring Haowen Xu University of Iowa
Probabilistic Evaluation of a Meandering Low-Flow Channel. February 24 th, UMSRS
 Probabilistic Evaluation of a Meandering Low-Flow Channel February 24 th, 2014 2014 UMSRS 1 2 acknowledgments Low- Flow Channel (LFC) overview Proposed Diversion Channel collects runoff from: The Rush
1.060 Engineering Mechanics II Spring Problem Set 8
 1.060 Engineering Mechanics II Spring 2006 Due on Monday, May 1st Problem Set 8 Important note: Please start a new sheet of paper for each problem in the problem set. Write the names of the group members
Storm Sewer Design [2]
![Storm Sewer Design [2]](/thumbs/82/86956590.jpg "Storm Sewer Design [2]") Class 5 [1] Storm Sewer Design 9. Check Q < Qf and Vmax > vf > Vmin. Vmin is normally specified to avoid sedimentation. This will normally be 1.0 m/s at pipe full condition. (BS EN 752 suggests that for
Class 5 [1] Storm Sewer Design 9. Check Q < Qf and Vmax > vf > Vmin. Vmin is normally specified to avoid sedimentation. This will normally be 1.0 m/s at pipe full condition. (BS EN 752 suggests that for
CCR Rule Annual Inspection Report (cont.) 2
 2") The inspection findings consisted of maintenance items and items that were not observed to be signs or potential signs of significant structural weakness. No deficiencies or disrupting conditions that
The inspection findings consisted of maintenance items and items that were not observed to be signs or potential signs of significant structural weakness. No deficiencies or disrupting conditions that
5. ROADSIDE AND MEDIAN CHANNELS
 5. ROADSIDE AND MEDIAN CHANNELS Roadside and median channels are open-channel systems which collect and convey stormwater from the pavement surface, roadside, and median areas. These channels may outlet
Technical Memorandum No
 Pajaro River Watershed Study in association with Technical Memorandum No. 1.2.10 Task: Evaluation of Four Watershed Conditions - Sediment To: PRWFPA Staff Working Group Prepared by: Gregory Morris and
A STUDY OF LOCAL SCOUR AT BRIDGE PIERS OF EL-MINIA
 A STUDY OF LOCAL SCOUR AT BRIDGE PIERS OF EL-MINIA Dr. Gamal A. Sallam 1 and Dr. Medhat Aziz 2 ABSTRACT Bridges are critical structures that require a substantial investment to construct and serve an important
Standards for Soil Erosion and Sediment Control in New Jersey May 2012
 STANDARD FOR SEDIMENT BASIN Definition A barrier, dam, excavated pit, or dugout constructed across a waterway or at other suitable locations to intercept and retain sediment. Basins created by construction
Fish Passage and Abundance around Grade Control Structures on Incised Streams in Western Iowa
 Fish Passage and Abundance around Grade Control Structures on Incised Streams in Western Iowa John Thomas Hungry Canyons Alliance Mary Culler Iowa State University / Missouri DNR Dimitri Dermisis IIHR
Design Data 17. Partial Flow Conditions of Box Culverts
 Design Data 17 Partial Flow Conditions of Box Culverts Sewers, both sanitary and storm, are designed to carry a peak flow based on anticipated land development. The hydraulic capacity of sewers or culverts
Hydraulic Engineering Circular 14 Energy Dissipators Listing of Updates and Corrections (errata & corrigenda)
") Hydraulic Engineering Circular 4 Energy Dissipators Listing of Updates and Corrections (errata & corrigenda) DATE ACTION BY 3 Aug 0 Page 4-, first paragraph: text should have parentheses around the 3Fr
Hydraulic Engineering Circular 4 Energy Dissipators Listing of Updates and Corrections (errata & corrigenda) DATE ACTION BY 3 Aug 0 Page 4-, first paragraph: text should have parentheses around the 3Fr
Tom Ballestero University of New Hampshire. 1 May 2013
 Tom Ballestero University of New Hampshire 1 May 2013 1 Hydrology 2 Basic Hydrology Low flows most common Flows that fill the stream to the banks and higher are much less common Filling the stream to the
Two-Dimensional Simulation of Truckee River Hydrodynamics
 Two-Dimensional Simulation of Truckee River Hydrodynamics by Stephen H. Scott PURPOSE: The purpose of this Coastal and Hydraulics Engineering Technical Note (CHETN) is to demonstrate the use of multidimensional
B-1. Attachment B-1. Evaluation of AdH Model Simplifications in Conowingo Reservoir Sediment Transport Modeling
 Attachment B-1 Evaluation of AdH Model Simplifications in Conowingo Reservoir Sediment Transport Modeling 1 October 2012 Lower Susquehanna River Watershed Assessment Evaluation of AdH Model Simplifications
SCOPE OF PRESENTATION STREAM DYNAMICS, CHANNEL RESTORATION PLANS, & SEDIMENT TRANSPORT ANALYSES IN RELATION TO RESTORATION PLANS
 DESIGN METHODS B: SEDIMENT TRANSPORT PROCESSES FOR STREAM RESTORATION DESIGN PETER KLINGEMAN OREGON STATE UNIVERSITY CIVIL ENGINEERING DEPT., CORVALLIS 2 ND ANNUAL NORTHWEST STREAM RESTORATION DESIGN SYMPOSIUM
MATHEMATICAL MODELING OF FLUVIAL SEDIMENT DELIVERY, NEKA RIVER, IRAN. S.E. Kermani H. Golmaee M.Z. Ahmadi
 JOURNAL OF ENVIRONMENTAL HYDROLOGY The Electronic Journal of the International Association for Environmental Hydrology On the World Wide Web at http://www.hydroweb.com VOLUME 16 2008 MATHEMATICAL MODELING
Rock Sizing for Small Dam Spillways
 Rock Sizing for Small Dam Spillways STORMWATER MANAGEMENT PRACTICES Photo 1 Rock-lined spillway on a construction site sediment basin Photo 2 Rock-lined spillway on a small farm dam 1. Introduction A chute
Hydraulics Part: Open Channel Flow
 Hydraulics Part: Open Channel Flow Tutorial solutions -by Dr. K.N. Dulal Uniform flow 1. Show that discharge through a channel with steady flow is given by where A 1 and A 2 are the sectional areas of
Lab 7: Nonuniform Flow and Open Channel Transitions
 CE 3620: Water Resources Engineering Spring 2015 Lab 7: Nonuniform Flow and Open Channel Transitions BACKGROUND An open channel transition may be defined as a change either in the direction, slope, or
Chapter 3.8: Energy Dissipators. By Dr. Nuray Denli Tokyay
 Chapter 3.8: Energy Dissipators By Dr. Nuray Denli Tokyay 3.1 Introduction A stilling basin is a short length of paved channel placed at the foot of a spillway or any other source of supercritical flow
Continuing Education Associated with Maintaining CPESC and CESSWI Certification
 Continuing Education Associated with Maintaining CPESC and CESSWI Certification Module 2: Stormwater Management Principles for Earth Disturbing Activities Sponsors: ODOTs Local Technical Assistance Program
Why Geomorphology for Fish Passage
 Channel Morphology - Stream Crossing Interactions An Overview Michael Love Michael Love & Associates mlove@h2odesigns.com (707) 476-8938 Why Geomorphology for Fish Passage 1. Understand the Scale of the
OPEN CHANNEL FLOW. One-dimensional - neglect vertical and lateral variations in velocity. In other words, Q v = (1) A. Figure 1. One-dimensional Flow
 A. Figure 1. One-dimensional Flow") OPEN CHANNEL FLOW Page 1 OPEN CHANNEL FLOW Open Channel Flow (OCF) is flow with one boundary exposed to atmospheric pressure. The flow is not pressurized and occurs because of gravity. Flow Classification
OPEN CHANNEL FLOW Page 1 OPEN CHANNEL FLOW Open Channel Flow (OCF) is flow with one boundary exposed to atmospheric pressure. The flow is not pressurized and occurs because of gravity. Flow Classification
Materials. Use materials meeting the following.
 208.01 Section 208. SOIL EROSION AND SEDIMENTATION CONTROL 208.01 Description. Install and maintain erosion and sedimentation controls to minimize soil erosion and to control sedimentation from affecting
Effect of Roughness on Discharge
 Effect of Roughness on Discharge T.W. Lau, and N.R. Afshar Abstract These Water resource projects and hydraulic engineering works have been developing rapidly throughout the world, thus prediction of water
INFLOW DESIGN FLOOD CONTROL SYSTEM PLAN 40 C.F.R. PART PLANT YATES ASH POND 2 (AP-2) GEORGIA POWER COMPANY
 GEORGIA POWER COMPANY") INFLOW DESIGN FLOOD CONTROL SYSTEM PLAN 40 C.F.R. PART 257.82 PLANT YATES ASH POND 2 (AP-2) GEORGIA POWER COMPANY EPA s Disposal of Coal Combustion Residuals from Electric Utilities Final Rule (40 C.F.R.
INFLOW DESIGN FLOOD CONTROL SYSTEM PLAN 40 C.F.R. PART 257.82 PLANT YATES ASH POND 2 (AP-2) GEORGIA POWER COMPANY EPA s Disposal of Coal Combustion Residuals from Electric Utilities Final Rule (40 C.F.R.
9. Flood Routing. chapter Two
 9. Flood Routing Flow routing is a mathematical procedure for predicting the changing magnitude, speed, and shape of a flood wave as a function of time at one or more points along a watercourse (waterway
UPPER COSUMNES RIVER FLOOD MAPPING
 UPPER COSUMNES RIVER FLOOD MAPPING DRAFT BASIC DATA NARRATIVE FLOOD INSURANCE STUDY SACRAMENTO COUTY, CALIFORNIA Community No. 060262 November 2008 Prepared By: CIVIL ENGINEERING SOLUTIONS, INC. 1325 Howe
Chapter 7 Mudflow Analysis
 Chapter 7 Mudflow Analysis 7.0 Introduction This chapter provides information on the potential and magnitude of mud floods and mudflows that may develop in Aspen due to rainfall events, snowmelt, or rain
Laboratory Investigation of Submerged Vane Shapes Effect on River Banks Protection
 Australian Journal of Basic and Applied Sciences, 5(12): 1402-1407, 2011 ISSN 1991-8178 Laboratory Investigation of Submerged Vane Shapes Effect on River Banks Protection Touraj Samimi Behbahan Department
Appendix E Guidance for Shallow Flooding Analyses and Mapping
 Appendix E Guidance for Shallow Flooding Analyses and Mapping E.1 Introduction Different types of shallow flooding commonly occur throughout the United States. Types of flows that result in shallow flooding
Hydromechanics: Course Summary
 Hydromechanics: Course Summary Hydromechanics VVR090 Material Included; French: Chapters to 9 and 4 + Sample problems Vennard & Street: Chapters 8 + 3, and (part of it) Roberson & Crowe: Chapter Collection
Investigation on Dynamics of Sediment and Water Flow in a Sand Trap
 Investigation on Dynamics of Sediment and Water Flow in a Sand Trap M. R. Mustafa Department of Civil Engineering Universiti Teknologi Petronas 31750 Tronoh, Perak, Malaysia R. B. Rezaur Water Resources
APPENDIX B Hydraulic Considerations for Pipeline Crossings of Stream Channels
 APPENDIX B Hydraulic Considerations for Pipeline Crossings of Stream Channels B-1 B-2 APPENDIX B HYDRAULIC CONSIDERATIONS FOR PIPELINE CROSSINGS OF STREAM CHANNELS Pipeline crossings of perennial, intermittent,
Case Study 2: Twenty-mile Creek Rock Fords
 Case Study : Twenty-mile Creek Rock Fords Location Crossing Description Washington. Okanagan National Forest. Methow Valley Ranger District. Chewuch river basin, East Chewuch Road. The Twenty-mile Creek
Hydraulic Design of Energy Dissipators for Culverts and Channels HEC 14 September 1983 Metric Version
 Hydraulic Design of Energy Dissipators for Culverts and Channels HEC 14 September 1983 Metric Version Welcome to HEC 14 - Hydraulic Design of Energy Dissipators for Culverts and Channels Table of Contents
Open Channel Hydraulics I - Uniform Flow
 PDHonline Course H138 (2 PDH) Open Channel Hydraulics I - Uniform Flow Instructor: Harlan H. Bengtson, Ph.D., PE 2012 PDH Online PDH Center 5272 Meadow Estates Drive Fairfax, VA 22030-6658 Phone & Fax:
Rock & Aggregate Drop Inlet Protection
 Rock & Aggregate Drop Inlet Protection SEDIMENT CONTROL TECHNIQUE Type 1 System Sheet Flow Sandy Soils Type 2 System [1] Concentrated Flow Clayey Soils Type 3 System Supplementary Trap Dispersive Soils
Monitoring Scour Critical Bridges During Floods For Local Bridge Owners. Presented by
 Monitoring Scour Critical Bridges During Floods For Local Bridge Owners Presented by SAFETY FIRST DO NOT ENDANGER YOURSELF OR OTHERS WHILE MONITORING BRIDGES DO NOT ENTER FLOOD WATERS FLOOD WATERS INCLUDE
The Effects of Flooding on Structures. Or What to Expect when the Drought Ends Violently
 The Effects of Flooding on Structures Or What to Expect when the Drought Ends Violently Let s Define Flood Increase in discharge compared to normal level Direct runoff of rainfall (we re talking about
Evaluation of Scour Depth around Bridge Piers with Various Geometrical Shapes
 Evaluation of Scour Depth around Bridge Piers with Various Geometrical Shapes Dr. P. D. Dahe * Department of Civil Engineering, SGGSIE&T, Vishnupuri, Nanded (Maharashtra) S. B. Kharode Department of Civil
GIS Enabled Automated Culvert Design
 GIS Enabled Automated Culvert Design ASHTON GREER PH.D. STUDENT, THE UNIVERSITY OF ALABAMA DR. ANDREW GRAETTINGER, LEAH CLIFTON, ZACHARY WILBANKS, BRADFORD WILSON Outline Culvert Background Project Objectives
Technical Memorandum. To: From: Copies: Date: 10/19/2017. Subject: Project No.: Greg Laird, Courtney Moore. Kevin Pilgrim and Travis Stroth
 Technical Memorandum To: From: Greg Laird, Courtney Moore Kevin Pilgrim and Travis Stroth 5777 Central Avenue Suite 228 Boulder, CO 80301 www.otak.com Copies: [Electronic submittal] Date: 10/19/2017 Subject:
Chapter 7 Mudflow Analysis
 Chapter 7 Mudflow Analysis 7.0 Introduction This chapter provides information on the potential and magnitude of mud floods and mudflows that may develop in Aspen due to rainfall events, snowmelt, or rain
STRUCTURAL STABILITY ASSESSMENT
 STRUCTURAL STABILITY ASSESSMENT CFR 257.73(d) Bottom Ash Pond Complex Cardinal Plant Brilliant, Ohio October, 2016 Prepared for: Cardinal Operating Company Cardinal Plant Brilliant, Ohio Prepared by: Geotechnical
Beaver Creek Corridor Design and Analysis. By: Alex Previte
 Beaver Creek Corridor Design and Analysis By: Alex Previte Overview Introduction Key concepts Model Development Design Accuracy Conclusion Refresh v = Beaver Creek Site = Wittenberg Introduction Low head
PART 2:! FLUVIAL HYDRAULICS" HYDROEUROPE
 PART 2:! FLUVIAL HYDRAULICS" HYDROEUROPE 2009 1 HYDROEUROPE 2009 2 About shear stress!! Extremely complex concept, can not be measured directly!! Computation is based on very primitive hypotheses that
NPTEL Quiz Hydraulics
 Introduction NPTEL Quiz Hydraulics 1. An ideal fluid is a. One which obeys Newton s law of viscosity b. Frictionless and incompressible c. Very viscous d. Frictionless and compressible 2. The unit of kinematic
CE415L Applied Fluid Mechanics Laboratory
 Applied Fluid Mechanics Laboratory Learning Objective Following completion of this experiment and the analysis of the data, you should be able to 1. generalize results of introducing changes to a natural
COMPARISON OF LABORATORY AND FIELD MEASUREMENTS OF BRIDGE PIER SCOUR
 COMPARISON OF LABORATORY AND FIELD MEASUREMENTS OF BRIDGE PIER SCOUR LEE, SEUNGOH, STURM, T. W., School of Civil and Environ. Engrg., Georgia Institute of Technology Atlanta, GA 30332-0512 USA GOTVALD,
U-Shaped Sediment Traps
 U-Shaped Sediment Traps SEDIMENT CONTROL TECHNIQUE Type 1 System Sheet Flow Sandy Soils Type 2 System Concentrated Flow Clayey Soils [1] Type 3 System Supplementary Trap Dispersive Soils [1] Generally
Black Gore Creek 2013 Sediment Source Monitoring and TMDL Sediment Budget
 Black Gore Creek 2013 Sediment Source Monitoring and TMDL Sediment Budget Prepared for: Prepared By: - I. Introduction The Black Gore Creek Total Maximum Daily Load (TMDL) was developed in collaboration
State Water Survey Division SURFACE WATER SECTION
 State Water Survey Division SURFACE WATER SECTION AT THE UNIVERSITY OF ILLINOIS Illinois Department of Energy and Natural Resources SWS Miscellaneous Publication 88 SEDIMENTATION OF POOL 19 ON THE MISSISSIPPI
LOMR SUBMITTAL LOWER NESTUCCA RIVER TILLAMOOK COUNTY, OREGON
 LOMR SUBMITTAL LOWER NESTUCCA RIVER TILLAMOOK COUNTY, OREGON Prepared for: TILLAMOOK COUNTY DEPARTMENT OF COMMUNITY DEVELOPMENT 1510-B THIRD STREET TILLAMOOK, OR 97141 Prepared by: 10300 SW GREENBURG ROAD,
53:071 Principles of Hydraulics Laboratory Experiment #3 ANALYSIS OF OPEN-CHANNEL FLOW TRANSITIONS USING THE SPECIFIC ENERGY DIAGRAM
 53:071 Principles of Hydraulics Laboratory Experiment #3 ANALYSIS OF OPEN-CHANNEL FLOW TRANSITIONS USING THE SPECIFIC ENERGY DIAGRAM Principle Adaptation of the Bernoulli equation to open-channel flows
NATURAL RIVER. Karima Attia Nile Research Institute
 NATURAL RIVER CHARACTERISTICS Karima Attia Nile Research Institute NATURAL RIVER DEFINITION NATURAL RIVER DEFINITION Is natural stream of water that flows in channels with ih more or less defined banks.
CIE4491 Lecture. Hydraulic design
 CIE4491 Lecture. Hydraulic design Marie-claire ten Veldhuis 19-9-013 Delft University of Technology Challenge the future Hydraulic design of urban stormwater systems Focus on sewer pipes Pressurized and
Open Channel Hydraulics III - Sharpcrested
 PDHonline Course H140 (2 PDH) Open Channel Hydraulics III - Sharpcrested Weirs Instructor: Harlan H. Bengtson, Ph.D., PE 2012 PDH Online PDH Center 5272 Meadow Estates Drive Fairfax, VA 22030-6658 Phone
Technical Review of Pak Beng Hydropower Project (1) Hydrology & Hydraulics and (2) Sediment Transport & River Morphology
 Hydrology & Hydraulics and (2) Sediment Transport & River Morphology") Technical Review of Pak Beng Hydropower Project (1) Hydrology & Hydraulics and (2) Sediment Transport & River Morphology The 2 nd Regional Stakeholder Forum The Pak Beng Hydropower Project 5 th May 2017
Technical Review of Pak Beng Hydropower Project (1) Hydrology & Hydraulics and (2) Sediment Transport & River Morphology The 2 nd Regional Stakeholder Forum The Pak Beng Hydropower Project 5 th May 2017
Appendix F Channel Grade Control Structures
 Stream Simulation Appendix F Channel Grade Control Structures This appendix briefly describes permanent grade control structures that are sometimes needed in the upstream and/or downstream reaches adjacent
NUMERICAL SIMULATION OF OPEN CHANNEL FLOW BETWEEN BRIDGE PIERS
 TASK QUARTERLY 15 No 3 4, 271 282 NUMERICAL SIMULATION OF OPEN CHANNEL FLOW BETWEEN BRIDGE PIERS MICHAŁ SZYDŁOWSKI Faculty of Civil and Environmental Engineering, Gdansk University of Technology, Narutowicza
Upper Mississippi River Basin Environmental Management Program Workshop
 Presentation to the Upper Mississippi River Basin Environmental Management Program Workshop by Michael Rodgers River Engineer US Army Corps of Engineers, St. Louis District August 17, 2007 Engineering
Discharge. Discharge (Streamflow) is: Q = Velocity (L T -1 ) x Area (L 2 ) Units: L 3 T -1 e.g., m 3 s -1. Velocity. Area
 is: Q = Velocity (L T -1 ) x Area (L 2 ) Units: L 3 T -1 e.g., m 3 s -1. Velocity. Area") Discharge Discharge (Streamflow) is: Q = Velocity (L T -1 ) x Area (L 2 ) Units: L 3 T -1 e.g., m 3 s -1 Velocity Area Where is the average velocity?? 3 Source: Brooks et al., Hydrology and the Management
Discharge Discharge (Streamflow) is: Q = Velocity (L T -1 ) x Area (L 2 ) Units: L 3 T -1 e.g., m 3 s -1 Velocity Area Where is the average velocity?? 3 Source: Brooks et al., Hydrology and the Management
A Study of The Turbulent Flows in Sloping and Adversely Sloping Rectangular Culvert
 International Journal of Civil & Environmental Engineering IJCEE-IJENS Vol:12 No:06 85 A Study of The Turbulent Flows in Sloping and Adversely Sloping Rectangular Culvert Abdullah I Alhomidan College of
[1] Performance of the sediment trap depends on the type of outlet structure and the settling pond surface area.
![[1] Performance of the sediment trap depends on the type of outlet structure and the settling pond surface area.](/thumbs/76/74245181.jpg "[1] Performance of the sediment trap depends on the type of outlet structure and the settling pond surface area.") Sediment Trench SEDIMENT CONTROL TECHNIQUE Type 1 System Sheet Flow Sandy Soils Type 2 System [1] Concentrated Flow Clayey Soils Type 3 System [1] Supplementary Trap Dispersive Soils [1] Performance of
Sediment Trench SEDIMENT CONTROL TECHNIQUE Type 1 System Sheet Flow Sandy Soils Type 2 System [1] Concentrated Flow Clayey Soils Type 3 System [1] Supplementary Trap Dispersive Soils [1] Performance of
ERDC/LAB TR-0X-X 100. Figure 7-3 Maximum velocity magnitudes for existing conditions for 100-year flood event
 ERDC/LAB TR-0X-X 100 Figure 7-3 Maximum velocity magnitudes for existing conditions for 100-year flood event ERDC/LAB TR-0X-X 101 Figure 7-4 Model schematization of Option 1 Figure 7-5 Bed displacement
Chapter 4: Non uniform flow in open channels
 Chapter 4: Non uniform flow in open channels Learning outcomes By the end of this lesson, students should be able to: Relate the concept of specific energy and momentum equations in the effect of change
Why Stabilizing the Stream As-Is is Not Enough
 Why Stabilizing the Stream As-Is is Not Enough Several examples of alternatives to the County s design approach have been suggested. A common theme of these proposals is a less comprehensive effort focusing
Aquifer an underground zone or layer of sand, gravel, or porous rock that is saturated with water.
 Aggradation raising of the streambed by deposition that occurs when the energy of the water flowing through a stream reach is insufficient to transport sediment conveyed from upstream. Alluvium a general
Field Indicators of Inlet Controlled Road Stream Crossing Capacity
 D E P A RTMENT OF AGRICUL E TU R United States Department of Agriculture Forest Service Technology & Development Program 7700 Transportation System 2500 Watershed and Air Management October 1997 9777 1807
The last three sections of the main body of this report consist of:
 Threatened and Endangered Species Geological Hazards Floodplains Cultural Resources Hazardous Materials A Cost Analysis section that provides comparative conceptual-level costs follows the Environmental
B805 TEMPORARY EROSION AND SEDIMENT CONTROL MEASURES - OPSS 805
 B805 MEASURES - OPSS 805 805.1 GENERAL Construction activities frequently remove protective cover and expose soil to accelerated rates of erosion. Sediments generated thereby can be conveyed via runoff
Hydraulics Prof. Dr. Arup Kumar Sarma Department of Civil Engineering Indian Institute of Technology, Guwahati
 Hydraulics Prof. Dr. Arup Kumar Sarma Department of Civil Engineering Indian Institute of Technology, Guwahati Module No. # 04 Gradually Varied Flow Lecture No. # 07 Rapidly Varied Flow: Hydraulic Jump
LEVEE DESIGN FOR FLOOD PROTECTION ON ALLUVIAL FANS
 LEVEE DESIGN FOR FLOOD PROTECTION ON ALLUVIAL FANS BRUCE M. PHILLIPS 1 ABSTRACT The dynamic nature of alluvial fans in arid environments offers numerous floodplain management challenges primarily due to
LOGO Self-Cleansing of Storm Drain through Incipient Motion Design Concept and Flushing Gate
 LOGO Self-Cleansing of Storm Drain through Incipient Motion Design Concept and Flushing Gate River Engineering & Urban Drainage Research Centre (REDAC) Sedimentation Problem Sediment deposits in drainage
Rock Sizing for Multi-Pipe & Culvert Outlets
 Rock Sizing for Multi-Pipe & Culvert Outlets STORMWATER AND WATERWAY MANAGEMENT PRACTICES Photo 1 Rock pad outlet structure at end of a duel stormwater pipe outlet Photo 2 Rock pad outlet structure at