GIS in Action. Nature (453, 2,1 May 2008) Application issues. Understanding GIS by Case Study. Getting Started With GIS Chapter 10
|
|
|
- Derek Thompson
- 6 years ago
- Views:
Transcription

1 Nature (453, 2,1 May 2008) GIS in Action Getting Started With GIS Chapter 10 Understanding GIS by Case Study Use of GIS is best understood by examining case studies. Case studies in 4ed chapter cover rural, suburban, urban, and coastal GIS applications. Case studies in 5 th edition use examples from the glossy literature Application issues What problem was being addressed? What data were acquired? How were the data integrated? What methods were used? How successful was the application? Are the methods general or specific? How well did the software perform?


2 Located on older dissected surficial sediments. Composed of alluvial deposits of silt, sand, and gravel. Highly susceptible to soil liquefaction. Earthquake faults border campus on three sides. Campus fault runs directly through Phelps and Girvetz Hall.


3 Other buildings for concern: Arts Building The Old Gym Phelps Hall Campbell Hall


4 A more thorough assessment of population would provide better preparation techniques. Geological data was simplified to provide overview. Seismic stability ratings are based on multivariate factors. There is a high level of uncertainty in earthquake management, and thus our project is based on presumptions. Earthquakes are rapid onset events, and thus preparation is complex. Constant development on campus creates a progressive problem. Campus safety organizations are aware of the risks and the main issue is time and funding. There are on-going developments in disaster preparedness such as the Great Southern California ShakeOut to prevent disasters from becoming catastrophes. The big one is inevitable and we must be prepare ourselves through education. The Great Southern California Shakeout Nov 14 th Annually

 called in to")

5 USGS Ground Motion Simulation Case Study 3: GIS at the World Trade Center How GIS helped in the rescue and clean-up operations after the world s worst terrorist attack Contributor: Sean C. Ahern Hunter College - CUNY September 11, 2001 Get your staff together and start creating maps Hunter College s Center for the Analysis and Research of Spatial Information (CARSI) called in to help deal with the aftermath GIS World Trade Center operations at Pier 92 GIS support for firefighters, rescue workers, utility crews 24 hours a day / 7 days a week support for 2+ months 50+ GIS professionals


6 Data NYCMap NYCMap Orthophotography Planimetric maps Thermal imagery LIDAR imagery GPS data 30 cm resolution orthophotography Planimetric map - absolute spatial accuracy of half a meter LIDAR Thermal imaging Thermal remote sensing data collected at the WTC on September 16. Source: Roger Clark, USGS, Open File report


7 GPS Problems Maintaining building status database Unique identifiers for the buildings? Data consistency Data integrity TIME! Lessons learned NYC GIS infrastructure was critical Cities should connect their spatial data to its attributes! Need for cartographic standards Need mobile access to GIS Version management for multi-user environment Land use and land cover change on the South Coast Jeffrey Hemphill


8 Problem How has land use and land cover changed on the South Coast given the rapid urbanization since about 1950? Are there patterns of LULC change that fit a general model or urban growth? Diffusion and coalescence cycle model


9


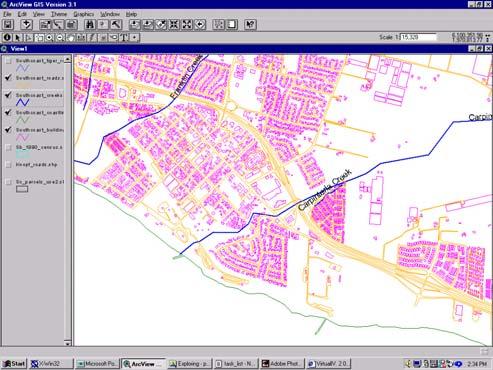
10 Detail Fairview & Hollister intersection


11 Anderson et al. LULC Classification System Urban or Built-Up Land 11 Residential 12 Commercial Services 13 Industrial 14 Transportation, Communications 15 Industrial and Commercial 16 Mixed Urban or Built-Up Land 17 Other Urban or Built-Up Land 2 Agricultural Land 21 Cropland and Pasture 22 Orchards, Groves, Vineyards, Nurseries 23 Confined Feeding Operations 24 Other Agricultural Land 3 Rangeland 31 Herbaceous Rangeland 32 Shrub and Brush Rangeland 33 Mixed Rangeland 4 Forest Land 41 Deciduous Forest Land 42 Evergreen Forest Land 43 Mixed Forest Land 5 Water 51 Streams and Canals 52 Lakes 53 Reservoirs 54 Bays and Estuaries 6 Wetland 61 Forested Wetlands 62 Nonforested Wetlands 7 Barren Land 71 Dry Salt Flats 72 Beaches 73 Sandy Areas Other than Beaches 74 Bare Exposed Rock 75 Strip Mines, Quarries, and Gravel Pits 76 Transitional Areas 77 Mixed Barren Land


12 SB, 1954 SB, 1954 Class 12; industrial/commercial Class 17; other urban (open space) Class 51; streams/canals Class 31; grassland Class 21; pasture/crop Note: Freeway expansion, multi-class transition SB, 1961 SB, 1961 Note: Freeway expansion, multi-class transition Note: Freeway expansion, multi-class transition


13 Visualizing Change Software ArcInfo Version 7 Register ArcEdit Custom LU change software, written in C Requires GIF 8 bit image files Data will go into the SLEUTH LULCC model Case Study 5: Sliding Rocks Contributor: Paula Messina, Department of Geology, San Jose State University, California. Sliding rock phenomenon Recessed trails in the playa sediments suggest that rocks and boulders glide across an almost perfectly flat lakebed at Racetrack Playa in Death Valley. No one has witnessed the rocks in motion. Trails are defined by lateral ridges, suggesting that the surface is saturated and pliant when the rocks move.

14 Sliding rock phenomenon, ctd. Some trails exhibit splash marks, wakes, and bow waves, indicating that the rocks are propelled at speeds of 2 meters per second or even more. The longest trail, over 800 meters, is fairly straight, but others record extremely chaotic activity. The largest boulders have masses up to 320 kilograms, and their trails are by no means the shortest. Ellen and Bessie Two rocks, Ellen and Bessie, apparently slid to the northwest, imprinting trails as evidence of their unusual activity. GIS, GPS and Terrain Analysis Dr. Messina, captivated by the sliding rocks of Racetrack Playa, used a variety of mapping and GIS tools to solve the mystery. GPS was used to map the positions of sliding rocks, and their trails. GIS was used to find spatial patterns in the movement of the rocks. She used hand-held anemometers to map wind vectors. Terrain analysis provided the elusive clue. Ice vs. Wind Maps of a few selected trails showed significant parallelism, suggesting that rocks may move while imbedded in a cohesive wind-propelled ice sheet. While some trails are parallel, most are not. Does that impy that ice moves only some rocks? Robert P. Sharp concluded that the wind alone, acting over a surface lubricated with wet clay may provide enough force to set the rocks in motion.
, exported to ArcView GIS, and analyzed using a variety of spatial")


15 GPS and GIS to the Rescue The exact locations of all rocks and precise plans of all trails on the 667 hectare playa were captured by Global Positioning System (GPS), exported to ArcView GIS, and analyzed using a variety of spatial and statistical methods. Karen Paula Messina stands next to Karen, one of the largest boulders on the playa. The GPS antenna protrudes from Paula s backpack, where the receiver is carried during field mapping. Spatial Patterns The trails of Jacki and Julie suggest a high degree of similar motion. However, although somewhat congruent, the rocks apparently converged during their calligraphic journeys. There appeared to be no correlation between the size, shape, or lithology of a rock, and the length or straightness of its trail. Terrain Analysis Analysis of the surrounding terrain, using the USGS Digital Elevation Model (DEM), provided the clue that had remained hitherto elusive. The slope and aspect of the basin directs airflow along very specific vectors. Direct measurements of the wind revealed that wind speeds up to six times faster, and up to 50 degrees deviant occurred at locations only 400 meters apart.

 Global Positioning System (GPS) Handheld anemometers")
16 Results The nature of a trail has more to do with the location of the rock that inscribed it than the physical characteristics of the rock itself. The Racetrack may be thought of as a mosaic of microclimates, with different wind regimes in adjacent locations. A few days after a rain, when fine, saturated clays coat the surface, a near- Teflon state supports mobilization of Racetrack Playa s rocks by wind. GIS Software and Data Used ArcView GIS ArcView Spatial Analyst Extension USGS Digital Elevation Model (DEM) Global Positioning System (GPS) Handheld anemometers The South Coast Aerial Photos 1929 Years: 1929, 1943, 1954, 1967, 1986, 1997


17 Assessors Digital Parcel Map


18 Roads input Model simulation 2040 Scenarios
 Create a new test GPS")


19 Adeline Dougherty s Honors Project The target (1 of 2) Create a new test GPS data set for Chapter 6 of the text Find a spot where multipath error is likely to be high Make repeat measurements over the quarter Map them, and build a database so that new stats can be computed The map Lots of multipath error!
20 Coming next. The Future of GIS
GIS in Action. 9 GIS in Action. The Spread of the Gypsy Moth. The Problem. Understanding GIS by Case Study. Getting Started With GIS.
 GIS in Action Getting Started With GIS Chapter 9 Dursun Z. ªeker 9 GIS in Action 9.1 Introducing GIS in Action 9.2 Case Study 1: GIS Fights the Gypsy Moth 9.3 Case Study 2: GIS and Road Accidents in Connecticut
Principals and Elements of Image Interpretation
 Principals and Elements of Image Interpretation 1 Fundamentals of Photographic Interpretation Observation and inference depend on interpreter s training, experience, bias, natural visual and analytical
An Internet-based Agricultural Land Use Trends Visualization System (AgLuT)
") An Internet-based Agricultural Land Use Trends Visualization System (AgLuT) Second half yearly report 01-01-2001-06-30-2001 Prepared for Missouri Department of Natural Resources Missouri Department of
An Internet-based Agricultural Land Use Trends Visualization System (AgLuT) Second half yearly report 01-01-2001-06-30-2001 Prepared for Missouri Department of Natural Resources Missouri Department of
How to Pick a GIS. GIS Software Chapter 8 in Longley, Goodchild, Maguire, and Rhind,, 2001
 How to Pick a GIS GIS Software Chapter 8 in Longley, Goodchild, Maguire, and Rhind,, 2001 How to Pick a GIS Evolution of GIS software Architecture of GIS software Types of software Example products The
2011 Land Use/Land Cover Delineation. Meghan Jenkins, GIS Analyst, GISP Jennifer Kinzer, GIS Coordinator, GISP
 2011 Land Use/Land Cover Delineation Meghan Jenkins, GIS Analyst, GISP Jennifer Kinzer, GIS Coordinator, GISP History O Key Points O Based on Anderson s Land Use and Land Cover Classification System O
Managing uncertainty when aggregating from pixels to parcels: context sensitive mapping and possibility theory
 Department of Geography Managing uncertainty when aggregating from pixels to parcels: context sensitive mapping and possibility theory Dr Lex Comber ajc36@le.ac.uk www.le.ac.uk/gg/staff/academic_comber.htm
Southern California Earthquake Center
 Southern California Earthquake Center By: Mark Slothower Geog 406 Final Report Dr. Sun Table of Contents Introduction Page 3 Hypothesis and research questions Page 3 Methods and flowchart Page 4 Data Page
SRJC Applied Technology 54A Introduction to GIS
 SRJC Applied Technology 54A Introduction to GIS Overview Lecture of Geographic Information Systems Fall 2004 Santa Rosa Junior College Presented By: Tim Pudoff, GIS Coordinator, County of Sonoma, Information
Pierce Cedar Creek Institute GIS Development Final Report. Grand Valley State University
 Pierce Cedar Creek Institute GIS Development Final Report Grand Valley State University Major Goals of Project The two primary goals of the project were to provide Matt VanPortfliet, GVSU student, the
Delineation of high landslide risk areas as a result of land cover, slope, and geology in San Mateo County, California
 Delineation of high landslide risk areas as a result of land cover, slope, and geology in San Mateo County, California Introduction Problem Overview This project attempts to delineate the high-risk areas
MARYLAND S LAND USE/LAND COVER MAP AND ASSOCIATED ANALYSIS
 MARYLAND S LAND USE/LAND COVER MAP AND ASSOCIATED ANALYSIS Maryland Department of Planning Daniel Baldwin Stephanie Martins November 19, 2012 http://www.planning.maryland.gov/ PURPOSE The primary purpose
Mapping Coastal Change Using LiDAR and Multispectral Imagery
 Mapping Coastal Change Using LiDAR and Multispectral Imagery Contributor: Patrick Collins, Technical Solutions Engineer Presented by TABLE OF CONTENTS Introduction... 1 Coastal Change... 1 Mapping Coastal
NR402 GIS Applications in Natural Resources
 NR402 GIS Applications in Natural Resources Lesson 1 Introduction to GIS Eva Strand, University of Idaho Map of the Pacific Northwest from http://www.or.blm.gov/gis/ Welcome to NR402 GIS Applications in
Teaching GIS for Land Surveying
 Teaching GIS for Land Surveying Zhanjing (John) Yu Evergreen Valley College, San Jose, California James Crossfield California State University at Fresno, Fresno California 7/13/2006 1 Outline of the Presentation
EROSION HAZARD OF MINNESOTA'S LAKE SUPERIOR SHORELINE. Carol A. Johnston Principal Investigator
 EROSION HAZARD OF MINNESOTA'S LAKE SUPERIOR SHORELINE Carol A. Johnston Principal Investigator Maps prepared by: James Salés, John Bonde, Tim Aunan, and Richard Raby Minnesota Sea Grant Research Bulletin
Module/Unit: Landforms Grade Level: Fifth
 Module/Unit: Landforms Grade Level: Fifth PA Academic Standards for Science and Technology and Environment and Ecology: 3.1.7.B Describe the use of models as an application or scientific or technological
The Geology of Sebago Lake State Park
 Maine Geologic Facts and Localities September, 2002 43 55 17.46 N, 70 34 13.07 W Text by Robert Johnston, Department of Agriculture, Conservation & Forestry 1 Map by Robert Johnston Introduction Sebago
Changes to Land 5.7B. landforms: features on the surface of Earth such as mountains, hills, dunes, oceans and rivers
 All the landforms on Earth have changed over time and continue to change. Many of the changes were caused by wind, moving water, and moving ice. Mountains have grown and shrunk. Rivers have cut away land
Essential Questions. What is erosion? What is mass wasting?
 Erosion Essential Questions What is erosion? What is mass wasting? What is Erosion? Erosion The transportation of sediment from one area to another Caused mainly by running water but also caused by glaciers,
Think about the landforms where you live. How do you think they have changed over time? How do you think they will change in the future?
 reflect All the landforms on Earth have changed over time and continue to change. Many of the changes were caused by wind, moving water, and moving ice. Mountains have grown and shrunk. Rivers have cut
Fri. Apr. 20, Today: Review briefly Ch. 11 (Mineral Exploration) Summarize Ch Land use classification
 Summarize Ch Land use classification") Fri. Apr. 20, 2018 Today: Review briefly Ch. 11 (Mineral Exploration) Summarize Ch. 12 -- Land use classification Reading: Skim Sabins Chapter 12 -- Land Use Concept of multi-level classification important
Fri. Apr. 20, 2018 Today: Review briefly Ch. 11 (Mineral Exploration) Summarize Ch. 12 -- Land use classification Reading: Skim Sabins Chapter 12 -- Land Use Concept of multi-level classification important
Summary Visualizations for Coastal Spatial Temporal Dynamics
 Summary Visualizations for Coastal Spatial Temporal Dynamics October 24 2011 Providence, RI Sidharth Thakur 1, Laura Tateosian 2, Helena Mitasova, Eric Hardin, and Margery Overton 1. sthakur@renci.org,
Exploring the boundaries of your built and natural world. Geomatics
 Exploring the boundaries of your built and natural world Geomatics Before the Luxor brought magic to the Las Vegas strip and before the South LRT extension in Edmonton gave residents a new route to travel,
Los Alamos National Laboratory is operated by the University of California for the United States Department of Energy under contract W-7405-ENG-36.
 LA-UR-01-4549 Los Alamos National Laboratory is operated by the University of California for the United States Department of Energy under contract W-7405-ENG-36. TITLE: Evaluation of Land Use/Land Cover
Display data in a map-like format so that geographic patterns and interrelationships are visible
 Vilmaliz Rodríguez Guzmán M.S. Student, Department of Geology University of Puerto Rico at Mayagüez Remote Sensing and Geographic Information Systems (GIS) Reference: James B. Campbell. Introduction to
An Internet-based Agricultural Land Use Trends Visualization System (AgLuT)
") An Internet-based Agricultural Land Use Trends Visualization System (AgLuT) Prepared for Missouri Department of Natural Resources Missouri Department of Conservation 07-01-2000-12-31-2001 Submitted by
An Internet-based Agricultural Land Use Trends Visualization System (AgLuT) Prepared for Missouri Department of Natural Resources Missouri Department of Conservation 07-01-2000-12-31-2001 Submitted by
Monitoring and Temporal Study of Mining Area of Jodhpur City Using Remote Sensing and GIS
 Monitoring and Temporal Study of Mining Area of Jodhpur City Using Remote Sensing and GIS S. K Yadav 1, S. L Borana 2 1,2 Scientist, Remote Sensing Group, DL, Jodhpur-342011, Rajasthan, India ---------------------------------------------------------------------***---------------------------------------------------------------------
Unit 1, Lesson 3 What Tools and Technologies Do Geographers Use?
 Unit 1, Lesson 3 What Tools and Technologies Do Geographers Use? Geographers use a variety of tools and technologies in investigating geographic questions. Maps and globes both represent the earth, but
DEVELOPMENT OF GPS PHOTOS DATABASE FOR LAND USE AND LAND COVER APPLICATIONS
 DEVELOPMENT OF GPS PHOTOS DATABASE FOR LAND USE AND LAND COVER APPLICATIONS An Ngoc VAN and Wataru TAKEUCHI Institute of Industrial Science University of Tokyo 4-6-1 Komaba, Meguro-ku, Tokyo 153-8505 Japan
Glacial Geology of Moose Point State Park, ME
 Geologic Site of the Month May, 2013 Glacial Geology of Moose Point State Park, Maine 44 o 25 59.18"N, 68 o 56 37.11"W Text and photos by Woodrow B. Thompson, Department of Agriculture, Conservation &
DEPARTMENT OF GEOLOGY AND MINERAL INDUSTRIES WAYS & MEANS SUBCOMMITTEE ON NATURAL RESOURCES MARCH 2, 2017
 DEPARTMENT OF GEOLOGY AND MINERAL INDUSTRIES WAYS & MEANS SUBCOMMITTEE ON NATURAL RESOURCES MARCH 2, 2017 1 ABOUT DOGAMI AGENCY MISSION, VISION & GOALS 2 Lidar image of a stream network along the Umpqua
The Road to Data in Baltimore
 Creating a parcel level database from high resolution imagery By Austin Troy and Weiqi Zhou University of Vermont, Rubenstein School of Natural Resources State and local planning agencies are increasingly
Estimating Probability of Success Rate
 Estimating Probability of Success Rate Don Ferguson, PhD A member of Appalachian Search and Rescue Conference Objective Provide SAR planners with a tool to help optimize effort allocation based on a number
Applying Hazard Maps to Urban Planning
 Applying Hazard Maps to Urban Planning September 10th, 2014 SAKAI Yuko Disaster Management Expert JICA Study Team for the Metro Cebu Roadmap Study on the Sustainable Urban Development 1 Contents 1. Outline
STEREO ANALYST FOR ERDAS IMAGINE Stereo Feature Collection for the GIS Professional
 STEREO ANALYST FOR ERDAS IMAGINE Stereo Feature Collection for the GIS Professional STEREO ANALYST FOR ERDAS IMAGINE Has Your GIS Gone Flat? Hexagon Geospatial takes three-dimensional geographic imaging
NCTCOG Regional GIS Meeting 6-Years and Going Strong. May 15, 2018 hosted by: Tarrant County
 NCTCOG Regional GIS Meeting 6-Years and Going Strong May 15, 2018 hosted by: Tarrant County Woolpert at a Glance 1911 Founded in Dayton, Ohio 25+ Offices across the nation 800+ Global employees 25+ OFFICES
Eagle Creek Post Fire Erosion Hazard Analysis Using the WEPP Model. John Rogers & Lauren McKinney
 Eagle Creek Post Fire Erosion Hazard Analysis Using the WEPP Model John Rogers & Lauren McKinney Columbia River Gorge at Risk: Using LiDAR and GIS-based predictive modeling for regional-scale erosion susceptibility
UNIT SEVEN: Earth s Water. Chapter 21 Water and Solutions. Chapter 22 Water Systems. Chapter 23 How Water Shapes the Land
 UNIT SEVEN: Earth s Water Chapter 21 Water and Solutions Chapter 22 Water Systems Chapter 23 How Water Shapes the Land Chapter Twenty-Three: How Water Shapes the Land 23.1 Weathering and Erosion 23.2
Copernicus Overview. Major Emergency Management Conference Athlone 2017
 Copernicus Overview Major Emergency Management Conference Athlone 2017 Copernicus is a European programme implemented by the European Commission. The services address six thematic areas: land, marine,
Fugro Geospatial: Turning Spatial Data into Knowledge
 Fugro Geospatial: Turning Spatial Data into Knowledge 2016 Fugro Geospatial, GIS and Consultants Locations Variety of Collection Platforms Traditional Mapping Traditional Mapping Imagery Photogrammetric
Name. 4. The diagram below shows a soil profile formed in an area of granite bedrock. Four different soil horizons, A, B, C, and D, are shown.
 Name 1. In the cross section of the hill shown below, which rock units are probably most resistant to weathering? 4. The diagram below shows a soil profile formed in an area of granite bedrock. Four different
Pilot area description Tissoe
 Pilot area description Tissoe October 2014 Mette V. Odgaard, department of Agroecology, Aarhus University Camilla Vestergaard, Knowledge Center for Agriculture P/S (eds.) 1 Content 1. General pilot area
ESTIMATION OF LANDFORM CLASSIFICATION BASED ON LAND USE AND ITS CHANGE - Use of Object-based Classification and Altitude Data -
 ESTIMATION OF LANDFORM CLASSIFICATION BASED ON LAND USE AND ITS CHANGE - Use of Object-based Classification and Altitude Data - Shoichi NAKAI 1 and Jaegyu BAE 2 1 Professor, Chiba University, Chiba, Japan.
Quick Response Report #126 Hurricane Floyd Flood Mapping Integrating Landsat 7 TM Satellite Imagery and DEM Data
 Quick Response Report #126 Hurricane Floyd Flood Mapping Integrating Landsat 7 TM Satellite Imagery and DEM Data Jeffrey D. Colby Yong Wang Karen Mulcahy Department of Geography East Carolina University
Pipeline Routing Using Geospatial Information System Analysis
 Pipeline Routing Using Geospatial Information System Analysis Mahmoud Reza 1 Delavar and Fereydoon 2 Naghibi 1-Assistance Professor, Dept. of Surveying and Geomatic Eng., Eng. Faculty, University of Tehran,
Welcome to NR502 GIS Applications in Natural Resources. You can take this course for 1 or 2 credits. There is also an option for 3 credits.
 Welcome to NR502 GIS Applications in Natural Resources. You can take this course for 1 or 2 credits. There is also an option for 3 credits. The 1st credit consists of a series of readings, demonstration,
2014 Summer Training Courses on Slope Land Disaster Reduction Hydrotech Research Institute, National Taiwan University, Taiwan August 04-15, 2014
 Final Project Report 2014 Summer Training Courses on Slope Land Disaster Reduction Hydrotech Research Institute, National Taiwan University, Taiwan August 04-15, 2014 Landslides in Mt. Umyeon Susceptibility
Pilot area description Aalborg south
 Pilot area description Aalborg south October 2014 Mette V. Odgaard, Department of Agroecology, Aarhus University Camilla Vestergaard, Knowledge Center for Agriculture P/S (eds.) 1 Content 1. General pilot
RiskCity Training package on the Application of GIS for multi- hazard risk assessment in an urban environment.
 RiskCity Training package on the Application of GIS for multi- hazard risk assessment in an urban environment. Cees van Westen (Westen@itc.nl) & Nanette C. Kingma (Kingma@itc.nl) ITC: Training & Research
Dr. S.SURIYA. Assistant professor. Department of Civil Engineering. B. S. Abdur Rahman University. Chennai
 Hydrograph simulation for a rural watershed using SCS curve number and Geographic Information System Dr. S.SURIYA Assistant professor Department of Civil Engineering B. S. Abdur Rahman University Chennai
Georeferencing and Satellite Image Support: Lessons learned, Challenges and Opportunities
 Georeferencing and Satellite Image Support: Lessons learned, Challenges and Opportunities Shirish Ravan shirish.ravan@unoosa.org UN-SPIDER United Nations Office for Outer Space Affairs (UNOOSA) UN-SPIDER
Introduction to GIS I
 Introduction to GIS Introduction How to answer geographical questions such as follows: What is the population of a particular city? What are the characteristics of the soils in a particular land parcel?
Unit 1, Lesson 2. What is geographic inquiry?
 What is geographic inquiry? Unit 1, Lesson 2 Understanding the way in which social scientists investigate problems will help you conduct your own investigations about problems or issues facing your community
Appendix D. Sediment Texture and Other Soil Data
 5 6 7 8 Appendix D. Sediment Texture and Other Soil Data This appendix describes the sediment texture of the aquifer system in the Restoration Area. The contents of this appendix describe the: Importance
GIS and Remote Sensing
 Spring School Land use and the vulnerability of socio-ecosystems to climate change: remote sensing and modelling techniques GIS and Remote Sensing Katerina Tzavella Project Researcher PhD candidate Technology
Classification of Erosion Susceptibility
 GEO327G: GIS & GPS Applications in Earth Sciences Classification of Erosion Susceptibility Denali National Park, Alaska Zehao Xue 12 3 2015 2 TABLE OF CONTENTS 1 Abstract... 3 2 Introduction... 3 2.1 Universal
Object Based Imagery Exploration with. Outline
 Object Based Imagery Exploration with Dan Craver Portland State University June 11, 2007 Outline Overview Getting Started Processing and Derivatives Object-oriented classification Literature review Demo
Natural hazards in Glenorchy Summary Report May 2010
 Natural hazards in Glenorchy Summary Report May 2010 Contents Glenorchy s hazardscape Environment setting Flood hazard Earthquakes and seismic hazards Hazards Mass movement Summary Glossary Introduction
Erosion Susceptibility in the area Around the Okanogan Fire Complex, Washington, US
 Erosion Susceptibility in the area Around the Okanogan Fire Complex, Washington, US 1. Problem Construct a raster that represents susceptibility to erosion based on lithology, slope, cover type, burned
COASTAL QUATERNARY GEOLOGY MAPPING FOR NSW: EXAMPLES AND APPLICATIONS
 COASTAL QUATERNARY GEOLOGY MAPPING FOR NSW: EXAMPLES AND APPLICATIONS A Troedson Geological Survey of New South Wales Abstract Detailed geological mapping of the coastal plains of regional NSW was undertaken
Appendix J Vegetation Change Analysis Methodology
 Appendix J Vegetation Change Analysis Methodology Regional Groundwater Storage and Recovery Project Draft EIR Appendix-J April 2013 APPENDIX J- LAKE MERCED VEGETATION CHANGE ANALYSIS METHODOLOGY Building
Geographic Information Systems
 Geographic Information Systems What is a Geographic Information System (GIS)? definition of GIS - An internally referenced, automated, spatial information system for data mapping, management, and analysis
Erosion and Deposition
 CHAPTER 3 LESSON 2 Erosion and Deposition Landforms Shaped by Water and Wind Key Concepts What are the stages of stream development? How do water erosion and deposition change Earth s surface? How do wind
2013 Esri Europe, Middle East and Africa User Conference October 23-25, 2013 Munich, Germany
 2013 Esri Europe, Middle East and Africa User Conference October 23-25, 2013 Munich, Germany Environmental and Disaster Management System in the Valles Altos Region in Carabobo / NW-Venezuela Prof.Dr.habil.Barbara
CHAPTER 1 THE UNITED STATES 2001 NATIONAL LAND COVER DATABASE
 CHAPTER 1 THE UNITED STATES 2001 NATIONAL LAND COVER DATABASE Collin Homer*, Jon Dewitz, Joyce Fry, and Nazmul Hossain *U.S. Geological Survey (USGS) Center for Earth Resources Observation and Science
BIODIVERSITY CONSERVATION HABITAT ANALYSIS
 BIODIVERSITY CONSERVATION HABITAT ANALYSIS A GIS Comparison of Greater Vancouver Regional Habitat Mapping with Township of Langley Local Habitat Mapping Preface This report was made possible through the
INTRODUCTION Landslides are bad but good
 Mapping Current and Future Landslide Susceptibility with GIS for the Tualatin Mountains, Oregon, USA Ian Cogar Jesse Roper INTRODUCTION Landslides are bad but good Avg. Annual Cost $2 billion and 20 50
Land Accounts - The Canadian Experience
 Land Accounts - The Canadian Experience Development of a Geospatial database to measure the effect of human activity on the environment Who is doing Land Accounts Statistics Canada (national) Component
1.1 What is Site Fingerprinting?
 Site Fingerprinting Utilizing GIS/GPS Technology 1.1 What is Site Fingerprinting? Site fingerprinting is a planning tool used to design communities where protection of natural resources is the primary
Yaneev Golombek, GISP. Merrick/McLaughlin. ESRI International User. July 9, Engineering Architecture Design-Build Surveying GeoSpatial Solutions
 Yaneev Golombek, GISP GIS July Presentation 9, 2013 for Merrick/McLaughlin Conference Water ESRI International User July 9, 2013 Engineering Architecture Design-Build Surveying GeoSpatial Solutions Purpose
LANDUSE APPLICATIONS OF EARTHQUAKE HAZARD MAPS CALIFORNIA EXPERIENCE
 LANDUSE APPLICATIONS OF EARTHQUAKE HAZARD MAPS CALIFORNIA EXPERIENCE Thomas C. Vlasic Vice President Spangle Associates Portola Valley, California INTRODUCTION The focus of this report is primarily on
Earthquake Hazards in Douglas County
 Earthquake Hazards in Douglas County Craig M. depolo Nevada Bureau of Mines and Geology Nevada Hazard Mitigation Planning Committee August 9, 2012 Earthquake Truths The consequences of bad earthquakes
Need of Proper Development in Hilly Urban Areas to Avoid
 Need of Proper Development in Hilly Urban Areas to Avoid Landslide Hazard Dr. Arvind Phukan, P.E. Cosultant/Former Professor of Civil Engineering University of Alaska, Anchorage, USA RI District Governor
COSMORPHOLOGY - May 2009
 Name COSMORPHOLOGY - May 2009 Geologic landforms Purpose: By studying aerial photographs you will learn to identify different kinds of geologic features based on their different morphologies and learn
Landslide Computer Modeling Potential
 Landslide Computer Modeling Potential Michael D. Dixon, P.E. Civil Engineer Payette National Forest The Payette National Forest selected the Stability Index Mapping (SINMAP) model for use in identifying
GIS and Coastal Nutrients Luke Cole
 GIS and Coastal Nutrients Luke Cole Human population density has been widely utilized as a valid predictor of terrestrial nitrogen loads into marine systems. As 50% of the world s population lives within
ENGRG Introduction to GIS
 ENGRG 59910 Introduction to GIS Michael Piasecki March 17, 2014 Lecture 08: Terrain Analysis Outline: Terrain Analysis Earth Surface Representation Contour TIN Mass Points Digital Elevation Models Slope
USING GIS CARTOGRAPHIC MODELING TO ANALYSIS SPATIAL DISTRIBUTION OF LANDSLIDE SENSITIVE AREAS IN YANGMINGSHAN NATIONAL PARK, TAIWAN
 CO-145 USING GIS CARTOGRAPHIC MODELING TO ANALYSIS SPATIAL DISTRIBUTION OF LANDSLIDE SENSITIVE AREAS IN YANGMINGSHAN NATIONAL PARK, TAIWAN DING Y.C. Chinese Culture University., TAIPEI, TAIWAN, PROVINCE
New Land Cover & Land Use Data for the Chesapeake Bay Watershed
 New Land Cover & Land Use Data for the Chesapeake Bay Watershed Why? The Chesapeake Bay Program (CBP) partnership is in the process of improving and refining the Phase 6 suite of models used to inform
Spanish national plan for land observation: new collaborative production system in Europe
 ADVANCE UNEDITED VERSION UNITED NATIONS E/CONF.103/5/Add.1 Economic and Social Affairs 9 July 2013 Tenth United Nations Regional Cartographic Conference for the Americas New York, 19-23, August 2013 Item
Sea Level Rise and the Scarborough Marsh Scarborough Land Trust Annual Meeting April 24, 2018
 Sea Level Rise and the Scarborough Marsh Scarborough Land Trust Annual Meeting April 24, 2018 Peter A. Slovinsky, Marine Geologist Maine Geological Survey Funded by: 50% 40% Figure modified from Griggs,
GIS Geographical Information Systems. GIS Management
 GIS Geographical Information Systems GIS Management Difficulties on establishing a GIS Funding GIS Determining Project Standards Data Gathering Map Development Recruiting GIS Professionals Educating Staff
Erosion and Deposition along Rivers and Seashores - Part 1: Modeling in the Classroom
 Erosion and Deposition along Rivers and Seashores - Part 1: Modeling in the Classroom Lesson Focus: Erosion and Deposition Learning Objectives: Students will learn to recognize landforms found on Earth.
International Journal of Modern Trends in Engineering and Research e-issn No.: , Date: April, 2016
 International Journal of Modern Trends in Engineering and Research www.ijmter.com e-issn No.:2349-9745, Date: 28-30 April, 2016 Landslide Hazard Management Maps for Settlements in Yelwandi River Basin,
Gully erosion and associated risks in the Tutova basin Moldavian Plateau
 Landform Analysis, Vol. 17: 193 197 (2011) Gully erosion and associated risks in the Tutova basin Moldavian Plateau University Alexandru Ioan Cuza of Iasi, Department of Geography, Romania, e-mail: catiul@yahoo.com
Mass Wasting: The Work of Gravity
 Chapter 15 Lecture Earth: An Introduction to Physical Geology Twelfth Edition Mass Wasting: The Work of Gravity Tarbuck and Lutgens Chapter 15 Mass Wasting The Importance of Mass Wasting Slopes are the
3.3 CLIMATE, GEOLOGY, TOPOGRAPHY, AND SOILS CLIMATE GEOLOGY TOPOGRAPHY
 3.3 CLIMATE, GEOLOGY, TOPOGRAPHY, AND SOILS This section describes the climate, geology, topography, and soil resource characteristics of the Yolo Bypass Wildlife Area (Wildlife Area). Agricultural soil
GEOLOGY AND SOILS. This chapter summarizes geologic and geotechnical aspects of the site as they relate to the Project.
 9 GEOLOGY AND SOILS INTRODUCTION This chapter summarizes geologic and geotechnical aspects of the site as they relate to the Project. This chapter utilizes information from the following reports prepared
Mass Wasting. Revisit: Erosion, Transportation, and Deposition
 Mass Wasting Revisit: Erosion, Transportation, and Deposition While landslides are a normal part of erosion and surface processes, they can be very destructive to life and property! - Mass wasting: downslope
Hazard Mapping Along the Dead Sea Shoreline
 FIG Working Week in Marrakech, Morocco 18-22 May 2011 Hazard Mapping Along the Dead Sea Shoreline Rami Al-Ruzouq, Abdullah Al-Zuobi, AbdEl-Rahman Abueladas, Emad Akkawi Department of Surveying and Geomatics
The Use of Geographic Information Systems to Assess Change in Salt Marsh Ecosystems Under Rising Sea Level Scenarios.
 The Use of Geographic Information Systems to Assess Change in Salt Marsh Ecosystems Under Rising Sea Level Scenarios Robert Hancock The ecological challenges presented by global climate change are vast,
Introduction-Overview. Why use a GIS? What can a GIS do? Spatial (coordinate) data model Relational (tabular) data model
 data model Relational (tabular) data model") Introduction-Overview Why use a GIS? What can a GIS do? How does a GIS work? GIS definitions Spatial (coordinate) data model Relational (tabular) data model intro_gis.ppt 1 Why use a GIS? An extension
Introduction-Overview Why use a GIS? What can a GIS do? How does a GIS work? GIS definitions Spatial (coordinate) data model Relational (tabular) data model intro_gis.ppt 1 Why use a GIS? An extension
Geometric Algorithms in GIS
 Geometric Algorithms in GIS GIS Visualization Software Dr. M. Gavrilova GIS Software for Visualization ArcView GEO/SQL Digital Atmosphere AutoDesk Visual_Data GeoMedia GeoExpress CAVE? Visualization in
Lesson Graphic Organizer
 Lesson Graphic Organizer Maps Aerial Photos and Satellite Images Globes Global Positioning System (GPS) Graphs Charts Diagrams Global Information Systems (GIS) Michigan Citizenship Collaborative Curriculum
Interpretive Map Series 24
 Oregon Department of Geology and Mineral Industries Interpretive Map Series 24 Geologic Hazards, and Hazard Maps, and Future Damage Estimates for Six Counties in the Mid/Southern Willamette Valley Including
Web (Java, ArcGIS Server [WebADF, flex, silverlight]) Mobile (ArcGIS Mobile, ArcPad, Windows Mobile) Deskt
![Web (Java, ArcGIS Server [WebADF, flex, silverlight]) Mobile (ArcGIS Mobile, ArcPad, Windows Mobile) Deskt](/thumbs/96/129284052.jpg "Web (Java, ArcGIS Server [WebADF, flex, silverlight]) Mobile (ArcGIS Mobile, ArcPad, Windows Mobile) Deskt") GIS Services company in Lincoln, NE Custom GIS database design and build (for local, county, state and private corporations) Custom (ESRI and non-esri) application design and build in Java, C++, C#,.Net
GIS Services company in Lincoln, NE Custom GIS database design and build (for local, county, state and private corporations) Custom (ESRI and non-esri) application design and build in Java, C++, C#,.Net
Popular Mechanics, 1954
 Introduction to GIS Popular Mechanics, 1954 1986 $2,599 1 MB of RAM 2017, $750, 128 GB memory, 2 GB of RAM Computing power has increased exponentially over the past 30 years, Allowing the existence of
Summary Description Municipality of Anchorage. Anchorage Coastal Resource Atlas Project
 Summary Description Municipality of Anchorage Anchorage Coastal Resource Atlas Project By: Thede Tobish, MOA Planner; and Charlie Barnwell, MOA GIS Manager Introduction Local governments often struggle
Introduction to GIS. Geol 4048 Geological Applications of Remote Sensing
 Introduction to GIS Geol 4048 Geological Applications of Remote Sensing GIS History: Before Computers GIS History Using maps for a long time Dr. Roger F. Tomlinson Father of GIS He was an English geographer
PROANA A USEFUL SOFTWARE FOR TERRAIN ANALYSIS AND GEOENVIRONMENTAL APPLICATIONS STUDY CASE ON THE GEODYNAMIC EVOLUTION OF ARGOLIS PENINSULA, GREECE.
 PROANA A USEFUL SOFTWARE FOR TERRAIN ANALYSIS AND GEOENVIRONMENTAL APPLICATIONS STUDY CASE ON THE GEODYNAMIC EVOLUTION OF ARGOLIS PENINSULA, GREECE. Spyridoula Vassilopoulou * Institute of Cartography