Earth and Planetary Science Letters
|
|
|
- Jason Goodman
- 5 years ago
- Views:
Transcription


1 Earth and Planetary Science Letters 288 (2009) Contents lists available at ScienceDirect Earth and Planetary Science Letters journal homepage: Mica, deformation fabrics and the seismic properties of the continental crust Geoffrey E. Lloyd a,, Robert W.H. Butler b, Martin Casey a,1, David Mainprice c a Institute of Geophysics and Tectonics, School of Earth and Environment, The University of Leeds, Leeds LS2 9JT, UK b Geology and Petroleum Geology, School of Geosciences, University of Aberdeen, Meston Building, King's College, Aberdeen AB24 3UE, UK c Géosciences Montpellier, CNRS and Université Montpellier 2, Montpellier, France article info abstract Article history: Received 19 January 2009 Received in revised form 18 September 2009 Accepted 18 September 2009 Available online 23 October 2009 Editor: R.D. van der Hilst Keywords: mica seismic anisotropy continental tectonics S C fabrics CPO EBSD Seismic anisotropy originating within the continental crust is used to determine kinematic flow lines within active mountain belts and is widely attributed to regionally aligned mica. However, naturally deformed micaceous rocks commonly show composite (e.g. S C) fabrics. It is necessary therefore to understand how both varying mica content and differing intensities of multiple foliations impact on seismic interpretations in terms of deformation fields. An outcrop analogue for granitic mid-crustal deformed zones is used here to calibrate the seismic response against both parameters. Seismic responses are modelled using crystallographic preferred orientations for polymineralic, micaceous granitic gneisses, measured using Electron Back-Scatter Diffraction. The sample results are generalised by modelling the effects of variations in modal composition and the relative importance of deformation fabrics of variable orientation, so-called rock and fabric recipes. The maximum P- and S-anisotropy are calculated at 16.6% and 23.9% for single-foliation gneisses but for mixed (i.e. S C) foliation gneisses these values reduce to 5.8% and 7.5% respectively. Furthermore, mixtures of multiple foliations generate significant variations in the geometry of the seismic anisotropy. This effect, coupled with the geographical orientation of fabrics in nature, can generate substantial variations in the orientation and magnitude of seismic anisotropy (especially for shear waves) as measured for the continental crust using existing receiver function and teleseismic near-vertical incidence methods. Thus, maps of seismic anisotropy varying with depth in deforming continents need not imply necessarily depth-varying deformation kinematics and tectonic decoupling Elsevier B.V. All rights reserved. 1. Introduction Variations in the orientation and strength of seismic anisotropy are used commonly to map deformation in the deep Earth (e.g. Mainprice, 2007). Whilst early researches concentrated on the contribution of crystallographically aligned olivine in the upper mantle as the prime origin for measured seismic anisotropy (e.g. Silver, 1996; Savage, 1999), it is realised now that mineral alignment in the continental crust can contribute also to seismic anisotropy (e.g. Okaya and Christensen, 2002; Vergne et al., 2003; Sherrington et al., 2004; Mainprice, 2007). Consequently, seismic receiver functions and nearby earthquakes are being used increasingly to measure anisotropy in the continental crust (e.g. Ozacar and Zandt, 2004; Champion et al., 2006; Xu et al., 2007). Acoustic experiments of rock samples indicate that schists exhibit significant P-wave anisotropy and shear wave splitting (e.g. Brocher and Christensen, 1990; Burlini and Fountain, 1993; Godfrey et al., 2000; Cholach and Schmitt, 2006). These experiments have led to a tacit assumption that seismic anisotropy in the continental crust may Corresponding author. address: g.lloyd@earth.leeds.ac.uk (G.E. Lloyd). 1 Deceased reflect regionally aligned micaceous foliation and that its orientation may be used to deduce the geometry of ductile deformation in-situ (e.g. Burlini, 1994; Weiss et al., 1999; Godfrey et al., 2000; Shapiro et al., 2004; Sherrington et al., 2004). Some studies go further, inferring variations in deformation geometry with depth (e.g. Ozacar and Zandt, 2004), while others have mapped zones of apparently enhanced anisotropy that are interpreted as ductile thrust zones (e.g. Schulte-Pelkum et al., 2005). These researches set the agenda for mapping strain in the continental crust and provide ways of relating surface deformation deduced from geodetic data to mantle flow. The deduction of relationships between geodetic data and mantle flow requires understanding of how bulk seismic properties relate to deformation geometry and kinematics in rocks of the continental crust. For example, whilst pure shear deformations tend to generate rocks with single (parallel) foliation patterns, many simple shear deformations exhibit multiple (non-parallel) foliations (Fig. 1). In particular, in natural simple shear zones, such as ductile faults hosted in granitoids, deformation is commonly characterised by dual, socalled S C, fabrics developed on scales greater than the grain size, comprising of non-parallel schistosity (S) and shear or cisaillement (C) planes (Berthé et al., 1979; Lister and Snoke, 1984). S-planes are considered to be related to the accumulation of finite strain, whereas C-planes are considered to be related to localised high shear strain. It X/$ see front matter 2009 Elsevier B.V. All rights reserved. doi: /j.epsl
 320 328 321 To investigate the kinematic significance of seismic anisotropy measurements in the middle continental crust, a sample exhibiting mica S C")
2 G.E. Lloyd et al. / Earth and Planetary Science Letters 288 (2009) To investigate the kinematic significance of seismic anisotropy measurements in the middle continental crust, a sample exhibiting mica S C fabrics is used here. The sample is from the Nanga Parbat massif, NW Pakistan, where there is a good kinematic framework (Butler et al., 2002) and mid-crustal materials have been exhumed rapidly from the depths where they were actively deforming (e.g. Zeitler et al., 1993, 2001). In addition, acoustic anisotropy has been measured in rock samples from Nanga Parbat by Meltzer and Christensen (2001). They report effective seismic anisotropies of up to 12% for compression waves and 21% for shear waves transmitted through Nanga Parbat gneisses and attribute these values to strongly aligned biotite. The current paper relates seismic properties explicitly to deformation structures on the scale of polycrystalline aggregates. These results are used then to produce a generalised model for the seismic response of deformed micaceous continental crust linked to mica content and deformation fabrics. 2. Constructing seismic properties Fig. 1. Kinematic models and tectonic foliations. (a) Pure shear dominant single fabric (note, X Y Z). (b) Simple shear dominant dual (S C) fabrics (note, individual tectonic reference frames for each fabric). is possible therefore to define distinct tectonic reference frames (X Y Z) related to each planar fabric (Fig. 1b). Although S-surfaces are often considered to develop first and to be cross-cut subsequently at high angles by C-planes, simultaneous formation of S C planes is also possible (e.g. Berthé et al., 1979; Lister and Snoke 1984). The initial high angle between the two sets of planes can decrease with increasing shear strain localised upon the C-planes and eventually both sets of planes may become sub-parallel. The aim here is to show how such multiple (i.e. S C) deformation fabrics in micaceous rocks, together with varying mica content, combine within a simple kinematic framework to produce significant variations not only in the intensity but also in the orientation of seismic anisotropy. Almost all of the rock-forming minerals in the continental crust exhibit significant seismic anisotropy as single crystals (Barruol and Mainprice, 1993; Ji et al., 2002). However, for many minerals, including quartz and feldspars, the crystal symmetry creates geometrically complex seismic responses that, with small degrees of misorientation within polycrystalline aggregates, interfere destructively to produce either low anisotropy or near isotropic behaviours. Key exceptions are monoclinic mica and amphibole minerals that commonly align both crystallographic directions and shapes to create a simple seismic anisotropy pattern (e.g. Sherrington et al., 2004 and references therein). Consequently, significant measured seismic anisotropy in the mid continental crust is attributed usually to the crystallographic preferred orientation (CPO) of mica (e.g. Kern and Wenk, 1990; Nishizawa and Yoshino, 2001; Shapiro et al., 2004; Mahan, 2006; Meissner et al., 2006). In the lower continental crust amphibole is likely to be significant also (e.g. Rudnick and Fountain, 1995; Kitamura, 2006; Barberini et al., 2007; Tatham et al., 2008). Other common minerals (e.g. quartz and feldspar) are only expected to contribute constructively to the whole rock seismic anisotropy where mica and/or amphibole are absent. The CPO-based approach excludes open fractures (e.g. see Crampin and Chastin, 2003), grainscale effects (e.g. Hall et al., 2008), sedimentary layering (e.g. Valcke et al., 2006) and other microstructural parameters (e.g. Wendt et al., 2003) that might contribute also to seismic anisotropy in certain circumstances. The procedure for using microstructural data to predict the seismic response of deformed polycrystalline aggregates followed in this paper is similar to that employed in a companion contribution that studies the seismic properties of basic continental crust and the role of amphibole (Tatham et al., 2008). However, the approach was originally developed to calibrate the seismic properties of the upper mantle by using peridotite xenoliths (Crosson and Lin, 1971; Mainprice and Silver, 1993; Ben Ismail and Mainprice, 1998). For these mantle rocks, the orientation of each crystal of olivine within the aggregate is measured. This is possible now, both accurately and efficiently via automation, for thousands of grains in polycrystalline samples using Electron Back-scattered Diffraction (EBSD). The elastic properties for single crystals can then be summed over the aggregate to determine the seismic response for the bulk rock, thereby linking the deformation fabrics (e.g. kinematic lineation and foliation) to the seismic response (e.g. Mainprice, 1990; Mainprice and Humbert, 1994). Thus, seismic anisotropy measurements for the mantle and crust can be interpreted in terms of deformation flow fields (e.g. Mainprice and Nicolas, 1989; Babuska and Cara, 1991). The methodology for monomineralic olivine rocks has been modified for the continental crust by using appropriate elastic properties for crustal minerals, combined in proportions appropriate to those measured in polymineralic aggregates (e.g. Mainprice and Humbert, 1994). Such an approach has advantages because the different components of the bulk mineralogy can be varied to investigate not only the relative contributions of individual mineral phases (the rock recipe ) but also differently oriented fabric elements (e.g. S C foliations, the fabric recipe ). Both of these approaches are considered here, with the seismic properties calculated for each recipe according to standard procedure using the following elastic constants: quartz (McSkimin et al., 1965); plagioclase (Aleksandrov et al., 1974); orthoclase (Aleksandrov et al., 1974); biotite (Aleksandrov and Ryzhova, 1961); and muscovite (Vaughan and Guggenheim, 1986). 3. Sample description The sample used in this study is an orthogneiss from the Nanga Parbat Massif, Western Himalaya. These gneisses are derived largely from a granodioritic protolith composed of feldspar, quartz and biotite, with subordinate muscovite (Fig. 2). Overall, this composition is a good analogue for much of the Earth's middle continental crust (e.g. Barruol and Mainprice, 1993; Rudnick and Fountain, 1995). In deformed state some of the feldspars form distinctive megacrysts (augen) that provide strain markers and rigid bodies that aid definition of the deformation state (Butler et al., 2002). Using this observation, two end-member foliation types can be described (Butler et al., 2002): 1. a subvertical stretching foliation produced by near co-
 320 328 vertical stretching and shearing, manifest as cm-scale domains that collectively define S C fabrics (in the sense of Lister and Snoke, 1984).")
3 322 G.E. Lloyd et al. / Earth and Planetary Science Letters 288 (2009) vertical stretching and shearing, manifest as cm-scale domains that collectively define S C fabrics (in the sense of Lister and Snoke, 1984). A single, representative (in terms of bulk mineralogy and deformation state) sample of Nanga Parbat gneiss from field site B1 of Butler et al. (2002) with well-developed S C fabrics was selected for detailed petrographic analysis and seismic property determination (Fig. 2). The geographical orientation of the sample was recorded at the time of sampling so that the microstructural and seismic properties could be reported and analysed in their in-situ geometry. The sample is typical of Nanga Parbat massif gneisses, containing quartz, plagioclase and orthoclase feldspars, together with abundant biotite and muscovite micas that contribute to the domains of strong S and C foliations. The domainal nature of the deformation allows the two distinct fabric elements (i.e. S and C) to be isolated and measured separately. The role of the two fabrics in contributing to the bulk lattice preferred orientation and hence the seismic response of the gneisses as a whole can be investigated then by re-combining them in varying proportions. This constitutes the fabric recipe. The sample was oriented kinematically with X (axis of maximum tectonic elongation) horizontal, Z (direction of maximum tectonic contraction) vertical and Y (remaining Cartesian direction) normal to the plane of section. Such XZ sections contain usually the most significant kinematic shear criteria, especially for plane strain deformations. Both the S- and C-fabrics are defined predominantly by micas, especially biotite, although quartz is elongate typically parallel to both foliations and the shape of the orthoclase augen reflects the different kinematic components. In contrast, plagioclase grains are commonly equant. The C-fabric is parallel to the macroscopic XY plane but the S-fabric is considerably steeper, although somewhat variable in inclination within the sample (Fig. 2). The two fabrics form distinctive and separate elements in the microstructure and can be analysed therefore individually via EBSD (see Supplementary Information for analytical details). Three specific EBSD analyses were performed (Fig. 2): (1) whole sample; (2) a region comprising the C-type fabric; and (3) a region comprising the S-type fabric. The modal proportions for each EBSD analysis are given in Table 1. The S- and C-fabric analyses are not expected to yield similar modal proportions to the whole sample analysis as these regions were targeted specifically for their biotiterich foliations. The individual mineral CPO in each analysis was determined via EBSD, from which the sample seismic properties were derived via standard procedure (e.g. Barruol and Mainprice, 1993; Mainprice and Humbert, 1994; Lloyd and Kendall, 2005; Tatham et al., 2008). To assess the role of biotite in determining seismic properties, the modal content of biotite in the whole sample analysis was varied between 0 and 100% whilst the other phases were varied according to their asmeasured proportions (see Table 1a) to provide a range of rock recipes. To assess the role of S C fabrics in determining seismic properties, the biotite contents of the C-fabric and S-fabric samples (Table 1b, c) were combined into a single dataset within which the different fabric elements could be distinguished and hence varied in their relative proportions between 0 and 100% (i.e. fabric recipes). Furthermore, it is possible to combine the results of the rock and fabric Fig. 2. Sample of Nanga Parbat gneisses used in EBSD analysis and rock and fabric modelling. All images are XZ planes (X horizontal, Z vertical). (a) Hand-specimen from which the EBSD sample was cut; note C- and S- fabrics. (b) (d) Grey-scale coded EBSD mineral phase images (B, biotite mica; K, orthoclase feldspar; M, muscovite mica; P, plagioclase feldspar ; Q, quartz). (b) Whole sample. (c) C-fabric sample (note horizontal biotite). (d) S-fabric sample (note inclined biotite). axial sub-horizontal shortening; and 2. a gently SSE-dipping foliation formed by strongly localised, top-nnw simple shear (thrusting). These foliations interact to form a tract of gneisses that exhibit both Table 1 EBSD-derived modal proportions (%) of minerals in the Nanga Parbat gneiss sample. The full data are presented as Supplementary Information. Phase (a) Whole sample (b) C-type fabric (c) S-type fabric Quartz Plagioclase Orthoclase Biotite Muscovite 9.6
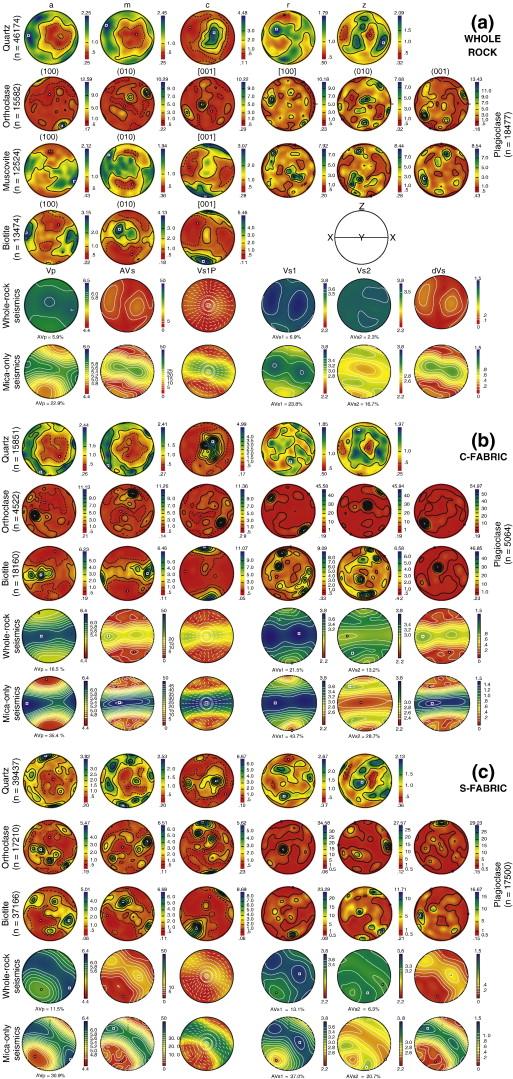
4 G.E. Lloyd et al. / Earth and Planetary Science Letters 288 (2009) recipe analyses to assess the overall control of mineral and fabric contents on seismic properties. 4. Results The conventional displays for CPO and seismic properties are in a reference frame of the strain geometry (i.e. XYZ), with foliation (XY plane) vertical and E W, and lineation E W and horizontal. This convention allows the microstructure to be directly linked to the deformation kinematics, assuming that both the foliation and lineation track the finite strain, especially when the CPO is asymmetric. However, it is more appropriate to consider the seismic properties in terms of geographic coordinates as this provides a direct link to real seismic survey observations. Here CPO is presented initially therefore in XYZ-coordinates (Fig. 3a) but are subsequently rotated into geographic coordinates (Fig. 3b). The outcrop for the sample contains the regional C-foliation (i.e. XY-plane and normal-z) with ~ENE WSW strike and shallow ~SSE dip together with the regional stretching lineation (i.e. X) with shallow plunge towards ~SSE azimuth. The regional foliation normal (i.e. Z) plunges steeply towards the ~NNW, whilst the intermediate axis (Y) is oriented approximately horizontally parallel to the ~ENE WSW strike of this foliation. Knowledge of these orientations permits the rotation of measured CPO into the geographic orientation of the samples. The approach adopted here, particularly when combined with rock and fabric modelling, generates a significant amount of output in the form of stereographic projections. Much of this is available in this paper's Supplementary Information. The results for the actual sample composition (Table 1a) and C:S fabric ratio recipes for 20% modal biotite are presented here (Fig. 3). The latter represents the total mica composition of the rock sample but as the C- and S-fabric samples contain only biotite the muscovite component is considered as biotite to simplify analysis. To emphasise further the significant role of biotite in controlling seismic properties, results are presented also assuming 100% modal biotite (i.e. all other phases absent). The individual CPO diagrams and seismic models for all the constituent minerals other than biotite are reported in the Supplementary Information CPO Biotite exhibits strong but variable CPO patterns. In the whole rock (Fig. 3a), maxima in a and c are inclined to X and Z respectively, with a and b forming a girdle inclined to XY. In the C-fabric (Fig. 3a), a and b form a girdle distribution parallel to XY, with the maximum in c normal to this (i.e. parallel to Z), the maximum in a intermediate between X and Y, and the maximum in b sub-parallel to X. In the S- fabric (Fig. 3a), a and b form a girdle distribution inclined at ~45 to XY, steeper than that observed for the whole sample, with the maxima in a and c intermediate between XZ and the maximum in b intermediate between Y and Z. These relationships suggest that the foliation indicated by the biotite CPO in the whole sample is an average of two individual foliations defined by the (shallower) C- and (steeper) S-fabrics Seismic properties The particular seismic properties derived here are the compressional wave velocity (Vp km/s) and anisotropy (AVp %), shear wave splitting anisotropy (AVs %) and polarisation (or birefringence) of the fastest shear wave (Vs1P). It should be noted that AVp has no azimuthal significance and refers to variations in P-wave velocities over all directions in contrast to AVs, which refers to an individual ray path. Results for fast and slow shear wave velocities (Vs1, Vs2 km/s) and anisotropies (AVs1, AVs2 %) and difference in shear wave splitting (dvs km/s) are presented as Supplementary Information. To enable direct comparison with the CPO, seismic property distributions are represented initially in kinematic coordinates. Table 2 lists their maximum and minimum values for the whole and two sub-fabric samples. As expected, the seismic property distributions reflect the biotite CPO in the three analyses (Fig. 3a). In general, the other mineral phases act simply to dilute the impact of the biotite. In particular, the largest Vp and AVs values mimic the orientation of the biotite foliation, whilst the minimum values are close to the foliation normal. However, the absolute maxima in Vp and AVs are more varied in orientation, both within and between the three analyses. This behaviour reflects the local influence of the C- and S-fabrics and their averaging over the whole sample. In terms of the regional XYZ coordinate system, both the whole sample and the C-fabric have Vpmax sub-parallel to Y but for the S-fabric it is oriented between X and Z (Fig. 3a). In contrast, the maxima in AVs are sub-parallel to Y for the whole sample and the S-fabric but sub-parallel to X for the C-fabric. The polarisation of the fastest shear wave is constrained to be parallel to the dominant foliation in all three samples. The full impact of biotite on the seismic properties of the three samples is emphasised by considering that each sample consists of 100% biotite (Fig. 3a). There is little difference in the geometry of the seismic results for rocks with 20% or 100% biotite, although of course the absolute values of velocity and anisotropy do vary Geographic coordinates The kinematic CPO and seismic property results (Fig. 3a) are rotated in Fig. 3b into geographic coordinates to assess their seismological and geodynamic significance. Although the geographic CPO is unusual in appearance structurally, using this reference frame places it in a regional context that can guide better interpretations of seismic data. Biotite defines the foliation in each sample and both the orientation of the regional foliation and the difference in orientation between the C- and S-fabrics are clear. The fact that the orientations of the regional and C-fabric foliations are similar, whilst the S-fabric foliation is much steeper, suggests that the C-fabric dominates over the S-fabric in the sample considered (see Fig. 3b). However, it is the detail of these patterns, and in particular the positions of the maxima and minima, that are of prime significance seismically. Whilst the minima in both Vp and AVs define the pole to the various foliations, their maxima are oriented closer to the ~ESE WSW strike (i.e. Y) rather than the shallow ~SSE plunging stretching lineation (i.e. X). If representative for these types of lithologies, this result contrasts with the general assumption that Vp and AVs maxima align parallel to the direction of maximum kinematic elongation Rock and fabric recipe modelling The specimen considered here (Fig. 2) represents a sample from a population defined by two simple variables, namely mineral modal content and relative proportion of C- and S-fabrics. The intensity of development of CPO (i.e. a proxy for strain magnitude) can be ignored as the gneisses are all highly deformed and it is assumed therefore that the individual mineral CPO have all reached steady-state and are typical for these rocks. The results of CPO analysis for the whole sample and the two sub-fabric areas (Fig. 3) indicate that it is biotite that controls the seismic properties of the whole rock. Supplementary Information is provided to show in detail how varying biotite content from 0 to 100% whilst the modal content of the other minerals is varied according to their proportions in the actual sample (i.e. rock recipe modelling, see Table 3a) affects the seismic properties. Having recognised that biotite content is the controlling compositional variable, the potential impact of the two biotite sub-fabrics now needs to be considered. Thus, fabric recipes (Table 3b) have been used, whereby the relative proportions of biotite in each C- and S-fabric sub-

5 324 G.E. Lloyd et al. / Earth and Planetary Science Letters 288 (2009)

6 G.E. Lloyd et al. / Earth and Planetary Science Letters 288 (2009) Table 2 Summary of EBSD-derived seismic properties for typical Nanga Parbat gneisses. Seismic property Whole sample C-fabric S-fabric Vp km/s AVp % AVs % Table 3 Basic data used in rock and fabric recipe modelling. The actual sample is represented by 20% total mica content (Fig. 4) while results from this array are presented as Supplementary Information. (a) Rock recipes. (b) Fabric recipes. (a) Mica % Biotite Plagioclase Orthoclase Quartz SUM (b) Biotite C:S % :0 0 20:0 40:0 60:0 80:0 100:0 75: :5 30:10 45:15 60:20 75:25 50: :10 20:20 30:30 40:40 50:50 25:75 0 5:15 10:30 15:45 20:60 25:75 0: :20 0:40 0:60 0:80 0:100 type are varied proportionally between 0 and 100% within the limits provided by the rock recipe modal compositions (Table 3a). The results for the actual sample composition, modelled with a 20% mica fraction that is entirely biotite, are reported in Table 3. The full range of fabric recipe modelling results is provided as Supplementary Information. Whilst the seismic properties for the 20% biotite fabric recipe are similar, they reflect also a migration in orientation of the C- and S- fabrics as their relative proportions change (Fig. 4; see also Fig. 1b). Thus, for C-fabric dominated rocks, the foliation is relatively shallow, ~SSE-dipping and defines a girdle of similar Vp velocities within which the absolute maximum is sub-parallel to the ~WSW ENE strike. In contrast, the foliation for S-fabric dominated rocks is steeper but defines still a girdle of high Vp values within which the absolute maximum is again sub-parallel to the ~WSW ENE strike. In both cases, clear maxima in AVs are defined that plunge sub-parallel to the dip directions of these foliations. As the relative proportions of C- and S-fabrics vary between the two end-member configurations, the girdle in Vp becomes less-well defined and a clear maximum develops parallel to the ~WSW ENE foliation strike. For AVs, discrete high value concentrations develop within the foliation strike-parallel girdle such that the end-member single maxima disappear (Fig. 4). For approximately equal contributions of C- and S-fabrics, a maximum in AVs is defined sub-parallel to the ~WSW ENE foliation strike. In terms of vertically propagating (i.e. teleseismic) rays, there is a progressive change from relatively low Vs1 velocities polarised ~NW SE (i.e. normal to foliation) for 100% C-fabric rocks, to relatively high Vs1 velocities polarised sub-parallel to the foliation (i.e. ~SW NE) for 100% S-fabric rocks (Fig. 4). 5. Discussion The modelled seismic response of the sample of Nanga Parbat gneiss shows that the geometry and intensity of anisotropy relates both to the bulk biotite content and the relative proportions of S and C foliations. Fig. 4. Fabric ratio recipe results for the actual rock composition, assuming biotite comprises the whole mica modal content of 20%. The top two rows are the whole sample and C-fabric sample CPO; the bottom row is the S-fabric sample CPO. The other rows represent the Vp, AVs and polarisation (Vs1P) seismic properties for the whole rock as the S C fabric ratio is progressively varied (as indicated left) between the absolute end members. All plots are lower hemisphere, geographic coordinates. All CPO are contoured in terms of multiples of the uniform distribution (m.u.d.). Seismic properties are contoured as indicated (note, the same contour range has been used for each property to facilitate comparison). The full range of fabric ratio recipe modelling results is provided in Supplementary Information. Fig. 3. EBSD-derived biotite CPO and seismic properties in (a) kinematic (XYZ) and (b) geographic (NSEW) coordinates, assuming as-measured mineral modal proportions, where biotite comprises 20% mica content (see Supplementary Information for CPO of other minerals). Also shown for comparison are the seismic properties assuming 100% biotite composition. All stereographic projections are lower hemisphere. All CPO are contoured in terms of multiples of the uniform distribution (m.u.d.). Seismic properties are contoured as indicated (note, the same contour range has been used for each property to facilitate comparison).
 320 328 These two controls have been investigated using rock and fabric recipes, reproduced in full within the Supplementary Information.")
7 326 G.E. Lloyd et al. / Earth and Planetary Science Letters 288 (2009) These two controls have been investigated using rock and fabric recipes, reproduced in full within the Supplementary Information. Here, discussion is served by considering shear wave behaviour alone. Fig. 5 shows how both the intensity and geometry of seismic anisotropy relate to biotite content and relative proportions of S and C fabrics (see also Fig. 1b). The maximum magnitude of AVs (i.e. the
8 G.E. Lloyd et al. / Earth and Planetary Science Letters 288 (2009) amount of shear wave splitting for a unit thickness of gneiss through which the shear waves are propagating) increases with biotite content and towards the end members of both fabric types. The effect of composite foliations (i.e. S C fabric as opposed to 100% S or 100% C) is to weaken the magnitude of AVs. Thus, tracts of single schistosity generate stronger maximum anisotropy than rocks with multiple schistosities. This result confirms the direct acoustic measurements of similar Nanga Parbat gneisses with different internal foliation structures reported by Meltzer and Christensen (2001; see also Okaya and Christensen, 2002, for the general impact of mica foliation on seismic wave propagation). Many seismic experiments either are not configured or the results are not reported to define maximum values of shear wave anisotropy for the crust. Some specially designed near-vertical and wide-angle seismic experiments put constraints on crustal anisotropy (e.g. Meissner et al., 2002; Readman et al., 2009). Recently, near-vertical teleseismic P-wave arrivals, which produce converted S-waves at the Moho and crustal interfaces, have been used to detect azimuthal anisotropy at various depths in the crust using receiver function analysis (e.g. Vergne et al., 2003; Ozacar and Zandt, 2004; Sherrington et al., 2004; Schulte-Pelkum et al., 2005). Anisotropy is illustrated in terms of the orientation of maximum polarisation in the plane of the Earth's surface, and the intensity of this anisotropy in terms of split times for the fast and slow shear waves. The model results from the sample considered in this contribution are presented in similar fashion, overlain on the matrix of biotite content vs. S C fabric ratio, in geographical coordinates (Fig. 5). The actual regional orientations of S (strike, dip) and C (strike, dip) foliations are explicitly included. Not only does the intensity of the seismic anisotropy deviate significantly from the maximum values, but there is a variation in the orientation of maximum polarisation too. This orientation variation is not a reflection of different kinematics (specifically, shortening directions) but reflects the differing distributions of mica in the rock (namely, the varying proportions of S and C fabrics). The results of the modelling, as summarised for AVs in Fig. 5, raise issues in the interpretation of seismic anisotropy results. For example, P and S wave anisotropy derived from seismic receiver functions is interpreted by Ozacar and Zandt (2004) as being due to depth variations in the intensity and orientation of seismic anisotropy in the crust, which they explain via a three-layered structural model. However, these authors assume that the seismic properties relate to a single, presumed mica-defined foliation within each layer. An alternative explanation, yet to be tested, is that the deformation kinematics do not vary with depth. Rather, there is depth-dependent partitioning of the deformation into composite, multiple foliations and/or differing mineralogy (i.e. mica, or even amphibole, content), which need not require the intra-crustal decoupling of deformation. Similarly, azimuthal variations in SKS anisotropy obtained from the INDEPTH III seismic profile (e.g. Huang et al., 2000) need not relate simply to variations in flow patterns in the lithosphere but indicate a significant crustal contribution to the overall anisotropy. Godfrey et al. (2000) have suggested that steeply dipping schists in the crust could contribute up to 45% of the SKS anisotropy, whilst Bank and Bostock (2003) found lower crustal S wave anisotropy of 3 7% in Archean and Proterozoic regions of the Canadian shield using forward modelling of P to SV and SH conversions. Schulte-Pelkum et al. (2005) used teleseismic receiver functions to define a narrow tract in the mid-crust beneath the central Himalaya with AVp of ~20%. These authors suggest that this inclined zone, which projects up to the active Himalayan thrust front, reflects aligned mica foliations within a ductile shear zone. However, the slow wave direction is gently inclined in the direction of thrusting, implying that the foliation within the shear zone is generally steep. Both Schulte-Pelkum et al. (2005) and Mahan (2006) suggest that this is due to a strong S C fabric (e.g. Fig. 1b). The modelling results presented here require shear zone rocks with biotite contents in excess of 50% and equally proportioned S C fabrics to achieve the observed 20% in AVp. Such biotite contents are more consistent with slates than normal felsic rocks. Furthermore, given the probable dimensions and shear strain of this ductile shear zone (e.g. Mahan, 2006), any steep S-fabric that might have developed initially at lower shear strains would have rotated in to sub-parallelism with the dominant C-fabric oriented approximately parallel to the shallowly dipping shear zone margins. Thus, Schulte-Pelkum et al.'s (2005) results are more consistent with a single, steep foliation (e.g. as found in slate belts). A future test therefore would be to use shear wave anisotropy to look for the patterns of polarisation derived via rock and fabric recipe modelling of the sample of Nanga Parbat gneisses described here. 6. Conclusions The results obtained in this study suggest that if the middle continental crust is dominated by felsic/granitic compositions, then mica is the dominant contributor to the generation of seismic anisotropy. This study confirms the empirical results of Meltzer and Christensen (2001) that rocks with single foliations show stronger absolute seismic anisotropy than those with multiple foliations. For example, the sample considered here, with ~20% biotite by volume, exhibits a maximum of ~16% compressional wave anisotropy (AVp) for single foliation (C-plane only) domains compared with a value of ~6% for equi-proportional S- and C-fabric domains. The shear wave splitting anisotropy (AVs) is ~24% for single C-domains but only ~7% for composite (S C) fabrics. However, the effect of composite fabrics is not merely to dilute the maximum values of seismic anisotropy, it influences also the geometry. Shear wave anisotropy is particularly sensitive to this effect and can generate orientations of the maxima in predicted polarisation direction that diverge substantially from the trajectories of principal strain axes or kinematic flow lines. Measurements of seismic anisotropy in nature necessarily integrate the effects of the concentration of mica in the rock, together with the organisation of mica into single or multiple foliations and theorientation of these foliations relative to the seismic ray paths. Thus, variations in the orientations of fast polarisation directions for shear waves deduced for different levels in the continental lithosphere need not imply that deformation decouples with depth. Acknowledgements Fieldwork in Pakistan was funded by the Royal Society. C. Bond, R. Jones, P. McDade and Z. Shipton are thanked for discussions in the field, together with the University of Peshawar for logistical support and advice. The Leeds EBSD system was funded by UK NERC Grant GR9/3223 (GEL, MC). This research was first presented at the Fall Meeting of the American Geophysical Union in 2005; we thank participants for useful discussions. We thank also the Journal's referees, Luigi Burlini, Mike Kendall and anonymous, and editor, Rob van der Hilst, for their constructive reviews and assistance that together helped to improve the final version. Fig. 5. Summary and implications of rock and fabric recipes modelling for seismic anisotropy interpretation (AVs). Background colour-coding reflects the predicted AVs values. Circles define the geographic coordinate system and regional orientation of the principal tectonic axes (XYZ). Thin diameter lines indicate the orientation of the fast polarisation direction (FPD) for vertical (teleseismic) waves, with the length representing the maximum AVs value predicted at that point, as defined by the colour contour beneath. Length of the thicker, white-boxed line represents the proportion of the maximum AVs recognised at each modelling point by teleseismic waves. Block diagrams are schematic representations of rocks with different S C fabric ratios (see horizontal axis), oriented according to the sample used in the modelling. The blocks can be considered also in terms of progressive deformation (e.g. shear zone evolution) during which S-type fabrics initiate at high angles to C-type fabrics and progressively rotate towards them with increasing strain, eventually contributing to the total C-fabric component rather than defining distinct multiple S C fabrics.
9 328 G.E. Lloyd et al. / Earth and Planetary Science Letters 288 (2009) Appendix A. Supplementary data Supplementary data associated with this article can be found, in the online version, at doi: /j.epsl References Aleksandrov, K.S., Ryzhova, T.V., The elastic properties of rock-forming minerals, I: pyroxenes and amphiboles. Izv. Acad. Sci. USSR, Geophys. Ser. 9, (in Russian). Aleksandrov, K.S., Alchikov, V.V., Belikov, B.P., Zaslavskii, B.I., Krupnyi, A.I., Velocities of elastic waves in minerals at atmospheric pressure and increasing of precision of elastic constants by means of EVM. Izv. Acad. Sci. USSR, Geophys. Ser. 10, (in Russian). Babuska, V., Cara, M., Seismic Anisotropy in the Earth. Kluwer Academic, Dordrecht. Bank, C.-G., Bostock, M.G., Linearized inverse scattering of teleseismic waves for anisotropic crust and mantle structure: 2. Numerical examples and application to data from Canadian stations. J. Geophys. Res. 108 (B5), doi: / 2002JB Barberini, V., Burlini, L., Zappone, A., Elastic properties, fabric and seismic anisotropy of amphibolites and their contribution to the lower crust reflectivity. Tectonophysics 445, Ben Ismail, W., Mainprice, D., An olivine fabric database: an overview of upper mantle fabrics and seismic anisotropy. Tectonophysics 296, Barruol, G., Mainprice, D., D seismic velocities calculated from lattice-preferred orientation and reflectivity of a lower crustal section: examples of the Val Sesia section (Ivrea zone, northern Italy). Geophys. J. Int. 115, Berthé, D., Choukroune, P., Gapais, D., Orientations préférentielles du quartz et orthogneissification progressive en régime cisaillant: l'exemple du cisaillement sud-armoricain. Bull. Min. 102, Brocher, T.M., Christensen, N.I., Seismic anisotropy due to preferred mineral orientations observed in shallow crustal rocks in southern Alaska. Geology 18, Burlini, L., A model for the calculation of the seismic properties of geologic units. Surv. Geophys. 15, Burlini, L., Fountain, D.M., Seismic anisotropy of metapelites from the Ivrea-Verbano zone and Serie dei Laghi (northern Italy). Phys. Earth Planet. Inter. 78, Butler, R.W.H., Casey, M., Lloyd, G.E., Bond, C.E., McDade, P., Shipton, Z., Jones, R., Vertical stretching and crustal thickening at Nanga Parbat, Pakistan Himalaya: a model for distributed continental deformation during mountain building. Tectonics 21. doi: /2001tc Champion, M.E., White, N.J., Jones, S.M., Priestley, K.F., Crustal velocity structure of the British Isles; a comparison of receiver functions and wide-angle seismic data. Geophys. J. Int. 166, Cholach, P.Y., Schmitt, D.R., Intrinsic elasticity of a textured transversely isotropic muscovite aggregate: comparisons to the seismic anisotropy of schists and shales. J. Geophys. Res. 111, B doi: /2005jb Crampin, S., Chastin, S., A review of shear wave splitting in the crack-critical crust. Geophys. J. Int. 155, Crosson, R.S., Lin, J.W., Voigt and Reuss prediction of anisotropic elasticity of dunite. J. Geophys. Res. 76, Godfrey, N.J., Christensen, N.I., Okaya, D.A., Anisotropy of schists: contribution of crustal anisotropy to active source seismic experiments and shear wave splitting observations. J. Geophys. Res. 105, Hall, S.A., Kendall, J.-M., Maddock, J., Fisher, Q., Crack density tensor inversion for analysis of changes in rock frame architecture. Geophys. J. Int. 173, Huang, W.C., Ni, J.F., Tilmann, F., Nelson, D., Guo, J.R., Zhao, W.J., Mechie, J., Kind, R., Saul, J., Rapine, R., Hearn, T.M., Seismic polarization anisotropy beneath the central Tibetan Plateau. J. Geophys. Res. 105, Ji, S., Wang, Q., Xia, B., Handbook of Seismic Properties of Minerals, Rocks and Ores. Polytechnic International Press, Canada. Kern, H., Wenk, H.-R., Fabric-related velocity anisotropy and shear wave splitting in rocks from Santa Rosa Mylonite Zone, California. J. Geophys. Res. 95 (B7), 11,213 11,223. Kitamura, K., Constraint of lattice-preferred orientation (LPO) on Vp anisotropy of amphibole-rich rocks. Geophys. J. Int. 165, Lister, G.S., Snoke, A.W., S-C mylonites. J. Struct. Geol. 6, Lloyd, G.E., Kendall, J-M., Petrofabric derived seismic properties of a mylonitic quartz simple shear zone: implications for seismic reflection profiling. In: Harvey, P.K., Brewer, T., Pezard, P.A., Petrov, V.A. (Eds.), Petrophysical Properties of Crystalline Rocks: Sp. Publ. Geol. Soc. Lond., vol. 240, pp Mahan, K., Retrograde mica in deep crustal granulites: Implications for crustal seismic anisotropy. Geophys. Res. Lett. 33, L doi: /2006gl Mainprice, D., An efficient Fortran program to calculate seismic anisotropy from the lattice preferred orientation of minerals. Comput. Geosci. 16, Mainprice, D., In: Schubert, G. (Ed.), Seismic anisotropy of the deep Earth from a mineral and rock physics perspective. Treatise in Geophysics, vol. 2. Elsevier, Oxford, pp Mainprice, D., Nicolas, A., Development of shape and lattice preferred orientations - application to the seismic anisotropy of the lower crust. Journal of Structural Geology 11, Mainprice, D., Humbert, M., Methods of calculating petrophysical properties from lattice preferred orientation data. Surv. Geophys. 15, Mainprice, D., Silver, P., Constraints on the interpretation of teleseismic SKS observations from kimberlite nodules from the subcontinental mantle. Phys. Earth Planet. Inter. 78, McSkimin, H.J., Andreatch Jr., P., Thurston, R.N., Elastic moduli of quartz versus hydrostatic pressure at 25 C and C. J. Appl. Phys. 36, Meissner, R., Mooney, W.D., Artemieva, I., Seismic anisotropy and mantle creep in young orogens. Geophys. J. Int. 149, Meissner, R., Rabbel, W., Kern, H., Seismic lamination and anisotropy of the lower continental crust. Tectonophysics 416, Meltzer, A., Christensen, N., Nanga Parbat crustal anisotropy: implications for interpretation of crustal velocity structure and shear-wave splitting. Geophys. Res. Lett. 28 (28), Nishizawa, O., Yoshino, T., Seismic velocity anisotropy in mica rich rocks: an inclusion model. Geophys. J. Int. 145, Okaya, D.A., Christensen, N.I., Anisotropic effects of non-axial seismic wave propagation in foliated crustal rocks. Geophys. Res. Lett. 29. doi: / 2001GL Ozacar, A.A., Zandt, G., Crustal seismic anisotropy in central Tibet: implications for deformation style and flow in the crust. Geophys. Res. Lett. 31, L doi: /2004gl Readman, P.W., Hauser, F., O'Reilly, B.M., Do, V.C., Crustal anisotropy in southwest Ireland from analysis of controlled source shear-wave data. Tectonophysics 474, Rudnick, R.L., Fountain, D.M., Nature and composition of the continental crust a lower crustal perspective. Rev. Geophys. 33, Savage, M.K., Seismic anisotropy and mantle deformation: what have we learned from shear wave splitting? Rev. Geophys. 37, Schulte-Pelkum, V., Monsalve, G., Sheehan, A., Pandey, M.R., Sapkota, S., Bilham, R., Wu, F., Imaging the Indian subcontinent beneath the Himalaya. Nature 435, Shapiro, N.M., Ritzwoller, M.H., Molnar, P., Levin, V., Thinning and flow of Tibetan crust constrained by seismic anisotropy. Science 305, 233. Sherrington, H.F., Zandt, G., Fredriksen, A., Crustal fabric in the Tibetan Plateau based on waveform inversions for seismic anisotropy parameters. J. Geophys. Res. 109, B doi: /2002jb Silver, P.G., Seismic anisotropy beneath the continents: probing the depths of geology. Annu. Rev. Earth Planet. Sci. 24, Tatham, D.J., Lloyd, G.E., Butler, R.W.H., Casey, M., Amphibole and lower crustal seismic properties. Earth Planet. Sci. Lett. 267, Valcke, S.L.A., Casey, M., Lloyd, G.E., Kendall, J.-M., Fisher, Q.J., Lattice preferred orientation and seismic anisotropy in sedimentary rocks. Geophys. J. Int. 166, Vaughan, M.T., Guggenheim, S., Elasticity of muscovite and its relationship to crystal structure. J. Geophys. Res. 91, Vergne, J., Wittlinger, G., Farra, V., Su, H., Evidence for upper crustal anisotropy in the Songpan-Ganze (northeastern Tibet) terrane. Geophys. Res. Lett. 30 (6 1), 4. Weiss, T., Siegesmund, S., Rabbel, W., Bohlen, T., Pohl, M., Seismic velocities and anisotropy of the lower continental crust: a review. Pure Appl. Geophys. 156, Wendt, A.S., Bayuk, I.O., Covey-Crump, S.J., Wirth, R., Lloyd, G.E., An experimental and numerical study of the microstructural parameters contributing to the seismic anisotropy of rocks. J. Geophys. Res. 108 (B8), doi: /2002jb Xu, L.L., Rondenay, S., van der Hilst, R.D., Structure of the crust beneath the southeastern Tibetan Plateau from teleseismic receiver functions. Phys. Earth Planet. In. 165, Zeitler, P.K., Chamberlain, C.P., Smith, H.A., Synchronous anatexis, metamorphism, and rapid denudation at Nanga Parbat, Pakistan Himalaya. Geology 21, Zeitler, P.K., Meltzer, A.S., Koons, P.O., Craw, D., Hallet, B., Chamberlain, C.P., Kidd, W.S., Park, S.K., Seeber, L., Bishop, M., Shroder, J., Erosion, Himalayan geodynamics and the geomorphology of metamorphism. GSA Today 11, 4 8.
10 SUPPLEMENTARY INFORMATION S1. SEM EBSD analysis EBSD analyses were performed at the University of Leeds on a CamScan Series 4MDV SEM using the HKL Technology Channel5 automated analytical system, incorporating a Hammamatsu CCD analogue camera, and associated software. Operating conditions were: accelerating voltage, 20keV; working distance, 45mm; tilt angle, 75 ; and specimen current, 20-30nA. An XZ parallel sample was used, with X horizontal and Z vertical in the image. Figure S1a illustrates the basic principals of EBSD analysis utilised here. Individual EBSD patterns are automatically snapped by the Channel5 hardware as the SEM electron beam traverses across the sample in a pre-defined x-y grid and set step between data acquisition points. Next, the Channel5 software recognises individual diffraction bands in the EBSD pattern and utilises a pre-defined crystallographic database to identify the particular mineral phase and unique crystallographic orientation represented by each pattern. The patterns shown in Fig. S1a were obtained from biotites defining the C- and S- type fabrics, as well as from a curved biotite that linked these two fabric elements. All patterns include the biotite basal crystallographic plane, as defined by (hk0) Miller indices. The basal plane rotates from the C-fabric position, through the intermediary fabric position to the S- type fabric position, mimicking the change in foliation orientation between the C- and S- fabrics. EBSD analysis is capable of providing a number of simulated images of the sample based on various properties implicit in the definition of each mineral phase considered (i.e. specifically the crystallography and composition). The following were utilised in this study (Fig. S1b-d). (1) Raw acquisition data, colour-coded according to the combined values of the three Euler angles used to define the unique crystallographic orientation of each EBSD analytical point. (2) Image processed acquisition data, involving the removal of individual points ( spikes ) different from there immediate neighbours and three extrapolations of the remaining data points to remove noise ; these images are colour-coded also according to the combined values of the three Euler angles. (3) Grey-scale coded band contrast images based on the quality of the EBSD pattern at each acquisition point. (4) Mineral phase identification at each EBSD acquisition point.
11 S1.1 Measurement of S-C fabrics Both the C- and S- fabrics are defined predominantly by biotite, with the former oriented parallel to the macroscopic XY plane and the latter oriented considerably steeper but somewhat variable in inclination (e.g. Fig. S1b). Thus, the two fabrics form distinctive and separate elements in the microstructure that can be analysed via EBSD (Fig. S1). However, in order to examine the impact of different mica (biotite) fabrics (see below) it is necessary to distinguish the C-fabric related EBSD patterns from the S-fabric related EBSD patterns. This requires that the mineral phase identification numbers used for C-fabric and S-fabric biotites in the EBSD analyses are different (n.b. the mineral phase identification numbers for quartz, plagioclase and orthoclase remain the same as their impact for each fabric type is not under investigation). Three specific EBSD analyses were performed therefore to characterise the S C fabrics: (1) the whole sample (Fig. S1b); (2) a region comprising only the C-type fabric (Fig. S1c); and (3) a region comprising only the S- type fabric (Fig. S1d). In the C-type fabric analysis, the following mineral phase identification numbers were defined: 1. biotite; 2. quartz; 3. plagioclase; and 4. orthoclase (n.b. no muscovite was present). In contrast, in the S-type fabric analysis, the mineral phase identification numbers were defined by: 1. copper; 2. quartz; 3. plagioclase; 4. orthoclase; and 5. biotite (n.b. muscovite was again absent). As there were obviously no results expected for copper, this procedure meant that the S-type fabric EBSD analysis had no mineral phase identification number solutions equal to 1. Consequently, when the Channel5 data files for the C- and S- type fabrics analyses were combined the mineral phase identification numbers were defined as follows: 1. biotite (C-fabric); 2. quartz; 3. plagioclase; 4. orthoclase; and 5. biotite (Sfabric). The relative modal proportions of each phase/fabric type could then be independently defined during the subsequent derivation of the seismic properties (see below). S1.2 CPO: kinematic coordinates Figure S2 details the EBSD-derived CPO figures for all minerals in each analysis in kinematic coordinates (XYZ), contoured using the program Pfch5 (Mainprice, 1990). The CPO of quartz, plagioclase and orthoclase in all analyses are weak and/or indistinct. Quartz exhibits dispersed c-axis maxima sub-parallel to Y, typical of amphibolite facies deformation. The a-axes and m-directions form girdle distributions
12 close to the XZ plane. However, the positions of any maxima in either a or m vary between areas. For the whole sample (Fig. S1b), there is a (weak) a-axis maximum close to X, with the maximum in m oriented at ~30 to X within the XZ plane, which is the reverse of the usually observed relationship. In both the C- and S- fabrics (Fig. S1c, d), the maxima in a and m are sub-parallel to Z and intermediate between X and Z respectively. The plagioclase and orthoclase CPO probably reflect the effect of (few) porphyroclast grain orientations. In contrast to the other minerals, biotite exhibits strong but variable CPO patterns. In the whole rock analysis (Fig. S1b), the maxima in a and c are inclined to X and Z respectively, with a and b forming a girdle inclined to XY. In the C-fabric analysis (Fig. S1c), a and b form a girdle distribution parallel to XY, with the maximum in c normal to this (i.e. parallel to Z), the maximum in a intermediate between X and Y and the maximum in b sub-parallel to X. In the S- fabric analysis (Fig. S1d), a and b form a girdle distribution inclined at ~45 to XY, steeper than that observed for the whole sample, with the maxima in a and c intermediate between XZ and the maximum in b intermediate between Y and Z. These relationships suggest that the foliation indicated by the biotite CPO in the whole sample is the average of the two individual foliations defined by the (shallower) C- and (steeper) S- fabrics. S1.3 CPO: geographical coordinates Figure S3 details the equivalent EBSD-derived CPO figures for all minerals in each analysis rotated into geographic coordinates (XYZ) using the program Rotctf2 and contoured using the program Pfch5 (Mainprice, 1990). The rotation necessary is determined by recognising that the local foliation (i.e. XY plane) in the field strikes ~ENE-WSW and dips shallowly towards the SSE and contains a stretching lineation (i.e. X) that plunges shallowly also towards the SSE (i.e. Z plunges steeply towards the NNW). Although in principal only a single rotation about a unique axis is required to rotate from kinematic into geographic coordinates, in practice three individual rotations are involved, adopting the sign conventions defined in Rotctf2, as follows: rotation about a plunge of 0 and an azimuth of 090 ; rotation about a plunge of 90 and an azimuth of 000 ; and rotation about a plunge of 0 and an azimuth of The rotated CPO are unusual in appearance (Fig. S3) but it is these patterns that define actual seismic observations. Quartz c-axes define distinct E-W oriented point
13 maxima in each sample analysis (Fig. S1b-d), with both a-axes and m-poles defining vertical girdles oriented N-S. The high densities in the plagioclase and orthoclase CPO probably reflect the influence of (few) porphyroclast grain orientations. In contrast, the micas, especially biotite (n.b. muscovite is absent in the C- and S- fabric analyses), clearly define the principal foliation plane. In both the whole sample (Fig. S1b) and C-fabric (Fig. S1c) analyses this foliation is shallow SSE-dipping and strikes ENE-WSW but in the S-fabric sample (Fig. S1d) it dips more steeply towards the SSE with a similar strike. S2. Petrofabric-derived seismic properties The seismic properties of each analytical sample (Fig. S1b-d) were determined from the EBSD-measured CPO of each mineral in geographic coordinates (Fig. S3) via standard procedure (e.g. Mainprice & Humbert, 1994; Ben Ismail & Mainprice, 1998; Lloyd & Kendall, 2005) using the programs AnisCh5 and VpG. (Mainprice, 1990). This approach requires the elastic stiffness constants (i.e. C ij matrix) and density for each mineral concerned. Such data are usually determined by measuring the ultrasonic velocities of single crystals in different directions and deriving the elasticity tensor via the Cristoffel equation (e.g. McSkimin et al. 1965), although a more recent approach uses Brillioun scattering and is more accurate (e.g. Sinogeikin & Bass 2000). Unfortunately, relevant data for many minerals are still lacking, although the situation is rapidly improving (e.g. Ji et al. 2002). Furthermore, single crystal elastic properties vary with pressure (P) and temperature (T) but the PTderivative values also are often unavailable. Following the current convention established for mantle minerals (e.g. Mainprice et al. 2000), we assume the elastic parameters determined under ambient conditions. The specific elastic stiffness constants used here were obtained from: quartz (McSkimin et al., 1965); plagioclase (Aleksandrov et al., 1974); orthoclase (Aleksandrov et al., 1974); biotite (Aleksandrov & Ryzhova, 1961); and muscovite (Vaughan & Guggenheim, 1986). The specific seismic properties derived are as follows: compressional (Vp km/s) and shear waves velocities (Vs1 and Vs2 km/s respectively), polarisation (or birefringence) of the fastest shear wave (Vs1P), compressional (AVp %) and shear (AVs %) waves anisotropies and the difference in shear waves velocities (dvs km/s). The latter is equivalent to AVs. In general, the seismic property distributions reflect the mica/biotite CPO, and
14 hence the orientation of the principal foliation plane, in the three analyses with the other minerals tending only to dilute the impact of the mica/biotite (Figs. S2 and S3). However, whilst the minima in both Vp and AVs define typically the poles to these foliations, their maxima are oriented closer to the ESE-WSW foliation strikes (i.e. Y) rather than the SSE plunging stretching lineations (i.e. X) in geographic coordinates. Such behaviour is not expected from current knowledge and if representative for these types of lithologies must pose serious implications for seismic and hence geodynamic interpretations. This observation introduces the concept and potential significance of rock and fabric recipes modelling. S3. Rock and fabric recipes modelling results To assess the role of biotite in determining seismic properties, the modal content of biotite in the whole sample analysis is varied between 0 and 100% whilst the other phases are varied according to their as-measured proportions (i.e. rock recipes). To assess the role of S-C fabrics in determining seismic properties, the biotite contents of the C-fabric and S-fabric samples are combined in to a single dataset (see Fig. S4) within which the different fabric elements can be distinguished and hence varied in their relative proportions between 0 and 100% (i.e. fabric recipes). Although we concentrated on a biotite composition of 20%, equivalent to that in the actual sample investigated (Fig. S4), a complete set of seismic properties for these rock and fabric recipes results was generated and is presented in Fig. S5. The results shown in Fig. S5, although comprehensive and indicative of the three dimensional geographical orientation predicted for the seismic properties as the rock and fabric recipes are varied, are nevertheless difficult to assess and relate as presented. Consequently, these results have been summarised by plotting the maximum and minimum values of each of the seismic properties as contoured threedimensional surfaces (Fig. S6). The salient aspects are as follows. Increasing biotite content: 1. has little overall impact on Vp-max but decreases Vpmin; 2. decreases both Vs1-max/min and Vs2-max/min; 3. increases dvs; and 4. increases significantly both AVp and AVs (with concomitant increases in both AVs1 and, to a lesser extent, AVs2 also). The impacts on the velocity behaviours reflect presumably the progressive removal of plagioclase in particular from the rock recipe with increasing biotite content. In contrast, increasing the proportion of mixed-mode fabrics away from either end-
15 member configuration: 1. has little effective impact on any of the seismic velocity components; but 2. causes significant reduction in AVs (involving reduction in both AVs1 and AVs2), although AVp exhibits only slight reduction. Figure captions for supplementary information

16
17 Figure S1. EBSD analysis images of Nanga Parbat gneisses for each fabric sample. (a) Basic principals of EBSD analysis see text for discussion. (b) Whole sample. (c) C-fabric sample (note horizontal biotite defining the C-fabric). (d) S-fabric (note, inclined biotite defining the S-fabric). For (b) to (d): 1. raw acquisition data, colourcoded according to the combined values of the three Euler angles; 2. image processed acquisition data (one spike removal and three extrapolations), colourcoded according to the combined values of the three Euler angles; 3. band contrast, grey-scale coded according to the quality of the EBSD pattern at each acquisition point; and 4. mineral phases (red, quartz; dark and light blue, plagioclase and orthoclase feldspars; green, biotite mica; yellow, muscovite mica). All are XZ samples, with X horizontal and Z vertical.
18
19 Figure S2. EBSD-derived CPO and seismic properties for Nanga Parbat gneisses. All figures are lower hemisphere plots (except plagioclase, which is both lower and upper due to its triclinic crystal symmetry) and oriented in tectonic coordinates, as indicated. CPO are contoured in multiples of uniform (random) distribution). Seismic properties are contoured as indicated, using the same scale throughout for each property; note how mica CPO control the seismic properties. (a) Whole sample analysis (see Fig. S1a). (b) C-fabric sample analysis (see Fig. S1b). (c) S-fabric sample analysis (see Fig. S1c).

20
.")
21 Figure 3. EBSD-derived CPO and seismic properties for Nanga Parbat gneisses rotated in to geographic coordinates (N-S-E-W). All figures are lower hemisphere plots (except plagioclase, which is both lower and upper due to its triclinic crystal symmetry). CPO are contoured in multiples of uniform (random) distribution); seismic properties are contoured as indicated, using the same scales throughout. Note that micas, especially biotite, define a shallow SSE dipping foliation and clearly control the rock seismic properties, although whilst the minima in both Vp and AVs define the pole to this foliation the maxima in both are oriented closer to the ESE-WSW strike (i.e. Y) rather than the shallow SSE plunging stretching lineation (X). (a) Whole sample analysis (see Fig. S1a). (b) C-fabric sample analysis (see Fig. S1b). (c) S- fabric sample analysis (see Fig. S1c).

22 Figure 4. CPO for the combined C- and S- fabrics EBSD-derived orientation data, presented in a geographical coordinate reference frame (note, the two biotite fabrics have not been combined as they are compared in the rock and fabric ratio recipes modelling (see Fig. S5). Also shown are the seismic properties predicted for 20% biotite content and varying C:S fabric ratio (0-100%). All figures are lower hemisphere plots (except plagioclase, which is both lower and upper due to its triclinic crystal symmetry). CPO are contoured in multiples of the uniform (random) distribution); seismic properties are contoured as indicated, using the same scales throughout.
23 Figure 5. The complete set of seismic properties variations in geographical coordinates for the rock (i.e. biotite modal content) and fabric (i.e. relative proportions of C- and S- fabrics) recipes results generated in this study. Biotite content is varied from 0% to 100% in steps of 20%, whilst the C:S fabric ratio is varied from 0% to 100% in steps of 25%. All figures are lower hemisphere. Contours are as indicated but note that the same scale has been used throughout for the velocities and anisotropies respectively (Vp, compressional wave velocity; AVs, shear wave splitting anisotropy; Vs1P, polarisation of the fast shear wave; Vs1 and Vs2, fast and slow shear wave velocities respectively; dvs, difference in shear wave velocities, equivalent to AVs).

24 Figure 6a. Summary of the rock and fabric ratio recipes modelling results in terms of three-dimensional surface plots of the maximum and minimum in each of seismic velocity measurements (km/s). Contours as indicated for each plot. See text for discussion.

25 Figure 6b. Summary of the rock and fabric ratio recipes modelling results in terms of three-dimensional surface plots of the maximum and minimum in each of seismic anisotropy measurements (%). Contours as indicated for each plot. See text for discussion. Reference Aleksandrov, K.S., Alchikov, V.V., Belikov, B.P., Zaslavskii, B.I., Krupnyi, A.I., Velocities of elastic waves in minerals at atmospheric pressure and increasing of precision of elastic constants by means of EVM. Izv. Acad. Sci. USSR, Geophys. Ser. 10, (in Russian). Aleksandrov, K.S., Ryzhova, T.V., The elastic properties of rock-forming minerals, I: pyroxenes and amphiboles. Izv. Acad. Sci. USSR, Geophys. Ser. 9, (in Russian). Ben Ismail, W., Mainprice, D., An olivine fabric database: an overview of upper mantle fabrics and seismic anisotropy. Tectonophysics 296, Ji, S., Wang, Q., Xia, B., Handbook of Seismic Properties of Minerals, Rocks and Ores. Polytechnic International Press, Canada.
From crystal to crustal: petrofabric-derived seismic modelling of regional tectonics
 From crystal to crustal: petrofabric-derived seismic modelling of regional tectonics G. E. LLOYD 1 *, J. M. HALLIDAY 1, R. W. H. BUTLER 2, M. CASEY 1, J.-M. KENDALL 3, J. WOOKEY 3 & D. MAINPRICE 4 1 Institute
Institute de Physique du Globe, Paris, France. Summary
 Laboratory determination of velocity anisotropy Jason Z. Han, Douglas R. Schmitt, Daniel Collis a, and Javier Escartin b a Institute for Geophysical Research, Department of Physics, University of Alberta,
a) b) t h d e 40 N 20 N 60 E 80 E 100 E 60 E 80 E 100 E avearge number of paths in a 2 o x2 o cell
 b) t h d e 40 N 20 N 60 E 80 E 100 E 60 E 80 E 100 E avearge number of paths in a 2 o x2 o cell") Supporting Online Material Thinning and ow of Tibetan crust constrained by seismic anisotropy Nikolai M. Shapiro, Michael H. Ritzwoller, Peter Molnar 2, and Vadim Levin 3 Department ofphysics, University
Supporting Online Material Thinning and ow of Tibetan crust constrained by seismic anisotropy Nikolai M. Shapiro, Michael H. Ritzwoller, Peter Molnar 2, and Vadim Levin 3 Department ofphysics, University
Textures in experimentally deformed olivine aggregates: the effects of added water and melt.
 Textures in experimentally deformed olivine aggregates: the effects of added water and melt. F. Heidelbach 1, a, B. Holtzman 2, b, S. Hier-Majumder 2, c and D. Kohlstedt 2, d 1 Bayerisches Geoinstitut,
Geophysical Journal International
 Geophysical Journal International Gephys. J. Int. (2013) 193, 338 348 doi: 10.1093/gji/ggs108 Seismic anisotropy in the continental crust of northwestern Canada Colleen A. Dalton 1 and James B. Gaherty
Seismic Anisotropy and Mantle Flow in the Izu-Bonin-Mariana Subduction System
 Seismic Anisotropy and Mantle Flow in the Izu-Bonin-Mariana Subduction System Matthew J. Fouch (Department of Geological Sciences, Arizona State University, Tempe, AZ 85287, email: fouch@asu.edu) INTRODUCTION
Q. WANG, Q-K. XIA, S. Y. O REILLY, W. L. GRIFFIN, E. E. BEYER AND H. K. BRUECKNER
 Pressure- and stress-induced fabric transition in olivine from peridotites in the Western Gneiss Region (Norway): implications for mantle seismic anisotropy Q. WANG, Q-K. XIA, S. Y. O REILLY, W. L. GRIFFIN,
Lecture 9 faults, folds and mountain building
 Lecture 9 faults, folds and mountain building Rock deformation Deformation = all changes in size, shape, orientation, or position of a rock mass Structural geology is the study of rock deformation Deformation
Auxiliary Material. Subduction of oceanic asthenosphere: evidence from sub-slab seismic anisotropy. Teh-Ru Alex Song, Hitoshi Kawakatsu
 Auxiliary Material Subduction of oceanic asthenosphere: evidence from sub-slab seismic anisotropy Teh-Ru Alex Song, Hitoshi Kawakatsu correspondence to: tehrusong@gmail.com 1 1. The effect of anisotropy
Understanding Earth Fifth Edition
 Understanding Earth Fifth Edition Grotzinger Jordan Press Siever Chapter 6: METAMORPHISM Modification of Rocks by Temperature and Pressure Lecturer: H Mohammadzadeh Assistant professors, Department of
TECTONICS, VOL. 21, NO. 0, /2001TC901022, 2002
 TECTONICS, VOL. 21, NO. 0, 10.1029/2001TC901022, 2002 Vertical stretching and crustal thickening at Nanga Parbat, Pakistan Himalaya: A model for distributed continental deformation during mountain building
Laboratory measurements of elastic anisotropy parameters for the exposed crustal rocks from the Hidaka Metamorphic Belt, Central Hokkaido, Japan
 Geophys. J. Int. (001) 145, 33 47 Laboratory measurements of elastic anisotropy parameters for the exposed crustal rocks from the Hidaka Metamorphic Belt, Central Hokkaido, Japan M. Takanashi, 1, * O.
Lab: Metamorphism: minerals, rocks and plate tectonics!
 Introduction The Earth s crust is in a constant state of change. For example, plutonic igneous rocks are exposed at the surface through uplift and erosion. Many minerals within igneous rocks are unstable
Seismic techniques for imaging fractures, cracks and faults in the Earth. Michael Kendall
 Seismic techniques for imaging fractures, cracks and faults in the Earth Michael Kendall Issues and Challanges Geometry (aspect ratio, size, orientation, density) Non-uniqueness (e.g., single set of aligned
"When Gregor Samsa woke up one morning from unsettling dreams, he found himself changed into a monstrous bug. Metamorphosis, by Franz Kafka
 Metamorphosis "When Gregor Samsa woke up one morning from unsettling dreams, he found himself changed into a monstrous bug. Metamorphosis, by Franz Kafka Metamorphism The transformation of rock by temperature
The Implications of the Mineral System Concept for Geophysical Exploration: A Perspective. Mike Dentith
 The Implications of the Mineral System Concept for Geophysical Exploration: A Perspective Mike Dentith michael.dentith@uwa.edu.au PDAC Toronto 2018 Traditional geophysical exploration strategy: Mapping
Chapter 8 Lecture. Earth: An Introduction to Physical Geology. Twelfth Edition. Metamorphism. Rocks. Tarbuck and Lutgens Pearson Education, Inc.
 Chapter 8 Lecture Earth: An Introduction to Physical Geology Twelfth Edition Metamorphism and dmetamorphic Rocks Tarbuck and Lutgens Chapter 8 Metamorphic Rocks What Is Metamorphism? Metamorphism means
A mechanical model of the San Andreas fault and SAFOD Pilot Hole stress measurements
 GEOPHYSICAL RESEARCH LETTERS, VOL. 31, L15S13, doi:10.1029/2004gl019521, 2004 A mechanical model of the San Andreas fault and SAFOD Pilot Hole stress measurements Jean Chéry Laboratoire Dynamique de la
Faults, folds and mountain building
 Faults, folds and mountain building Mountain belts Deformation Orogens (Oro = Greek all changes for mountain, in size, shape, genesis orientation, = Greek for or formation) position of a rock mass Structural
material would flow extremely slowly similarly to a brittle material. The shear zone
 GSA DATA REPOSITORY 21468 Hayman and Lavier Supplementary model description: Lavier et al. (213) showed that formation or reactivation of mixed mode fractures in ductile shear zones might generate variations
Introduction. Introduction. Chapter 7. Important Points: Metamorphism is driven by Earth s s internal heat
 Chapter 7 Metamorphism and Metamorphic Rocks Introduction Metamorphism - The transformation of rocks, usually beneath Earth's surface, as the result of heat, pressure, and/or fluid activity, produces metamorphic
Indian mantle corner flow at southern Tibet revealed by shear wave splitting measurements
 Click Here for Full Article GEOPHYSICAL RESEARCH LETTERS, VOL. 35, L02308, doi:10.1029/2007gl031753, 2008 Indian mantle corner flow at southern Tibet revealed by shear wave splitting measurements Yuanyuan
Geophysical Journal International
 Geophysical Journal International Geophys. J. Int. (2011) 185, 609 621 doi: 10.1111/j.1365-246X.2011.04978.x The influence of microstructure on seismic wave speed anisotropy in the crust: computational
Introduction to Geology Spring 2008
 MIT OpenCourseWare http://ocw.mit.edu 12.001 Introduction to Geology Spring 2008 For information about citing these materials or our Terms of Use, visit: http://ocw.mit.edu/terms. Regional metamorphism
Geologic Structures. Changes in the shape and/or orientation of rocks in response to applied stress
 Geologic Structures Changes in the shape and/or orientation of rocks in response to applied stress Figure 15.19 Can be as big as a breadbox Or much bigger than a breadbox Three basic types Fractures >>>
12. MYRMEKITE IN THE SANTA ROSA MYLONITE ZONE, PALM SPRINGS, CALIFORNIA
 1 ISSN 1526-5757 12. MYRMEKITE IN THE SANTA ROSA MYLONITE ZONE, PALM SPRINGS, CALIFORNIA Lorence G. Collins email: lorencec@sysmatrix.net February 15, 1997 Introduction Myrmekite, containing tiny quartz
Chapter 10: Deformation and Mountain Building. Fig. 10.1
 Chapter 10: Deformation and Mountain Building Fig. 10.1 OBJECTIVES Describe the processes of rock deformation and compare and contrast ductile and brittle behavior in rocks. Explain how strike and dip
SUPPLEMENTARY INFORMATION
 Inability of additional parameters to resolve the Rayleigh-Love discrepancy Radial anisotropy is introduced to resolve the Rayleigh-Love misfit discrepancy that exists across large regions of the western
Chapter 15 Structures
 Chapter 15 Structures Plummer/McGeary/Carlson (c) The McGraw-Hill Companies, Inc. TECTONIC FORCES AT WORK Stress & Strain Stress Strain Compressive stress Shortening strain Tensional stress stretching
SURFACE WAVE GROUP VELOCITY MEASUREMENTS ACROSS EURASIA
 SURFACE WAVE GROUP VELOCITY MEASUREMENTS ACROSS EURASIA A. L. Levshin, M. H. Ritzwoller, and L. I. Ratnikova Department of Physics, University of Colorado at Boulder -Contract Number F49620-95-1-0139 Sponsored
GG303 Lecture 29 9/4/01 1 FABRICS
 GG303 Lecture 29 9/4/01 1 FABRICS I Main Topics A What are fabrics? B Planar fabrics C Linear fabrics D Penetrative vs. non-penetrative fabrics E Cleavage and folds F Comments on use of grain-scale observations
PEAT SEISMOLOGY Lecture 9: Anisotropy, attenuation and anelasticity
 PEAT8002 - SEISMOLOGY Lecture 9: Anisotropy, attenuation and anelasticity Nick Rawlinson Research School of Earth Sciences Australian National University Anisotropy Introduction Most of the theoretical
What do variable magnetic fabrics in gabbros of the Oman ophiolite reveal about lower oceanic crustal magmatism at fast spreading ridges?
 GSA Data Repository 1998 1 2 3 4 5 6 7 8 9 11 12 13 14 15 16 17 18 19 21 22 23 24 25 26 27 28 29 3 31 32 33 34 35 36 37 38 39 4 41 42 43 44 45 46 47 48 49 5 51 52 What do variable magnetic fabrics in of
Structure and history of the Kern Canyon fault system: introduction and thesis overview
 1 Chapter 1 Structure and history of the Kern Canyon fault system: introduction and thesis overview Exposures of fault zones from the surface to deep levels afford an opportunity to study the transition
Mechanical and petrophysical. properties of the Alum Shale. Detachment in the Khao Kwang. Foreland Fold and Thrust Belt, central.
 Mechanical and petrophysical properties of the Alum Shale Detachment in the Khao Kwang Foreland Fold and Thrust Belt, central Thailand Thesis submitted in accordance with the requirements of the University
Table 5.1 Recognised senses of shear from locations in SE NPHM & Dichil/E. Astor
 Table 5.1 Table 5.1 Recognised senses of shear from locations in SE NPHM & Dichil/E. Astor 200 Table 5.1 Recognised senses of shear from locations in SE NPHM & Dichil/E. Astor Area / loction no. Sinistral
Strength variation and deformational behavior in anisotropic granitic mylonites under high-temperature and -pressure conditions An experimental study
 Strength variation and deformational behavior in anisotropic granitic mylonites under high-temperature and -pressure conditions An experimental study Gui Liu, Yongsheng Zhou, Yaolin Shi, Sheqiang Miao,
 610 C. DAVIDSON ET AL. thermal structure at a given instant in time. In-sequence thrusting may result in the propagation of top to the south shearing across the MCTZ and into the footwall of the MCT, thereby
Mantle structural geology from seismic anisotropy
 Mantle Petrology: Field Observations and high Pressure experimentations: a Tribute to Francis R. (Joe) Boyd The Geochemical Society, Special Publication N 6, 1999 Editors: Yingwei Fei, Constance M. Bertka,
Lab 6: Metamorphic Rocks
 Introduction The Earth s crust is in a constant state of change. For example, plutonic igneous rocks are exposed at the surface through uplift and erosion. Many minerals within igneous rocks are unstable
Lecture 5 Sedimentary rocks Recap+ continued. and Metamorphic rocks!
 Lecture 5 Sedimentary rocks Recap+ continued and Metamorphic rocks! Metamorphism Process that leads to changes in: Mineralogy Texture Sometimes chemical composition Metamorphic rocks are produced from
GSTT Technical Note. September 4, Field Trip - Northern Range. Western (Mid-Crustal) Tectonic Domain. STOP 1: Upper Lady Chancellor Road
 Tectonic Domain. STOP 1: Upper Lady Chancellor Road") GSTT Technical Note September 4, 2001 P.O. Box 3524, La Romain, Trinidad and Tobago W.I Web address: www.gstt.org, Editor: millikm1@bp.com Field Trip - Northern Range Systematic east to west variations
GSTT Technical Note September 4, 2001 P.O. Box 3524, La Romain, Trinidad and Tobago W.I Web address: www.gstt.org, Editor: millikm1@bp.com Field Trip - Northern Range Systematic east to west variations
Prof. Tejas S Patil Dept Of Geology M.J.College.
 Prof. Tejas S Patil Dept Of Geology M.J.College. Metamorphic rocks When rocks are baked by heat of molten magma or squeezed by the movements of huge tectonic plates or by the pressure of overlying thick
CURRICULUM VITAE WEISEN SHEN EDUCATION
 CURRICULUM VITAE WEISEN SHEN Center for Imaging the Earth s Interior, Department of Physics, CU Boulder Boulder, CO, 80309 Research ID: J-3969-2012 http://www.researcherid.com/rid/j-3969-2012 Citizenship:
Structural Geology and Geology Maps Lab
 Structural Geology and Geology Maps Lab Mesa College Geology 101 Lab Ray Rector: Instructor Structural Geology Lab Pre-Lab Resources Pre-Lab Internet Links 1) Fundamentals of Structural Geology 2) Visualizing
Global Tectonics. Kearey, Philip. Table of Contents ISBN-13: Historical perspective. 2. The interior of the Earth.
 Global Tectonics Kearey, Philip ISBN-13: 9781405107778 Table of Contents Preface. Acknowledgments. 1. Historical perspective. 1.1 Continental drift. 1.2 Sea floor spreading and the birth of plate tectonics.
Preface and Overview. Folded strata in the mountains of Italy (ca AD), Leonardo da Vinci
, Leonardo da Vinci") Preface and Overview Folded strata in the mountains of Italy (ca. 1500 AD), Leonardo da Vinci Models of Mountain Building and Associated Deformation as represented by G.P. Scrope Deformation Feature: Scales
Preface and Overview Folded strata in the mountains of Italy (ca. 1500 AD), Leonardo da Vinci Models of Mountain Building and Associated Deformation as represented by G.P. Scrope Deformation Feature: Scales
What does Seismic Anisotropy tell us about the Lithosphere-Asthenosphere Boundary?
 What does Seismic Anisotropy tell us about the Lithosphere-Asthenosphere Boundary? Jean-Paul Montagner (1), Gael Burgos (1), Eric Beucler (2), Antoine Mocquet (2) and Yann Capdeville (2), Mathias Obrebski
Lesson Seven: Metamorphic Rocks
 Name: Date: GEOL1 Physical Geology Laboratory Manual College of the Redwoods Lesson Seven: Metamorphic Rocks Background Reading: Metamorphic Rocks Metamorphic Rocks These are rocks that have been changed
Petrology: Igneous and Metamorphic (with a few sedimentary rocks)
") 1 Petrology: Igneous and Metamorphic (with a few sedimentary rocks) Spring 2017 Geology 2 nd ed. - Chernicoff Why Petrology? Most of the Earth is made of rock. Information about or for: Earth history rocks
1 Petrology: Igneous and Metamorphic (with a few sedimentary rocks) Spring 2017 Geology 2 nd ed. - Chernicoff Why Petrology? Most of the Earth is made of rock. Information about or for: Earth history rocks
Metamorphism occurs where equi P-T is disturbed
 Metamorphism occurs where equi P-T is disturbed Steady-state geotherms are disturbed by a variety of processes including plate-tectonic transport of rocks and heat input by intrusion of magma active transport
GEOL FORENSIC GEOLOGY ROCK IDENTIFICATION
 GEOL.2150 - FORENSIC GEOLOGY ROCK IDENTIFICATION Name I. Introduction There are three basic types of rocks - igneous, sedimentary, and metamorphic: Igneous. Igneous rocks have solidified from molten matter
Brittle Deformation. Earth Structure (2 nd Edition), 2004 W.W. Norton & Co, New York Slide show by Ben van der Pluijm
, 2004 W.W. Norton & Co, New York Slide show by Ben van der Pluijm") Lecture 6 Brittle Deformation Earth Structure (2 nd Edition), 2004 W.W. Norton & Co, New York Slide show by Ben van der Pluijm WW Norton, unless noted otherwise Brittle deformation EarthStructure (2 nd
Lecture 6 Brittle Deformation Earth Structure (2 nd Edition), 2004 W.W. Norton & Co, New York Slide show by Ben van der Pluijm WW Norton, unless noted otherwise Brittle deformation EarthStructure (2 nd
CHAPTER Va : CONTINUOUS HETEROGENEOUS DEFORMATION
 Va-1 INTRODUCTION Heterogeneous deformation results from mechanical instabilities (folding and boudinage) within an heterogeneous material or from strain localization in an homogeneous material (shear
Earthquake patterns in the Flinders Ranges - Temporary network , preliminary results
 Earthquake patterns in the Flinders Ranges - Temporary network 2003-2006, preliminary results Objectives David Love 1, Phil Cummins 2, Natalie Balfour 3 1 Primary Industries and Resources South Australia
Objectives of this Lab. Introduction. The Petrographic Microscope
 Geological Sciences 101 Lab #9 Introduction to Petrology Objectives of this Lab 1. Understand how the minerals and textures of rocks reflect the processes by which they were formed. 2. Understand how rocks
Elastic properties of anisotropic synthetic calcite muscovite aggregates
 JOURNAL OF GEOPHYSICAL RESEARCH, VOL. 115,, doi:10.1029/2009jb006523, 2010 Elastic properties of anisotropic synthetic calcite muscovite aggregates Bjarne S. G. Almqvist, 1 Luigi Burlini, 2 David Mainprice,
CHAPTER 3.3: METAMORPHIC ROCKS
 CHAPTER 3.3: METAMORPHIC ROCKS Introduction Metamorphism - the process of changes in texture and mineralogy of pre-existing rock due to changes in temperature and/or pressure. Metamorphic means change
Fracture induced shear wave splitting in a source area of triggered seismicity by the Tohoku-oki earthquake in northeastern Japan.
 Fracture induced shear wave splitting in a source area of triggered seismicity by the Tohoku-oki earthquake in northeastern Japan Masahiro Kosuga 1 1. Corresponding Author. Professor, Graduate School of
SOURCE MODELING OF RECENT LARGE INLAND CRUSTAL EARTHQUAKES IN JAPAN AND SOURCE CHARACTERIZATION FOR STRONG MOTION PREDICTION
 SOURCE MODELING OF RECENT LARGE INLAND CRUSTAL EARTHQUAKES IN JAPAN AND SOURCE CHARACTERIZATION FOR STRONG MOTION PREDICTION Kimiyuki Asano 1 and Tomotaka Iwata 2 1 Assistant Professor, Disaster Prevention
Seismic characterization of mantle flow in subduction systems: Can we resolve a hydrated mantle wedge?
 Earth and Planetary Science Letters 243 (2006) 632 649 www.elsevier.com/locate/epsl Seismic characterization of mantle flow in subduction systems: Can we resolve a hydrated mantle wedge? Teresa Mae Lassak
COMPOSITION and PHYSICAL PROPERTIES GENERAL SUBJECTS. GEODESY and GRAVITY
 COMPOSITION and PHYSICAL PROPERTIES Composition and structure of the continental crust Composition and structure of the core Composition and structure of the mantle Composition and structure of the oceanic
shear zones Ductile shear zones can develop as a results of shearing (simple shear strain) or "squeezing" (pure shear strain).
 or squeezing (pure shear strain).") shear zones Ductile shear zones can develop as a results of shearing (simple shear strain) or "squeezing" (pure shear strain). Shear Zones Mylonite, or mylonitic zone is the central part of the shear zone
shear zones Ductile shear zones can develop as a results of shearing (simple shear strain) or "squeezing" (pure shear strain). Shear Zones Mylonite, or mylonitic zone is the central part of the shear zone
Mantle anisotropy across the southwestern boundary of the Ordos block, North China
 Earthq Sci (200)23: 549 553 549 Doi: 0.007/s589-00-0754-2 Mantle anisotropy across the southwestern boundary of the Ordos block, North China, Yongcai Tang Yongshun John Chen Yuanyuan V. Fu 2 Haiyang Wang
Crags, Cracks, and Crumples: Crustal Deformation and Mountain Building
 Crags, Cracks, and Crumples: Crustal Deformation and Mountain Building Updated by: Rick Oches, Professor of Geology & Environmental Sciences Bentley University Waltham, Massachusetts Based on slides prepared
GEOL 321 Structural Geology and Tectonics
 GEOL 321 Structural Geology and Tectonics Geology 321 Structure and Tectonics will be given in Spring 2017. The course provides a general coverage of the structures produced by brittle and ductile rock
For personal use only
 AVZ Minerals Limited 19 September 2016 ACQUISITION OF MANONO EXTENSION LITHIUM, TIN AND TANTALUM PROJECT IN THE DEMOCRATIC REPUBLIC OF CONGO Company to acquire, subject to due diligence, the Manono Extension
lecture 7 Foliations & lineations
 Kristallingeologie lecture 7 Foliations & lineations 28 participants Results test A, 2008 Maximum 70 points Pass!35 points (!50%) Best result 67 points Average result 54 points ("2.3) Worst result 30 points
EESC 4701: Igneous and Metamorphic Petrology METAMORPHIC ROCKS LAB 8 HANDOUT
 Sources: Caltech, Cornell, UCSC, TAMIU Introduction EESC 4701: Igneous and Metamorphic Petrology METAMORPHIC ROCKS LAB 8 HANDOUT Metamorphism is the process by which physical and chemical changes in a
Metamorphism: summary in haiku form
 Metamorphism & Metamorphic Rocks Earth, Chapter 8 Metamorphism: summary in haiku form Shape-shifters in crust. Just add heat and/or pressure. Keep it solid please! What Is Metamorphism? Metamorphism means
ERTH2020 Introduction to Geophysics The Seismic Method. 1. Basic Concepts in Seismology. 1.1 Seismic Wave Types
 ERTH2020 Introduction to Geophysics The Seismic Method 1. Basic Concepts in Seismology 1.1 Seismic Wave Types Existence of different wave types The existence of different seismic wave types can be understood
Metamorphic Rock Origin and Identification
 Metamorphic Rock Origin and Identification Physical Geology GEOL 101 Lab Ray Rector - Instructor http://www.rockhounds.com/rockshop/rockkey/index.html http://earthsci.org/education/teacher/basicgeol/meta/meta.html
Investigating Causes of D Anisotropy
 Investigating Causes of D Anisotropy J.-M. Kendall and P. G. Silver in: The Core-Mantle Boundary Region, AGU, 1998. MDL 3/15/04 Although most of the lower mantle (below 660km) appears to be isotropic,
Report of Activities 2003 Published by: Manitoba Industry, Economic Development and Mines Manitoba Geological Survey, 2003.
 Report of Activities 2003 Published by: Manitoba Industry, Economic Development and Mines Manitoba Geological Survey, 2003. ERRATA: The publisher/department name in the bibliographic reference cited immediately
GEOL Lab 11 (Metamorphic Rocks in Hand Sample and Thin Section)
") GEOL 333 - Lab 11 (Metamorphic Rocks in Hand Sample and Thin Section) Introduction - Metamorphic rock forms from any pre-existing rock that undergoes changes due to intense heat and pressure without melting.
GEOL 333 - Lab 11 (Metamorphic Rocks in Hand Sample and Thin Section) Introduction - Metamorphic rock forms from any pre-existing rock that undergoes changes due to intense heat and pressure without melting.
SUPPLEMENTARY INFORMATION
 SUPPLEMENTARY INFORMATION Supplementary material to "Crystal-scale control on plate tectonics: anisotropy-induced reactivation of lithospheric faults" Andréa Tommasi *, Mickael Knoll *,***, Alain Vauchez
P-SH Conversions in Layered Media with Hexagonally Symmetric Anisotropy: A CookBook
 Pure appl. geophys. 151 (1998) 669 697 0033 4553/98/040669 29 $ 1.50+0.20/0 P-SH Conversions in Layered Media with Hexagonally Symmetric Anisotropy: A CookBook VADIM LEVIN 1 and JEFFREY PARK 1 Abstract
GEOLOGY OF THAILAND (METAMORPHIC ROCKS)
") GEOLOGY OF THAILAND (METAMORPHIC ROCKS) High-Grade Metamorphic Rocks (Precambrian?) Low-Grade Metamorphic Rocks (Lower Paleozoic) 1 THAILAND EXPLANATION Lower Paleozoic Rocks (Low Grade) Precambrian (?)
GEOLOGY OF THAILAND (METAMORPHIC ROCKS) High-Grade Metamorphic Rocks (Precambrian?) Low-Grade Metamorphic Rocks (Lower Paleozoic) 1 THAILAND EXPLANATION Lower Paleozoic Rocks (Low Grade) Precambrian (?)
INFLUENCE OF LOCAL PERTURBATION ON REGIONAL STRESS AND ITS IMPACT ON THE DESIGN OF MAJOR UNDERGROUND STRUCTURE IN HYDROELECTRIC PROJECT
 INFLUENCE OF LOCAL PERTURBATION ON REGIONAL STRESS AND ITS IMPACT ON THE DESIGN OF MAJOR UNDERGROUND STRUCTURE IN HYDROELECTRIC PROJECT *D.S. Subrahmanyam National Institute of Rock Mechanics, Bangalore
Metamorphic Rock Origin and Identification
 Metamorphic Rock Origin and Identification Geology Laboratory GEOL 101 Lab Ray Rector - Instructor http://www.rockhounds.com/rockshop/rockkey/index.html http://earthsci.org/education/teacher/basicgeol/meta/meta.html
Regional GIS based exploration targeting studies in data poor environments
 Regional GIS based exploration targeting studies in data poor environments A case study of gold prospectivity mapping in Nigeria Matthew Greentree, Mathieu Lacorde and Bert De Waele Acknowledgements Australian
P314 Anisotropic Elastic Modelling for Organic Shales
 P314 Anisotropic Elastic Modelling for Organic Shales X. Wu* (British Geological Survey), M. Chapman (British Geological Survey), X.Y. Li (British Geological Survey) & H. Dai (British Geological Survey)
Crustal Deformation. Earth Systems 3209
 Crustal Deformation Earth Systems 3209 Crustal Deformation pg. 415 Refers to all changes in the original form and/or size of a rock body. May also produce changes in the location and orientation of rocks.
Term 1 final review ES
 Name: Date: 1. t what approximate altitude in the atmosphere can stratospheric ozone be found?. 10 km. 30 km. 70 km D. 100 km 2. What percentage of Earth s history represents human existence?. less than
Supplementary Information for USArray Shear Wave Splitting Shows Seismic Anisotropy from Both Lithosphere and Asthenosphere
 GSA Data Repository 2015234 Supplementary Information for USArray Shear Wave Splitting Shows Seismic Anisotropy from Both Lithosphere and Asthenosphere Sutatcha Hongsresawat 1, Mark P. Panning 1, Raymond
SCIENCE CHINA Earth Sciences
 SCIENCE CHINA Earth Sciences RESEARCH PAPER September 2011 Vol.54 No.9: 1386 1393 doi: 10.1007/s11430-011-4177-2 Crustal P-wave velocity structure of the Longmenshan region and its tectonic implications
Synthetic Seismogram A Tool to Calibrate PP & PS Seismic Data
 P-475 Summary Synthetic Seismogram A Tool to Calibrate PP & PS Seismic P. Sugadha*, M. K. Jain, M. Singh, ONGC Conventional P wave technology will not meet all the requirements of the industry. Hence,
GEOPHYSICAL RESEARCH LETTERS, VOL. 37, L02304, doi: /2009gl041835, 2010
 Click Here for Full Article GEOPHYSICAL RESEARCH LETTERS, VOL. 37,, doi:10.1029/2009gl041835, 2010 Seismic structure of the Longmen Shan region from S wave tomography and its relationship with the Wenchuan
USING ANISOTROPY OF MAGNETIC SUSCEPTIBILITY TO DETERMINE FLOW DIRECTIONS OF THE DEVIL TRACK AND KIMBALL CREEK RHYOLITES
 USING ANISOTROPY OF MAGNETIC SUSCEPTIBILITY TO DETERMINE FLOW DIRECTIONS OF THE DEVIL TRACK AND KIMBALL CREEK RHYOLITES DHIREN R. PATEL Macalester College Sponsor: John Craddock INTRODUCTION Extrusive
Geodynamics Lecture 5 Basics of elasticity
 Geodynamics Lecture 5 Basics of elasticity Lecturer: David Whipp david.whipp@helsinki.fi! 16.9.2014 Geodynamics www.helsinki.fi/yliopisto 1 Goals of this lecture Introduce linear elasticity! Look at the
2) Question: Very briefly describe the differences between these two types of metamorphism:
 Question: Very briefly describe the differences between these two types of metamorphism:") Name: Grade: GEOL 101 - Physical Geology Laboratory METAMORPHIC ROCKS PRELAB & LAB WORKSHEETS PRELAB SECTION To be completed before labs starts: I. Introduction & Purpose: The purpose of this laboratory
Name: Grade: GEOL 101 - Physical Geology Laboratory METAMORPHIC ROCKS PRELAB & LAB WORKSHEETS PRELAB SECTION To be completed before labs starts: I. Introduction & Purpose: The purpose of this laboratory
HOMOGENEITY OF GRANITE FABRICS AT THE METRE AND DEKAMETRE SCALES
 HOMOGENEITY OF GRANITE FABRICS AT THE METRE AND DEKAMETRE SCALES Philippe OLIVIER, Michel de SAINT BLANQUAT, Gérard GLEIZES and Denis LEBLANC Equipe de Pétrophysique et Tectonique, UMR 553 CNRS Université
Big Island Field Trip
 Big Island Field Trip Space Still Available Group Airline Tickets May be available if enough people sign on If interested send email to Greg Ravizza Planning Meeting Next Week Will
The Composition of the Continental Crust
 The Composition of the Continental Crust Roberta L. Rudnick Geochemistry Laboratory Department of Geology University of Maryland Apollo 17 view of Earth Rationale: Why is studying crust composition important?
Rotation of the Principal Stress Directions Due to Earthquake Faulting and Its Seismological Implications
 Bulletin of the Seismological Society of America, Vol. 85, No. 5, pp. 1513-1517, October 1995 Rotation of the Principal Stress Directions Due to Earthquake Faulting and Its Seismological Implications by
Engineering Geology. Metamorphic Rocks. Hussien Al - deeky
 Metamorphic Rocks Hussien Al - deeky 1 Definition Metamorphic rock is the result of the transformation of an existing rock type, the protolith (parent rock), in a process called metamorphism, which means
Inversion of travel times to estimate Moho depth in Shillong Plateau and Kinematic implications through stress analysis of Northeastern India
 Inversion of travel times to estimate Moho depth in Shillong Plateau and Kinematic implications through stress analysis of Northeastern India by Saurabh Baruah Geoscience Division North-East Institute
Answers: Internal Processes and Structures (Isostasy)
") Answers: Internal Processes and Structures (Isostasy) 1. Analyse the adjustment of the crust to changes in loads associated with volcanism, mountain building, erosion, and glaciation by using the concept
Answers: Internal Processes and Structures (Isostasy) 1. Analyse the adjustment of the crust to changes in loads associated with volcanism, mountain building, erosion, and glaciation by using the concept
Evaluating Contributions to SK K S Splitting from Lower Mantle Anisotropy: A Case Study from Station DBIC, Côte D Ivoire
 Bulletin of the Seismological Society of America, Vol. 102, No. 3, pp. 1030 1040, June 2012, doi: 10.1785/0120110255 E Evaluating Contributions to SK K S Splitting from Lower Mantle Anisotropy: A Case
Name: KEY. Examine all possible answers; some may not satisfy the question criteria and should be left blank. mica crystals big enough to see
 GE 50 Exam #3, FS07 Name: KEY_ Examine all possible answers; some may not satisfy the question criteria and should be left blank. 1. Match the metamorphic rock with its foliated texture. [10 pts] slate