Downward continued multichannel seismic refraction analysis of Atlantis Massif oceanic core complex, 30 N, Mid-Atlantic Ridge
|
|
|
- Jeffry Neal
- 5 years ago
- Views:
Transcription


1 Article Volume 13, Number 1 19 May 2012 Q0AG07, doi: /2012gc ISSN: Downward continued multichannel seismic refraction analysis of Atlantis Massif oceanic core complex, 30 N, Mid-Atlantic Ridge A. S. Henig, D. K. Blackman, and A. J. Harding Scripps Institution of Oceanography, University of California, San Diego, 9500 Gilman Drive, La Jolla, California , USA (ahenig@ucsd.edu) J.-P. Canales Department of Geology and, Woods Hole Oceanographic Institution, MS 24, 360 Woods Hole Road, Woods Hole, Massachusetts , USA G. M. Kent Nevada Seismological Lab, University of Nevada, MS-174, Reno, Nevada 89557, USA [1] Detailed seismic refraction results show striking lateral and vertical variability of velocity structure within the Atlantis Massif oceanic core complex (OCC), contrasting notably with its conjugate ridge flank. Multichannel seismic (MCS) data are downward continued using the Synthetic On Bottom Experiment (SOBE) method, providing unprecedented detail in tomographic models of the P-wave velocity structure to subseafloor depths of up to 1.5 km. Velocities can vary up to 3 km/s over several hundred meters and unusually high velocities (5 km/s) are found immediately beneath the seafloor in key regions. Correlation with in situ and dredged rock samples, video and records from submersible dives, and a km drill core, allow us to infer dominant lithologies. A high velocity body(ies) found to shoal near to the seafloor in multiple locations is interpreted as gabbro and is displaced along isochrons within the OCC, indicating a propagating magmatic source as the origin for this pluton(s). The western two-thirds of the Southern Ridge is capped in serpentinite that may extend nearly to the base of our ray coverage. The distribution of inferred serpentinite indicates that the gabbroic pluton(s) was emplaced into a dominantly peridotitic host rock. Presumably the mantle host rock was later altered via seawater penetration along the detachment zone, which controlled development of the OCC. The asymmetric distribution of seismic velocities and morphology of Atlantis Massif are consistent with a detachment fault with a component of dip to the southeast. The lowest velocities observed atop the eastern Central Dome and conjugate crust are most likely volcanics. Here, an updated model of the magmatic and extensional faulting processes at Atlantis Massif is deduced from the seismic results, contributing more generally to understanding the processes controlling the formation of heterogeneous lithosphere at slow-rate spreading centers. Components: 15,700 words, 11 figures, 1 table. Keywords: Mid-Atlantic Ridge; detachment fault; gabbro; oceanic core complex; seismic structure; serpentinized peridotite. Index Terms: 3025 Marine Geology and : Marine seismics (0935, 7294); 3035 Marine Geology and : Midocean ridge processes; 3045 Marine Geology and : Seafloor morphology, geology, and geophysics. Received 20 January 2012; Revised 19 April 2012; Accepted 20 April 2012; Published 19 May Copyright 2012 by the American Geophysical Union 1 of 25
2 Henig, A. S., D. K. Blackman, A. J. Harding, J.-P. Canales, and G. M. Kent (2012), Downward continued multichannel seismic refraction analysis of Atlantis Massif oceanic core complex, 30 N, Mid-Atlantic Ridge, Geochem. Geophys. Geosyst., 13, Q0AG07, doi: /2012gc Theme: Oceanic Detachment Faults 1. Introduction [2] Lithospheric heterogeneity is the result of ridge processes that vary in time and space, and to first order, structural differences in slow-spread lithosphere produce anomalous seafloor morphology [e.g., Cannat et al., 2006] interrupting the more common abyssal hill pattern. Early studies of gravity structure at the Mid-Atlantic Ridge (MAR) suggest crustal thickness variations of several kilometers along the ridge axis over length scales of several hundred kilometers [Kuo and Forsyth, 1988; Lin et al., 1990; Morris and Detrick, 1991; Michael et al., 1994; Detrick et al., 1995] and across transform faults, while across-axis, smallerscale gravity studies suggest crustal thickness differences can also occur on conjugate sides of the ridge [Blackman et al., 1998, 2008]. [3] Regional seismic investigations also indicate a heterogeneous slow-spread lithospheric structure at the segment scale. Seismic imaging of the crust along the axis of various spreading segments shows several kilometers of thinning between segment center and segment end that is dominantly controlled by thickness variations in the lower crustal layer [e.g., Tolstoy et al., 1993; Hooft et al., 2000; Planert et al., 2009]. These crustal thickness variations are often accompanied by lateral changes in seismic velocity [e.g., Canales et al., 2000a; Hooft et al., 2000]. Seismically determined changes in thickness and structure of igneous crust are also documented across axis [Canales et al., 2000b]. Denser local seismic studies show dramatic changes in seismic structure at lateral scales of a few kilometers [Canales et al., 2008; Xu et al., 2009; Arnulf et al., 2011]. [4] Geologic studies also show that the classic homogeneous layered model of oceanic crust [Penrose Conference Participants, 1973], where erupted basalts overlie sheeted dikes and gabbro at depth, is only one of many crustal structures possible. Outcrops of serpentinized peridotite and gabbro [Cannat, 1993; Dick et al., 2008], in contrast to the expected erupted basalt, have been identified at the seafloor on ridge flanks of slow spreading centers by submersible [Karson, 1999; Blackman et al., 2002; Boschi et al., 2006; Tucholke and Lin, 1994] and drilling studies [Dick et al., 2000; MacLeod et al., 2002; Kelemen et al., 2004; Blackman et al., 2006]. All of these observations illustrate the spatially and temporally irregular magmatic processes and faulting styles that typify slow-spreading ridges and control the formation of heterogeneous crust and lithosphere. [5] Oceanic core complexes (OCCs), lower crustal and mantle sections exhumed by detachment faulting, are formed at slow and intermediate spreading centers [Cann et al., 1997; Tucholke et al., 1998, 2001; Ohara et al.,2001;reston et al., 2002; Searle et al., 2003; Smith et al., 2006, 2008], probably in association with long lived detachment faulting that persists for up to over 1 Myr [Tucholke et al., 1998; Grimes et al., 2008]. The OCCs are domal and characterized by their high relief, often kilometers above surrounding seafloor, and by the presence of spreading-parallel corrugations on the capping surface that have 10 s m amplitude and km-scale wavelengths [Cann et al., 1997; Tucholke et al., 1998]. The corrugations document sustained relative motion between the exposed footwall and previously overlying hanging wall. Recent studies show that detachment faulting is a prominent process along portions of all slow spreading oceanic ridges [Cannat et al., 2006; Smith et al., 2006; Escartín et al., 2008] and is likely controlled by temporally changing magmatic conditions [Ildefonse et al., 2007; Tucholke et al., 2008; MacLeod et al., 2009; Olive et al., 2010]. Numerical models estimate that during lithospheric creation, the formation of detachment faults near the ridge occurs when magmatic accretion is active between 30 50% of the time, while the remainder of plate separation is due to tectonic extension [Buck et al., 2005; Tucholke et al., 2008; Olive et al., 2010]. At these rates of magmatism, plutons can be emplaced in the ultramafic host-rock forming a plum-pudding style lithosphere [Cannat, 1993; Escartín et al., 2003; Ildefonse et al., 2007] and can be denuded to the seafloor due to motion on one of these detachment faults. Determination of the internal structure of OCCs can provide insight into the magmatic conditions during their formation and perhaps constrain the extent of alteration. 2of25

3 Figure 1. Perspective view of the Atlantis Massif looking to the northwest. Labels indicate the three main morphologic components and the South Wall. The Mid-Atlantic Ridge Axis and Atlantis Transform Fault are indicated. Gray lines and labels show location and extent of coverage for the six MultiChannel Seismic lines in this study. The location of IODP Hole U1309D is shown by the black cylinder. [6] In this paper, we present a detailed seismic refraction study of the Atlantis Massif OCC (Figure 1), a young and well-mapped OCC on the Mid-Atlantic Ridge, and its conjugate crust, with the main objective of characterizing structural variability and magmatic history in this location. Three OCCs occur along the Atlantis transform fault (ATF) within lithosphere formed in the last 10 Myr [Cann et al., 1997], suggesting continued episodicity in magma supply. Seismic imaging of the OCC allows us to constrain vertical and lateral variations in seismic velocity and we can employ these velocity structure observations in a lithologic and evolutionary analysis of Atlantis Massif. [7] Our study expands on the multichannel seismic (MCS) refraction study of Canales et al. [2008], where only two MCS lines were analyzed with sea surface data, to include the full dataset covering the massif. We use an innovative downward continuation technique [Harding et al., 2007; Arnulf et al., 2011] to process the seismic data. The downward continuation technique has not previously been applied to a study of an OCC, therefore this study provides insights into how this method performs in high relief areas with high subsurface velocities and velocity gradients [Canales et al., 2008]. [8] We present tomographic models for 5 seismic lines covering the dome of the massif, which show heterogeneity of seismic structure and a decent correlation with in situ rock samples from seafloor outcrops. In addition, the model for one seismic line along the conjugate crust at the other side of the MAR axis serves to highlight the anomalous character of the OCC. Based on our tomographic results, we develop a model for how faulting and magmatism evolved to produce the observed structure at Atlantis Massif. 2. Methods 2.1. Data Acquisition [9] Five intersecting MCS lines covering the dome of the Atlantis Massif and one line on the conjugate crust across the spreading axis from the OCC were collected aboard the R/V Maurice Ewing during the cruise EW-0102 in 2001 [Canales et al., 2004]. The seismic lines range in length from 21 to 27 km and comprise between 85 and 109 shots each in this study. Water depth varies greatly, from 785 m to nearly 3.25 km on the OCC, and the conjugate crust line is over seafloor depths of km. The greatest relief on a single line is 1.67 km. [10] The survey source consisted of a 10-airgun array with total capacity of 3100 in 3 (51 l) towed at 8 m depth and fired approximately every 37.7 m. Receivers spaced 12.5 m along a 6 km long, 480- channel streamer recorded the returning energy at a depth of approximately 10 m. In situ source and receiver positions were determined from shipboard 3of25
4 Geosystems 3 G HENIG ET AL.: ATLANTIS MASSIF DOWNWARD CONTINUED MCS /2012GC Figure 2. Representative shot gathers illustrating the result of the Synthetic On-Bottom Experiment downward continuation technique and plotted with a reduction velocity of 6.5 km/s. (a) Initial shot gather before SOBE processing. (b) SOBE processed shot gather showing collapse of seafloor reflection arrival and exposure of nearoffset first refracted arrivals. Cyan marks seafloor reflection arrival; red marks first refracted arrival. Red stars indicate the end of the streamer closest to the source. GPS, tail-buoy GPS recordings and compassenhanced DigiCourse birds attached to the streamer [Canales et al., 2008]. [11] Seismic velocity models from lines A4 and A10 were previously published by Canales et al. [2008] using standard processing techniques. This study extends analysis to all six seismic lines surveying the OCC and the conjugate crust, including the previously studied lines A4 and A10, and makes use of a downward continuation processing method. Of the five OCC lines, two are parallel to the spreading direction (A9 and A10) and three are subparallel to the strike of the spreading axis (A4, A6, and A5), while the conjugate crust line A8 is subparallel to the MAR axis (Figure 1) SOBE Downward Continuation and Additional Data Processing [12] We employ a method in which shots and receivers are downward continued to the seafloor using a Kirchhoff phase shift redatuming algorithm [Shtivelman and Canning, 1988]. This process creates a Synthetic On-Bottom Experiment (SOBE) [Harding et al., 2007; Arnulf et al., 2011] that exposes the shallowest turning basement refractions as first arrivals by collapsing the water wave (the first seafloor reflection arrival) toward a point at zero-offset, and mostly unwrapping triplications produced by high gradient zones (Figure 2). [13] The SOBE technique is most useful in areas of large water depth and low subsurface velocities. In such survey conditions, the majority of the streamer channels record the seafloor reflection arriving ahead of the crustal refraction arrival, making it difficult to obtain useful travel-time picks for rays traveling through the shallow crust. In shallow water, or where the ratio of basement to water velocities is high, only the nearest offset streamer channels will record the reflection ahead of the refraction. In this case travel times of crustal refractions can be picked directly without use of downward continuation. In water depths of 3 km however, refracted data from at least the first 2 km of receivers are preceded by reflections. [14] This redatuming allows shallow, refracted energy that would generally be obscured by the seafloor 4 of 25
5 reflection in deep water depths to be emergent (i.e., first arrivals), corresponding to raypaths in the upper few hundred meters of the subseafloor section. Travel-time picks of these near-offset crustal refractions thus provide excellent structural detail in the upper portion of our models. By improving the velocity detail in the upper region of the models, we also obtain better resolution of the deeper ( m) structure. Streamer tomography exploits the dense and even spatial distribution of MCS data, and is further improved upon by SOBE, which allows for the inclusion of shallower refractions that were only previously obtainable using either seafloor receivers and/or sources. [15] The first refracted arrival is clearly observed in SOBE shot gathers for most of this data set and the signal-to-noise ratio (SNR) is generally high. Besides downward continuation or redatuming, minimal processing of the data was required. Prior to downward continuation, trace balancing was applied and consistently noisy traces were replaced by interpolation from the adjacent traces as continuity of seismic data across all streamer channels is required for downward continuation. The data were then downward continued in shot gather space, with a 5 20 Hz bandpass filter to exclude noise and unusable frequencies in the refraction data, followed by downward continuation in common receiver location space with a 20 Hz lowpass filter to minimize spatial aliasing. A fourth-order Butterworth filter was used in both steps and a water velocity of 1.5 km/s was assumed for the downward continuation Picking of Travel-Times [16] Travel times of first arrival P-wave refractions were picked for every fifth shot gather along each MCS line. This corresponds to picking at a spacing of approximately meters, which falls within the first Fresnel zone of 200 m at the seafloor. In areas where a fifth gather was of poor quality, two nearby gathers were substituted in that interval to maintain at least one sampling in each Fresnel Zone. Travel times from all receivers were picked if each recorded a clear and continuous arrival (Figures 2b and 3a). Despite SOBE processing, in some cases it was not possible to pick the arrival all the way in to nearest offset, and this near offset data may have been missing from the original surface recording. In some areas of rough topography and low subsurface velocities, the water wave does not collapse down to a single point, but continues to have some finite width that obstructs the first refracted arrival in a handful of the nearest offset traces (Figure 3). [17] Data quality is generally good for most shotreceiver pairs, with the exception of a few locations where the SNR is lower due to a variety of possible factors. Complicated subsurface structure (Figure 3b), side-swipe from nearby seafloor structure (Figure3c), and rough seafloor topography (Figure 3d) may all lower the SNR. Although minimized where possible, migration artifacts from noise and amplitude variability can also interfere with actual arrivals reducing the clarity of the arrival. No picks were made for receivers with intersecting noise or at breaks in the refracted arrivals. Where possible, traces with low SNR were picked by comparison with traces of the same offset in nearby shots. [18] Pick uncertainties for lines A4, A6, A9, and A10 were generally between ms, with 40 ms being the highest uncertainty assigned (Table 1). Line A5 pick uncertainties were assigned larger values, between ms, due to a lower signal-tonoise ratio caused by the rough topography associated with the hanging wall along this line (Figure 1). Travel times for the first refracted arrival were picked both by hand and cross-correlation. When the cross-correlation technique was employed, the generated picks were visually inspected and adjusted by hand if necessary. Pick coverage for the five OCC lines covering the massif is shown in Figure 4. The coverage is evenly distributed along lines and the near-offsets are well sampled Tomographic Inversion [19] We follow the method of Van Avendonk et al. [2004] to perform tomographic inversions of first crustal refraction travel times of the SOBE data. Our goal is to obtain the smoothest models that fit the data within the pick uncertainties with the fewest number of iterations. To measure the success of this travel-time fitting, the weighted misfit functional value c 2 is used: c 2 ¼ 1 N X N i¼1 2 T obs;i T pred;i s unc;i where T obs is a picked travel-time, T pred is a predicted travel-time of the ray through the current model, s unc is a pick uncertainty, and N is the total number of picks. Models are updated by minimizing the misfit between the predicted times and the ð1þ 5of25
6 Geosystems 3 G HENIG ET AL.: ATLANTIS MASSIF DOWNWARD CONTINUED MCS /2012GC Figure 3. Representative shot gathers from the Atlantis Massif dataset showing a range of data quality. Trace number 480 is closest to the source. All shot gathers have been downward continued using SOBE. Shot gather locations are (a) atop the Central Dome, (b) on the Central Dome in an area of rapidly changing seismic structure, (c) the transition from hanging wall to Southern Ridge where out of plane echoes may be causing destructive interference at long ranges, and (d) atop the volcanic hanging wall in very rough topography. N, S, E, W indicate directions. picked times in a least squares sense. Iterations are performed to fit the data until smoothing constraints are satisfied and an overall misfit c2 1 is achieved (Table 1), indicating the desired fit of the observed travel-times to within their uncertainties. Attention is paid to overall travel-time fit (represented by the c2 value), as well as to the distribution of misfit in individual shot gathers and regions (Figure 4). Table 1. Select Inversion Parameters and Results for Preferred Models Line c2 TTResidsinitial Mean, [abs(max)] A4 A5 A6 A9 A , [189.6] ms 25.7, [440.2] ms 10.4, [166.2] ms 45.1, [256.1] ms 4, [230.6] ms TTResidsfinal Mean, [abs(max)] 1.9, 3.9, 2.9, 0.3, 2.9, [77.0] ms [92.6] ms [83.5] ms [106.8] ms [82.5] ms Uncert, s ms ms ms ms ms Horiz:Vert Aspect Ratio of 25
 as a function of model distance and")


7 Figure 4. Travel time residuals with respect to the preferred model (Figure 6) as a function of model distance and source-receiver range. [20] The tomographic inversions of each line proceeded through a series of linearized 2D inversions, followed by model update, and ray tracing in the new model. At each inversion step, the target misfit reduction was chosen small enough to satisfy the linearity assumption and the smoothing trade-off parameter was adjusted by the program to hit the target misfit [Van Avendonk et al., 2004]. The models converged to their final misfits of in 7 to 11 iterations (Table 1). The parameter controlling the relative strength of horizontal to vertical smoothing, a value chosen subjectively based on a priori expectations of the structure, is reduced as the inversion progresses to promote more rapid convergence of the model. Varying these parameters in this way allows the inversion first to fit large scale structure required by the data, and then to finetune smaller scale features. A low value of 2 or 3 7of25
8 Figure 5. Difference between preferred and starting velocity models. Inset shows 1D starting model for all OCC lines. Contours are every 0.25 km/s. (Table 1), depending on the model, for the final ratio of horizontal to vertical smoothing required to fit the data, indicates strongly laterally heterogeneous structure. The sequence of reductions in the aspect ratio parameters differs for each inversion for our preferred 2D models. This enables optimal fits for each line and allows different scales of structure to be resolved for each profile depending on what is required by the data. The grid spacing used in all inversions is 50 m in the x-direction and 25 m in the z-direction. [21] For all the inversions, the starting model was a 1-D velocity profile, previously used in early downward continued tomographic analysis of line A10 [Harding et al., 2007], hung from the seafloor (1D profile shown as inset in Figure 5). High residual travel times of the picks traced through the starting model indicate that the initial model deviates significantly from the actual velocity structure at Atlantis Massif (Table 1). [22] Figure 4 shows the travel-time residuals of the picked data with respect to the preferred models for each MCS line. The residuals are significantly lower in the preferred models than in the starting models indicating a marked improvement in structural fidelity of the preferred models (Table 1). The residuals are typically <50 ms (maximum of <100 ms) throughout the profiles indicating that all parts of the model are fit about equally well by the data. [23] Misfit problems arise in some areas of rough topography (scattering) due to difficulty in traveltime picking, in the vicinity of drastic slope changes, and where the bathymetry profile used in the inversion differs slightly from the actual bathymetry due to inadequate sonar centerbeam resolution. Mismatch of bathymetry results in high residuals that create diagonal streaks in shot-receiver space (Figure 4c) along a series of adjacent shots. Occasionally single or a few traces will have weak 8of25
 Ridge-parallel lines and (right) spreading-parallel lines. Line locations are shown in map view (inset) and major morphologic components are labeled at the top of each panel.")
9 Figure 6. 2-D tomography models of P-wave velocity within (a e) Atlantis Massif and (f) its conjugate crust depicted with 2:1 vertical exaggeration. (left) Ridge-parallel lines and (right) spreading-parallel lines. Line locations are shown in map view (inset) and major morphologic components are labeled at the top of each panel. Vertical dashed lines show locations of line crossings. Contour interval is 0.5 km/s. Green circles (Serpentinite), blue diamonds (Gabbro), and red triangles (Basalt) show the location of various rock types sampled from the massif surface or basement outcrops in submersible studies and drilling of IODP hole U1309D (vertical gray line projected onto line A4). amplitude of the first arrival, probably due to out-ofplane side-echo caused by local 3D structure creating destructive interference or to rough, steep topography. These traces cannot be picked. In areas of very high velocity gradients just beneath the seafloor, as in the central portion of line A6 (Figure 6a), the inversion has some difficulty in resolving the very low velocity top layer (100 m thick) above higher velocity material. This causes the nearest offset residuals for that region (Figure 4a) to remain high despite the use of decreased vertical smoothing and starting models with low velocity top layers Line A8 [24] Modeling of Line A8 was slightly different from what has been described above. The data were processed to a datum using the SOBE technique as for the other lines, but traveltime picking and inversion were done following the procedures described in Canales et al. [2008]. Traveltime picking was done by combining manual picking with a semi-automated first-break picking routine. The tomographic inversion was conducted using a regularized non-linear inversion with spatial smoothing constraints on the roughness of the model [Zelt and Barton, 1998]. This inversion method employs 9of25
10 models with continuous velocities. Unlike the OCC line inversion technique [Van Avendonk et al., 2004], it thus does not allow for an explicit velocity discontinuity at the seafloor. This flexibility is useful for the OCC profiles where basement velocities and gradients are higher and water depths are shallow enough that the shallowest turning energy is recorded within the streamer aperture. 3. Tomography Results [25] Our preferred tomographic models for P-wave velocity structure of the five MCS lines covering Atlantis Massif are shown in Figures 6a 6e. On scales of less than a kilometer, the models exhibit an extreme degree of lateral heterogeneity when compared with the compilation of young Atlantic crustal velocity values published by White et al. [1992]. Plots of deviations of the tomographic models with respect to the initial one-dimensional starting model for the OCC lines are particularly useful for identifying lateral variations in velocity structure across the Atlantis Massif (Figure 5). In our models, crustal velocity values vary between km/s, with few locations exceeding 7 km/s. Because of the shallow high velocities, high velocity gradients, and the fixed 6 km streamer length, refraction ray coverage in this experiment is limited approximately to the upper 1.5 km of structure. [26] While we do notice patterns in absolute velocities, our results do not show a well-defined classification scheme for velocity gradients, in contrast to what Canales et al. [2008] and Xu et al. [2009] describe for several Atlantic OCCs. These two prior studies note that as absolute velocities at the seafloor increase, velocity gradients increase as well: where seafloor velocities are <3.4 km/s, gradients are <1 s 1 ; areas with velocities between km/s have gradients ranging from 1 3 s 1 ; and where velocities are >4.2 km/s, gradients are >3 s 1 [Canales et al., 2008; Xu et al., 2009]. In our results, velocity gradients range from 1 6 s 1 in the upper 500 mbsf where gradients vary the most, mainly independent of absolute velocity (Figure 7a). By 750 m below seafloor, nearly all velocities (except Line A5 in the region of extrusive volcanic material) reach values ranging from km/s, well into velocities corresponding to intrusive, rather than extrusive, rock. We attribute the lack of correlation between gradients and absolute velocities to the improved vertical resolution of the SOBE tomography models, which confines high gradients to the shallowest parts of the structure. [27] We choose to divide vertical velocity profiles into three groups, similar in velocity but not gradient, to the aforementioned groupings of Canales et al. [2008] and Xu et al. [2009], to aid in interpretation of rock type from seismic velocity. These groupings are as follows: a group with slow surface velocities between 2 3 km/s and base-of-coverage velocities of km/s; an intermediate velocity group with surface velocities between km/s and base-of-coverage velocities of km/s; and a group with the highest velocities, >4.5 km/s at the seafloor trending to km/s at the base of coverage. Figure 7b shows velocity-depth profiles taken from various locations throughout the models to illustrate the three velocity groupings we have defined. The locations of the velocity-depth profiles are noted and were chosen because they represent the clearest examples of the distinct velocity structures associated with discrete portions of the massif. [28] To highlight deviations from the accepted norm, it is useful to compare our models to the seismic velocity structure (and later to the lithologic structure) of the classical, homogeneously layered, model of oceanic crustal structure. This Penrose model, based on ophiolite structure, consists of upper crust, divided into extrusive pillow basalts (layer 2A) atop sheeted dikes (layer 2B), overlying gabbro (layer 3), which in turn overlies the uppermost mantle [Penrose Conference Participants, 1973]. [29] One difficulty we face when interpreting the different velocity groupings of Atlantis Massif is to characterize the structure of normal oceanic crust at slow spreading ridges. This difficulty arises in part because of the heterogeneity of crustal structure and in part because of the difficulty in obtaining reliable results, particularly for the shallowest crust. One, often used, means of characterizing the range of normal crust is to use compilations of previous velocity models such as White et al. [1992]. Unfortunately, the results in this compilation are almost certainly too high to represent the velocity of extrusive volcanics. The seafloor velocities in the White et al. [1992] compilation range upwards from 2.7 km/s (Figure 7c), while measurements of seafloor velocity at fast and intermediate spreading rate ridges are typically in the range km/s [e.g., Harding et al., 1993; Christeson et al., 1994; Canales et al., 2005]. The latter range spans the detailed results for the MAR from Hussenoeder et al. [2002] for 35 N on the MAR and Seher et al. [2010] for the Lucky Strike segment. We use results from line A8 on the conjugate crust across the ridge and the hanging wall section of line A5, together with a more extensive 10 of 25
 1D profiles from the central dome along line A4 (x = 1 6 km) show that the highest velocity gradients occur within the upper 400 m.")
11 Figure 7. Velocity-depth profiles illustrating trends in velocities and velocity gradients within the models. (a) 1D profiles from the central dome along line A4 (x = 1 6 km) show that the highest velocity gradients occur within the upper 400 m. Velocity-depth profiles are shown every 250 m along line portion. (b) Velocity-depth profiles showing the three velocity groupings determined from the models. Profiles come from various portions of the different lines and represent a sample every 250 m within the specified along-line range. The group of lowest seismic velocities (pink) range from 2 3 km/s to km/s and were sampled between x = 2 7 km on line A5 (hanging wall); the group of intermediate velocities range from km/s to km/s (green) and were sampled from x = 10 to 5 km on line A9 (western flank of massif) and from x = 13 to 9 km on line A6; and the group of highest velocities (blue) range from >4.5 km/s to km/s at the top and base of the ray coverage, respectively, and were sampled between x= 4 to 1 km on line A4 (Central Dome). No clear pattern in velocity gradients can be distinguished among the groups. (c) Comparison of velocity-depth profiles from line A5 hanging wall and line A8 on the low velocity, likely volcanic, conjugate crust with the velocity envelopes of the axial region of the Lucky Strike segment of the MAR (grey solid [Arnulf et al., 2011; Arnulf, 2011]) and young Atlantic crust aged 0 7 Ma (hatched [White et al., 1992]). analysis of the Lucky Strike velocity range for 3-D tomography [Arnulf et al., 2011; Arnulf, 2011] as the representation of non-occ young Atlantic crustal values used for comparison with the Atlantis Massif results (Figure 7c) Strike-Parallel Lines (Lines A6, A4, A5) [30] The westernmost and central ridge-parallel lines (A6 and A4, respectively; Figures 6a and 6b) show a similar overall velocity pattern consisting of high velocities near the surface in the center of the lines grading into lower velocities on the south and north ends. Line A6, in older crust, however, exhibits a thicker section of lower velocities over the central part of the line when compared with line A4. The portion of line A6 between 3.5 km and 0.5 km in model space is also the location of highest velocity, with values >7.5 km/s at the base of the coverage (1500 mbsf). The Southern Ridge velocities of 3 5 km/s contrast with the Central Dome velocities of km/s as pointed out by Canales et al. [2008]. [31] Line A5, the easternmost ridge-parallel line crossing the remnant piece of hanging wall block, shows very low velocities similar to those obtained for young, volcanic Atlantic crust using the SOBE method at the Lucky Strike segment of the MAR (Figure 7c) [Arnulf et al., 2011]. These low velocities grade laterally very rapidly into high velocities in the 5 6 km/s range where the profile images the eastern flank of the Southern Ridge (Figure 6c). Neither here nor on line A10 do our inversions image a distinct velocity feature that might correspond to a detachment fault zone beneath the hanging wall. This could reflect a lack of distinct velocity structure or it could reflect the limited resolution of our models (100 m) compared to the expected thickness of the detachment zone ( m), based on structural and metamorphic geology studies at Atlantis Massif [e.g., Schroeder and John, 2004; Karson et al., 2006; Blackman et al., 2011; McCaig et al., 2010] Strike-Perpendicular Lines (Lines A9, A10) [32] The two spreading-parallel lines, A10 and A9 (Figures 6d and 6e, respectively), are the most 11 of 25
12 heterogeneous in terms of velocity structure. Line A9, sampling the Southern Ridge, has velocities as high as 5 km/s directly at the seafloor on the eastern flank. The top portion of the massif in the central and western Southern Ridge and its western flank are significantly different than its eastern flank. A transition takes place across a few hundred meters lateral distance from high surface velocities in the east down to low values between km/s in the center and western portions (Figure 6e). In the central and western Southern Ridge, velocity structure is similar to, but slightly faster than, young Atlantic crust (Figure 7b) [Arnulf et al., 2011]. [33] For line A10 crossing the Central Dome, the highest subseafloor velocities (>5.5 km/s) are near the shallowest part of the Central Dome, several kilometers to the west of the high velocity peak of line A9. To the west in profile A10, as in A9, velocity values rapidly transition to significantly reduced crustal values over a few hundred horizontal meters (Figure 6d). These lowest velocities are found on the westernmost part of the line nearest the breakaway. On the eastern flank, line A10 samples the low velocity hanging wall underlain within 500 meters subseafloor by velocities >5 km/s Conjugate Ridge Flank Line A8 [34] Line A8 (Figure 6f) runs along crust that was accreted at the time of formation of the OCC but was transferred to the conjugate flank, therefore it was part of the hanging wall to the detachment fault. Seafloor morphology along the line is characteristic of volcanic terrain [e.g., Smith and Cann, 1993], suggesting that this profile represents primarily structure corresponding to extrusive volcanics. This profile shows overall less heterogeneity than the rest of the models, and its average velocity is the lowest of all (Figures 6 and 7c). It shows similar structure to the northern section of A5 over the hanging wall, with shallow most velocities of 2 km/s increasing to 5 km/s at 1.5 km bsf Model Resolution [35] Very dense ray coverage exists in the portions of the models presented (down to 1.5 km; Figure 6) with the exception of small slivers <100 m wide at the trailing end of the lines. The models are truncated (in white) in areas where rays only provide nominal influence on the structure. Thus we can resolve nearly all structure greater than a couple hundred meters in size. [36] In areas where residuals are non-zero indicating an imperfect fit to the data (Figure 4), uncertainty of the models is modest. On line A6 for example, the nearest offset residuals are consistently about 50 ms (Figure 4a); we attribute this to a possible thin low velocity layer that is difficult for the inversion to resolve. In order to reconcile this 50 ms discrepancy, the topmost layer of line A6 (150 m and 3.5 km/s in preferred model) would need to be 170 m thicker or 0.5 km/s slower. 4. Discussion 4.1. SOBE [37] This study provides the first application of the SOBE technique in a shallow, high-relief topographic area with subsurface structure consisting of very high velocities and gradients. The SOBE technique provides improvement over regular shot gathers in areas of shallow, smooth topography and high subsurface velocities. In these areas, such as over the eastern Southern Ridge and atop the Central Dome, SOBE gathers show clear, robust, and coherent arrivals that are easily tracked and picked (Figures 2b and 3a). During the downward continuation process, few processing artifacts obscure the data in these settings. [38] In areas of rougher topography, SOBE produces data of high enough quality to obtain a reasonable model, which may not be the case for standard surface data. In these rough areas, such as the hanging wall of line A5, refractions are weaker and arrivals are shorter than in areas of smooth topography and high velocities (Figure 3), but nonetheless SOBE provides an improvement over standard shot gathers in these areas. [39] As evidenced by the residuals for line A5, great improvement in the fit of the model occurs over the high velocity, shallow Southern Ridge portion of the profile (Figure 4c, x = 14 to 9 km). Over the rough topography and very low velocity portion of this line (Figure 3c, x = 4 to6km),thereisa broader range of residual values that have no coherent distribution. Roughness of topography causing side scatter together with slight misfit between centerbeam bathymetry and seismically determined seafloor may also contribute to this problem Lithology/Velocity Correlation [40] Lithologic interpretations of our seismic results are guided by groundtruth data. As seismic velocities are non-unique and individual outcrops may 12 of 25
13 be smaller than the dimensions we can resolve, we aim to interpret general, dominant lithologies only. Some rock types have characteristic velocity ranges that may overlap, so we use available independent constraints to distinguish between lithologies. With the exception of the drill site on the Central Dome, all samples from Atlantis Massif are from within 500 m of the pre-mass wasting surface of the OCC [Schroeder and John, 2004]; headwall scarps at the top of the South Wall allow seafloor access beyond the typical few meters. In Figure 6, we project onto each profile the results of rock sampling within 2 km of a given profile so seismic structure can be readily compared with surface samples Relatively High Velocity Body (HVB) [41] At Atlantis Massif, our models show high seismic velocities, 5 km/s or greater, outcropping essentially at the seafloor or within a couple hundred meters of the seafloor in several regions. Such high values at shallow depths are atypical for young Atlantic crust based on previous seismic studies [White et al., 1992; Hussenoeder et al., 2002; Arnulf et al., 2011; Arnulf, 2011], although with the recent recognition of the prevalence of detachment faulting and core complexes at slow spreading centers [Smith et al., 2006, 2008; Escartín et al., 2008] these high velocities may occur more commonly than previously understood. The high velocities are also clearly distinct from the structure on the conjugate flank, which indicates that lithospheric accretion during OCC formation is highly asymmetric. Our seismic results thus support the extensive evidence previously documenting asymmetric lithospheric accretion [e.g., Kuo and Forsyth, 1988; Allerton et al., 2000; Okino et al., 2004]. [42] When addressing the lithologic ambiguity of seismic velocities in this case, we rule out the likelihood that these high velocities represent weakly fractured peridotite or minimally altered serpentinite because we expect degrees of alteration in both cases to exceed those that would produce in situ velocities significantly larger than 5 km/s (see subsequent discussion). Estimates for the amount and degree of serpentinization indicate moderate to major alteration of peridotite has occurred [Blackman et al., 2002; Früh-Green et al., 2003], making minimally serpentinized, or fractured yet unaltered, peridotite unlikely. [43] Instead, this zone of velocities is characterized by the following features previously associated with gabbro [White et al., 1992]: velocities >5.5 km/s close to the seafloor, and a relatively low velocity gradient. IODP Hole U1309D, which is situated within this high velocity zone, retrieved predominantly gabbro down to a depth of km [Blackman et al., 2006, 2011]. The borehole sonic log velocities from U1309D [Collins et al., 2009] are in good agreement with the vertical velocity profile taken from the nearest shot on the line nearest to the location of the drill site (Figure 8a). Canales et al. [2008] also interpret similar seismic velocity structure at the Kane and Dante s Domes OCCs as gabbro based on seafloor samples from Kane and drilling results from Atlantis Bank OCC on the Southwest Indian Ridge [Dick et al., 2000]. We therefore associate the highest velocities in our models, the high velocity body (HVB), with rock of predominantly gabbroic composition. [44] Lines A10 and A9 show that the high velocity body(ies) of the Central Dome occurs 3.5 km to the west of the velocity high in the Southern Ridge (Figures 6d and 6e). Figure 8b shows the approximate extent of the HVB, projected onto the seafloor, based on our models. The peaks of the high velocity material are offset between the Central Dome and Southern Ridge in such a way that high velocity material in the south would have been emplaced Myr later than high velocity material in the Central Dome, assuming that the OCC-bearing ridge flank accommodated % of the uniform full spreading rate of 24 km/myr [Sempéré et al., 1995; Zervas et al., 1995]. Although there is no age dating from the Southern Ridge gabbroic core, age dating performed on material from the IODP drill hole suggests that construction of the Central Dome gabbroic core took place in two magmatic events spanning a period of as much as 0.15 Myr [Grimes et al., 2008]. Therefore, it is possible that the gabbroic core in the Southern Ridge was constructed 3.5 km to the east as part of the second (and perhaps even subsequent) construction event(s). [45] From our seismic results alone however, we cannot definitively distinguish between a high velocity regime that is continuous or made up of discrete few-km scale bodies. In a subsequent section we describe possible scenarios for interplay between detachment faulting and intrusive magmatism that could produce the imaged structure Intermediate-Valued Velocity Layer (IVVL) [46] In contrast to the high velocity areas peaking near the surface of the massif, there are also sections of the models composed of comparatively lower velocity material that are nevertheless distinct 13 of 25


 Bathymetry with surface projection of the lateral extent of the IVVL.")
.")
 [Hussenoeder et al., 2002; Arnulf et al.")
14 Figure 8. Representative vertical velocity profiles of (a) High Velocity Body (HVB), and (c) Intermediate-Valued Velocity Layer (IVVL). Gray shaded region is range of young Atlantic crustal velocities. Magenta curve is sonic log velocities at IODP Hole U1309D, 10 meter running average. (b) Residual Bouguer gravity anomaly (topography, intracrustal interface, and lithospheric cooling corrections made) with surface projection of the lateral extent of the HVB. Solid outline indicates boundary of HVB based on the profiles, dashed outline indicates interpolation between profiles and is guided by gravity contours. Depth to HVB varies slightly within the region. Hole U1309D and location of A4 velocity profile in Figure 8a, are noted by magenta circle and orange plus, respectively. Thin black contours show seafloor depth at 500 m contour interval. (d) Bathymetry with surface projection of the lateral extent of the IVVL. Grayshade increases with depth from shallowest contour (1000 m) with a 250 m contour interval. Colored pluses show locations of profiles in Figure 8c. Projections in Figures 8b and 8d are based on locations in models with 1D velocity structure characteristic of these regimes. from extrusive velocity values (Figure 7b). Characteristics of the Intermediate-Valued Velocity Layer (IVVL) fit within the bounds of typical young Atlantic crustal velocities and gradients [White et al., 1992] but have surface velocities slightly higher than what we now know layer 2A velocities to be (Figure 8c) [Hussenoeder et al., 2002; Arnulf et al., 2011; Arnulf, 2011]. The properties of these packages could indicate a crustal section composed of basalt atop either sheeted dikes [Spudich and Orcutt, 14 of 25


![al. [2011].](/docs-images/88/117539488/images/15-8.jpg "1980] or highly")

 and on surface")


![[47] The strike-parallel](/docs-images/88/117539488/images/15-15.jpg "lines A4 and A6 show that")


15 Geosystems 3 G HENIG ET AL.: ATLANTIS MASSIF DOWNWARD CONTINUED MCS /2012GC Figure 9. Map view of Atlantis Massif showing extent of corrugations, IODP Hole U1309D, sample lithology, and MCS lines. Dashed black line represents subsurface location of possible boundary between Central Dome and Southern Ridge as described in section 4.5. Modified from Blackman et al. [2011]. 1980] or highly serpentinized harzburgite. This is based on groundtruth observations (Figure 9) and on surface velocities in the upper couple hundred meters. The projection of the spatial extent of the IVVL, inferred from our seismic results, onto the seafloor of the massif is shown in Figure 8d. [47] The strike-parallel lines A4 and A6 show that the Southern Ridge and the northernmost 2 5 km of these two profiles are comprised of IVVL packages: km/s at the seafloor increasing to >5.5 km/s at the base of the coverage ( km; Figures 6a and 6b). Submersible dives on the South Wall [Blackman et al., 2002; Kelley et al., 2005; Boschi et al., 2006] recovered many samples of mostly serpentinized harzburgite and lesser gabbros near regions of IVVL velocities. On the Southern Ridge, situated atop IVVL velocities, is the Lost City Hydrothermal Field with a known serpentinite host rock composition [Kelley et al., 2001; FrühGreen et al., 2003; Kelley et al., 2005]. In addition, velocities of the IVVL are significantly faster than those observed along line A5 in the hanging wall and line A8 in the volcanic conjugate crust (Figure 7b), which suggest that they represent lithologies different from extrusive volcanics. We thus equate this IVVL zone with the intermediate V2 velocities of Canales et al. [2008] and attribute them to lithology dominated by serpentinite on the South Wall and western and central Southern Ridge. [48] Seismic velocities of variably altered, hand- sample-size serpentinite from the Mid-Atlantic Ridge at Kane Fracture Zone (MARK), vicinity of the Kane OCC, are presented by Miller and Christensen [1997]. For <90% alteration, measured velocities exceed those we equate with serpentinite. We note, though, that measurements on the MARK samples were made at confining pressures of 200 MPa, corresponding to conditions in the lower crust or upper mantle and ensuring the closure of microcracks within the samples. Confining pressures in the upper kilometer of the Southern Ridge are between MPa. At these pressures, the presence of open microcracks can reduce velocities by up to 0.5 km/s, allowing our measurements to be consistent with smaller degrees of serpentinization. Moreover, in situ velocities measured by seismic waves may also be affected by large scale fracturing or by the mixture of rock compositions found at the Southern Ridge (Figure 9) [Blackman et al., 2002]. These factors cause a reduction in the seismic velocity of the IVVL compared to the serpentinite measurements of Miller and Christensen [1997]. 15 of 25
16 Deformed Sheath Hypothesis [49] The deformed, altered sheath hypothesis [Ildefonse et al., 2007] of OCC formation can be analyzed in context of the seismic velocity models presented here. This hypothesis proposes a strong intrusive core surrounded by a sheath of weakened, serpentinized mantle rock where strain-localization and slip were concentrated during detachment fault initiation. Our models and the drilling results [Blackman et al., 2011] show that mafic intrusions are present in the upper 1.5 km of Atlantis Massif. This requires that these high velocity body(ies) were somehow exhumed from their originally deeper intrusion level, consistent with the deformed sheath hypothesis. The Ildefonse et al. [2007] model requires mafic intrusions at the core of an OCC, but it is unclear whether it requires a centrally located pluton or one skewed toward the breakaway or terminus, as observed from our models. We also observe, at least in the Southern Ridge, surface serpentinites and a velocity profile that is consistent with a deformed altered sheath. Shear zones are observed within this serpentinized material [Schroeder and John, 2004; Karson et al., 2006] where some slip occurred that is consistent with the prediction of Ildefonse et al. [2007]. Our results do not provide enough information to definitively discern whether or not a serpentinized sheath of material encompassed the entire massif during its initial formation. If it existed, a sheath of such extent could have significantly thinned during fault displacement or been rafted away with the hanging wall. Our seismic velocity models are nevertheless consistent with the deformed, altered sheath mechanism for fault initiation and slip Outward-Facing Western Slope [50] Additional low velocities are observed on the western outward-facing slope of the massif located west of x = 10 km in profiles A9 and A10 (Figures 6d and 6e). These velocities are similar to the IVVL but notably have lower velocity gradients in the upper 500 meters (Figure 8c, line A9 at x= 10 km versus line A9 at x = 4.5 km and line A4 at x = 10 km). In contrast, the velocity-depth profile from line A6 in IVVL velocities (Figure 8c) shows a similar velocity gradient to the outwardfacing slope velocities, but the overall velocities are higher. This apparent similarity in gradient is attributed to the inability to resolve the shallowest low velocity layer on line A6 as discussed previously. Preliminary 3D inversions, however, are better able to image a low velocity cap over line A6 further distinguishing it from the outward-facing slope velocity gradients. [51] The outward-facing slope is interpreted as the location of transition into more normal upper crust and probably has an extrusive volcanic top layer. The velocities and gradients are similar to the young Atlantic crustal velocity structure of Arnulf [2011]. This interpretation is consistent with the volcanic ridge described by Smith et al. [2006, 2008]. Volcanic terrain was imaged in Argo-II video near this area ( N, W in Figure 9) [Blackman et al., 2002] and a gravity deficit compared to the surrounding residual Bouguer anomaly points toward the presence of upper crustal rock (Figure 8b) [Blackman et al., 2008]. This interpretation of upper crustal composition requires that the breakaway of the OCC is near x = 10 km in model space on line A9 and is as far east as x = 7 kmon line A10, which is near the location of the breakaway defined by Tucholke et al. [1998] and Canales et al. [2008], in Ma crust (based on magnetic anomalies by Sempéré et al. [1995]); this is very close to the western edge of the Southern Ridge Volcanic Hanging Wall [52] The lowest velocity structure (observed only in line A5 hanging wall and line A8 conjugate crust) most likely composes basalts (Figures 6c and 6f). Rock samples obtained from near where profile A10 crosses these lowest velocities on line A5 consist entirely of basalt. Side-scan images, video, and submersible mapping record pillow basalts and hummocky volcanic structures at the surface in this area of the massif [Blackman et al., 1998, 2002], in support of our interpretation of extrusive volcanic composition. Likewise, seafloor morphology and limited side-scan sonar tracks on the eastern flank of the ridge axis suggest an extrusive volcanic lithology [Blackman et al., 1998] Fresh Mantle [53] Nowhere in our coverage of Atlantis Massif are mantle velocities of 8 km/s or greater observed. An OBS refraction study analyzed deeper velocity structure, to 7 km in parts, and precludes fresh mantle velocities at depths shallower than 4.5 km bsf within the Central Dome of the massif [Blackman and Collins, 2010]. The lack of evidence for fresh mantle rocks does not preclude the presence of ultramafic rocks within the massif with velocities lower than 8 km/s due either to cracks and fractures or to alteration. Indeed, as discussed 16 of 25
Seismic Velocity Variation within the Footwall of an Oceanic Core Complex Atlantis Massif, Mid-Atlantic Ridge 30 N
 Seismic Velocity Variation within the Footwall of an Oceanic Core Complex Atlantis Massif, Mid-Atlantic Ridge 0 N Ashlee S. Henig, Donna K. Blackman, Alistair J. Harding, Graham M. Kent, Juan-Pablo Canales
G 3. AN ELECTRONIC JOURNAL OF THE EARTH SCIENCES Published by AGU and the Geochemical Society
 Geosystems G 3 AN ELECTRONIC JOURNAL OF THE EARTH SCIENCES Published by AGU and the Geochemical Society Article Volume 9, Number 8 6 August 2008 Q08002, doi: ISSN: 1525-2027 Seismic evidence for large-scale
Lower crustal variability and the crust/mantle transition at the Atlantis Massif oceanic core complex
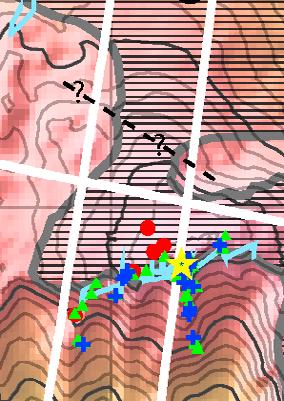
 GEOPHYSICAL RESEARCH LETTERS, VOL. 37,, doi:10.1029/2010gl045165, 2010 Lower crustal variability and the crust/mantle transition at the Atlantis Massif oceanic core complex Donna K. Blackman 1 and John
Widespread active detachment faulting and core complex formation near 13 N on the Mid-Atlantic Ridge
 Nature, 2006 doi:10.1038/nature04950 Widespread active detachment faulting and core complex formation near 13 N on the Mid-Atlantic Ridge Deborah K Smith 1, Johnson R Cann 2 & Javier Escartín 3 1Woods
(my) Current understanding of plate divergence processes at mid-oceanic ridges (in 24 slides)
 Current understanding of plate divergence processes at mid-oceanic ridges (in 24 slides)") (my) Current understanding of plate divergence processes at mid-oceanic ridges (in 24 slides) q 1962-2018 mid-ocean ridge processes (magmatism, tectonics, hydrothermalism) : discoveries, evolving concepts,
(my) Current understanding of plate divergence processes at mid-oceanic ridges (in 24 slides) q 1962-2018 mid-ocean ridge processes (magmatism, tectonics, hydrothermalism) : discoveries, evolving concepts,
Data Repository Item
 Data Repository Item 2009003 An abrupt transition from magma-starved to magma-rich rifting in the eastern Black Sea Donna J. Shillington, Caroline L. Scott, Timothy A. Minshull, Rosemary A. Edwards, Peter
A N 62d. Oceanic Crust. 'hot 7-- Jeffrey A. Karson
 DEFENSE TECHNICAL INFORMATION CENTER 4583 FINAL REI)(.LiT ONR Grant N00014-90-J-1043 Variations in Tectonic Extension Along Slow-Spreading Ridge Axes: Implications for the Internal Structure and Bathymetry.of
Earthquakes. Earthquakes are caused by a sudden release of energy
 Earthquakes Earthquakes are caused by a sudden release of energy The amount of energy released determines the magnitude of the earthquake Seismic waves carry the energy away from its origin Fig. 18.1 Origin
The influence of short wavelength variations in viscosity on subduction dynamics
 1 Introduction Deformation within the earth, driven by mantle convection due primarily to cooling and subduction of oceanic lithosphere, is expressed at every length scale in various geophysical observations.
SITE SURVEY FOR SITE 410, AN EXAMPLE OF THE USE OF LONG-RANGE SIDE-SCAN SONAR (GLORIA)
") 10. SITE SURVEY FOR SITE 410, AN EXAMPLE OF THE USE OF LONG-RANGE SIDE-SCAN SONAR (GLORIA) R. C. Searle and A. S. Laughton, Institute of Oceanographic Sciences, Wormley, GU8 5UB, UK and B. D. Loncarevic,
10. SITE SURVEY FOR SITE 410, AN EXAMPLE OF THE USE OF LONG-RANGE SIDE-SCAN SONAR (GLORIA) R. C. Searle and A. S. Laughton, Institute of Oceanographic Sciences, Wormley, GU8 5UB, UK and B. D. Loncarevic,
Evidence of an axial magma chamber beneath the ultraslow spreading Southwest Indian Ridge
 GSA Data Repository 176 1 5 6 7 9 1 11 1 SUPPLEMENTARY MATERIAL FOR: Evidence of an axial magma chamber beneath the ultraslow spreading Southwest Indian Ridge Hanchao Jian 1,, Satish C. Singh *, Yongshun
Seismic tests at Southern Ute Nation coal fire site
 Seismic tests at Southern Ute Nation coal fire site Sjoerd de Ridder and Seth S. Haines ABSTRACT We conducted a near surface seismic test at the Southern Ute Nation coal fire site near Durango, CO. The
Suzanne Picazo, Mathilde Cannat, Adelie Delacour, Javier Escartın, Stephane Roumejon, and Serguei Silantyev
 Correction Volume 14, Number 8 16 August 2013 doi: ISSN: 1525-2027 Correction to Deformation associated with the denudation of mantle-derived rocks at the Mid- Atlantic Ridge 13 15 N: The role of magmatic
Plate Tectonics on a Plane. Observations related to plate tectonics " " Plate tectonic theory types of plate boundaries!
 Plate Tectonics on a Plane Scripps Inst. Of Oceanography" Observations related to plate tectonics " Ocean and continent topography, hypsometry, and crustal thickness. Global seismicity, Benioff zones,
Geochemistry, Geophysics, Geosystems. Supporting Information for
 Geochemistry, Geophysics, Geosystems Supporting Information for Segment-scale variations in seafloor volcanic and tectonic processes from multibeam sonar imaging, Mid-Atlantic Ridge Rainbow region (35º45-36º35
Data Repository Item For: Kinematics and geometry of active detachment faulting beneath the TAG hydrothermal field on the Mid-Atlantic Ridge
 GSA Data Repository Item: 2007183 Data Repository Item For: Kinematics and geometry of active detachment faulting beneath the TAG hydrothermal field on the Mid-Atlantic Ridge Brian J. demartin 1*, Robert
Plate Tectonics. entirely rock both and rock
 Plate Tectonics I. Tectonics A. Tectonic Forces are forces generated from within Earth causing rock to become. B. 1. The study of the origin and arrangement of Earth surface including mountain belts, continents,
Earth s Continents and Seafloors. GEOL100 Physical Geology Ray Rector - Instructor
 Earth s Continents and Seafloors GEOL100 Physical Geology Ray Rector - Instructor OCEAN BASINS and CONTINENTAL PLATFORMS Key Concepts I. Earth s rocky surface covered by of two types of crust Dense, thin,
IODP Science Evaluation Panel: Guidelines and Rationale for Site Characterization Data (Revised: August 2013)
") Site Characterization Data Guidelines IODP Science Evaluation Panel: Guidelines and Rationale for Site Characterization Data (Revised: August 2013) This document outlines the method and rationale for data
Site Characterization Data Guidelines IODP Science Evaluation Panel: Guidelines and Rationale for Site Characterization Data (Revised: August 2013) This document outlines the method and rationale for data
29. IMPLICATIONS OF DEEP SEA DRILLING, SITES 186 AND 187 ON ISLAND ARC STRUCTURE
 29. IMPLICATIONS OF DEEP SEA DRILLING, SITES 186 AND 187 ON ISLAND ARC STRUCTURE John A. Grow 1, Marine Physical Laboratory, Scripps Institution of Oceanography, La Jolla, California INTRODUCTION Pacific
C5 Magnetic exploration methods data analysis techniques
 C5 Magnetic exploration methods data analysis techniques C5.1 Data processing and corrections After magnetic field data have been collected a number of corrections are applied to simplify the interpretation.
G 3. Heather Sloan Lehman College, City University of New York, 250 Bedford Park Boulevard West, Bronx, New York 10468, USA
 Geosystems G 3 AN ELECTRONIC JOURNAL OF THE EARTH SCIENCES Published by AGU and the Geochemical Society Reconstruction of the flanks of the Mid-Atlantic Ridge, 28 to 29 N: Implications for evolution of
24. Ocean Basins p
 24. Ocean Basins p. 350-372 Background The majority of the planet is covered by ocean- about %. So the majority of the Earth s crust is. This crust is hidden from view beneath the water so it is not as
Distortion Effects of Faults on Gravity Worm Strings Robin O Leary
 Distortion Effects of Faults on Gravity Worm Strings Robin O Leary Problem Can upward continued gravity anomaly worm strings be used as a tool to determine the dip direction of an offsetting structure
3. PLATE TECTONICS LAST NAME (ALL IN CAPS): FIRST NAME: PLATES
: FIRST NAME: PLATES") LAST NAME (ALL IN CAPS): FIRST NAME: PLATES 3. PLATE TECTONICS The outer layers of the Earth are divided into the lithosphere and asthenosphere. The division is based on differences in mechanical properties
LAST NAME (ALL IN CAPS): FIRST NAME: PLATES 3. PLATE TECTONICS The outer layers of the Earth are divided into the lithosphere and asthenosphere. The division is based on differences in mechanical properties
A) B) C) D) 4. Which diagram below best represents the pattern of magnetic orientation in the seafloor on the west (left) side of the ocean ridge?
 B) C) D) 4. Which diagram below best represents the pattern of magnetic orientation in the seafloor on the west (left) side of the ocean ridge?") 1. Crustal formation, which may cause the widening of an ocean, is most likely occurring at the boundary between the A) African Plate and the Eurasian Plate B) Pacific Plate and the Philippine Plate C)
1. Crustal formation, which may cause the widening of an ocean, is most likely occurring at the boundary between the A) African Plate and the Eurasian Plate B) Pacific Plate and the Philippine Plate C)
Long before the plate-tectonic revolution
 Discovery of Megamullions Reveals Gateways Into the Ocean Crust and Upper Brian E. Tucholke Senior Scientist, Geology & Geophysics Department Long before the plate-tectonic revolution began in the 1960s,
Late 20 th Century Tests of the Continental Drift Hypothesis
 Late 20 th Century Tests of the Continental Drift Hypothesis 5 Characteristics of the Ocean Trenches Unless otherwise noted the artwork and photographs in this slide show are original and by Burt Carter.
Appendix B: Geophysical Data (Thesis Appendix, 2013)
") Utah State University From the SelectedWorks of David J Richey 2013 Appendix B: Geophysical Data (Thesis Appendix, 2013) David J Richey, Utah State University Available at: https://works.bepress.com/david_richey/2/
Utah State University From the SelectedWorks of David J Richey 2013 Appendix B: Geophysical Data (Thesis Appendix, 2013) David J Richey, Utah State University Available at: https://works.bepress.com/david_richey/2/
Observation of shear-wave splitting from microseismicity induced by hydraulic fracturing: A non-vti story
 Observation of shear-wave splitting from microseismicity induced by hydraulic fracturing: A non-vti story Petr Kolinsky 1, Leo Eisner 1, Vladimir Grechka 2, Dana Jurick 3, Peter Duncan 1 Summary Shear
Three-dimensional seismic structure of the Mid-Atlantic Ridge (35 N): Evidence for focused melt supply and lower crustal dike injection
: Evidence for focused melt supply and lower crustal dike injection") JOURNAL OF GEOPHYSICAL RESEARCH, VOL. 110,, doi:10.1029/2004jb003473, 2005 Three-dimensional seismic structure of the Mid-Atlantic Ridge (35 N): Evidence for focused melt supply and lower crustal dike
JOURNAL OF GEOPHYSICAL RESEARCH, VOL. 110,, doi:10.1029/2004jb003473, 2005 Three-dimensional seismic structure of the Mid-Atlantic Ridge (35 N): Evidence for focused melt supply and lower crustal dike
GJI Geodesy, potential field and applied geophysics. REVIEW ARTICLE Geophysical signatures of oceanic core complexes
 Geophys. J. Int. (2009) 178, 593 613 doi: 10.1111/j.1365-246X.2009.04184.x REVIEW ARTICLE Geophysical signatures of oceanic core complexes Donna K. Blackman, 1 J. Pablo Canales 2 and Alistair Harding 1
G 3. AN ELECTRONIC JOURNAL OF THE EARTH SCIENCES Published by AGU and the Geochemical Society
 Geosystems G 3 AN ELECTRONIC JOURNAL OF THE EARTH SCIENCES Published by AGU and the Geochemical Society Article Volume 8, Number 8 9 August 2007 Q08004, doi:10.1029/2007gc001629 ISSN: 1525-2027 Click Here
Ocean Crustal Magnetization and Magnetic Anomalies
 Ocean Crustal Magnetization and Magnetic Anomalies Anomaly and magnetization basics Lavas as largest magnetic source what controls their magnetization? Do lower crustal layers contribute? Magnetic anomalies
FloatSeis Technologies for Ultra-Deep Imaging Seismic Surveys
 FloatSeis Technologies for Ultra-Deep Imaging Seismic Surveys 25 th January, 2018 Aleksandr Nikitin a.nikitin@gwl-geo.com Geology Without Limits Overview 2011-2016 GWL Acquired over 43000 km 2D seismic
Marine Science and Oceanography
 Marine Science and Oceanography Marine geology- study of the ocean floor Physical oceanography- study of waves, currents, and tides Marine biology study of nature and distribution of marine organisms Chemical
Topic 12: Dynamic Earth Pracatice
 Name: Topic 12: Dynamic Earth Pracatice 1. Earth s outer core is best inferred to be A) liquid, with an average density of approximately 4 g/cm 3 B) liquid, with an average density of approximately 11
10. Paleomagnetism and Polar Wandering Curves.
 Map of ocean floor Evidence in Support of the Theory of Plate Tectonics 10. Paleomagnetism and Polar Wandering Curves. The Earth's magnetic field behaves as if there were a bar magnet in the center of
Chapter 7 Plate Tectonics
 Chapter 7 Plate Tectonics Earthquakes Earthquake = vibration of the Earth produced by the rapid release of energy. Seismic Waves Focus = the place within the Earth where the rock breaks, producing an earthquake.
Magnetic Case Study: Raglan Mine Laura Davis May 24, 2006
 Magnetic Case Study: Raglan Mine Laura Davis May 24, 2006 Research Objectives The objective of this study was to test the tools available in EMIGMA (PetRos Eikon) for their utility in analyzing magnetic
G 3. AN ELECTRONIC JOURNAL OF THE EARTH SCIENCES Published by AGU and the Geochemical Society
 Geosystems G 3 AN ELECTRONIC JOURNAL OF THE EARTH SCIENCES Published by AGU and the Geochemical Society Article Volume 5, Number 2 13 February 2004 Q02004, doi:10.1029/2003gc000584 ISSN: 1525-2027 Generation
Static Corrections for Seismic Reflection Surveys
 Static Corrections for Seismic Reflection Surveys MIKE COX Volume Editors: Series Editor: Eugene F. Scherrer Roland Chen Eugene F. Scherrer Society of Exploration Geophysicists Tulsa, Oklahoma Contents
G 3. AN ELECTRONIC JOURNAL OF THE EARTH SCIENCES Published by AGU and the Geochemical Society
 Geosystems G 3 AN ELECTRONIC JOURNAL OF THE EARTH SCIENCES Published by AGU and the Geochemical Society Article Volume 11, Number 2 2 February 2010 Q02001, doi: ISSN: 1525-2027 Click Here for Full Article
2008 Monitoring Research Review: Ground-Based Nuclear Explosion Monitoring Technologies
 STRUCTURE OF THE KOREAN PENINSULA FROM WAVEFORM TRAVEL-TIME ANALYSIS Roland Gritto 1, Jacob E. Siegel 1, and Winston W. Chan 2 Array Information Technology 1 and Harris Corporation 2 Sponsored by Air Force
Controlled-source electromagnetic imaging of the Middle America Trench o"shore Nicaragua
 Controlled-source electromagnetic imaging of the Middle America Trench o"shore Nicaragua Kerry Key Scripps Institution of Oceanography Collaborators: Samer Naif (SIO, now LDEO), Steven Constable (SIO),
Beneath our Feet: The 4 Layers of the Earty by Kelly Hashway
 Beneath our Feet: The 4 Layers of the Earty by Kelly Hashway The Earth is more than a giant ball made up of dirt, rocks, and minerals. The Earth may look like a giant ball from when looking at it from
OCEAN/ESS 410. Lab 10. Geological Mapping of the East Pacific Rise
 Lab 10. Geological Mapping of the East Pacific Rise In this map you are going to be working with GeoMapApp to look at a very high resolution bathymetry map of the East Pacific Rise and at photographs taken
PART A: Short-answer questions (50%; each worth 2%)
") PART A: Short-answer questions (50%; each worth 2%) Your answers should be brief (just a few words) and may be written on these pages if you wish. Remember to hand these pages in with your other exam pages!
PART A: Short-answer questions (50%; each worth 2%) Your answers should be brief (just a few words) and may be written on these pages if you wish. Remember to hand these pages in with your other exam pages!
L.O: THE CRUST USE REFERENCE TABLE PAGE 10
 USE REFERENCE TABLE PAGE 10 1. The oceanic crust is thought to be composed mainly of A) granite B) sandstone C) basalt D) rhyolite 2. To get sample material from the mantle, drilling will be done through
Plate Tectonics - Demonstration
 Name: Reference: Prof. Larry Braile - Educational Resources Copyright 2000. L. Braile. Permission granted for reproduction for non-commercial uses. http://web.ics.purdue.edu/~braile/indexlinks/educ.htm
Seismic Reflection Imaging across the Johnson Ranch, Valley County, Idaho
 Seismic Reflection Imaging across the Johnson Ranch, Valley County, Idaho Report Prepared for the Skyline Corporation Lee M. Liberty Center for Geophysical Investigation of the Shallow Subsurface (CGISS)
What Forces Drive Plate Tectonics?
 What Forces Drive Plate Tectonics? The tectonic plates are moving, but with varying rates and directions. What hypotheses have been proposed to explain the plate motion? Convection Cells in the Mantle
of other regional earthquakes (e.g. Zoback and Zoback, 1980). I also want to find out
. I also want to find out") 4. Focal Mechanism Solutions A way to investigate source properties of the 2001 sequence is to attempt finding well-constrained focal mechanism solutions to determine if they are consistent with those
4. Focal Mechanism Solutions A way to investigate source properties of the 2001 sequence is to attempt finding well-constrained focal mechanism solutions to determine if they are consistent with those
Global Tectonics. Kearey, Philip. Table of Contents ISBN-13: Historical perspective. 2. The interior of the Earth.
 Global Tectonics Kearey, Philip ISBN-13: 9781405107778 Table of Contents Preface. Acknowledgments. 1. Historical perspective. 1.1 Continental drift. 1.2 Sea floor spreading and the birth of plate tectonics.
Standard 2, Objective 1: Evaluate the source of Earth s internal heat and the evidence of Earth s internal structure.
 Standard 2: Students will understand Earth s internal structure and the dynamic nature of the tectonic plates that form its surface. Standard 2, Objective 1: Evaluate the source of Earth s internal heat
2. TECTONIC FABRIC OF THE SEAFLOOR NEAR NORTH CENTRAL ATLANTIC DRILL SITES 1
 2. TECTONIC FABRIC OF THE SEAFLOOR NEAR NORTH CENTRAL ATLANTIC DRILL SITES 1 S. C. Cande, Lamont-Doherty Geological Observatory R. C. Searle, Institute of Oceanographic Sciences and I. Hill, University
Dynamic Crust Practice
 1. Base your answer to the following question on the cross section below and on your knowledge of Earth science. The cross section represents the distance and age of ocean-floor bedrock found on both sides
G 3. AN ELECTRONIC JOURNAL OF THE EARTH SCIENCES Published by AGU and the Geochemical Society
 Geosystems G 3 AN ELECTRONIC JOURNAL OF THE EARTH SCIENCES Published by AGU and the Geochemical Society Article Volume 8, Number 6 28 June 2007 Q06015, doi:10.1029/2006gc001567 ISSN: 1525-2027 Nonvolcanic
G 3. AN ELECTRONIC JOURNAL OF THE EARTH SCIENCES Published by AGU and the Geochemical Society
 Geosystems G 3 AN ELECTRONIC JOURNAL OF THE EARTH SCIENCES Published by AGU and the Geochemical Society Article Volume 4, Number 8 1 August 2003 9104, doi:10.1029/2002gc000480 ISSN: 1525-2027 Melt supply
ANGLE-DEPENDENT TOMOSTATICS. Abstract
 ANGLE-DEPENDENT TOMOSTATICS Lindsay M. Mayer, Kansas Geological Survey, University of Kansas, Lawrence, KS Richard D. Miller, Kansas Geological Survey, University of Kansas, Lawrence, KS Julian Ivanov,
Answers: Internal Processes and Structures (Isostasy)
") Answers: Internal Processes and Structures (Isostasy) 1. Analyse the adjustment of the crust to changes in loads associated with volcanism, mountain building, erosion, and glaciation by using the concept
Answers: Internal Processes and Structures (Isostasy) 1. Analyse the adjustment of the crust to changes in loads associated with volcanism, mountain building, erosion, and glaciation by using the concept
Crustal Thickness on the Mid-Atlantic Ridge: Bull's Eye Gravity Anomalies and Focused Accretion
 Reprint Series 29 October 1993, Volume 262, pp. 726-729 Crustal Thickness on the Mid-Atlantic Ridge: Bull's Eye Gravity Anomalies and Focused Accretion Maya Tolstoy, Alistair J. Harding, and John A. Orcutt
9. Density Structure. The Australian Continent: A Geophysical Synthesis Density Structure
 84 The Australian Continent: A Geophysical Synthesis Density Structure 9. Density Structure Although the primary focus for the development of the AuSREM model was the creation of 3-D seismic wavespeed
We A10 12 Common Reflection Angle Migration Revealing the Complex Deformation Structure beneath Forearc Basin in the Nankai Trough
 We A10 12 Common Reflection Angle Migration Revealing the Complex Deformation Structure beneath Forearc Basin in the Nankai Trough K. Shiraishi* (JAMSTEC), M. Robb (Emerson Paradigm), K. Hosgood (Emerson
Geo736: Seismicity along mid-ocean ridges
 Geo736: Seismicity along mid-ocean ridges Course Notes: S. G. Wesnousky Spring 2018 Bathymetric maps show the ocean basins of the world are characteristically divided by a bathymetric ridge. The bathymetric
Palaeozoic oceanic crust preserved beneath the eastern Mediterranean
 Palaeozoic oceanic crust preserved beneath the eastern Mediterranean Roi Granot Magnetic Anomaly Data Total field Three components 75 m 75 m Total field 250 m Overhauser Three-axial fluxgate Overhauser
11. THE OBLIQUE SEISMIC EXPERIMENT ON DEEP SEA DRILLING PROJECT LEG 70 1
 11. THE OBLIQUE SEISMIC EXPERIMENT ON DEEP SEA DRILLING PROJECT LEG 0 1 R. A. Stephen, Woods Hole Oceanographic Institution, Woods Hole, Massachusetts ABSTRACT A bore-hole seismic experiment was carried
A seismic refraction study of the Cocos plate offshore Nicaragua and Costa Rica Harm Van Avendonk (UTIG, UT Austin)
") A seismic refraction study of the Cocos plate offshore Nicaragua and Costa Rica Harm Van Avendonk (UTIG, UT Austin)! October 18, 2012 "#$%&'($)*!+,!-&./(!01!2/(+! Plate tectonics:!!large fluxes of solids
A seismic refraction study of the Cocos plate offshore Nicaragua and Costa Rica Harm Van Avendonk (UTIG, UT Austin)! October 18, 2012 "#$%&'($)*!+,!-&./(!01!2/(+! Plate tectonics:!!large fluxes of solids
SUPPLEMENTARY INFORMATION
 SUPPLEMENTARY INFORMATION Patterns of intraplate volcanism controlled by asthenospheric shear Clinton P. Conrad 1,,*, Todd A. Bianco 1,, Eugene I. Smith 2, and Paul Wessel 1 1 Department of Geology & Geophysics,
Fig Available seismic reflection, refraction, and magnetic profiles from 107 the Offshore Indus Basin close to the representative profile GCDH,
 List of Figures Page No. Fig. 1.1 Generalized physiography of the Indian Ocean along with 2 selected (200 m, 1000 m, 2000 m, and 3000 m) bathymetric contours. Fig. 1.2 Lithospheric plates in the Indian
SEISMIC STRUCTURE, GAS-HYDRATE CONCENTRATIONS, AND SLUMPING ALONG THE IODP X311 TRANSECT ON THE N. CASCADIA MARGIN
 Proceedings of the 6th International Conference on Gas Hydrates (ICGH 2008), Vancouver, British Columbia, CANADA, July 6-10, 2008. SEISMIC STRUCTURE, GAS-HYDRATE CONCENTRATIONS, AND SLUMPING ALONG THE
CHAPTER 2 THE WAY THE EARTH WORKS: EXAMINING PLATE TECTONICS
 CHAPTER 2 THE WAY THE EARTH WORKS: EXAMINING PLATE TECTONICS Coverage of plate tectonics is required early in introductory Geology as context for the mineralogy, petrology, structure, internal processes,
The i-stats: An Image-Based Effective-Medium Modeling of Near-Surface Anomalies Oz Yilmaz*, GeoTomo LLC, Houston, TX
 The i-stats: An Image-Based Effective-Medium Modeling of Near-Surface Anomalies Oz Yilmaz*, GeoTomo LLC, Houston, TX Summary Near-surface modeling for statics corrections is an integral part of a land
Darnley Bay Resources Preliminary Airborne Survey Results
 4 King Street West, Suite 1103 Toronto, Ontario M5H 1B6, Canada Tel:(416) 862-7885 Fax:(416) 862-7889 dbr@darnleybay.com UPDATE Trading Symbol: DBL. TSX Venture Exchange April 19, 2010 Darnley Bay Resources
Seafloor Morphology. Techniques of Investigation. Bathymetry and Sediment Studies
 Seafloor Morphology I f we select a grid for the surface of the earth (i.e. 5 km 2 ) and assign it an average elevation in relation to sea level, we can construct a graph of elevation versus area of the
to: Interseismic strain accumulation and the earthquake potential on the southern San
 Supplementary material to: Interseismic strain accumulation and the earthquake potential on the southern San Andreas fault system by Yuri Fialko Methods The San Bernardino-Coachella Valley segment of the
Long-term survival of the axial valley morphology at abandoned slow-spreading centers
 Long-term survival of the axial valley morphology at abandoned slow-spreading centers Andrew M. Freed Department of Geosciences, University of Arizona, Tucson, Arizona 85721 Jian Lin Peter R. Shaw Woods
4 Deforming the Earth s Crust
 CHAPTER 7 4 Deforming the Earth s Crust SECTION Plate Tectonics BEFORE YOU READ After you read this section, you should be able to answer these questions: What happens when rock is placed under stress?
D) outer core B) 1300 C A) rigid mantle A) 2000 C B) density, temperature, and pressure increase D) stiffer mantle C) outer core
 outer core B) 1300 C A) rigid mantle A) 2000 C B) density, temperature, and pressure increase D) stiffer mantle C) outer core") 1. In which area of Earth's interior is the pressure most likely to be 2.5 million atmospheres? A) asthenosphere B) stiffer mantle C) inner core D) outer core Base your answers to questions 2 and 3 on
1. In which area of Earth's interior is the pressure most likely to be 2.5 million atmospheres? A) asthenosphere B) stiffer mantle C) inner core D) outer core Base your answers to questions 2 and 3 on
Chapter 15 Structures
 Chapter 15 Structures Plummer/McGeary/Carlson (c) The McGraw-Hill Companies, Inc. TECTONIC FORCES AT WORK Stress & Strain Stress Strain Compressive stress Shortening strain Tensional stress stretching
Global geophysics and wave propagation
 Global geophysics and wave propagation Reading: Fowler p76 83 Remote sensing Geophysical methods Seismology Gravity and bathymetry Magnetics Heat flow Seismology: Directly samples the physical properties
Imaging complex structure with crosswell seismic in Jianghan oil field
 INTERPRETER S CORNER Coordinated by Rebecca B. Latimer Imaging complex structure with crosswell seismic in Jianghan oil field QICHENG DONG and BRUCE MARION, Z-Seis, Houston, Texas, U.S. JEFF MEYER, Fusion
UNIT 6 PLATE TECTONICS
 UNIT 6 PLATE TECTONICS CONTINENTAL DRIFT Alfred Wegner proposed the theory that the crustal plates are moving over the mantle. He argued that today s continents once formed a single landmass, called Pangaea
Dynamic Subsidence and Uplift of the Colorado Plateau. Supplementary Material
 GSA DATA REPOSITORY 2010177 Liu and Gurnis Dynamic Subsidence and Uplift of the Colorado Plateau Supplementary Material Lijun Liu and Michael Gurnis Seismological Laboratory California Institute of Technology
Cooling Rates and the Depth of Detachment Faulting At Oceanic Core Complexes: Evidence from Zircon Pb/U and (U-Th)/He Ages
/He Ages") University of Wyoming Wyoming Scholars Repository Geology and Faculty Publications Geology and 3-9-2011 Cooling Rates and the Depth of Detachment Faulting At Oceanic Core Complexes: Evidence from Zircon
University of Wyoming Wyoming Scholars Repository Geology and Faculty Publications Geology and 3-9-2011 Cooling Rates and the Depth of Detachment Faulting At Oceanic Core Complexes: Evidence from Zircon
Map shows 3 main features of ocean floor
 Map shows 3 main features of ocean floor 2017 Pearson Education, Inc. Chapter 3 Marine Provinces 2017 Pearson Education, Inc. 1 Chapter 3 Overview The study of bathymetry determines ocean depths and ocean
Summary. Introduction
 Detailed velocity model building in a carbonate karst zone and improving sub-karst images in the Gulf of Mexico Jun Cai*, Hao Xun, Li Li, Yang He, Zhiming Li, Shuqian Dong, Manhong Guo and Bin Wang, TGS
Two-dimensional Inversion of Resistivity and IP Data with Topography
 Two-dimensional Inversion of Resistivity and IP Data with Topography a) Smooth-Model Resistivity (ohm-m) Elevation (m) b) Calculated Apparent Resistivity (ohm-m) 9 9 9 9 9 9 9 9 9 9 9 9 9 9 9 9 9 9 9 9
LAB 6: TRINIDAD BEACH FIELD TRIP
 OBJECTIVES: LAB 6: TRINIDAD BEACH FIELD TRIP 1) to develop your powers of observation, especially of geological phenomena; 2) to identify the rocks exposed at Trinidad Beach; 3) to reconstruct some of
34. THE GEOLOGICAL AND GEOPHYSICAL SETTING NEAR SITE 462 1
 34. THE GEOLOGICAL AND GEOPHYSICAL SETTING NEAR SITE 462 L. K. Wipperman, 2 Hawaii Institute of Geophysics, University of Hawaii, Honolulu, Hawaii R. L. Larson, 3 Lamont-Doherty Geological Observatory
Igneous Rocks. Igneous Rocks. Genetic Classification of
 Igneous Rocks Fig. 5.1 Genetic Classification of Igneous Rocks Intrusive: crystallized from slowly cooling magma intruded within the Earth s crust; e.g. granite, gabbro 1 Fig. 5.2 Genetic Classification
Geologic and tectonic setting of the MARK area
 University of New Hampshire University of New Hampshire Scholars' Repository Affiliate Scholarship Center for Coastal and Ocean Mapping 1988 Geologic and tectonic setting of the MARK area R. S. Detrick
Chapter 12 Lecture. Earth: An Introduction to Physical Geology. Eleventh Edition. Earth s Interior. Tarbuck and Lutgens Pearson Education, Inc.
 Chapter 12 Lecture Earth: An Introduction to Physical Geology Eleventh Edition Earth s Interior Tarbuck and Lutgens Earth s Internal Structure Earth s interior can be divided into three major layers defined
Alternative Mechanisms for Volcanic Activity in Hotspot-Ridge Systems: The Northern Galapagos Province
 ABSTRACT for the Plume IV Penrose Conference Alternative Mechanisms for Volcanic Activity in Hotspot-Ridge Systems: The Northern Galapagos Province Karen S. Harpp, Colgate University, Department of Geology,
Dynamic Earth A B1. Which type of plate boundary is located at the Jordan Fault? (1) divergent (3) convergent (2) subduction (4) transform
 divergent (3) convergent (2) subduction (4) transform") Dynamic Earth A B1 1. The edges of most lithospheric plates are characterized by (1) reversed magnetic orientation (2) unusually rapid radioactive decay (3) frequent volcanic activity (4) low P-wave and
Dynamic Earth A B1 1. The edges of most lithospheric plates are characterized by (1) reversed magnetic orientation (2) unusually rapid radioactive decay (3) frequent volcanic activity (4) low P-wave and
Lecture #13 notes, Geology 3950 Spring 2006: CR Stern Magnetic reversals (text pages th edition and in the 5 th edition)
") Lecture #13 notes, Geology 3950 Spring 2006: CR Stern Magnetic reversals (text pages 35-37 4 th edition and 53-55 in the 5 th edition) The earth has a magnetic field generated by circulation of charged
Lecture #13 notes, Geology 3950 Spring 2006: CR Stern Magnetic reversals (text pages 35-37 4 th edition and 53-55 in the 5 th edition) The earth has a magnetic field generated by circulation of charged
Chapter 2 Plate Tectonics and the Ocean Floor
 Chapter 2 Plate Tectonics and the Ocean Floor Matching. Match the term or person with the appropriate phrase. You may use each answer once, more than once or not at all. 1. hydrothermal vents A. convergent
Questions and Topics
 Plate Tectonics and Continental Drift Questions and Topics 1. What are the theories of Plate Tectonics and Continental Drift? 2. What is the evidence that Continents move? 3. What are the forces that
Science Starter. Describe in your own words what an Earthquake is and what causes it. Answer The MSL
 Science Starter Describe in your own words what an Earthquake is and what causes it. Answer The MSL WHAT IS AN EARTHQUAKE AND HOW DO WE MEASURE THEM? Chapter 8, Section 8.1 & 8.2 Looking Back Deserts Wind-shaped
Lab 1: Plate Tectonics April 2, 2009
 Name: Lab 1: Plate Tectonics April 2, 2009 Objective: Students will be introduced to the theory of plate tectonics and different styles of plate margins and interactions. Introduction The planet can be