Annual report for the Norwegian National Seismic Network
|
|
|
- Clifford Dixon
- 5 years ago
- Views:
Transcription

1 Annual report for the Norwegian National Seismic Network 2015 Supported by University of Bergen and Norwegian Oil and Gas Association Prepared by Department of Earth Science University of Bergen Allegaten 41, N-5007 Bergen April 2016
2 2
3 CONTENTS 1 Introduction Data availability to the public Operation NNSN The NORSAR stations and arrays Field stations and technical service NNSN NNSN achievements and plans NNSN achievements in NNSN plans for Projects related to NNSN Seismicity of Norway and surrounding areas for Velocity models and magnitude relations Events recorded by the NNSN The seismicity of Norway and adjacent areas Scientific studies P-wave polarization at NNSN for the investigation of local anisotropy and lateral heterogeneity Magnitude scale for earthquakes along the mid-atlantic Ridges in Offshore Norway Development of a 3-D velocity model for Norway Testing of a method for distinguishing between earthquakes and explosions Relocating seismicity using a Bayesian hierarchical multiple event location algorithm Publications and presentations of NNSN data during Publications Master degree thesis, UiB Reports Oral presentations Poster presentations References... 52
4
5 1 Introduction This annual report for the Norwegian National Seismic Network (NNSN) covers operational aspects for the seismic stations contributing data, presents the seismic activity in the target areas and the associated scientific work carried out under the project. The report is prepared by the University of Bergen with contributions from NORSAR. The NNSN network is supported by the oil industry through the Norwegian Oil and Gas Association and the University of Bergen (UiB). 1.1 Data availability to the public All the data stored in the NNSN database are available to the public via Internet, or on manual request. The main web-portal for earthquake information is It is possible to search interactively for specific data and then download the data from ftp://ftp.geo.uib.no/pub/seismo/data. Data are processed as soon as possible and updated lists of events recorded by Norwegian stations are available soon after recording. These pages are automatically updated with regular intervals. 2 Operation 2.1 NNSN The University of Bergen (UiB) has the main responsibility to run the NNSN and operates 33 of the seismic stations that form the NNSN located as seen in Figure 1. NORSAR operates 3 seismic arrays, which also include broadband instruments, and three single seismometer stations (JETT, JMIC and AKN). In addition to the NNSN stations, waveform data from other selected stations in Finland (University of Helsinki), Denmark (GEUS), Sweden (University of Uppsala) and Great Britain (BGS) are transferred in real time and included in the NNSN database. More than 20 stations located in or operated by neighbouring countries are recorded continuously in Bergen and can be used for locating earthquakes, see Figure 1 and Figure 2. Phase data from arrays in Russia (Apatity), Finland (Finess), Sweden (Hagfors) and stations operated by the British Geological Survey (BGS) are also included when available. The seismicity detected by the network is processed at UiB, however NORSAR also integrates their results in the joint database at UiB. In total, NORSAR provides data from 12 broadband stations to the NNSN. One station with real-time data is provided from the Ekofisk field by ConocoPhillips. The station HSPB is operated jointly between NORSAR and the Geophysical Institute, Polish Academy of Sciences, Warsaw, Poland and the stations BRBA and BRBB are a collaboration between NORSAR and the Kola Science Centre, Russian Academy of Sciences, Apatity, Russia. BRBA and BRBB are both located in Barentsburg, Svalbard. 1

6 At NORSAR the parameters of analyst-reviewed events are converted into parameter files in Nordic format and forwarded via ftp to UiB on a daily basis. The magnitude threshold is set to about M 1.5 for regional events of potential interest for the NNSN. After transferring the parameter files, the NORSAR analyst logs into the the UiB database using SEISAN and integrates the events. Integration means to merge NORSAR and UiB events, which may require to repick seismic phases, to include new phase readings, to edit double phase readings and to relocate the seismic event with the new parameters. Figure 1. Stations contributing to the Norwegian National Seismic network (NNSN). UiB operates 33 stations (red) and NORSAR operates the stations marked in blue, including the three arrays and stations AKN and JMIC. Seismic data recorded at stations located on Greenland and operated by GEUS are included in the NNSN real-time processing, Figure 2. These data are important for the location of earthquakes west of Jan Mayen and at the northern part of the Knipovich ridge to the Gakkel ridge. 2

7 Figure 2. Seismic stations in the arctic area. UiB is in the process of upgrading the NNSN by changing short period (SP) to broadband (BB) seismometers. A further effort is made to install additional high quality digitizers. The current status of this upgrade is shown in Table 1. As of today the numbers of SP, BB stations and stations with real time transmission are listed in Table 1. Table 1. Overview of UiB seismic stations Short Period Broadband Real time Number of stations (20 with natural period greater than 100 sec) 30 (not real time are 2 short period and 1 broadband stations on Jan Mayen) The operational stability for each station is shown in Table 2. The down time is computed from the amount of data that are missing from the continuous recordings at UiB. The statistics will, therefore, also show when a single component is not working. This is done as the goal is to obtain as complete continuous data from all stations as possible. Also, communication or 3
8 computing problems at the centre will contribute to the overall downtime. In the case of communication problems, a station may not participate in the earthquake detection process, but the data can be used when it has been transferred. Thus, the statistics given allow us to evaluate the data availability when rerunning the earthquake detection not in real-time. The data completeness for the majority of the stations is above 95%, except for the following stations KONS, MOR8 and TBLU (see technical service overview for details). Table 2. Data completeness in % for 2015 for all stations of the NNSN operated by UiB. Station Data completeness % Station Data completeness % Askøy (ASK) 95 Kings Bay (KBS) 99 Bergen (BER) 100 Kongsberg 99 (KONO) Bjørnøya (BJO) 99 Konsvik (KONS) 90 Blåsjø (BLS) 99 Lofoten (LOF) 99 Dombås (DOMB) 100 Mo i Rana 88 (MOR8) Fauske (FAUS) 100 Molde (MOL) 97 Florø (FOO) 96 Namsos (NSS) 100 Hammerfest 100 Odda (OOD1) 95 (HAMF) Homborsund 100 Oslo (OSL) 100 (HOMB) Hopen (HOPEN) 98 Skarslia (SKAR) 100 Høyanger (HYA) 98 Snartemo 100 (SNART) Jan Mayen (JMI) 99 Stavanger (STAV) 99 Jan Mayen (JNE) 99 Steigen (STEI) 99 Jan Mayen (JNW) 99 Stokkvågen 99 (STOK) Karmøy (KMY) 100 Sulen (SUE) 98 Kautokeino (KTK1) 98 Blussuvoll 69 (TBLU) Tromsø (TRO) The NORSAR stations and arrays The NNSN uses selected data (as stated above) from the NORSAR installations that are funded outside the NNSN project. NORSAR is operating the following seismic installations in Norway: 4
9 NOA (southern Norway, array, 42 sites, 7 3C broadband sensors and 35 vertical broadband sensors) ARCES (Finmark, array, 25 sites, 25 3C broadband seismic sensors 80 Hz) SPITS (Spitsbergen, array, 9 sites, 6 3C broadband sensors and 3 vertical broadband sensors) NORES (Hedmark, array, 9 3C short-period sensors, 9 infrasound sensors) JMIC (Jan Mayen, 3C broadband sensor ) AKN (Åknes, Møre og Romsdal, 3C broadband sensor) JETT (Jettan, Troms, 3C broadband sensor) In addition NORSAR receives and processes data in near realtime from: FINES (southern Finland, array, 16 sites, 2 3C broadband sensor, 1 3C short-period sensor and 15 short-period vertical sensors, operated by Institute of Seismology, Helsinki, Finland) HFS (Hagfors, Sweden, 10 sites, 1 3C broadband sensor and 9 short-period vertical sensors, operated by the Swedish Defence Research Agency, Stockholm, Sweden) EKA (Eskdalemuir, United Kingdom, 20 sites, 1 3C broadband sensor and 20 shortperiod vertical sensors, operated by the United Kingdom National Data Centre, AWE Blacknest, UK) The seismic array data are automatically processed and analysed. The fastest near realtime process Automatic Alert is based on single array detection and provides event locations within a few (1-3) minutes delay. The alerts with event and location details are published immediately on (which is also integrated into the NNSN website). A second automatic process called GBF (Generalized Beam Forming) awaits for automatic phase picks from all arrays and delivers more reliable/accurate results within up to a few hours delay. Automatically processed seismic events with magnitude larger than 2 (or 1.5 if the event is of special interest) are manually analysed and reviewed. In this step all available waveforms (also from single stations) are utilized. Graphical displays and parametric event data and for Automatic Alert, GBF and Reviewed bulletins can be found on 5

10 Figure 3 NORSAR seismic arrays/stations (NOA, NORES, ARCES, SPITS, JMIC, AKN, I37H0) and contributing arrays/stations (HFS, FINES, EKA, BRBA, APA). All data recorded at NORSAR are continuous. The following table provides a monthly overview on the data availability of 13 main data streams provided by NORSAR to NNSN. Table 3. Systems recording performance (in % of data completeness) for 14 main data streams provided from NORSAR to NNSN. ARA0 JMIC NAO01 NBO00 NB201 NC204 NC303 Jan Feb Mar Apr May Jun Jul Aug Sep Oct Nov Dec
11 NC405 NC602 SPA0 AKN JETT HFC2 I37H0 Jan Feb Mar Apr May Jun Jul Aug Sep Oct Nov Dec The NORSAR analysis results are based on automatic phase detection and automatic phase associations which produce the automatic bulletin. Based on the automatic bulletin a manual analysis of the data is done, resulting in the reviewed bulletin. The automatic bulletin for northern Europe is created using the Generalized Beam Forming (GBF) method. This bulletin ( is subsequently screened for local and regional events of interest in Fennoscadia and in Norway, which in turn are reviewed by an analyst. Regional reviewed bulletins from NORSAR are available from 1989 and from 1998 onwards they are directly accessible from via internet ( Table 4 gives a summary of the phase detections and events declared by GBF and the analyst. Table 4. Phase detections and event summary. Jan. Feb. March April May June Phase detections Associated phases Un-associated phases Screened GBF events for Fennoscandia/Norway No. of events defined by the analyst July Aug. Sep. October Nov. Dec. Phase detections Associated phases Un-associated phases Screened GBF events for Fennoscandia/Norway No. of events defined by the analyst
12 Changes to the NORSAR arrarys: The NORES array was upgraded from three-component short-period to threecomponent broadband mid of August 2015 ( ). A 3C Guralp broadband sensor was added into the central pit of the infrasound array I37NO in Bardufoss. All 9 digitizers of the SPITS array were replaced. 2.3 Field stations and technical service NNSN The technical changes for each seismic station are listed below. It is noted if these changes are carried out by the respective local contact and not by the technical staff of UiB. When a station stops working, tests are made to locate the problem. Sometimes the reason cannot be found and the cause of the problem will be marked as unknown. Major changes during this reporting period of 2015 were: Ask (ASK) Bergen (BER) Bjørnøya (BJO1) Blåsjø (BLS) Blussvoll (TBLU) : Visit. Malfunctioning digitizer is replaced. The station down from 20. December 2014 and data is lost : Visit: Station was down due to lightning. Changed digitizer, GPSantenna, power supply. Industrial-PC phased out. Removed remains from older installations : Visit. Changed GSM router. Inspection of earth grounding rod and measurement of its resistivity. Checked station coordinates : Visit. Changed GSM router with ICE version : In order to test the STS-2 sensor that was phased out at HOPEN in Sept 2014, we swapped the BER STS-2 unit with the one from HOPEN. Testing started Tue Feb and was completed Thu 5 Feb., when the original BER STS-2 sensor was put into operation again : Visit. Inspection. The digitizer was moved to sensor, GPS antenna installed on nearby pole and mass centered : Local personnel replaced Ethernet Extender unit in sensor box with a spare unit : Station down since due to problems with the internet line (fiber cable). PC removed, now Guralp digitizer installed. The fiber modem replaced with media converter (fiber->ethernet) and a Zyxel router : Visit. PC and power supply replaced : Visit. Replaced serial cable between sensor and recording equipment. Data lost since February 18. Discussed possible new site with Stjørdal Kommune. 8
13 : Local contact installed new industrial PC. Data lost since June : PC problem. Local contact installed and tested SMS reset device. Replaced industrial PC with new unit. Dombås (DOMB) Fauske (FAUS) Florø (FOO) New ICE-router installed by local contact : Local operator. Water, possibly caused by condensation, was removed from the vault. A new lid and gasket were installed to avoid condensation : Local operator. New cable installed between router and digitizer : Local operator. Water removed, attempt to install new router which did not work so the old router was reinstalled. Switched back to the original network cable between router and digitizer : Visit. Changed digitizer and router Communication down since 1. june. The router operated by default in 4G, but FAUS is outside 4G area. Parameter settings changed on router : Replaced lid. Work done by local entrepreneur : Visit for inspection and maintenance : Padlock, pressure-proof entry and tube installed by local operator Adapter installed by local contact : Visit. Replaced the digitizer and power supply. Hammerfest (HAMF) Homborsund (HOMB) Hopen (HOPEN) Høyanger (HYA) Jan Mayen (JMI) JNE No visit or technical changes. No visit or technical changes : Visit. New vault installed. New installation of seismometer, digitizer and telemetry between building and vault : Local staff at Hopen finished the backfilling and the remaining el. work : During October the local staff at Hopen did minor maintenance Short power loss. Restarted the power using sms : Inspection by local operator. Inspected by local operator. No technical changes. 9
14 JNW Karmøy (KMY) Kautokeino (KTK) Kings Bay (KBS) Kongsberg (KONO) Konsvik (KONS) Lofoten (LOF) Mo i Rana (MOR8) Molde (MOL) Namsos (NSS) Odda (ODD1) Oslo (OSL) Skarslia (SKAR) Inspected by local operator. No technical changes Communication down from to A GSM-Mini restart is installed. No data lost : Visit. Replaced the ranger seismometer with a Streckeisen STS-2.5 on loan from Norwegian broadband pool until end of : Masscentering done by local contact : Local contact checked the sensor. No mass-centering needed : Station down since due to broken digitizer. New digitizer installed by local operator. All data from this timeperiod is lost. No visit or technical changes. No visit or technical changes : Station down until April because of power-loss during the Easter vacation. Data lost : PC problem. The local contact absent May New PC installed. Data lost between April 28- May 18. No visit or technical changes : Station has been down since February due to a faulty PC. The PC has been replaced. Data has been lost : Station down from July 19. Resetting of power supply and digitizer done remotely : Power loss due to lightning. New sensor installed, COM 1 and 2 on the industrial PC was defect, but COM 3 and 4 could be used. Data lost. No visit or technical changes : The PC was defect. New PC and modem were shipped to the local contact. Due to holiday the new PC and modem was installed 11 th September. Data is lost between August 28 and September : Visit. Installed new Nanometrics interface cable between digitizer (Güralp DM24-EAM) and sensor (Nanometrics Trillium 120PA). Phased out old cable with two junction boxes : Visit. Inspection : Visit. Inspection. 10
15 Snartemo (SNART) Stavanger (STAV) Steigen (STEI) Stokkvågen (STOK) Sulen (SUE) Tromsø (TRO) No visit or technical changes : Station down until January due to power break at OD. Data lost. No visit or technical changes. No visit or technical changes : Remote restart of GSM-router. Station down some hours. No data lost : Station has been down from April due to a defective PC. PC has been replaced by local operator. Data lost. Vadsø (VADS) : Visit. The vault for the new station was constructed 3 NNSN achievements and plans The overall purpose of the NNSN is to provide data both for scientific studies, but equally important for the routine observation of earthquakes. This in principle means that broadband seismometers are desired at all sites. However, in areas where additional stations are deployed for local monitoring, short-period seismometers are sufficient. The number of broadband seismometers in the network will be increased to replace existing short period instruments. A general goal for the future development has to be to achieve better standardization in particular with the seismometers and digitizers. The total number of stations for now should remain stable, but it is important to improve the overall network performance. 3.1 NNSN achievements in 2015 Two EPOS proposals have been approved, the first (EPOS-IP) will allow UiB to lead IT developments on data and service integration at the European scale; the second (EPOS-N) is funded by the Norwegian Research Council to install new monitoring stations in Northern Norway and the Arctic as well as develop tools for processing and visualization, and provide the different geo-scientific data through a web-portal. Hopen: The seismic station was re-built with a new vault and equipment. The digitizer is now placed at the vault. Bjørnøya (BJO): The station was improved by moving digitizer to the sensor vault. 11
16 OSL, BJO, HOPEN, SKAR : New cabling to connect the Nanometrics sensor to Guralp digitizer without junction boxes has been implemented at a number of sites The new station near Vadsø (VADS) on the Varanger peninsula is under construction. The KTK station has been temporarily upgraded with a broadband seismometer on loan from the Norwegian broadband pool. Initiate the plans for finding new site for station TBLU (Trondheim). The local authority in Stjørdal, north of Trondheim, has been contacted to find a possible site for noise measurements. The manuscript on the seismic noise analysis and interpretation is accepted for publication in Journal of Seismology. The research work at UiB this year was carried out by two guest researchers, Won- Young Kim (Columbia University) and Luigia Cristiano (Kiel University), during the fall, where the focus is on polarization analysis and development of magnitude scales in particular to address the complicated travel paths in the North Atlantic not accounted for in the current magnitude scale. The work is presented in section 5.The research work by NORSAR on travel time inversion is giving first results. 3D crustal velocity models for the southern part of Norway and the Nordland region, and Finnmark were developed (see 5.3) Spectrogram displays have been implemented at UiB to discriminate between explosion and earthquake. In parallel, NORSAR have implemented a tool to objectively discriminate between earthquakes and explosions, based on a method developed at the Institute of Seismology in Helsinki, Finland and applied it to 2 stations of NNSN (see 5.4). NORSAR have relocated earthquakes along the ocean ridges from Jan Mayen to the Gakkel Ridge using NNSN data, together with data from the Danish National Network and global stations. A tool (PQLX) to effectively monitor station noise has been implemented and is used routinely. The station coordinates have been checked and corrected by comparison to online mapping services. The effect of the correction on earthquake location has been systematically investigated. During fall 2015 the Scandinavian countries agreed to get a common classification of recorded events. The classification is continuing and will be finalized during NNSN plans for 2016 Complete the installation of the new station VADS, planned installation spring Upgrade of two short period stations in south-western Norway with a broadband sensor already purchased in Include the new developed magnitude scales into the routine processing. Include the new and improved velocity models for Norway in the routine processing. Integrate Statoil data into the real-time processing. EPOS: Plan locations for new seismic stations in Nordland and the Artic complementing the existing NNSN stations. The research and development activity will continue in close collaboration between UiB and NORSAR. Continue collaboration with NORSAR on data processing through technical visits. 12

17 Improve macroseismic questionnaire in collaboration with other Scandinavian countries. Improve data exchange: o Parametric data from the Icelandic Meteorological Office would increase the location accuracy in the NNSN database for large earthquakes located in the vicinity of Iceland and in the area between Iceland and Jan Mayen. As of today data is available on request. o Integrate more real-time continuous data from stations located in Sweden. 3.3 Projects related to NNSN NEONOR2 The Petromaks funded project NEONOR2 started in 2013 and is a collaboration between NGU, Kartverket, the University of Bergen (UiB), NORSAR, University of Lulea and NPD. As part of the NEONOR2 project 26 temporary seismic stations were deployed. The locations of the NEONOR2 and the NNSN stations are shown in Figure 4. Data from many of the stations are continuously transferred to Bergen and are used in the daily processing. The stations will remain in the field until spring The focus of the seismological component of the project has been to compute fault plane solutions and to obtain more precise relative earthquake locations. Figure 4. Map of stations deployed in Northern Norway in 2013/2014 and the permanent NNSN 13
18 3.3.2 EPOS The European Plate Observing System (EPOS) has started with its implementation phase in the autumn of 2015 ( EPOS-Norway is funded by the Research Council of Norway (RCN) for five years during the period and consists of the following six partner institutions: Department of Earth Science, University of Bergen (GEO-UiB) - coordinator Department of Geosciences, University of Oslo (GEO-UiO) Geological Survey of Norway (NGU) Stiftelsen NORSAR National Mapping Authority (NMA) Christian Michelsen Research AS (CMR) EPOS-Norway has the following three main components: Component-1: Develop a Norwegian EPOS e-infrastructure to integrate the data from the seismological and geodetic networks, as well as the data from the geological and geophysical data repositories, which is in line with European EPOS. Component-2: Improved monitoring capacity in the Arctic, including northern Norway and the Arctic islands. Component-3: Establish a Solid Earth Science Forum for providing a constant feedback mechanism for improved integration of multidisciplinary data, as well as training of young scientists for future utilization of all available solid Earth observational data through a single e-infrastructure. Improved monitoring in the Arctic involves installation of seismological and geodetic stations on Svalbard (6 new installations), Bjørnøya (new 9-component array), Jan Mayen (2 upgrades and 1 new installations) and Northern Norway (7 new installations). 4 Seismicity of Norway and surrounding areas for 2015 The earthquake locations presented have been compiled from all available seismic stations as described above. All phase data are collected by UiB, and a monthly bulletin is prepared and distributed. All local and regional earthquakes recorded on NNSN stations are presented on the web pages and the largest are also ed to the European-Mediterranean Seismological Centre (EMSC) to be published on the EMSC web pages. A brief overview of the events published in the monthly bulletins is given in this annual report. Macroseismic data for the largest felt earthquakes in Norway are collected, and macroseismic maps are presented. Local, regional and teleseismic events that are detected by the UiB network are included. The merging of data between NORSAR and UiB is based on the following principles: i) All local and regional events recorded by NORSAR that are also detected by the NNSN network are included. ii) All local and regional events with local magnitude larger than 1.5 detected by NORSAR and not recorded by the NNSN are included. iii) All teleseismic events recorded by NORSAR and also detected by the NNSN are included. 14
19 iv) All teleseismic events with NORSAR magnitude M b 5.0 are included even not detected by the NNSN. Data from the British Geological Survey (BGS) and the Geological Survey of Denmark and Greenland (GEUS) are included in the database in Bergen following similar criteria as mentioned above, however only events located in the prime area of interest, N and 15 W-35 E, and with magnitude 2.0 are included. Identified earthquakes located in northern Scandinavia, are routinely ed from University of Helsinki and included in the NNSN database following the principles above. Many of the recorded events are explosions. To discriminate between natural earthquakes and manmade explosions the spectrograms are studied. This was introduced after a visit by the processing staff to the University of Helsinki in November 2014, and implemented in the processing in Bergen during spring Velocity models and magnitude relations The velocity model used for locating all local and regional events, except for the local Jan Mayen events, is shown in Table 5 (Havskov and Bungum, 1987). Event locations are performed using the HYPOCENTER program (Lienert and Havskov, 1995) and all processing is performed using the SEISAN data analysis software (Havskov and Ottemöller, 1999). Table 5. Velocity model used for locating all local and regional events, except for the local Jan Mayen events (Havskov and Bungum, 1987). P-wave velocity Depth to layer (km/sec) interface (km) Magnitudes are calculated from coda duration, amplitudes or displacement source spectra. The coda magnitude relation was revised in 2006 (Havskov & Sørensen 2006). The coda wave magnitude scale (M C ) is estimated through the relation M C = log10(t) D 15
20 where T is the coda length in seconds and D is the epicentral distance in km. The new scale made M C more consistent with M L since M C in general is reduced. For this report all data are updated using the new magnitude scale. When instrument corrected ground amplitudes A (nm) are available, local magnitude M L is calculated using the equation given by Alsaker et al. (1991): M L = 1.0 log(a) log(d) D where D is the hypocentral distance in km. The moment magnitude M w is calculated from the seismic moment M 0 using the relation (Kanamori, 1977) M w = 0.67 log(m 0 ) 6.06 The unit of M 0 is Nm. The seismic moment is calculated from standard spectral analysis assuming the Brune model (Brune, 1970) and using the following parameters: Density: 3.0 g/cm 2 Q = 440 f 0.7 P-velocity = 6.2 km/s S velocity = 3.6 km/s For more computational details, see Havskov and Ottemöller, (2003). For the Jan Mayen area, a local velocity model (see Table 6) and coda magnitude scale is used (Andersen, 1987). Table 6. Velocity model used for locating local Jan Mayen events. P-wave velocity Depth to layer (km/sec) interface (km) The coda magnitude scale for Jan Mayen which is used in this report is given by Havskov & Sørensen (2006). This scale was implemented in 2006 but all events used in this report are updated during April/May M C = 3.27 log(t) D where T is the coda duration and D is the epicentral distance in km. The regional and teleseismic events recorded by the network are located using the global velocity model IASPEI91 (Kennett and Engdahl, 1991). Body wave magnitude is calculated using the equation by Veith and Clawson (1972): 16
: Ms = log(a/t) + 1.66 log(d) + 3.")
21 Mb = log(a/t) + Q(D,h) Here h is the hypocentre depth (km), A is the amplitude (microns), T is period in seconds and Q(D,h) is a correction for distance and depth. Surface wave magnitude Ms is calculated using the equation (Karnik et al., 1962): Ms = log(a/t) log(d) where A is the amplitude (microns), T is period in seconds and D is the hypocentral distance in degrees. Starting from January 2001, the European Macroseismic Scale, EMS98, (Grünthal, 1998) has been used. All macroseismic intensities mentioned in the text will refer to the EMS98 instead of the previously used Modified Mercalli Intensity scale. The two scales are very similar at the lower end of the scale for intensities less than VII. 4.2 Events recorded by the NNSN Based on the criteria mentioned in section 4, a total of 6,833 local and regional events, were detected by the NNSN during Of these local and regional events, 39% were large enough to be recorded by several stations and hence could be located reliably, and are not classified as explosions (LP or LE). The numbers of local/regional and teleseismic events, recorded per month in 2015 are shown in Figure 5. The average number of local and regional events recorded per month is 570. A total of 1101 teleseismic events were recorded in 2015 and the monthly average of teleseismic earthquakes in the NNSN database, is 91. In addition to the locations determined at UiB and NORSAR, also preliminary locations published by the USGS (United States Geological Survey) or the EMSC (European Mediterranean Seismological Centre) based on the worldwide network are included for earthquakes also registered by NNSN stations. Figure 5. Monthly distribution of local/regional and distant events, recorded during
 recorded from January to December 2015 with M 3 are plotted in Figure 6. Figure 6. Epicentre distribution of earthquakes with M3.")
22 UiB, as an observatory in the global network of seismological observatories, reports local and teleseismic phases to the International Seismological Center (ISC). All events (teleseismic, regional and local) recorded from January to December 2015 with M 3 are plotted in Figure 6. Figure 6. Epicentre distribution of earthquakes with M3.0, located by the NNSN from January to December Teleseismic events recorded only by NORSAR have M5.0. Monthly station recording statistics from January to December 2015 are given in Table 6 and 7. This table shows, for each station, local events recorded on more than one station and recorded teleseismic events. The statistics are based on the analysed data and are taken from the database. Table 6 and 7 show both earthquakes and explosions. Identified or suspected explosions will only be located with a minimum number of stations. Therefor some stations (e.g. KTK, MOR8) will have a higher number of detections. The following was observed from Table 6 and 7: At Jan Mayen there was an increase in earthquake activity during June and July. The number of local earthquakes recorded at HOPEN (and for some months also BJO) is higher than expected when compared to TBLU and OSL are recording mostly teleseismic earthquakes, which is as expected due to their location in noisy environment. Stronger local earthquakes will however be detected. TBLU was down a period during summer 2015 due to PC problems. The stations KONS, STOK and MOR8 continue to record a relatively large number of small earthquakes and explosions in the area. Temporary stations were deployed during fall 2013 and an increase in smaller events recorded and located in this area is expected during the NEONOR2 project period. 18
23 Table 7. Monthly statistics of events recorded at each station for January-June Abbreviations are: L = Number of local events recorded at more than one station and D = Number of teleseismic events recorded at the station. JANUARY FEBRUARY MARCH APRIL MAY JUNE STATION L D L D L D L D L D L D ASK BER BJO BLS DOMB FAUS FOO HAMF HOMB HOPEN HYA JMI JMIC JNE JNW KBS KMY KONO KONS KTK LOF MOL MOR NSS ODD OSL SKAR SNART STAV STEI STOK SUE TBLU TRO NORSAR ARCES SPITS
24 Table 8. Monthly statistics of events recorded at each station for July-December Abbreviations are: L = Number of local events recorded at more than one station and D = Number of teleseismic events recorded at the station. JULY AUGUST SEPT OCT NOV DEC STATION L D L D L D L D L D L D ASK BER BJO BLS DOMB FAUS FOO HAMF HOMB HOPEN HYA JMI JMIC JNE JNW KBS KMY KONO KONS KTK LOF MOL MOR NSS ODD OSL SKAR SNART STAV STEI STOK SUE TBLU TRO NORSAR ARCES SPITS The seismicity of Norway and adjacent areas The main area of interest is defined as 54-82N and 15W-35E, Figure 7. We also show the seismicity for the Arctic region including the Barents Sea defined by coordinates N and 20 W-50 E. A total of 4153 of the recorded events are located inside the NNSN prime area. During analysis and using the explosion filter (Ottemöller, 1995), 40% of these events were identified as confirmed or probable explosions or induced events. After including stations located on the eastcoast of Greenland, operated by GEUS, the number of located events has increased in the Artic area. Figure 7 shows all local/regional events in the prime area, analysed and located during Among these, 451 are located in the vicinity of Jan Mayen. Figure 8 shows the location of every earthquake (known and probable explosions removed) located within the prime area with one of the calculated magnitudes above 3. Table 9 lists the same earthquakes with all earthquakes located close to the Mid-Atlantic ridge removed. 20

25 Figure 7. Epicentre distribution of events analysed and located in Earthquakes are plotted in red and probable and known explosions in blue. For station locations, see Figure 1. It should be emphasized that the magnitude calculation for the earthquakes located on the oceanic ridge in the Norwegian Sea uses the same formula as for mainland Norway. As the scale is not appropriate for this region, the magnitudes for these earthquakes are underestimated. Most of the recorded earthquakes in this area have magnitudes above 3.0 if they are recorded on Norwegian mainland stations. A new magnitude scale for the artic area is expected to be available during
26 Figure 8. Epicentre distribution of located events with one of the calculated magnitudes above or equal to 3.0. For station location, see Figure 1. The largest local or regional earthquake in 2015, recorded on Norwegian stations and within the prime area, occurred on December 21 st at 10:31(UTC) offshore the Danish west coast. The earthquake had a magnitude of M L(BER) =3.2, M L =3.3 reported from GEUS, Denmark and M L =4.0 reported from BGS. Along the mid-atlantic ridge a large number of earthquakes occur with magnitude above 3 which is approximately the detection level along the Mohns ridge. Of the 32 located earthquakes with magnitude above 4, 23 were located along the ridge mostly along the Mohns ridge. The magnitudes calculated for earthquakes in the Norwegian-Greenland Sea are expected to be underestimated. 22
27 Table 9. Earthquakes located in the vicinity of mainland Norway and in the Svalbard area (grey background) with any reported magnitude above or equal to 3.0 for the time period January through December In cases where all BER magnitudes are below 3 but the event still is included in the list, NORSAR (NAO), GEUS- Geological Survey of Denmark and Greenland (DNK), University of Uppsala (UPP), University of Helsinki (HEL) or the British Geological Survey (BGS) has reported a magnitude of 3.0 or larger. Abbreviations are: HR = hour (UTC), MM = minutes, Sec = seconds, L = distance identification (L=local, R=regional, D=teleseismic), Latitud = latitude, Longitud = longitude, Depth = focal depth (km), F = fixed depth, AGA = agency (BER=Bergen), NST = number of stations, RMS = root mean square of the travel-time residuals, Ml = local magnitude and Mw = moment magnitude. Year Date HRMM Sec L Latitud Longitud Depth F AGA NST RMS Ml Mw ML ML (NAO) L BER L F BER L BER L F BER (UPP) L BER (DNK) L BER L BER L BER L BER L BER (DNK) L BER L BER L BER L F BER (DNK) L BER (BGS) L BER L BER L BER L BER (DNK) L BER L BER L BER L BER L BER (HEL) L BER L BER L BER L BER L F BER (BGS) L BER L BER L BER L BER L BER (BGS) L BER L BER L BER L BER (BGS) L BER The most significant earthquakes during 2015 and located in the vicinity of the Norwegian mainland were: December 11 th 2015, 07:20(UTC) located offshore Stadt with a magnitude of M W =3.7. This earthquake was reported felt in Sogn and Fjordane (Figure 18). Offshore Denmark an earthquake occurred December 21st at 10:31(UTC), magnitude 3,2L BER, 3.3L DNK and 4.0L BGS located to 56.95N 7.16E. In the Storfjorden, Svalbard area there are located 19 earthquakes with at least one reported magnitude above 3.0. The largest occurred July 4 th at 07:42 located to 76.95N 15.76E with magnitudes ML BER =3.7, ML NAO =4.5 23
28 4.3.1 Seismicity in Nordland Figure 9 shows the seismicity in Nordland since The area includes the locations of earthquake swarm activity such as Meløy, Steigen and Stokkvågen. The latter two areas are clearly visible on the map. Steigen was active between 2007 and 2008, but has been relatively quiet until 2015 when 44 earthquakes are located to the area. The activity in the Stokkvågen area has been nearly continuous, and specific clusters in time and space have occurred. Figure 10 shows the seismicity in the area during As can be seen from the figure the seismic activity is located to the already known active areas. The increased station-density in the area lowered the detection threshold and more events with low magnitude are located. Figure 9. Seismicity in the Nordland area. Red circles show seismicity for , and yellow triangle is NNSN seismic stations. Known and probably explosions are excluded. 24
 and also in the Steigen (68N,15E) area there has been an increased seismic activity during 2015 compared to 2014.")
29 Figure 10 Seismicity in the Nordland area. Red circles show seismicity for 2015, and yellow triangle is NNSN seismic stations. Known and probably explosions are excluded. In the Jektvik (66.6N,13.5E) and also in the Steigen (68N,15E) area there has been an increased seismic activity during 2015 compared to In the Jektvik area the earthquakes are located onshore to the area southwest of the Svartisen glacier. During 2015, 476 earthquakes are located to this area compared to 71 in The earthquake swarm started in April 2015 as can be seen in Figure 11. Early in the swarm sequence three larger earthquakes occurred, see Table 10. Table 10 The largest (M>3.0) recorded earthquakes located in the swarm area. Two are felt locally. Year Date HRMM Sec L Latitud Longitud Depth AGA NST RMS Ml(BER) ML(NAO) FELT L BER No L BER Yes L BER Yes 25
30 Figure 11 Time distribution (upper) and location (lower) of the earthquake swarm located southwest of the Svartisen glacier. Note! The events shown are limited by N and E, a smaller area than show on the map. The location of the permanent NNSN station (KONS) and the NEONOR2 stations (N2VG, NBB13, NBB 15, NBB17) are marked on the map. 26
31 The yearly distribution of earthquakes located in the area is presented in Figure 12. Figure 12 The yearly number of earthquakes in the area shown in Figure Seismicity in the arctic area With the mainland stations on the Lofoten, in Tromsø and Hammerfest, the network on Jan Mayen, and stations on Bjørnøya, Hopen and Svalbard, the network detection capability in the arctic area is relatively good. We define the arctic area as the region N and 25 W-50 E. Most of the activity falls into three areas: Jan Mayen, the Mid-Atlantic ridge and Storfjorden southeast of Svalbard, as can be seen in Figure 12. Since 2014 data from Danish stations on Greenland (see Figure 2) were included in the daily processing which has increased the location accuracy for earthquakes west of Jan Mayen and northwest of Svalbard. The number of earthquakes recorded on enough stations to be located, have increased. 27

32 Figure 13. Seismicity in the Norwegian arctic area during A total of 2252 located earthquakes Seismicity in the Jan Mayen area Jan Mayen is located in an active tectonic area with two major structures, the Mid Atlantic ridge and the Jan Mayen fracture zone, interacting in the vicinity of the island. Due to both tectonic and magmatic activity in the area, the number of recorded earthquakes is higher than in other areas covered by Norwegian seismic stations. During 2015 a total of 430 earthquakes were located as seen in Figure 14 and of these, 12 had a magnitude equal or above 3.0. The largest earthquake in the Jan Mayen region in 2015 occurred on 30 th June at 07:40 (UTC) and the magnitude is estimated to 3.7. The earthquake is located slightly west of the island in the Jan Mayen fracture zone and was felt by the personnel at Jan Mayen. 28
 shows smaller time variation than for the smaller earthquakes. The increases in 2004 and 2005 were due to the M=6.")
33 Figure 14. Earthquakes located in the vicinity of Jan Mayen during The number of recorded earthquakes in the Jan Mayen area has varied over the last years (Figure 15). The number of relatively strong earthquakes (M 3) shows smaller time variation than for the smaller earthquakes. The increases in 2004 and 2005 were due to the M=6.0 earthquake in 2004 and its aftershocks (Sørensen et al., 2007). The same is true for 2011, where the M=6.0 earthquake on 29 January was followed by a sequence of aftershocks. The 30 August 2012 earthquake with its fore and aftershocks clearly increases the number of recorded events in 2012 compared with previous years, making it the largest number of recorded events yearly for more than 10 years. For the following years after 2012, the number of located smaller earthquakes has increased slightly, while the number of larger (M 3.0) earthquakes is relative stable. 29


34 Figure 15. Yearly distribution of earthquakes located in the Jan Mayen area since The area is as shown in Figure Seismicity in Storfjorden, Svalbard The Storfjorden area southeast of Svalbard, defined by latitude N and longitude 16-22E, has been seismically active since the M w =6.0 earthquake on 21 February A preliminary study was presented by Piril et al. (2008). One of the main objectives from this study was to resolve the source mechanism, which was found to be oblique-normal. This result was found from the inversion of both regional and teleseismic data. The earthquake had a high number of aftershocks. A total of more than 35 earthquakes with magnitude larger than M=4 have occurred in the area since From the monthly number of all detected earthquakes it seems that the activity had decreased until the start of 2009 and then remained relatively low until late In 2010 the number increased again and remained mostly stable in This is mostly explained by an increase in the number of smaller earthquakes as seen by the almost constant levels of earthquakes with M>2.5 since The better detection was due to usage of the data from the Hornsund (HSPB) and Barentsburg stations. It appears as if the overall activity is decreasing slightly, although still continuing. The total number of events located in the Storfjorden area in 2015 was around 176, a decrease compared to the previous years. 30

35 Figure 16 Seismicty in the Svalbard area. Bottom: Earthquakes occurring in 2015 are plotted in red circles. Yellow circles show seismicity for The blue triangles give the station locations. Top: Seismicity in the same area is plotted as latitude as function of time. Figure 16 shows both a map with the seismicity since 2000 and the distribution of events over time. The onset of the activity in the Storfjorden area in February 2008 is obvious from the time plot. The seismicity since 2011 is mostly concentrated in the southwestern half of the area that has been active since The six largest earthquakes, all occurred in the western part of Storfjorden, the largest (M=4.1), can be seen north of the cluster seen on. 31
36 4.3.5 Earthquakes in the southern North Sea During 2015 three small earthquakes were detected and located in the North Sea as shown in Figure 17 and listed in Table 11. Table 11. Earthquakes recorded during 2015 and located in the area limited by 54-60N and 1W-5E. Year Date HRMM Sec L Latitud Longitud Depth AGA NST RMS Ml L BER L BER L BER Figure 17. Time distribution (upper) and location (lower) of the earthquake located within 54-60N and 1W-5E in the southern North Sea (Note that the map is larger than the area used for selection of earthquakes). Earthquakes recorded during 2015 are marked in red stars. Seismic stations are marked with blue triangles. 32
37 4.3.6 Felt earthquakes In total, 21 earthquakes were reported felt and located within the target area during 2015 (see Table 12 and Figure 18). Not all earthquakes were felt in Norway. For the Jan Mayen Island and the area southwest of the Svartisen glacier, the number of felt earthquakes is expected to be larger than reported. Figure 18. Location of the 20 earthquakes reported felt during of the earthquakes are felt in Norway including Jan Mayen. Large felt earthquakes are mostly reported to UiB shortly after the origin time, and location information and questionnaires are available for the public on the site Smaller felt earthquakes may be reported by the public to local newspapers or other institutions and then reported to UiB. Depending on the time-delay for these reports to be available at UiB, the information on web might be accordingly delayed. For any felt earthquake the public has to be made aware of the questionarie, which is done by informing on web and when UiB is contacted by media, private persons or other institutions. 33
38 Earthquakes large enough to be felt and occurring in heavily populated areas increases the number of people using the web reporting the intensities. For the earthquake felt in Trondheim October 12 th, a small M L =2.1 earthquake, 1300 people filled in a questionarie and mailed it to Bergen. To be able to process such loads of data, new automatic routines for handling felt earthquakes are under development. Table 12. Earthquakes reported felt in the BER database in Abbreviations are: M L = local magnitude and M w = moment magnitude, W: questionnaires received on web (Y/N). Earthquakes felt outside Norway are marked in colour. Nr Date Time (UTC) Max. Intensity (MMI) Magnitude (BER) Instrumental epicentre location :03 M L =2.3, M L =2.4(BGS) 58.51N / 4.69W :24 M L =2.6, M L =2.6(NAO) 61.88N / 4.71E N :00 M L = N / 13.40E N :37 M L =1.8, M L =1.9(HEL) 65.63N / 29.28E :13 M L =2.6, M L =2.8(UPP) 66.66N / 13.34E N :11 M L =1.7, M L =2.3(HEL) 66.66N / 13.34E N :07 M L =2.1, M L =2.6(HEL) 66.67N / 13.29E N :08 M L =1.9, M L =2.2(NAO) 66.63N / 13.40E N :12 M L =2.4, M L =3.0(NAO) 66.64N / 13.28E N :40 M L =3.2, M L =3.7(NAO) 66.66N / 13.29E Y :46 M L =3.5,M L =3.6(NAO), M L =3.7(DNK), 59.27N / 7.06E Y M L =2.5(UPP) :32 M L =3.1, M L =4.2(NAO) 71.06N / 8.07W Y :40 M L = N / 7.80W N :31 M L =2.7,M W =2.8, M L =2.9(NAO) 59.69N / 5.86E Y :46 M L =2.6,M W =2.7, M L =2.9(NAO) 57.59N / 11.80E :42 M L =2.7,M W =2.8, M L =3.2(NAO) 69.44N / 24.10E N :57 M L =2.8,M W =3.0, M L =3.1(NAO) 66.63N / 13.00E Y :23 M L =2.6(NAO), M L =2.5(HEL) 66.32N / 31.46E :24 M L =2.1, M L =2.0(NAO) 63.30N / 10.43E Y :14 M L =2.0,M W =2.3, M L =2.4(NAO) 69.03N / E Y :20 M L =3.4,M W =3.7, M L =3.8(BGS) 61.91N / 4.34E Y W The largest felt earthquake during 2015 was the earthquake occurring 29 th April at 22:46 (UTC time). The earthquake was reported felt in most part of southwest Norway. Questionnaires were published on web, and UiB received 144 answers. Analysts have not manually checked the intensities so anomalies might occur. 34

39 Figure 19. Reported intensities for the earthquake 29 th April at 22:46. The yellow star marks the instrumental location. 5 Scientific studies This section will present an overview of research work that is carried out under the NNSN project. The main objective of this work is to improve the understanding of earthquakes and the seismological models in the region, mostly by using data recorded by the NNSN. Results will be used to improve the NNSN monitoring service. 5.1 P-wave polarization at NNSN for the investigation of local anisotropy and lateral heterogeneity by Luigia Cristiano, Kiel University Three-component data from the Norwegian National Seismic Network are suitable to apply polarization analysis (e.g., Jurkevics, 1988; Schulte-Pelkum et al., 2001) to estimate anomalies of wave polarization induced by local wave speed anisotropy and lateral heterogeneities. Long recording time and high quality data guarantee in fact a good azimuthal distribution of events with high signal-to-noise ratio (SNR). Polarization analysis is mainly used as a single method to investigate the characteristics of particle motions. We expect that polarization and propagation direction of P waves are both affected by seismic anisotropy as well as by lateral heterogeneities but with different sensitivities. 35

40 Polarization parameters are finite frequency observables mostly related to structures up to about one wavelength from the receiver area. The propagation vector direction is also sensitive to distant heterogeneities and distant anisotropy. By polarization analysis we can estimate the deviation of the P-wave polarization vector and its dependence on event backazimuth, epicentral distance and frequency. The analysis has been applied to almost 20 years (short period as well as broadband) of NNSN data to investigate anisotropy of seismic velocities and lateral heterogeneities beneath the stations. Altogether about 1000 first arriving teleseismic P waves were analyzed. All events with high SNR have been selected and a good distribution in backazimuth and distance (Figure 20) could be obtained. Figure 20. Location of the teleseismic events for which the polarization of the first P-wave arrival has been estimated. P-wave polarization parameters namely azimuthal deviation and incidence angle have been estimated by solving the eigenvalue problem of the 3-component signal covariance matrix in a moving window following the algorithm proposed by Jurkevics (1988). The parameters have been calculated for each 3C-station of the NNSN in 3 frequency bands ( Hz, Hz and Hz). An automated picking algorithm has been used to estimate the polarization parameters of the first P-wave onset including a measure for the quality of the estimate (Cristiano et al., in preparation). Also the azimuthal deviation of the P-wave polarization is mainly dependent on the backazimuth and the frequency. Therefore, we do not separate measurements related to events with different epicentral distances. 36

41 It has been observed that the azimuthal deviations are mainly a function of backazimuth and frequency. To investigate the characteristic of this dependence we apply a harmonic analysis (Figure 21). We assume that the azimuthal deviations can be expressed as sum of cosine functions of backazimuth with different periodicities. For each component it is possible to estimate amplitude (A k ) and phase (phi k ). The 360 periodicity in the backazimuth anomalies can be generated by a velocity gradient e.g., caused by a dipping interface (see e.g., Niazi, 1966). From the phase of the 360 term it is possible to determine the strike of the structure showing the velocity gradient and the direction to the low velocities. The 180 periodicity term can be explained in terms of azimuthal anisotropy with a horizontal symmetry axis. From the phase of this harmonic it is possible to estimate the direction of the fast axis of anisotropy. Figure 21. 2D histogram of the azimuthal deviations estimated by polarization analysis at the NNSN sites BLS5 and ARE0 in two frequency bands ( Hz, Hz). The measurements are distributed in bins on azimuthal deviation and backazimuth ranges. Colors are used to show which bins have the higher number of high quality measurements. Plotted as overlay are the cosine functions with 360 and 180 periodicity from the applied harmonic analysis. The minimum and maximum of the color scale is in dark blue and red respectively. Harmonic analysis has been applied on the azimuthal deviations estimated by polarization analysis. The dominant periodicities are 360 and 180 for each station of the NNSN but the 180 term is only significant at some sites. We do not observe a marked dependence on the 37

42 fast directions of anisotropy on the frequency. This points to the presence of a dominant fast direction in the shallow and deeper crust. At the NORSAR array the directions of fast axis of anisotropy, estimated by polarization analysis are significant only at NC204 and NC303 and only for low frequency observations. The fast directions are 110 with an uncertainty of few degrees and fully consistent with fast directions estimated by Roy & Ritter (2013) applying the SKS/SKKS splitting method. The fast directions of anisotropy retrieved at the stations of NNSN show consistency between neighboring stations (Figure 22). Figure 22. Fast directions of azimuthal anisotropy at the permanent stations in Norway and surrounding countries, estimated from the phase of 180 term at high frequencies. At the stations of NNSN is not observed any strong dependence of the fast direction on the frequency. At the stations of the German Seismic Network, the frequency dependence of the fast direction is more pronounced. 38
43 5.2 Magnitude scale for earthquakes along the mid-atlantic Ridges in Offshore Norway by Won-Young Kim, Lamont-Doherty Earth Observatory of Columbia University The main objectives of this study are to determine the amplitude attenuation of Pn and Sn phases in the northern Atlantic region to establish a regional magnitude scale that is robust despite complex wave propagation paths in the ocean basins and fracture zones. The amplitude decay of regional phases (Pn, Pg, Sn, and Lg) with distance can be described as a power-law distance dependence. Some Pn and Sn phases excited at the source on the mid- Atlantic ridge are passing through additional mid-atlantic ridge segment. For example, Pn phase generated by an event on the Jan Mayan ridge propagates along oceanic crust underneath the Norwegian Sea, then encounters the Knipovich segment (Nansen fracture zone) of mid-atlantic ridge before it arrives at station KBS on the Svalbard. In such cases, the amplitude attenuation must be more severe than single path due to scattering loss of Pn or Sn phase amplitudes. A total of 986 Pn and 600 Sn observations from 132 earthquakes that occurred along the northern mid-atlantic ridges recorded at 19 stations of 14 NNSN (Norwegian National Seismic Network) and five GSN stations in Greenland (Figure 23). These earthquakes are selected from the GCMT (Global Centroid Moment Tensor) catalog during The moment magnitudes of the selected events are used as reference to determine amplitude distance curves for Pn and Sn phases in the region. Observed RMS (root-mean-squared) amplitudes in micron/s are normalized by the moment magnitude (Mw) of each event and are plotted in Figure 24 against distance. Station correction, amplitude distance curve which consists of frequency dependent attenuation and geometrical spreading of amplitude, are solved by damped least-square inversion following the approach by Sereno (1990), Jenkins et al. (1998), and Hicks et al. (2004). We obtained a robust magnitude scale for earthquakes that occur along the northern mid-atlantic ridges using Pn and Sn in the distance ranges from 200 km to 2,000 km. Using the new mb(pn) magnitude scale, we obtained the magnitudes that are comparable to the Mw from GCMT catalog with scatter of only 0.05 m.u. (Figure 25). A key to make the mb(pn) scale applicable to wide range of earthquake size and regions is to generalize the sourcespecific correction terms that are necessary due to diverse wave propagation paths involved with the mid-atlantic ridge earthquakes. 39
44 Figure 23. Results of the Pn amplitude inversion for amplitude attenuation parameters (, a & b), station corrections, and event correction terms. Stations with positive corrections (e.g., DAG=0.17, JMIC=0.18 & HOPEN=0.11) are plotted with red inverted triangles, whereas the negative station corrections are plotted with blue inverted triangles. The symbol size is proportional to the corrections. Similarly, events with positive corrections plotted with red triangles which are mostly on Mohns Ridge, and lower half of Kinipovich Ridge, whereas the negative corrections (blue triangles) are mostly on Jan Mayen transform fault region and Nansen fracture zone west and northwest of Svalbard. The corrections are added to the magnitude determination, and hence, the negative corrections indicated large measured amplitude than other events. 40
45 Mw [gcmt] log10 (Normalized RMS Amplitude) [nm] Seismicity of Norway, January December Pn, RMS Amplitude Measurement Raw data final iteration 1 alpa=2.06, a= 0.19, b= Distance (km) Figure log 10 (RMS amplitude) of Pn phases are plotted against distance (black circles). Amplitudes are normalized by their moment magnitude. Amplitudes after the inversion are plotted with red circles, and the amplitude-distance obtained from the inversion is superposed with the amplitudes. The curve is parameterized by, a = 0.19 f and b =3.01. Pn Magnitude vs Mw, N=131, Station correction Mw=0.992+/ M Magnitude [Pn(rms)] Figure 25. Result of the inversion indicated that the new magnitude obtained from Pn phases M(Pn), using the measured RMS amplitudes (in 1-4 Hz band) are consistent with original event moment magnitude with Mw = 0.992±0.052 mb(pn) Notice that scatters are only 0.05 magnitude units. 41
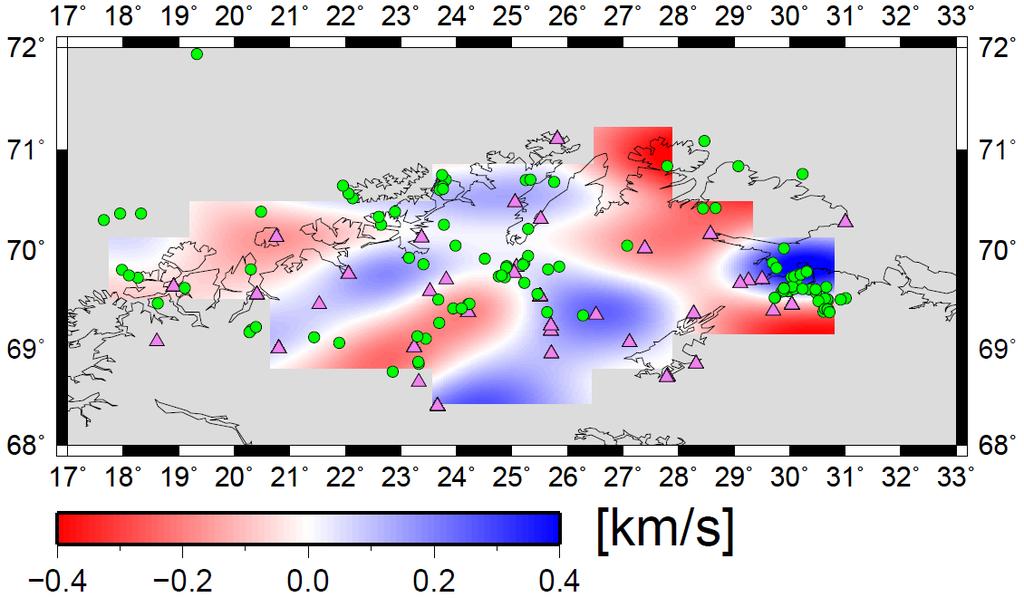
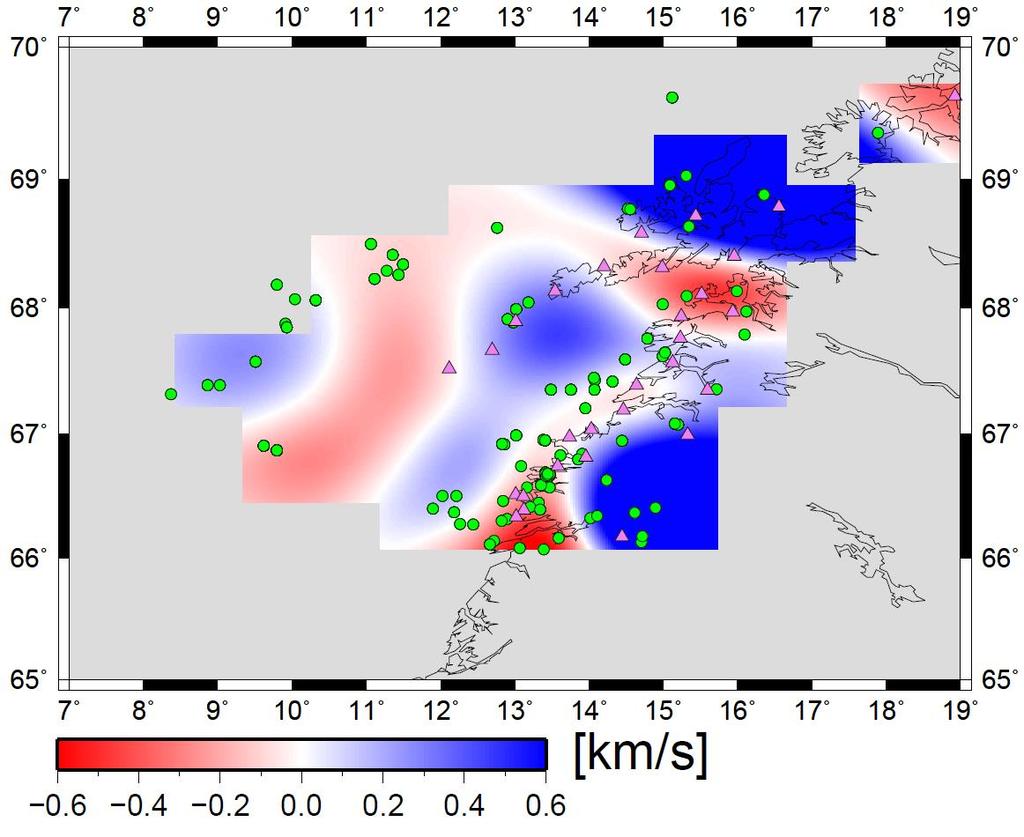
46 5.3 Development of a 3-D velocity model for Norway by Ilma Janutyte, NORSAR The aim of this study is to develop the 3-D crustal model for the territory of Norway both onshore and off-shore. The 3-D model would help to locate the seismic events in Norway with higher precision. During the last year we upgraded the 3-D crustal velocity model for the southern part of Norway, and developed new velocity models for the territory of Nordland, northern Norway, and Finnmark, the northernmost part of Norway (Figure 26). The workflow was divided into two steps: 1) development of the optimal 1-D velocity models for southern Norway and Nordland, while for Finnmark we used the FESCAN (Mykkeltveit and Ringdal, 1981) 1-D velocity model as optimal one, and 2) development of the 3-D velocity models. The final goal is to merge the models into one for entire Norway. The optimal 1-D velocity models were obtained using the VELEST program (Kissling et al., 1994), which is implemented into the SEISAN program package (Ottemoller et al., 2014). The obtained optimal 1-D velocity models extend from the surface down to 80 km deep and consist of several layers of different but constant seismic velocities. To develop the velocity model for the southern Norway we used a dataset of 175 local seismic events recorded at 105 stations, for Nordland we used a dataset of 100 events recorded at 29 stations, and for Finnmark we used a dataset of 113 events recorded at 55 seismic stations (Figure 27). Before implementing the 1-D velocity models into the FMTOMO program (Rawlinson and Sambridge, 2005), which was used for the 3-D inversion, the 1-D velocity model was transformed into the two layer models with gradient increase in velocities with depth. The upper layer was set from the surface down to the depth of the Moho boundary, and the lower layer was from the Moho down to 80 km depth. The synthetic checkerboard tests with the current configuration of sources and receivers were used to check the resolution in each territory separately. Beneath the areas spanned by the seismic networks of each study area the resolution is reasonably good down to km depths. The 3-D inversion results show velocity perturbations up to ±0.4 km/s for southern Norway and Finnmark, and up to ±0.6 km/s for Nordland, as compared to the reference velocity models. The higher velocity contrast in Nordland might be related to the more complex geological conditions compared to the other parts of Norway. The obtained results were compared to the results obtained from earlier studies. 42

47 Figure 26 Areas of Norway with developed 3-D crustal velocity models. 43
48 a) b) 44

49 c) Figure 27 Horizontal slice at 10 depth of the 3-D velocity models developed for the territories of Finnmark (a), Nordland (b) and southern Norway (c) (see Fig. 1). Triangles mark the seismic stations, green circle mark the epicenters of earthquakes. Red and blue areas indicate the resolved seismic velocities lower or higher, respectively, compared to the reference velocity models. The areas with poor resolution are colored in grey. 45
50 5.4 Testing of a method for distinguishing between earthquakes and explosions by Ilma Janutyte, NORSAR We have started experiments with a method which can help to objectively distinguish between earthquakes (EQs) and explosions. The method was first developed at the Institute of Seismology, University of Helsinki, Helsinki, Finland (Kortstrom et al., 2016), and is successfully used there by their analysts. The idea of the method is to calculate spectral parameters from the seismograms and compare them with the spectral models developed for EQs and explosions, respectively. The workflow is divided into several steps: 1) the event seismogram is divided into four equal time windows of the length depending on the time difference between P and S waves, 2) the seismogram is filtered with 20 narrow band filters covering range from 1 to 41 Hz, 3) the short term averages (STA) are calculated for each window with different filters, so the set of 80 spectral parameters are obtained, 4) the set of parameters are compared to the reference models, which must be developed beforehand, and finally 5) the prediction for the event is presented. For steps 1-3 we wrote a script in ObsPy, while steps 4-5 were conducted using the SVM light (Joachims, 1999). The method requires reference spectral earthquake and explosion models for each station. As a first test we developed reference spectral models for two NNSN seismic stations, HYA and FOO. Using 121 events of the NNSN bulletin, labelled as earthquakes or explosions, we obtained models for station HYA (Figure 28), for which validation was performed with 125 different events with 92 % of correct predictions. For station FOO we used 64 events for obtaining the earthquake and explosion spectral models, and validation was performed with 65 different events with 98 % of correct predictions. We also performed a test for 58 events which were recorded in both seismic stations, HYA and FOO. The prediction results are presented in Figure 29. These initial results are encouraging, but studies of larger datasets, including more stations, are needed to make the method generally applicable as a tool for distinguishing between earthquakes and explosions in our region. 46

.")
51 Figure 28 Seismic events used to develop and verify spectral models for station HYA. The seismic events are marked as circles and stars, and seismic stations HYA and FOO are marked as green triangles. Figure 29 Results obtained with common dataset for seismic stations HYA and FOO. Green line indicates the boundary between EQs and explosions in the dataset (33 EQs and 25 explosions). Red dots and blue diamonds represent stations FOO and HYA, respectively. The values indicate the prediction: the more positive value, the more the event is EQ-like, while the more negative, the more explosion-like. 47

52 5.5 Relocating seismicity using a Bayesian hierarchical multiple event location algorithm by Steven J. Gibbons, NORSAR Many recent studies have demonstrated that multiple-event location algorithms can provide far more accurate estimates for the location of seismicity than classical single-event location procedures. We have demonstrated that a far better constrained image of seismicity on the mid-ocean ridge in the Arctic can be obtained using the Bayesian hierarchical multiple event location algorithm Bayesloc (Myers et al., 2007, 2009) which results in implicit corrections to the applied velocity model. We have started to explore the applicability of Bayesloc to seismicity offshore of southern Norway. The results are more difficult to evaluate than for the mid-atlantic ridge because the seismicity is more diffuse and is not as limited to wellmapped-out tectonic structures. However, preliminary results (Figure 30) are highly promising with the simultaneously inverted seismicity (panel b) showing more spatially consistent deviations from the applied velocity model than the corresponding single-event location estimates (panel a). We can exploit the long history of recordings from stations in southern Norway and in the UK, even providing constraints on recent seismicity from historical events that were well-constrained by temporary deployments (e.g. Weidle et al., 2010). We intend to explore further the ability of Bayesian algorithms to identify clusters of seismicity and to estimate empirical correction terms to velocity models used in routine event location procedures. Figure 30. Time residual in seconds for the initial regional P-arrivals at the NC602 station of the NORSAR array, relative to the Fescan velocity model (see Mykkeltveit and Ringdal, 1981) for (a) NORSAR reviewed event locations and (b) the preliminary Bayesloc solutions. 48
Annual report for the Norwegian National Seismic Network
 Annual report for the Norwegian National Seismic Network 2014 Supported by University of Bergen and Norwegian Oil and Gas Association Prepared by Department of Earth Science University of Bergen Allegaten
Progress Report No Norwegian National Seismic Network
 Progress Report No. 1-2005 for Norwegian National Seismic Network January 1 st to June 30 th, 2005. Supported by University of Bergen, Faculty of Mathematics and Natural Sciences and Norwegian Oil Industry
Annual report for the Norwegian National Seismic Network
 Annual report for the Norwegian National Seismic Network 2013 Supported by University of Bergen and Norwegian Oil and Gas Association Prepared by Department of Earth Science University of Bergen Allegaten
Annual report for the Norwegian National Seismic Network
 Annual report for the Norwegian National Seismic Network 2016 Supported by University of Bergen and Norwegian Oil and Gas Association Prepared by Department of Earth Science University of Bergen Allegaten
Seismicity of Norway and surrounding areas for
 Seismicity of Norway and surrounding areas for 2012 Prepared by Department of Earth Science University of Bergen Allegt. 41 N-5007 Bergen e-mail: seismo@geo.uib.no Phone: (+47) 55 58 36 00 Fax: (+47) 55
Norwegian National Seismic Network
 Operation of the Norwegian National Seismic Network 2005 Supported by University of Bergen, Faculty of Mathematics and Natural Sciences and Norwegian Oil Industry Association Prepared by Department of
RESEARCH IN REGIONAL SEISMIC MONITORING. Sponsored by Air Force Technical Applications Center. Contract No. F C-0055
 RESEARCH IN REGIONAL SEISMIC MONITORING F. Ringdal 1, E. Kremenetskaya 2, V. Asming 2, T. Kværna 1, S. Mykkeltveit 1, J.I. Faleide 1 and J. Schweitzer 1 1 NORSAR 2 Kola Regional Seismological Center ABSTRACT
SEISMIC CALIBRATION OF THE EUROPEAN ARCTIC
 SEISMIC CALIBRATION OF THE EUROPEAN ARCTIC Svein Mykkeltveit, Frode Ringdal, Conrad Lindholm, NORSAR Elena Kremenetskaya, Kola Regional Seismological Centre Sponsored by U.S. Department of Energy Office
NORSAR 45 years monitoring the Earth
 NORSAR 45 years monitoring the Earth Johannes Schweitzer, Jan Fyen, Tormod Kværna, Svein Mykkeltveit & Michael Roth NGFs årsmøtesymposium i Oslo 17 / 18 September 2014 NORSAR History 1 1968 Governmental
28th Seismic Research Review: Ground-Based Nuclear Explosion Monitoring Technologies
 BASIC RESEARCH ON SEISMIC AND INFRASONIC MONITORING OF THE EUROPEAN ARCTIC Frode Ringdal, Tormod Kværna, Svein Mykkeltveit, Steven J. Gibbons, and Johannes Schweitzer NORSAR Sponsored by Army Space and
26th Seismic Research Review - Trends in Nuclear Explosion Monitoring
 RESEARCH IN REGIONAL SEISMIC MONITORING Frode Ringdal 1, Tormod Kvaerna 1, Elena O. Kremenetskaya 2, Vladimir E. Asming 2, Sergeij Kozyrev 2, Svein Mykkeltveit 1, Steven J. Gibbons 1, and Johannes Schweitzer
South Carolina Seismic Network Bulletin
 South Carolina Seismic Network Bulletin Volume XIII 2003 Prepared by: Pradeep Talwani Abhijit Gangopadhyay and Richard Cannon SPONSORS: Department of Energy/Westinghouse Savannah River Company United States
Monthly Magnetic Bulletin
 BRITISH GEOLOGICAL SURVEY Ascension Island Observatory Monthly Magnetic Bulletin December 2008 08/12/AS Crown copyright; Ordnance Survey ASCENSION ISLAND OBSERVATORY MAGNETIC DATA 1. Introduction Ascension
KING EDWARD POINT OBSERVATORY MAGNETIC DATA
 BRITISH GEOLOGICAL SURVEY King Edward d Point Observatory Monthly Magnetic Bulletin October 2018 18/10/KE King Edward Point (UK) Maps British Antarctic Survey KING EDWARD POINT OBSERVATORY MAGNETIC DATA
KING EDWARD POINT OBSERVATORY MAGNETIC DATA
 BRITISH GEOLOGICAL SURVEY King Edward d Point Observatory Monthly Magnetic Bulletin September 2018 18/09/KE King Edward Point (UK) Maps British Antarctic Survey KING EDWARD POINT OBSERVATORY MAGNETIC DATA
Seismicity in Pennsylvania and the Pennsylvania State Seismic Network (PASEIS)
") Seismicity in Pennsylvania and the Pennsylvania State Seismic Network (PASEIS) Andy Nyblade Department of Geosciences, Penn State University May 19, 2017 Shale Network Workshop Introduction Review of historic
Seismicity in Pennsylvania and the Pennsylvania State Seismic Network (PASEIS) Andy Nyblade Department of Geosciences, Penn State University May 19, 2017 Shale Network Workshop Introduction Review of historic
Monthly Magnetic Bulletin
 BRITISH GEOLOGICAL SURVEY Ascension Island Observatory Monthly Magnetic Bulletin March 2017 17/03/AS Crown copyright; Ordnance Survey ASCENSION ISLAND OBSERVATORY MAGNETIC DATA 1. Introduction Ascension
Improvements to Seismic Monitoring of the European Arctic Using Three-Component Array Processing at SPITS
 Improvements to Seismic Monitoring of the European Arctic Using Three-Component Array Processing at SPITS Steven J. Gibbons Johannes Schweitzer Frode Ringdal Tormod Kværna Svein Mykkeltveit Seismicity
Monthly Magnetic Bulletin
 BRITISH GEOLOGICAL SURVEY Port Stanley Observatory Monthly Magnetic Bulletin December 2007 07/12/PS Jason Islands a ar C West Falkland Kin gg eor ge B Port Salavador ay Weddell Island Mount Osborne So
KING EDWARD POINT OBSERVATORY MAGNETIC DATA
 BRITISH GEOLOGICAL SURVEY King Edward d Point Observatory Monthly Magnetic Bulletin May 2018 18/05/KE King Edward Point (UK) Maps British Antarctic Survey KING EDWARD POINT OBSERVATORY MAGNETIC DATA 1.
Finding out what earthquakes have happened recently Subscribe to an alert system
 Finding out what earthquakes have happened recently Subscribe to an email alert system Hosted by the United States Geological Survey http://earthquake.usgs.gov/eqcenter/ens/ USGS USGS Once registered you
SEISMIC CALIBRATION OF THE EUROPEAN ARCTIC
 SEISMIC CALIBRATION OF THE EUROPEAN ARCTIC Svein Mykkeltveit, Frode Ringdal, Conrad Lindholm, NORSAR Elena Kremenetskaya, Kola Regional Seismological Centre Sponsored by U.S. Department of Energy Office
Monthly Magnetic Bulletin
 BRITISH GEOLOGICAL SURVEY Jim Carrigan Observatory Prudhoe Bay Monthly Magnetic Bulletin May 2014 14/05/JC JIM CARRIGAN OBSERVATORY MAGNETIC DATA 1. Introduction Jim Carrigan observatory is the fourth
Wind Resource Data Summary Cotal Area, Guam Data Summary and Transmittal for December 2011
 Wind Resource Data Summary Cotal Area, Guam Data Summary and Transmittal for December 2011 Prepared for: GHD Inc. 194 Hernan Cortez Avenue 2nd Floor, Ste. 203 Hagatna, Guam 96910 January 2012 DNV Renewables
The importance of long-term Arctic weather station data for setting the research stage for climate change studies
 The importance of long-term Arctic weather station data for setting the research stage for climate change studies Taneil Uttal NOAA/Earth Systems Research Laboratory Boulder, Colorado Things to get out
DR
 DR2003071 0 0 270 0 30 0 90 0 60 0 120 0 150 0 90 0 180 0 180 0 A) RadialReceiverFunctions B ackazimuth (in degrees relative to north) -135-90 -45 0 45 90 135 180-5.0-2.5 Tangential R eceiver Functions
WYANDOTTE MUNICIPAL SERVICES COMMUNITY WIND ENERGY PROJECT WIND RESOUCE SUMMARY
 WYANDOTTE MUNICIPAL SERVICES COMMUNITY WIND ENERGY PROJECT WIND RESOUCE SUMMARY MONTHLY REPORT October 15, 2007 Black & Veatch Project: 144374 Prepared by: Black & Veatch Corporation 6300 S. Syracuse Way
ESURFMAR Report to DBCP
 ESURFMAR Report to DBCP by Jean Rolland, Pierre Blouch, Michel Trémant DBCP 23 -Jeju 15-19 October ESURFMAR E-SURFMAR is an optional programme of the ground based EUMETNET Composite Observing System (EUCOS)
OBS Park in Warsaw 2017 European OBS Technical Workshop Paris, France,
 OBS Park in Warsaw 2017 European OBS Technical Workshop Paris, France, 06-07.11.2017 Agenda The Team Collaboration The Legacy Our OBS BalTec KNIPAS Future plans Lessons learned The team Department of the
Performance of the GSN station KONO-IU,
 Performance of the GSN station KONO-IU, 1991-2009 A report in a series documenting the status of the Global Seismographic Network WQC Report 2010:9 February 28, 2010 Göran Ekström and Meredith Nettles
THE NEW DIGITAL SEISMIC NETWORK IN GHANA THE WAYFORWARD AND THE CHALLENGES
 THE NEW DIGITAL SEISMIC NETWORK IN GHANA THE WAYFORWARD AND THE CHALLENGES By NICHOLAS OPOKU Seismologist, Ghana Geological Survey JANUARY, 2013 IRIS METADATA WORKSHOP - KUWAIT Seismicity / Instrumental
Final Report. COMET Partner's Project. University of Texas at San Antonio
 Final Report COMET Partner's Project University: Name of University Researcher Preparing Report: University of Texas at San Antonio Dr. Hongjie Xie National Weather Service Office: Name of National Weather
South Carolina Seismic Network Bulletin
 South Carolina Seismic Network Bulletin Volume XI 2001 Prepared by: Pradeep Talwani Richard Cannon and Abhijit Gangopadhyay SPONSORS: Department of Energy/Westinghouse Savannah River Company United States
FOCAL MECHANISM DETERMINATION OF LOCAL EARTHQUAKES IN MALAY PENINSULA
 FOCAL MECHANISM DETERMINATION OF LOCAL EARTHQUAKES IN MALAY PENINSULA Siti Norbaizura MAT SAID Supervisor: Tatsuhiko HARA MEE10505 ABSTRACT Since November 30, 2007, small local earthquakes have been observed
Semiannual Technical Summary
 The Research Council of Norway (NFR) M SAR NORSAR Scientific Report No. 2-97/98 Semiannual Technical Summary 1 October 1997-31 Mars 1998 Kjeller, May 1998 APPROVED FOR PUBLIC RELEASE, DISTRIBUTION UNLIMITED
Monthly Magnetic Bulletin
 BRITISH GEOLOGICAL SURVEY Port Stanley Observatory Monthly Magnetic Bulletin July 2011 11/07/PS Jason Islands West Falkland King George Bay Queen Charlotte Bay Weddell Island Caracass Island Saunders Island
Cruise Report R/V Oceania, AREX 2007
 Powstańców Warszawy 55, PL - 81-712 Sopot, P.O. Box 68 March 15, 2008 Cruise Report R/V Oceania, AREX 2007 Ship: R/V Oceania Cruise: AREX 2007 Dates: 19.06.2007 05.08.2007 Port Calls: Gdansk (Poland) Longyearbyen
NORWEGIAN SEISMIC ARRAY NORSAR ESD ACCESSION LIST, Approv. Royal Norwegian Council for Scientific and Industrial Research. Copy No.
 ESD-TR-73-(23 & o 03 Royal Norwegian Council for Scientific and Industrial Research ESD ACCESSION LIST, DR> call No. t fl± Copy No. of _cys, OS O OSLO Approv.. 1.I-- I Wilimifarl. DATA CENTER h\) W">f
South Carolina Seismic Network Bulletin
 South Carolina Seismic Network Bulletin Volume XIV 2004 Prepared by: Pradeep Talwani Abhijit Gangopadhyay and Richard Cannon SPONSORS: Department of Energy/Westinghouse Savannah River Company United States
Atmospheric circulation analysis for seasonal forecasting
 Training Seminar on Application of Seasonal Forecast GPV Data to Seasonal Forecast Products 18 21 January 2011 Tokyo, Japan Atmospheric circulation analysis for seasonal forecasting Shotaro Tanaka Climate
Outage Coordination and Business Practices
 Outage Coordination and Business Practices 1 2007 Objectives What drove the need for developing a planning/coordination process. Why outage planning/coordination is crucial and important. Determining what
5.6. Barrow, Alaska, USA
 SECTION 5: QUALITY CONTROL SUMMARY 5.6. Barrow, Alaska, USA The Barrow installation is located on Alaska s North Slope at the edge of the Arctic Ocean in the city of Barrow. The instrument is located in
Life Cycle of Convective Systems over Western Colombia
 Life Cycle of Convective Systems over Western Colombia Meiry Sakamoto Uiversidade de São Paulo, São Paulo, Brazil Colombia Life Cycle of Convective Systems over Western Colombia Convective System (CS)
Earthquakes and seismic hazard in Sweden
 Earthquakes and seismic hazard in Sweden Björn Lund, Roland Roberts & Reynir Bödvarsson Uppsala University Outline Nordic and Swedish seismicity Comparison to plate boundary seismicity in Japan. Extrapolation
Monthly Magnetic Bulletin
 BRITISH GEOLOGICAL SURVEY Port Stanley Observatory Monthly Magnetic Bulletin April 2009 09/04/PS Jason Islands a ar C West Falkland Kin gg eor ge B Port Salavador ay Weddell Island Mount Osborne So un
Monthly Magnetic Bulletin
 BRITISH GEOLOGICAL SURVEY Port Stanley Observatory Monthly Magnetic Bulletin July 2009 09/07/PS Jason Islands a ar C West Falkland Kin gg eor ge B Port Salavador ay Weddell Island Mount Osborne So un d
Monthly Magnetic Bulletin
 BRITISH GEOLOGICAL SURVEY Port Stanley Observatory Monthly Magnetic Bulletin May 2009 09/05/PS Jason Islands a ar C West Falkland Kin gg eor ge B Port Salavador ay Weddell Island Mount Osborne So un d
Monthly Magnetic Bulletin
 BRITISH GEOLOGICAL SURVEY Fort McMurray Observatory Monthly Magnetic Bulletin February 2016 16/02/FM Fort McMurray FORT McMURRAY OBSERVATORY MAGNETIC DATA 1. Introduction The British Geological Survey
Status of EUMETSAT Operational Services & EUMETCast Africa Dissemination Baseline Updates
 Status of EUMETSAT Operational Services & EUMETCast Africa Dissemination Baseline Updates Sally Wannop User Relations Manager 1 8th WMO RAIDEG meeting 1-2 November 2017 # 951881 Overview EUMETCast Overview
Christmas Newsletter from FORCE 2015
 Christmas Newsletter from FORCE 2015 Dear FORCE members Force congratulates you all with a productive year in 2015, filled with high activities in network groups, at seminars and in projects. Our industry
Monthly Magnetic Bulletin
 BRITISH GEOLOGICAL SURVEY Fort McMurray Observatory Monthly Magnetic Bulletin March 2017 17/03/FM Fort McMurray FORT McMURRAY OBSERVATORY MAGNETIC DATA 1. Introduction The British Geological Survey (BGS)
EBS IT Meeting July 2016
 EBS IT Meeting 18 19 July 2016 Conference Call Details Conference call: UK Numbers Tel: 0808 238 9819 or Tel: 0207 950 1251 Participant code: 4834 7876... Join online meeting https://meet.nationalgrid.com/antonio.delcastillozas/hq507d31
Magnitude determinations
 Topic Author Version Magnitude determinations Peter Bormann (formerly GFZ German Research Centre for Geosciences, 14473 Potsdam, Germany); E-mail: pb65@gmx.net October 2011; DOI: 10.2312/GFZ.NMSOP-2_EX_3.1
RESEARCH IN REGIONAL SEISMIC MONITORING. Sponsored by the Department of Defense. Contract No. F C-0001
 RESEARCH IN REGIONAL SEISMIC MONITORING F. Ringdal 1), E. Kremenetskaya 2), V. Asming 2), T. Kværna 1) and J. Schweitzer 1) 1) NORSAR, Kjeller, Norway 2) KRSC, Apatity, Russia Sponsored by the Department
Global Instrumental Seismicity Catalogue
 Caribbean Regional Programme Workshop Port of Spain, Trinidad & Tobago, May 2 nd 2011 Global Instrumental Seismicity Catalogue Marco Pagani Executive Committee Hazard Coordinator, GEM Foundation Slides
Seismic Observation and Seismicity of Zimbabwe
 Seismic Observation and Seismicity of Zimbabwe Mr. Innocent Gibbon Tirivanhu MASUKWEDZA (2016 Global Seismology course) Meteorological Services Department of Zimbabwe 1. Introduction The Seismology section
Scarborough Tide Gauge
 Tide Gauge Location OS: 504898E 488622N WGS84: Latitude: 54 16' 56.990"N Longitude: 00 23' 25.0279"W Instrument Valeport 740 (Druck Pressure Transducer) Benchmarks Benchmark Description TGBM = 4.18m above
Near-Field Sturgeon Monitoring for the New NY Bridge at Tappan Zee. Quarterly Report October 1 December 31, 2014
 Near-Field Sturgeon Monitoring for the New NY Bridge at Tappan Zee Quarterly Report October 1 December 31, 2014 Prepared by AKRF, Inc. 7250 Parkway Drive, Suite 210 Hanover, MD 21076 for New York State
DETERMINATION OF EARTHQUAKE PARAMETERS USING SINGLE STATION BROADBAND DATA IN SRI LANKA
 DETERMINATION OF EARTHQUAKE PARAMETERS USING SINGLE STATION BROADBAND DATA IN SRI LANKA S.W.M. SENEVIRATNE* MEE71 Supervisors: Yasuhiro YOSHIDA** Tatsuhiko HARA*** ABSTRACT We determined epicenters and
Second Session of the Pan-Arctic Regional Climate Outlook Forum (PARCOF-2), virtual forum, October 2018
, virtual forum, October 2018") Second Session of the Pan-Arctic Regional Climate Outlook Forum (PARCOF-2), virtual forum, October 2018 Consensus Statement for the Arctic Winter 2018-2019 Season Outlook Climate change in the Arctic is
Second Session of the Pan-Arctic Regional Climate Outlook Forum (PARCOF-2), virtual forum, October 2018 Consensus Statement for the Arctic Winter 2018-2019 Season Outlook Climate change in the Arctic is
Seismic Recording Station AZ_PFO Summary Report
 Seismic Recording Station AZ_PFO Summary Report Thank you for hosting station AZ_PFO on your property. We hope that you find the enclosed report interesting. Your station is one of the 2000 USArray seismic
Monthly Magnetic Bulletin
 BRITISH GEOLOGICAL SURVEY Port Stanley Observatory Monthly Magnetic Bulletin July 2010 10/07/PS Jason Islands a ar C West Falkland Kin gg eor ge B Port Salavador ay Weddell Island Mount Osborne So un d
Location. Datum. Survey. information. Etrometa. Step Gauge. Description. relative to Herne Bay is -2.72m. The site new level.
 Tide Gauge Location OS: 616895E 169377N WGS84: Latitude: 51 o 22.919196 N Longitude: 01 o 6.9335907 E Instrument Type Etrometa Step Gauge Benchmarks Benchmark TGBM = 5.524m above Ordnance Datum Newlyn
JRC MARS Bulletin Crop monitoring in Europe January 2019
 Online version Issued: 21 January 2019 r JRC MARS Bulletin Vol. 27 No 1 JRC MARS Bulletin Crop monitoring in Europe January 2019 Continued mild winter Improved hardening of winter cereals in central and
the IRIS Consortium Collaborative, Multi-user Facilities for Research and Education Briefing NSF Business Systems Review September 9, 2008
 the IRIS Consortium Collaborative, Multi-user Facilities for Research and Education Briefing NSF Business Systems Review September 9, 2008 A facilities program for collection and distribution of seismological
Computing & Telecommunications Services Monthly Report January CaTS Help Desk. Wright State University (937)
") January 215 Monthly Report Computing & Telecommunications Services Monthly Report January 215 CaTS Help Desk (937) 775-4827 1-888-775-4827 25 Library Annex helpdesk@wright.edu www.wright.edu/cats/ Last
January 215 Monthly Report Computing & Telecommunications Services Monthly Report January 215 CaTS Help Desk (937) 775-4827 1-888-775-4827 25 Library Annex helpdesk@wright.edu www.wright.edu/cats/ Last
PRELIMINARY DRAFT FOR DISCUSSION PURPOSES
 Memorandum To: David Thompson From: John Haapala CC: Dan McDonald Bob Montgomery Date: February 24, 2003 File #: 1003551 Re: Lake Wenatchee Historic Water Levels, Operation Model, and Flood Operation This
Location. Datum. Survey. information. Etrometa. Step Gauge. Description. relative to Herne Bay is -2.72m. The site new level.
 Tide Gauge Location OS: 616895E 169377N WGS84: Latitude: 51 o 22.919196 N Longitude: 01 o 6.9335907 E Instrument Type Etrometa Step Gauge Benchmarks Benchmark TGBM = 5.524m above Ordnance Datum Newlyn
The ISC-GEM Global Instrumental Reference Earthquake Catalogue ( )
") The ISC-GEM Global Instrumental Reference Earthquake Catalogue (1900-2009) Dmitry Storchak, Domenico Di Giacomo, István Bondár, James Harris International Seismological Centre (ISC), Thatcham, United Kingdom
The ISC-GEM Global Instrumental Reference Earthquake Catalogue (1900-2009) Dmitry Storchak, Domenico Di Giacomo, István Bondár, James Harris International Seismological Centre (ISC), Thatcham, United Kingdom
WIND DATA REPORT FOR THE YAKUTAT JULY 2004 APRIL 2005
 WIND DATA REPORT FOR THE YAKUTAT JULY 2004 APRIL 2005 Prepared on July 12, 2005 For Bob Lynette 212 Jamestown Beach Lane Sequim WA 98382 By John Wade Wind Consultant LLC 2575 NE 32 nd Ave Portland OR 97212
Causes of high PM 10 values measured in Denmark in 2006
 Causes of high PM 1 values measured in Denmark in 26 Peter Wåhlin and Finn Palmgren Department of Atmospheric Environment National Environmental Research Institute Århus University Denmark Prepared 2 October
SOURCE PROCESS OF THE 2003 PUERTO PLATA EARTHQUAKE USING TELESEISMIC DATA AND STRONG GROUND MOTION SIMULATION
 Synopses of Master Papers Bulletin of IISEE, 47, 19-24, 2013 SOURCE PROCESS OF THE 2003 PUERTO PLATA EARTHQUAKE USING TELESEISMIC DATA AND STRONG GROUND MOTION SIMULATION Fabricio Moquete Everth* Supervisor:
Computing & Telecommunications Services
 Computing & Telecommunications Services Monthly Report September 214 CaTS Help Desk (937) 775-4827 1-888-775-4827 25 Library Annex helpdesk@wright.edu www.wright.edu/cats/ Table of Contents HEAT Ticket
SCEK Report on Phase I ( ) Induced Seismicity Monitoring Project (ISMP) Carlos Salas, VP Oil & Gas, Geoscience BC
 Induced Seismicity Monitoring Project (ISMP) Carlos Salas, VP Oil & Gas, Geoscience BC") SCEK Report on Phase I (2012 2013) Induced Seismicity Monitoring Project (ISMP) Carlos Salas, VP Oil & Gas, Geoscience BC Contents Background... 2 Summary of Activities... 5 Additional Work... 8 References...
SCEK Report on Phase I (2012 2013) Induced Seismicity Monitoring Project (ISMP) Carlos Salas, VP Oil & Gas, Geoscience BC Contents Background... 2 Summary of Activities... 5 Additional Work... 8 References...
Ocean & Sea Ice SAF. Validation of ice products January March Version 1.1. May 2005
 Ocean & Sea Ice SAF Validation of ice products January 2002 - March 2005 Version 1.1 May 2005 Morten Lind, Keld Q. Hansen, Søren Andersen 1 INTRODUCTION... 3 2 PRODUCTS VALIDATION METHODS... 3 3 GENERAL
Latitude (North) Longitude (East) Latitude (North) Longitude (East)
 Longitude (East) Latitude (North) Longitude (East)") BODY-WAVE MAGNITUDES AND LOCATIONS OF PRESUMED EXPLOSIONS AT THE CHINESE TEST SITE, 1967-1996 Aoife O'Mongain (1), Alan Douglas, John B. Young AWE Blacknest (1) on placement from the British Geological
BODY-WAVE MAGNITUDES AND LOCATIONS OF PRESUMED EXPLOSIONS AT THE CHINESE TEST SITE, 1967-1996 Aoife O'Mongain (1), Alan Douglas, John B. Young AWE Blacknest (1) on placement from the British Geological
RELOCATION OF THE MACHAZE AND LACERDA EARTHQUAKES IN MOZAMBIQUE AND THE RUPTURE PROCESS OF THE 2006 Mw7.0 MACHAZE EARTHQUAKE
 RELOCATION OF THE MACHAZE AND LACERDA EARTHQUAKES IN MOZAMBIQUE AND THE RUPTURE PROCESS OF THE 2006 Mw7.0 MACHAZE EARTHQUAKE Paulino C. FEITIO* Supervisors: Nobuo HURUKAWA** MEE07165 Toshiaki YOKOI** ABSTRACT
WIND DATA REPORT. Vinalhaven
 WIND DATA REPORT Vinalhaven July 1, 2004 September 30, 2004 Prepared for Fox Islands Electric Cooperative By Melissa L. Ray Anthony L. Rogers April 4, 2005 Renewable Energy Research Laboratory 160 Governors
Jackson County 2013 Weather Data
 Jackson County 2013 Weather Data 61 Years of Weather Data Recorded at the UF/IFAS Marianna North Florida Research and Education Center Doug Mayo Jackson County Extension Director 1952-2008 Rainfall Data
Mountain View Community Shuttle Monthly Operations Report
 Mountain View Community Shuttle Monthly Operations Report December 6, 2018 Contents Passengers per Day, Table...- 3 - Passengers per Day, Chart...- 3 - Ridership Year-To-Date...- 4 - Average Daily Ridership
Seismic Recording Station TA_109C Summary Report
 Seismic Recording Station TA_109C Summary Report Thank you for hosting station TA_109C on your property. We hope that you find the enclosed report interesting. Your station is one of the 2000 USArray seismic
Past and future climate development in Longyearbyen, Svalbard
 Past and future climate development in Longyearbyen, Svalbard Eirik J. Førland 1,2 and Ketil Isaksen 1 1). Norwegian Meteorological Institute 2). Norwegian Centre for Climate Services Svalbard Science
Korean Arctic Research 2015 update
 FARO Annual Meeting, ASSW 2016 Fairbanks, Alaska, 12 March 2016 Korean Arctic Research 2015 update International Cooperation Department Korea Polar Research Institute Outline KOPRI and Korean Arctic research;
Teleseismic waveform modelling of the 2008 Leonidio event
 The 6 January 2008 (Mw6.2) Leonidio (southern Greece) intermediate depth earthquake: teleseismic body wave modelling Anastasia Kiratzi and Christoforos Benetatos Department of Geophysics, Aristotle University
Regional Sea Ice Outlook for Greenland Sea and Barents Sea - based on data until the end of May 2013
 Regional Sea Ice Outlook for Greenland Sea and Barents Sea - based on data until the end of May 2013 Sebastian Gerland 1*, Max König 1, Angelika H.H. Renner 1, Gunnar Spreen 1, Nick Hughes 2, and Olga
The Hellenic Seismological Network of Crete (HSNC): Monitoring results and the new strong motion network
: Monitoring results and the new strong motion network") The Hellenic Seismological Network of Crete (HSNC): Monitoring results and the new strong motion network Georgios Chatzopoulos 1, Ilias Papadopoulos 1 and Filippos Vallianatos 1 1 Technological Educational
The Hellenic Seismological Network of Crete (HSNC): Monitoring results and the new strong motion network Georgios Chatzopoulos 1, Ilias Papadopoulos 1 and Filippos Vallianatos 1 1 Technological Educational
Meteorological Data recorded at Armagh Observatory from 1795 to 2001: Volume I - Daily, Monthly and Annual Rainfall
 Meteorological Data recorded at Armagh Observatory from 1795 to 2001: Volume I - Daily, Monthly and Annual Rainfall 1838-2001 A. M. García-Suárez, C.J. Butler, D. Cardwell, A.D.S. Coughlin, A. Donnelly,
HARMONIZATION OF SEISMIC HAZARD MAPS FOR THE WESTERN BALKAN COUNTRIES : Overview of main BSHAP results
 Zagreb, Croatia Hotel Sheraton 12-13 May 2011 NATO SfP Project no. 983054 HARMONIZATION OF SEISMIC HAZARD MAPS FOR THE WESTERN BALKAN COUNTRIES : Overview of main BSHAP results Prof. Branislav Glavatović,
2018 Annual Review of Availability Assessment Hours
 2018 Annual Review of Availability Assessment Hours Amber Motley Manager, Short Term Forecasting Clyde Loutan Principal, Renewable Energy Integration Karl Meeusen Senior Advisor, Infrastructure & Regulatory
8.1 Attachment 1: Ambient Weather Conditions at Jervoise Bay, Cockburn Sound
 8.1 Attachment 1: Ambient Weather Conditions at Jervoise Bay, Cockburn Sound Cockburn Sound is 20km south of the Perth-Fremantle area and has two features that are unique along Perth s metropolitan coast
revised October 30, 2001 Carlos Mendoza
 Earthquake Sources in the circum-caribbean Region Puerto Rico Tsunami Mitigation and Warning Program Federal Emergency Management Agency Preliminary Report: Task 3 revised October 30, 2001 Carlos Mendoza
NEW LOCAL MAGNITUDE CALIBRATION FOR VRANCEA (ROMANIA) INTERMEDIATE-DEPTH EARTHQUAKES
 INTERMEDIATE-DEPTH EARTHQUAKES") Romanian Reports in Physics, Vol. 64, No. 4, P. 1097 1108, 2012 EARTH PHYSICS NEW LOCAL MAGNITUDE CALIBRATION FOR VRANCEA (ROMANIA) INTERMEDIATE-DEPTH EARTHQUAKES M. CRAIU, A. CRAIU, C. IONESCU, M. POPA,
Romanian Reports in Physics, Vol. 64, No. 4, P. 1097 1108, 2012 EARTH PHYSICS NEW LOCAL MAGNITUDE CALIBRATION FOR VRANCEA (ROMANIA) INTERMEDIATE-DEPTH EARTHQUAKES M. CRAIU, A. CRAIU, C. IONESCU, M. POPA,
Hermanus Magnetic Observatory
 Hermanus Magnetic Observatory A facility of the National Research Foundation Magnetic Results 2009 Hermanus, Hartebeesthoek and Keetmanshoop observatories 1. INTRODUCTION The Hermanus Magnetic Observatory
Contribution of Norwegian partners (Aanderaa Data Instruments and NIVA) to Safeport project ( ). Final report
 to Safeport project ( ). Final report") Contribution of Norwegian partners (Aanderaa Data Instruments and NIVA) to Safeport project (2010-2012). Final report NFR-196866 Entry and Berthing Ship and Port Advising System as an Element of Port ITS.
Contribution of Norwegian partners (Aanderaa Data Instruments and NIVA) to Safeport project (2010-2012). Final report NFR-196866 Entry and Berthing Ship and Port Advising System as an Element of Port ITS.
Monthly Geomagnetic Bulletin
 HARTLAND OBSERVATORY Monthly Geomagnetic Bulletin BRISTOL CHANNEL December 2002 02/12/HA Hartland NERC 2002 1. HARTLAND OBSERVATORY MAGNETIC DATA 1.1 Introduction This bulletin is published to meet the
Arun Platform Tide Gauge
 Arun Platform Tide Gauge Location OS: 506423E 97778N WGS84: Latitude: 50 46 11.39042"N Longitude: 00 29 31.73595"W Instrument Valeport 730 (Druck Pressure Transducer) TGBM Benchmarks Benchmark Description
National Earthquake Monitoring for Tsunami Early Warning. Burin Wechbunthung Sumalee Prachaub Seismological Bureau, Thai Meteorological Department
 National Earthquake Monitoring for Tsunami Early Warning Burin Wechbunthung Sumalee Prachaub Seismological Bureau, Thai Meteorological Department Seismic Sources Out line Historical Earthquake Damage from
Calculation of Focal mechanism for Composite Microseismic Events
 Calculation of Focal mechanism for Composite Microseismic Events Hongliang Zhang, David W. Eaton Department of Geoscience, University of Calgary Summary It is often difficult to obtain a reliable single-event
WIND DATA REPORT. Vinalhaven
 WIND DATA REPORT Vinalhaven April 1, 2004 June 30, 2004 Prepared for Fox Islands Electric Cooperative By Melissa L. Ray Anthony L. Rogers April 4, 2005 Renewable Energy Research Laboratory 160 Governors
COUNTRY REPORT. Jakarta. July, th National Directorate of Meteorology and Geophysics of Timor-Leste (DNMG)
") The Southeastern Asia-Oceania Flash Flood COUNTRY REPORT Jakarta. July, 10-12 th 2017 National Directorate of Meteorology and Geophysics of Timor-Leste (DNMG) Carla Feritas and Crisostimo Lobato Democratic
The Southeastern Asia-Oceania Flash Flood COUNTRY REPORT Jakarta. July, 10-12 th 2017 National Directorate of Meteorology and Geophysics of Timor-Leste (DNMG) Carla Feritas and Crisostimo Lobato Democratic