A first estimation of storage potential for selected aquifer cases
|
|
|
- Rosamund Rice
- 5 years ago
- Views:
Transcription


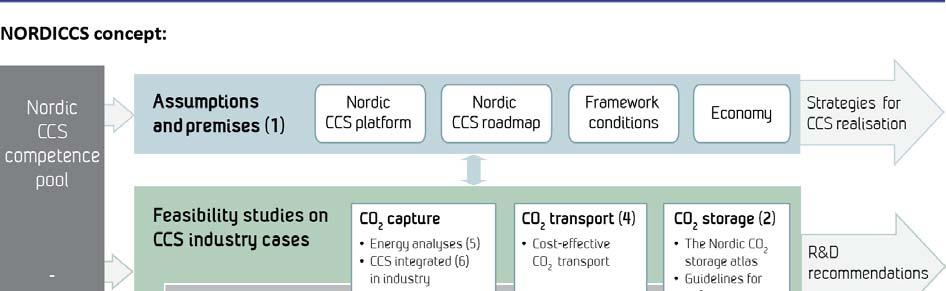
1 A first estimation of storage potential for selected aquifer cases Ane Lothe, Benjamin Emmel, Per Bergmo, Gry Möl Mortensen, Peter Frykman NORDICCS Technical Report D (D25) April 2014

2
3 Summary This report D "A first estimation of storage potential for selected aquifer cases (D25)" was in the beginning named Estimation of improved capacity and quantification of capacity and sealing properties (D25). The aim with this report is to present updated estimates on storage potential for some selected aquifers in the Nordic countries. The storage aquifers are selected on specified criteria as defined in the memo by Bergmo (Bergmo 2014). From Norway modelling and simulation of the Gassum Formation in the Skagerrak area and the Garn Formation at the Trøndelag Platform, offshore Mid Norway has been carried out. From Denmark the geological model building of the Vedsted structure in northeast Denmark and the Hanstholm structure, offshore Denmark is reported. From Sweden the Faludden sandstone located in the south east Baltic Sea is described, together with the Arnager Greensand located offshore Skåne in Sweden and finally the Höganäs Rya sequence, also deposited in the same area, close to Danish border. Preliminary capacity estimates are carried out for all the selected sites, but modelling has only been performed for the two Norwegian sites. Authors Ane Lothe, Sintef, Norway, Ane.Lothe@sintef.no Benjamin U. Emmel, SINTEF, Norway, BenjaminUdo.Emmel@sintef.no Per Bergmo, SINTEF Petroleum Research, Norway, Per.Bergmo@sintef.no Gry Møl Mortensen, Geological Survey of Sweden, Sweden, Gry.Mol.Mortensen@sgu.se Peter Frykman, GEUS, Denmark, pfr@geus.dk Date April 2014 About NORDICCS Nordic CCS Competence Centre, NORDICCS, is a networking platform for increased CCS deployment in the Nordic countries. NORDICCS has 10 research partners and six industry partners, is led by SINTEF Energy Research, and is supported by Nordic Innovation through the Top level Research Initiative. The views presented in this report solely represent those of the authors and do not necessarily reflect those of other members in the NORDICCS consortia, NORDEN, The Top Level Research Initiative or Nordic Innovation. For more information regarding NORDICCS and available reports, please visit
4 Table of contents Table of contents Introduction Overview of the first selected sites in Norway, Sweden and Denmark Norway Sweden Denmark Simulations for the Gassum Formation, Skagerrak area Background Model set up Results Model 1 and Model Hanstholm study area Discussion Parameter sensitivities An updated Model 2 with facies distribution and faults Results of simulations using new facies model and faults Conclusions Simulation from the Trøndelag Platform, offshore Mid-Norway Available knowledge of the site Site Concept Method Results Simulations with 51 injection sites Simulations with 10 selected injection sites Discussion Description of the model building for Hanstholm structure, NW Denmark Background and study area Gassum Formation (Upper Triassic Lower Jurassic) Well database Structural maps Storage reservoir unit and seal Model setup
5 5.3.1 Well data for conditioning N/G mapping Facies modelling Petrophysical modelling Export of grid Description of the model building for Vedsted structure, Northwest Denmark Structural outline and geology of the Vedsted area Dynamic flow simulations Model setup Well data Porosity calculations Design and detail of geological model for the Gassum reservoir Lithology subdivision Assignment of physical properties to layers, Gassum reservoir External Boundary Conditions Further work for the Danish sites First estimations of storage potential in Sweden Geological description of the Faludden sandstone The CO 2 storage properties to Faludden Sandstone The caprock units Geological description of the Arnager Greensand Formation The CO 2 storage properties to Arnager Greensand Formation The caprock unit Geological description of the Höganäs-Rya sequence The CO 2 storage properties to the Höganäs-Rya sequence The caprock units Summary References:
6 1. Introduction This report D "A first estimation of storage potential for selected aquifer cases (D25)" was originally named Estimation of improved capacity and quantification of capacity and sealing properties (D25). The aim with this report is to present updated estimates on the storage potential for some selected aquifers in the Nordic countries. The storage aquifers are selected on specified criteria as defined in the memo by Bergmo (Bergmo 2014) and the ranking carried out in report D (Screening and ranking of aquifer formations, storage units and traps). 2. Overview of the first selected sites in Norway, Sweden and Denmark Here is an overview of possible storage candidates for Norway, Denmark and Sweden. 2.1 Norway Several units are potentially well suited for CO 2 storage in the North Sea (Halland 2012), Norwegian Sea (Bøe et al. 2005, Lundin et al. 2005, Halland et al. 2013a) and in the Barents Sea (Halland et al. 2013b). During the last years SINTEF PR has been carrying out reservoir modelling in several areas: For the Gassum Formation, in the Norwegian and partly also Danish part of Skagerrak (Bergmo et al. 2013, Bergmo et al. in press). The Johansen Formation, east of Troll, is a potential storage site that has been investigated by several (e.g. Eigestad et al. 2009). Utsira Formation (e.g. Zweigel et al. 2004) For the Garn Formation at the Trøndelag Platform, offshore Mid-Norway SINTEF PR has carried out migration modelling using SEMI (Rinna et al. 2013, Grøver et al. 2013). Another possible site could be the Skade and Utsira Fm together, this is mapped by NPD as a very promising storage formation (Table 2-1). However, at present we do not have access to this data in the Nordic project. It was agreed, based on data availability, scanning of sites and ranking to start with simulations of the Gassum Formation, Skagerrrak area and the Trøndelag Platform area, offshore Mid-Norway. The results are presented in the Chapter 3 and 4, respectively. 5
7 Table 2-1 Overview of possible aquifers in Norwegian Part of the North Sea. From NPD Storage Atlas. Evaluated Aquifers Avg depth Bulk volume Pore volume Avg K Open/ Closed Storage eff Density Storage capacity m m 3 m 3 md % t/rm 3 Gtons Utsira Formation and Skade E E+11 >1000 Half Open Bryne/Sandnes Formations E E Half Open Sognefjord Delta East E E Half Open Statfjord Formation East E E Half Open Gassum Formation E E Half Open Farsund Basin E E Half Open Johansen and Cook Fm N/A 9.14E Faults Fiskebank Formation E E Half Open Stord Basin, Jurassic model E E Half Open Hugin East E E Half Open Sweden In Sweden eight potential storage units and one trap have been identified (Mortensen 2014, Anthonsen et al. 2013, Erlström et al. 2011, Erlström & Sivhed 2012). According to a ranking procedure in the frame of NORDICCS (Bergmo 2014) the three most promising sites were selected and are represented as follows (Table 2-1): The Faludden sandstone in the south-east Baltic Sea The Arnager Greensand Formation in the south-west Scania The Höganäs-Rya sequence (equiv. Gassum Fm.) in the south-west Scania 6
8 Seismic Well data Groundwater Seismicity Lithology Multiple seals Lateral extend Fault intensity Thickness Thickness/ Pore pressure Heterogeneity Permeability Porosity Depth Project Table 2-2 Overview of potential storage sites in Sweden, ranked according to NORDICCS (Bergmo 2014) Storage unit (u) or trap (t) Reservoir properties Seal properties Safety/ risk Maturity /data coverage Name Storage capacity in Mt Total Score Faludden (u) Arnager Greensand (u) Höganäs-Rya (u) L.Cretaceous sands, unit A (u) Dalders structure (t) När (u) Bunter Sandstone (u) Viklau (u) L.Cretaceous sands, unit B (u) Denmark As summed up in NORDICCS report D , several CO 2 screening and exploration programs have evaluated the Danish CO 2 storage potential, since Table 2-3 summarises the storage capacity calculated in the respective exploration programmes through the years. Table 2-3 Overview of all Danish storage sites evaluated in exploration programs. Storage sites Project Capacity Remarks Bunter Sandstone Formation Joule II 2900 Mt Storage efficiency factor 6% 7 Storage in traps Tønder Formation Joule II 977 Mt Storage efficiency factor 6% Storage in traps Gassum Formatiom Joule II 1195 Mt Storage efficiency factor 6% Storage in traps Haldager Formation Joule II 325 Mt Storage efficiency factor 6% Storage in traps Frederikshavn Formation Joule II 199 Mt Storage efficiency factor 6% Storage in traps
9 Gassum Structure GESTCO 242 Mt Storage efficiency factor 40% Hanstholm Structure Havnsø Structure GESTCO Dynamis Skagerrak Project GESTCO CO2STORE 2752 Mt Max Mt Min. 250 Mt 923 Mt Min Mt Storage efficiency factor 40% Storage efficiency factor 40% Reservoir information from Stenlille natural gas storage. Horsens Structure GESTCO 490 Mt Storage efficiency factor 40% The structure has later been reinterpreted as three minor structures. Pårup Structure GESTCO 90 Mt Storage efficiency factor 40% Rødby Structure GESTCO 151 Mt Storage efficiency factor 40% Stenlille Structure GESTCO 62 Mt Storage efficiency factor 40% Presently natural gas storage. Thisted Structure GESTCO Mt Storage efficiency factor 40% Tønder Structure GESTCO 93 Mt Storage efficiency factor 40% Vedsted Structure GESTCO Vedsted Demoproject 161 Mt 100 Mt Storage efficiency factor 40% Project Initial reservoir modelling result. No public data. Voldum Structure GESTCO 288 Mt Storage efficiency factor 40% Røsnæs Structure CO2STORE 227 Mt Storage efficiency factor 40% Skagerrak Area 2 Skagerrak Min. 250 Mt Gently dipping open aquifer SNS 1,2,3 WBS 1,2 3, 4, 5, 6, 7, 8 and 9 Oil & Gas fields Screening 2013 Screening 2013 Joule II GESTCO GeoCapacity 590 Mt 628 Mt 810 Mt Capacity not yet calculated Capacity not yet calculated Data from 16 fields Data from 11 fields Data from 17 fields 8

10 3. Simulations for the Gassum Formation, Skagerrak area The Upper Triassic Gassum Formation is deposited in the whole Skagerrak-Kattegat area (Figure 3-1). Three reservoir models have been built and the results from the simulations will be presented and discussed. The work presented here for this formation is carried out built on data and earlier work from a Climit programme (Project number ), sponsored by Gassnova and industry. It has been updated and published in Bergmo et al. (2011), in addition as Nordiccs deliverable D Figure 3-1 Overview map for the top Gassum Formation surface in the Skagerrak area. The modelled areas are marked as Model 1, Model 2 and the southern Hanstholm area. Colour scale in meters. 9
. 3.")
11 Figure 3-2 Lithostratigraphic column from the Norwegian-Danish Basin (Nielsen 2003). 3.1 Background The Skagerrak-Kattegat area between Denmark, Sweden and Norway has no previous record of oil exploration or other activities which could have resulted in extensive mapping of the sub-surface. The data coverage is therefore scarce compared to regions in the North Sea and the density of data is decreasing as one moves eastward in Skagerrak. An initial screening of possible CO 2 storage sites in the region has been performed based on published work, new interpretations of seismic lines and interpretation of available well logs. The screening has revealed large open/semi-closed dipping aquifers in the Upper Triassic Gassum (Fawad et al. 2011), which is evaluated for CO 2 storage. This work presents reservoir simulations of CO 2 injection into 10
12 the Gassum in the area north and north-east of the Fjerritslev Trough. In addition a model of the Hanstholm structure, offshore Denmark has been constructed on which initial simulations have been performed for estimating storage capacity. The Gassum Formation is overlain by thick marine mudstones of the Fjerritslev Formation, which is characterized by large lateral continuity, forming a highly competent cap rock unit probably making the Gassum Formation one of the most promising reservoirs for CO 2 storage in the study area. Here we only present results from simulations of CO 2 injection into the Gassum Formation and it is assumed that the Fjerritslev Formation is sealing. 3.2 Model set up Three locations in the Skagerrak region have been investigated for CO 2 injection in this study (Figure 3-1). Two open dipping aquifer models in the Gassum Formation (Model 1, Model 2) with homogenous net thickness were made. In addition a model of the Hanstholm structure just south of Model 1 has been constructed on which initial simulations were performed for estimating storage capacity. Location of Model 1 and Model 2 was decided based on the concept of storing CO 2 in an open dipping trap. The injection points should therefore be located down flank of a gentle dipping formation. The main short term mechanism for trapping CO 2 is assumed to be capillary trapping of CO 2 as residual phase. In addition, the long migration distance of the injected CO 2 will enhance the dissolution of CO 2 into the formation water. The Hanstholm structure is assumed to be a closed structure and was chosen for its size. The main short term trapping mechanism is assumed to be capillary trapping by the assumed sealing cap rock. Reservoir properties are based on petrophysical logs from 12 Danish wells (including 6 offshore wells). No wells penetrate the model areas and average properties of the wells have been used. No thickness maps of formations were available when the reservoir models were built and a constant effective thickness was assumed. The model thicknesses are equal to the average net thickness in the well logs (not weighted) giving 50 meter thickness for Gassum Formation. Average effective porosity from the well logs is 23 %, but a linear correlation to depth was applied based on average porosity and depth points in the wells. The range of porosity in the two models is between 21 % and 29 %. Permeability was correlated to porosity by a relationship developed by GEUS for this study based on their regional database. Permeability varies between 200 and 650 md. Average net permeability from wells is 210 md. The open dipping trap models (Model 1 and Model 2) cover a large depth range and hence one can expect a relatively large variation in temperature and salinity of the formation water. A salinity gradient of 75.6 ppm NaCl per meter and a temperature gradient of 31 C/m were assumed based on regional models and well data. In order to model the effect of this on density and viscosity of the formation water and solubility of the injected CO2, 6 pvt regions (having constant temperature and salinity) were generated for Model 1 and Model 2. Viscosity and density of the formation water was calculated for each region based on Spivey et al. (2004) and Kestin et al. (1978). The solubility of CO 2 in brine is calculated from a correlation by Spycher et al The density of CO 2 is based on an equation of state for CO 2 developed by Span and Wagner (1996). The viscosity of CO 2 was calculated from a correlation by Fenghour et al. (1998). Due to the relatively large grid block sizes linear relative permeability curves for brine and CO 2 phases were used. Residual CO 2 was set to 20 % and residual brine was set to 7 %. Measurement on cores from the Utsira Sand at the Sleipner CO 2 injection site (unconsolidated sand stone) indicates residual CO 2 saturation of 25% (Akervoll et al. 2008). Assuming 20 % might be on the low side (i.e. will underestimate trapped CO 2) but no measurements were available for the Gassum sandstone. 11

13 Initial hydrostatic conditions were assumed, with open/semi-closed boundaries up-dip towards north (Model 1) and northwest (Model 2). The open boundaries to the north were modelled by production wells producing at constant pressure giving amount of CO 2 migrating out of the model as produced CO Results In all three models, a total of 250 million tonnes of CO 2 is injected down-flank using three horizontal injection wells over a period of 25 years. Total simulated time is 4000 years Model 1 and Model 2 Injection took place by 3 horizontal injection wells perforated in the bottom layer with distance between the injection wells of 8 10 km. The wells have perforation intervals of meters. Injection depth was approximately 2410 m (Model 1) and 1708 m (Model 2). The well injection rate was 3.33 Mt/year = Sm3/day/well giving a total of 10 Mt/year. The results of the simulations on the open dipping traps are shown in Figure 3-3 and Figure 3-4 as distribution of CO 2 saturation. For Model 1, CO 2 reaches the northern border after 400 years, and after 4000 years 7.5 % has escaped. The rest is capillary trapped (~74.5%) or dissolved (~18%). Figure 3-3 shows CO 2 saturation in Model 1 after 25 years (stop of injection), after 400 years and after 4000 years when the first CO 2 has reached the open boundary to the North. The open boundary is modelled with constant hydrostatic pressure. Figure 3-4 shows the plume development for Model 2 first after 25 years, secondly after 4000 years. We see that the plume has not spread much, and has not reach the boundaries to the model. Figure 3-3 Plume development, shown as CO 2 saturation, for Model 1 after 25, 400, and 4000 years after injection stop. The model is approximately 40 x 50 km. 12

. The model is approximately 34 by 42 km. 3.4 Discussion The injectivity is mainly a function of the permeability in the regions close to the injection wells.")
14 Figure 3-4 Plume development, shown as CO 2 saturation, for Model 2 after 25 year (figure left) and 4000 years (figure right) after injection stop. The model is approximately 50 x 100 km Hanstholm study area The results of simulation of CO 2 injection in the Hanstholm structure is shown in Figure 3-5. Three horizontal injection wells were located down flank on the western and north-western side of the structure. The injected CO 2 migrates towards the top of the structure and 12.5% is dissolved into the formation water after 4000 years. Figure 3-5 shows CO 2 distribution after 25, 400 and 4000 years. Figure 3-5 Distribution of injected CO2 in the Hanstholm structure after 25, 400, and 4000 years (from left to right). The model is approximately 34 by 42 km. 3.4 Discussion The injectivity is mainly a function of the permeability in the regions close to the injection wells. If the injectivity is low the bottom hole pressure (BHP) of the injection well will be high since a higher pressure is 13
15 14 Project needed to push the injection phase at a given rate into the reservoir. Typical parameters affecting permeability for sand stone reservoirs are burial history and depth (diagenesis), shale content and porosity. A general observation is that the injectivity reduces with increasing depth and increasing shale content. The increase in BHP for the three horizontal injection wells for Model 1 and Model 2 is around 90 bar in both cases. A safe pressure with respect to fracturing of the cap rock is assumed to be around 75 % of the lithostatic pressure but a detailed characterisation of the overburden is needed to estimate this. Estimating a safe pressure increase has not been performed at this stage but the difference between hydrostatic and lithostatic pressure increase with depth enabling a higher safe pressure increase with depth. A first estimate of safe pressure below the cap rock can be calculated by assuming an average density of the overlying formations. An estimate for Model 1 and Model 2 gives safe pressure increases of approximately 108 and 76 bars respectively if assumed sea depth is 100 meter and overburden density is 2000 kg/m3. No maps of sea depth in the injection areas were available but increasing sea depth to 400 meter gives corresponding safe pressure increases of 86 and 54 bars. If the pressure increase is too high several options exists to reduce it. Increase number of injection wells, produce formation water (will need production wells). The present simulations indicate that the open dipping traps in the Gassum Formation can permanently store 250 Mt CO 2 by residual trapping. More detailed mapping of reservoir and overburden is required for better estimate of safe pressure, required number of injection (and production) wells and better estimates of CO 2 migration in the trap. The bottom hole pressure increase in the Hanstholm structure when using 3 horizontal injection wells are approximately 140 bar. This is too high although the pressure increase below the cap rock (some distance away from the well perforations) will be lower. The option of increasing the number of injection wells and/or introduce water production wells down flank should therefore be considered. As for the other models a more detailed characterization of the cap rock and overburden is required to determine the safe pressure increase. The structure is however large enough to contain 250 Mt CO 2 assuming the cap rock is sealing Parameter sensitivities In the open dipping traps of Model 1 and Model 2 the lateral migration speed of CO 2 is important for estimating capacity and safety of the storage site. A series of simulations on a synthetic tilted model were performed to investigate migration speed and dissolution rate as function of grid block resolution and capillary pressure. The synthetic model is 1500 by meters and has a thickness of 50 m. The tilt of the model is 2 and the top of the model is at 1000 meter depth (shallow part). Porosity and horizontal permeability is 22.5 % and 210 md respectively. Vertical to horizontal permeability ratio is 0.1 and the injection is down flank in one vertical well perforating the bottom layers. Injection rate was tonnes of CO 2 per year for three years, total pore volume of the model is around1.7 x 10 6 m 3. Grid resolution and capillary pressure were varied in the sensitivity simulations. Capillary pressure will affect the migration speed and thickness of the CO 2 front. No capillary pressure measurements were available and capillary pressure measured on Utsira sand was used as basis for sensitivity simulations. The Utsira capillary entrance pressure (no gas saturation) equals to 0.01 bars. Simulations were performed with varying capillary pressure by multiplying the measured capillary pressure curve by factors 2, 4, 8, 16, and 32. It is assumed that the capillary pressure in Gassum will be higher than the capillary pressure in Utsira due to the reservoir's grain-size, sorting and assumed cementation (smaller pore throats). The effect of increasing the capillary pressure on CO 2 distribution is shown in Figure 3-6a for the model with a grid block size of 100 by 100 meters and layer thickness below the top equal to 0.5 meter. It can be seen that an increase in the capillary entry pressure will reduce the total migration distance of the injected CO 2. This is because the migrating CO 2 has to overcome the capillary entry pressure before it can flow into a neighbouring grid block. Thickness of the migrating CO 2 front will thus be larger if the grid layering is fine enough to capture this. Capillary effects are a pore scale phenomenon and since large scale models have to

16 be coarsely gridded the effect of the capillary pressure is scaled into the grid block size and the critical gas saturation (i.e. the minimum gas saturation necessary for the gas to be mobile). No simulation tests have been performed on how the distribution of CO 2 will depend on critical and residual gas saturation. The injected CO 2 will due to buoyancy forces migrate along the top of the model. The thickness of the migrating front will in the simulations depend on grid layer thickness and critical gas saturation. These should be balanced to represent the effect of capillary pressure. However, both of these parameters are unknown. Figure 3-6b displays the effect of refining the layers below the top of the model from 5 to 0.5 meter layer thickness. Increasing the layer thickness will reduce the plume length. This is due to increased thickness of the front (one layer in the grid) and because the increased size of the grid blocks will require a larger volume of CO 2 in each grid block to overcome the critical gas saturation. This will slow down the speed of the migrating front. No sensitivity on the gas distribution by refining the areal grid block size has been investigated. Having smaller grid blocks will reduce the gas volume required to overcome the critical gas saturation but this effect will be minor if the coarsest grid resolution is sufficient to resolve the shape of the migrating CO 2. Dissolution of CO 2 into the formation water is a function of the contact area between the CO 2 phase and under-saturated formation water. In practice this will depend on how large volume CO 2 has swept because almost all the dissolved CO 2 is present in the residual non-mobile water. An increase in migration distance will result in an increase in dissolved CO 2. Simulations with refined layer thickness below the top were performed for Model 2. Base case simulations which had 5 meter layer thickness would correspond to a very high capillary entry pressure. Results of refining the layers at the top to 1 and 2 meters are shown in Figure 3-7. The migration distance for the refined models is increased, but the injected CO 2 is still within the boundaries of the model. Similar increase in migration distance should be expected for Model 1 with the consequence that more CO 2 migrates out of the boundaries of the model. Figure 3-6 (a) Effect of capillary pressure on migration distance. Capillary entrance pressure in the different simulations was (from left to right): 0 (no capillary pressure), 0.01, 0.02, 0.04, 0.08, 0.16 and 0.32 bar. (b) Plots show CO 2 distribution after migration has stopped. The layer thickness has been varied (from left to right): 0.5 m, 0.75 m, 1 m, 2 m, 5 m layer thickness. 15
 and 1 m (right). 3.")
17 Figure 3-7 Distribution of injected CO 2 after 4000 years for the base case model with uniform layer thickness of 5 m in the whole model (left) and for refined layer thickness below the top equal to 2 m (middle) and 1 m (right). 3.5 An updated Model 2 with facies distribution and faults Simulations using an updated reservoir model where facies distribution from Nielsen (2003) is included have been performed (Figure 3-8). The new interpretation is built on facies and porosity logs from Børglum-1 and J-1x wells. The major faults are included from seismic. The NE-SW elongation of the facies bodies are derived from the interpretation of the depositional environment as mainly fluvial to estuarine, with trends perpendicular to the assumed NW-SE trending coastline. No capillary pressure in the saturation functions is used. The capillary effect is scaled into relative permeability end points and grid resolution. The relative permeability end-points are for irreducible water saturation S wir = 0.07 and critical gas saturation S gc = 0.2. A linear relative permeability functions is used and no hysteresis is included. The injection rate was set to 10 Mt CO 2 per year for 25, 50 and 100 years. Three horizontal injection wells and three horizontal production wells are used in the simulations (Figure 3-9). Open boundary conditions were set to the North. 16

. Figure 3-11 shows the same amount of injected CO 2 after 4000 years.")
18 Figure 3-8 The figure shows facies model for the North-Eastern Gassum Formation. The main facies are sand, silt and shales. Figure 3-9 The figure shows estimated permeability distribution for the Gassum Formation in study area model 1, with model updates. The well positions are marked. 3.6 Results of simulations using new facies model and faults For model 2, an updated reservoir model was made, based on facies heterogeneities and with faults included. Simulations were carried out on this model with injection of 10 Mt CO 2 per year for 25, 50 and 100 years (250, 500 and 1000 Mt). The simulation results show little spread in the injected gas during injection (see Figure 3-10). Figure 3-11 shows the same amount of injected CO 2 after 4000 years. Actually, we see the same evolving distribution patterns for 250, 500 and 1000 Mt CO 2, but naturally larger areas with highly saturated CO 2 is seen with the largest amount of CO 2 injected and some CO 2 has migrated towards the eastern part for the case with 1000 Mt injected. After 6000 years (Figure 3-12) 3 Mt (e.g. 3 ) has 17

19 migrated out of the model through the open boundary in the case when 1000 Mt CO 2 is injected. The other two cases show no CO 2 migration out of the model. If one compares modelling results for the homogenous model and the heterogenous model for study area 2, with 500 Mt CO 2 injection after 4000 years, one can observe approximately the same migration pattern for both runs. The difference is that the heterogeneous facies distribution seems to favour slower migration and more CO 2 dissolved and capillary trapped in the deeper part of the formation (see Figure 3-13). Figure 3-10 The maps shows the initial distribution of CO 2 after the injection period, for 250 Mt, 500 Mt and 1000 Mt CO 2 injected. The injection rate is 10 Mt CO 2 per year. The colour scale shows gas saturation where 1 is fully saturated. Figure 3-11 The maps shows distribution of CO 2 after 4000 years, for 250 Mt, 500 Mt and 1000 Mt CO 2 injected. The injection rate is 10 Mt CO 2 per year. The colour scale shows gas saturation where 1 is fully saturated. 18


20 Figure 3-12 The maps shows distribution of CO 2 after 6000 years, for 250 Mt, 500 Mt and 1000 Mt CO 2 injected. The injection rate is 10 Mt CO 2 per year. The colour scale shows gas saturation where 1 is fully saturated. Figure 3-13 CO 2 distribution after 4000 years after injection of 500 Mt CO 2. Left figure show the homogenous model and the right figure show the heterogenous model. Simulations on the heterogeneous model indicate that one can permanently store 1 Gt CO 2 without migration out of the formation. The injected CO 2 occupies approximately 1.6 % of the pore volume and in addition 25 % of the injected CO 2 is dissolved after 6000 years. The estimated pore volume in the open dipping Gassum Formation North-East of the main fault zone (see Figure 3-8) is m 3. The pore 19
21 volume of the simulation model is m 3 and assuming the same storage efficiency for the larger area as in the simulation model would give a storage capacity of 3.7 Gt CO 2 for the Nort-Eastern part of the Gassum Formation. 3.7 Conclusions Simulations on the homogenous model indicate that the Late Triassic Gassum Formation has the capacity for storing at least the 250 million tonnes of CO 2 from the mapped industrial sources in the Skagerrak- Kattegat area but it must be emphasized that there are large uncertainties in the constructed models due to scarcity of data. The most critical factors for safe storage are the fracturation pressure of the sealing cap rock and the parameters controlling lateral migration of the injected CO 2. The induced pressure increase in the Hanstholm model is higher than the estimated safe pressure increase for the cap rock integrity, but the formation may still be suitable for storage by increasing the number of injection and water production wells. Further characterization of the cap rock and overburden is required to give a better estimate of fracturation pressure in all three target areas. Sea bottom depth may be a limiting factor for the open dipping traps since a thinner overburden will reduce the fracturation pressure of the cap rock. Simulations on the heterogeneous model indicate that up to 1 Gt CO 2 can be stored in the modelled area. Extrapolating this result to include the whole North-Eastern part of the Gassum Formation (see Figure 3-8) would give a maximum storage capacity of 3.7 Gt CO 2. However, different topography, heterogeneity and dip in the regions not simulated will affect this estimate. The main results indicate that the north-eastern part of the Gassum formation on the Danish side is the most promising target for injection of CO 2. This is based on the observation that all the injected CO 2 is capillary trapped or dissolved within the model boundaries, the injection pressure is thought to be in the safe pressure range. The location is still worth investigating further since small changes in flow parameters can change the maximum plume size of the injected CO 2. These parameters are at the present uncertain and more data is needed for better characterization of the target formation. The Hanstholm structure has a domal closure that can hold the injected amount of CO 2 but simulation results from the current model indicate injectivity problems with the applied high injection rates. Introducing a larger number of injection wells and/or production wells could change this and if it is possible to build confidence in the sealing properties of the cap rock, Hanstholm could be the preferred target. Further characterization of the target formations and the overburden could also change the ranking of the models (cap rock integrity and safe pressure increase). 20
.")
22 4. Simulation from the Trøndelag Platform, offshore Mid-Norway The Trøndelag Platform, offshore Norway covers an area of more than 50,000 km 2 (Figure 4-1). It is roughly rhomboid in shape and is situated between 63ºN - 65º50'N and 6º20'E - 12ºE (Blystad et al., 1995). The platform has been a large stable area since the Jurassic and it is covered by relatively flat-lying and mostly parallel-bedded strata that dip gently north-westwards (see also cross-section in Figure 2-2). The investigated central Platform is delineated to the Halten Terrace in the west by the Bremstein Fault Complex, to the Helgeland Basin in the north by the Ylvingen Fault Zone, to the Froan Basin the southeast by the Vingleia Fault complex, and bounded to the east by outcropping Caledonian crystalline basement (Figure 4-1). The shallow buried Garn Formation is also dipping up towards mainland. Both the Helgeland and the Froan Basin have been recognised as subsidiary elements of the Trøndelag Platform. Figure 4-1 (Left map) Main structural elements offshore Mid-Norway. Trøndelag Platform is marked with blue, with the Halten Terrace area in west, marked in dark green. Reworked map from Lothe et al. (2013) and Blystad et al. (1995). (Right map) Depth map (m) to the top Garn Formation; the main potential storage formation in the area. The main fault systems are shown as dark lines. 4.1 Available knowledge of the site During the last two decades the Halten Terrace area, offshore mid-norway (Figure 4-1) has become a rather mature exploration area for the oil and gas industry with currently 13 fields under production. Data from the area is available from the Norwegian Petroleum Directorate homepage ( and from the literature (e.g. Martinius et al. 2005). Major oil companies including Statoil have also collected and compiled a wealth of data from the region. These data are primarily used for oil exploration, but during 21
 and the CO2STORE (Bøe et al. 2005).")
23 recent years they have also been utilised for CO 2 storage studies. The results of these studies are of proprietary character and have not been published. However, several other projects have worked in this area such as the Gestco project (Bøe et al., 2002) and the CO2STORE (Bøe et al. 2005). Gestco concluded that the Lysing Fm, Rogn, Garn and Ile are the most promising aquifers for storage of CO2 in the Halten area. The best oil fields would be Norne, Heidrun, Åsgard, Draugen and Njord (Bøe et al., 2002). Lundin et al. (2005) presented reservoir simulations of part of the Froan Basin on the Trøndelag platform. They concluded that the Jurassic rocks are well suited for industry scale CO 2 storage (see also Bøe et al. 2005). The Garn Formation is considered as the best reservoir candidate for CO 2 storage. It is widely laterally deposited, nearly all over the Halten Terrace and the Trøndelag Platform and it also has a sufficient thickness. The Garn Formation has been interpreted as homogenous sandstone, with a lateral extent of 10s of km. However, Gjelberg et al. (1987) demonstrated a facies diachroneity of the Garn and Melke Formations on regional scale, and Corfield et al. (2001) support this view on a local scale (Smørbukk area). The Garn Formation consists of medium to coarse grained, moderately to well-sorted sandstones (Dalland et al., 1988). Mica-rich zones are also represented. The porosity presents important variations related to the burial depth. Quartz cementation in the Garn Formation is a controlling factor of its porosity. The Garn Formation in the Norne Field, buried to km has a porosity of %, while Kristin Field, buried to km has % (Storvoll & Bjørlykke 2004). Figure 4-2 Schematic lithostratigraphy from the early Triassic to the late Paleocene for the Halten Terrace. Interpreted seismic horizons from Statoil are marked to the right in the figure. Reworked from Dalland et al. (1988). 4.2 Site Concept The area has been chosen for this CO 2 study for a number of reasons. First, two promising potential storage units of significant thickness are present within the middle Jurassic sedimentary layers, the Ile and 22
 e.g. Figure 4-1.")
24 the Garn Formation (Figure 4-2). Second, these formations have good to excellent storage characteristics, since they are the main oil and gas bearing reservoirs on the Halten Terrace. For CO 2 storage it is also of great importance that the formations are relatively shallow buried (< 2000 m) e.g. Figure 4-1. The Trøndelag Platform has a large lateral extension and the overall storage volume is likely also large. The overlying low-permeable clastic rocks, which cover the whole investigated area and have a reported thickness up to 1650 m, will most likely provide an effective seal (Figure 4-2). However, they are thinning towards east and intersecting with Quaternary sections close to the Norwegian coast so possible migration routes in the storage unit are very important to study (Figure 4-3). Figure 4-3 Map view of the Top Garn horizon with well locations. Faults are indicated with red polygons. Cross-section through the Trøndelag Platform indicated with black line, main lithostratigraphic levels are indicated (Garn Fm. in pink). 23
25 4.3 Method The migration software tool SEMI MC (Sylta 2004) has been developed to model quantitative hydrocarbon migration and exploration risk. It includes all standard migration processes (losses, leakage, spill, fault migration, etc.), an equation of state module and can handle multi-carrier secondary migration and entrapment on geological time scales. SEMI uses a ray-tracing (flow path) technique to migrate oil, gas and CO 2 or other compounds within a carrier bed just below a sealing cap-rock. This carrier unit may also eventually act as a storage unit. The technique uses the dip of the carrier to determine pathway directions. The phase pressure, volume, and temperature (PVT) properties are computed as properties for each trap during simulations. Secondary migration losses are computed during the ray-tracing according to volumes lost in dead-ends and micro traps, in addition to the required saturation of the pore space of the migration stringers. This saturation requirement can be computed from Darcy permeability grids and relative permeability relationships. The methodology for SEMI adapted as a tool for CO 2 storage simulations was presented in Grøver et al. (2013), in where two loss mechanisms were introduced: Migration loss (i.e.; trapping of CO 2 along migration pathway); Dissolution of CO 2 at gas-water-contact within trap entities. Gas is here referring to the CO 2 phase, independent of its supercritical or not supercritical state. CO 2 storage capacity estimate in the SEMI approach focus on reservoir capacities and thus the CO 2 dissolution is modelled mainly at the gas-water phase contact within a trap. In SEMI, equation (1) (1) is solved to simulate CO 2 dissolution by convective mixing (Cc) at the gas water contact. Thereby, k v/h is the vertical and horizontal permeability, w is the viscosity of water, dis is the water density change during CO 2 dissolution, g is gravity and ( ) is a dimensionless function estimated in flow simulations (e.g. Wessel-Berg 2013). In the SEMI software we have introduced a CO 2-dissrate-factor as the inverse value of the intrinsic function. 4.4 Results One of the aims with the simulations was to systematically map the CO 2 storage capacity of the Trøndelag platform. At first, the total trap-storage capacity was estimated assuming the parameters given in Table 4-1. Thereby an important assumption is that the whole platform is overlain by a sealing layer. An infinite amount of CO 2 was injected into the carrier unit, migration loss was disabled and a value of for the CO 2-dissrate-factor was given. The modelling results (Figure 4-4) suggest a total maximum trap-storage capacity of ca. 5.9 Gt for a non-fault scenario and significantly higher value of 21.4 Gt if sealing faults were taken into account. These estimates include also the eastern part of the Halten Terrace area. If we exclude the three largest traps, the storage capacity in the Trøndelag Platform will be in range of 4.9 Gt for non-fault scenario and 15.1 Gt with faults included. 24
26 Table 4-1 Parameters used for the SEMI modelling of CO 2 migration. The total injected amounts of CO 2 as well as the values for the intrinsic function were varied for the selected injection sites. Startigraphy Garn Fm Lithology Sandstone Modelled period 100 yrs Reservoir thickness 120 m Average net permeability 1 D Geothermal gradient 35 C/km Porosity Compaction, Sclater and Christie, 1980 Pressure Hydrostatic conditions Water depth Present day seabed Entry pressure 5000 Pa Total injection Variable CO 2 dissrate-factor Variable 25
 without faults and b) with faults included.")

27 a) b) Figure 4-4 CO 2 accumulations projected onto the Garn Fm. depth map a) without faults and b) with faults included. In order to estimate a total trap-storage capacity for the Garn Fm. the whole area was "flooded" with CO 2 and all traps were filled to a maximum. 26
 over the area of interest (Figure 4-5, left map).")
28 4.5 Simulations with 51 injection sites In a second approach SEMI was used for a systematic scan of possible injection sites. At first, fifty-one injection sites with constant plume radii's of ca. 1.6 km were distributed with equal spacing (20 km) over the area of interest (Figure 4-5, left map). Thereby, very high amounts of CO 2 (up to Mt) were injected over a period of 100 year assuming a CO 2-dissrate-factor of 125. Figure 4-5 at the right map shows the lost CO 2 mapped 100 years after the injection period. Sites located along the margin of the working area spill out of the study area. We are interested to test the effect of Open or sealing faults Small or large amount of injected CO 2 Figure 4-6 shows the result maps with CO 2 accumulations and active spill paths marked at the depth map to the storage unit (Garn Formation). Here we compare the accumulation and spill paths for two scenarios with and without faults. For both senarios, the simulations indicate the same localities for the major traps but migration pathways differ. After the injection of small aounts of CO 2 (5100 Mt, upper two maps Figure 4-6), the fault pattern changes the migration routes slightly in some areas, but the main traps are more or less the same. After increasing the injected amount of CO 2 to Mt, the size of the accumulations increases, and especially the simulation with sealing faults, show very large CO 2 accumulations in the western part of the study area along the Halten Terrace area (see Figure 4-6 lower right map). Figure 4-5 Map view of the Top Garn horizon with 51 injection sites (left). Lost CO 2 mapped 100 yrs after the injection period (right). White dashed circles highlight injected CO 2 which spills out of the AOI. These sites were excluded in the successive modelling procedure. Faults are not included. 27

29 Figure 4-6 Map view of the Top Garn horizon with CO 2 accumulations and active spill paths marked in red. The map to the left show the results without faults, and the maps to the right, shows the results with sealing faults. The upper maps show the results injecting 5100 Mt CO 2, while the lower maps shows the results with Mt CO 2 injected The dissolution rate-factor is set constant to Simulations with 10 selected injection sites From the 51 sites that first were tested, 10 injection sites where selected where no spill out of the study area were modelled. For the final 10 injection sites different scenarios were tested (Table 4-2) varying the values for the intrinsic function and sealing and open faults. In total 1000 Mt over 100 years were injected into the 10 wells (injection rate of 1 Mt/year,). Figure 4-7 shows the injection sites and the loss 100 years after the injection. The modelling results suggest that the regional distribution of faults and their properties influence the CO 2 migration directions (Figure 4-8). However, in the tested scenarios the effect of the faults system on the 28
 on the SEMI")
30 total CO 2 losses was insignificant (Table 4-2). In contrast, the modelled scenarios highlight the critical impact of the CO 2 dissolution at gas-water-contact within the trap entities (determined by the dissolution rate-factor) on the SEMI modelling results (Table 4-2 and Figure 4-9). Figure 4-7 Map view of the Top Garn horizon with selected injection sites (left). Lost CO yrs after the injection (right). Grey dashed line outlines the area affected by CO 2 migration for case 1 and white dashed line for case 3, compare figure below. 29
.")
31 Figure 4-8 Map view of the Top Garn horizon with pools of CO 2 accumulations and active spill paths 100 yrs after the injection (scenarios see table 4-2). Note that the spill paths are different in the sealing and open fault models. The upper maps use a high dissolution rate, while for the lower maps, a low dissolution rate has been used (Table 4-2). Table 4-2 Selected results for different modelling scenarios. Case 1 Case 2 Case 3 Case 4 CO 2 dissrate-factor Faults open sealing open sealing Injected total (Mt) Lost CO 2 (Mt) 360,08 324,47 3,9 2,6 Lost % ,4 0,3 Lost migration (Mt) 3,4 2,1 3,4 2,13 Lost in trap dissolution (Mt) 357,04 322,3 0,5 0,47 30
32 Figure 4-9 Scatter plots highlighting the impact of the CO 2 dissolution rate-factor on SEMI modelling results. Assuming high CO 2 dissolution at gas-water-contact has a significant impact on the calculated total CO2 loss in the SEMI software (left). This effect decreases with increasing amount of injected CO 2 (right). Grey shaded area depicts the most realistic values for our models. Modelling parameters are given in Table Discussion A numeric model on basin scale is strongly affected by the selection of modelling parameters and approaches. Fluid migration pathways and accumulations depend on physical lithological parameters as well as spatial heterogeneities. In an extensional basin the brittle faults are a major phenomenon and its spatial and temporal relations virtually control the migration pathways of fluids. However, the character of the brittle deformations cannot be determined for sub-surface data and furthermore brittle deformation in a sub-seismic resolution such as minor faults might be undetected by seismic surveys. In these cases, understanding of fluid migration and accumulation relies on numerical models (e.g., Rinna et al., 2013). These models might describe migration with full physical simulations including phase transitions, geomechanical deformations, and geochemical reactions or they might focus on the regional geology and dissolution processes within a trap entity. The latter approach is used in the SEMI CO 2 software (Grøver et al. 2013). SEMI modelling results aids to identify main parameters and geological features affecting CO 2 migration within the Garn Fm. of the Trøndelag platform. The relative fast computational speed allows a systematically mapping of the safest injection sites. During this procedure the effects of different CO 2 dissolution quantities at the gas-water contact within a trap as well as the impact of sealing or open faults on migration directions were investigated in detail and will be discussed in the following sections. a) CO 2-dissrate factor CO 2 storage capacity estimate in the SEMI approach focus on reservoir capacities and thus the CO 2 dissolution is modelled mainly at the gas-water phase contact within a trap. The new results show that SEMI's migration and storage estimates strongly correlate with factors used for the intrinsic function, in the software named the CO 2 dissrate-factor (Figure 4-9, Table 4-2). The equation (1) illustrates the strong dependency of the dissrate-factor from lateral and vertical heterogeneous lithology's (e.g. Elenius & Gasda 2012). Unfortunately, for the Garn Fm lithological variations are not mapped and thus in the SEMI models extreme scenarios were tested. The new results 31
 and CO 2 losses decrease compared to the values observed for high CO 2")
33 show the impact of the dissrate-factor on modelled migration distances and losses. In the case of low CO 2 dissolution at the gas water contact the migration distances increase (Figure 4-9 and Figure 4-10) and CO 2 losses decrease compared to the values observed for high CO 2 dissolution (Table 4-2). Core measurement of residual CO 2 saturation from the unconsolidated Utsira Sand at the Sleipner CO 2 injection site gave values of ca. of 25 % (Akervoll et al. 2008). Applied to our modelling area, such a value would indicate a dissratefactor of ca. 250 which was applied in the final model for the 10 selected injection sites (Figure 4-10). b) Fault characteristics In a brittle undeformed, homogeneous sedimentary strata overlaying by a sealing unit, buoyancy forces would cause CO 2 migration from the bottom towards the top of the layer and finally migrating along the top towards the highest points. Faults interrupt this general migration path and can cause deflection from the estimated migration paths depending on their properties and spatial distribution. In our approach the faults were modelled as a sealing or an open conduit per se (Allan 1989). For all modelled cases with sealing faults the regional fault distribution has a significant influence on the migration pathways on the trap capacities (Figure 4-6, Figure 4-8 and Figure 4-10). Figure 4-10 Results for the first-grade model. Map view of the Top Garn horizon with pools of CO 2 accumulations and active spill paths 100 yrs after the injection. Note that the spill paths are different in the sealing and open fault models. c) The first-grade model For the selected 10 injection sites two fault scenarios were modelled injecting a total amount of 5100 Mt CO 2 and applying a dissrate-factor of 250 (Figure 4-10). The selected injection sites are mainly located in the center of the working area following an SW-NE trending axis. Thereby, only sites 6, 9 and 10 are located within the deeper, heavily faulted part of the Garn Fm. and the other sites are within a depth range of m in a relatively unfaulted area (Figure 4-8). However, our model results indicate that the spatial distribution of sealing faults has an influence on CO 2 storage capacities. For both cases the injected CO 2 remains in the AOI but migration pathways, losses and CO 2 accumulations in traps differ significantly. In the non-fault case 217 Mt are dissolved after 100 years whereby only 3.42 Mt are related to migration losses. The spill paths follow a general SE-NW trend (Figure 4-10). In contrast assuming sealing faults would deflect some of the spill path in a S-N trend following the strike of the faults (Figure 4-10). Moreover, total CO 2 as well as migration losses are with ca. 196 Mt and 2.1 Mt lower than in the non-fault case. The general low migration losses are related to the SEMI specific simulation of migration using the ray-tracing (flow path) technique. 32

34 5. Description of the model building for Hanstholm structure, NW Denmark 5.1 Background and study area The informal name Hanstholm structure is used for an offshore domal closure at the Gassum Formation level situated approximately 40 km northwest of the city of Hanstholm (Figure 5-1). The water depth at the site of the structure is approximately 30 m. The structure is situated close to the edge of the Fjerritslev Fault of the Sorgenfrei-Tornquist zone (Figure 5-2). The main sediment input during the Triassic Jurassic was from the northeast. The structure is caused by uplift due to post depositional salt tectonics. The structure is a huge domal closure covering 603 km 2. The depth to top reservoir is approximately 890 m below msl. and the last closing contour is at approximately 1330 m. The spill point is situated at the southeastern flank of the structure leading into the Thisted domal structure (Figure 5-3). The following description of modelling input and procedures is valid for the porosity-permeability model of date April This model has been used for several simulation studies. The model was constructed from sparse reservoir data, and therefore surrounded by significant uncertainties. Studies of the structure and injection strategy have been performed within the DYNAMIS project and some of the results were presented at the IFP Scientific Conference Deep Saline Aquifers for Geological Storage of CO 2 and Energy (Maurand et al. 2009). Figure 5-1 Map showing the position and outline of structural closures. Black dots indicate the position of some of the deep exploration wells used in the evaluation of the reservoir formation. For the Hanstholm structure two additional offshore wells were included for the model building. 33

35 Figure 5-2 Map showing the approximate location of the Hanstholm structure and the nearby wells, west of Denmark. Figure 5-3 Outline of the structural trap defining the potential storage site at Hanstholm. The structure is interpreted from the depth structure map of the Top Triassic as defined by Japsen and Langtofte (1991). 34
36 5.2 Gassum Formation (Upper Triassic Lower Jurassic) The Gassum Formation consists of fine- to medium-grained, locally coarse-grained sandstones interbedded with heteroliths, claystones and locally thin coal beds (Michelsen & Clausen 2002, Nielsen 2003). The sandstones were deposited by repeated progradation of shoreface and deltaic units forming laterally continuous sheet sandstones separated by offshore marine claystones. Fluvial sandstones dominate in the lower part of the formation in the Fennoscandian Border Zone Well database The structure itself has not been drilled. Well information is extrapolated from the three nearby wells Felicia-1, J-1 and K-1 (Figure 5-2). It should be noted however, that Felicia-1 is drilled at the crest of a rotated fault block, and shows an extraordinary large thickness of the Gassum Formation including a thick mudstone in the middle part, which could reflect topographic influence during deposition from the nearby salt pillow and association with a rim syncline. This may result in marked differences in reservoir properties between the well and the formation on the undrilled structure. Due to the well Felicia-1 not being representative of the main reservoir units on the structure, the well J-1 some km to the NE has been used as a template for the sand/shale sequence and for guiding the N/G ratio. Only the upper third of the Gassum Fm. In the Felicia-1 well is included in the present modelling Structural maps The structure is interpreted from the depth structure map of the Top Triassic as defined by Japsen and Langtofte (1991) (Figure 5-3). The Top_Trias map has been used as a template for defining top and bottom of reservoir with uniform thickness Storage reservoir unit and seal Sandstones of the Upper Triassic Lower Jurassic Gassum Formation form the main reservoir unit of the structure. In the present reservoir model the model is extended to include a few meters of caprock lithology from the Fjerritslev Fm. above the Gassum Fm., and additionally approximately 30 meter section below the Gassum Fm. from the Vinding Fm. (Figure 5-4). This results in an N/G of 0.64 for the J-1 well and a value of 0.21 for the Felicia-1 well for the reservoir section. The claystones of the Fjerritslev Formation form the top seal of the aquifer. The Fjerritslev Formation is expected to be approximately 500 m thick above the Hanstholm aquifer. 35
. 5.")
37 Figure 5-4 Stratigraphic-depth section of the Felicia-1A well showing the lithostratigraphic units and their thickness (<2.5 km). The main reservoir is sandstones of the Gassum Formation. The lithostratigraphic units and definition of formation boundaries in the deep wells are based on Nielsen & Japsen (1991). 5.3 Model setup The following description of input and procedures is valid for the porosity-permeability model dated April The model was constructed from sparse data, and therefore includes significant uncertainties, especially regarding thickness and extent of reservoir layers over the undrilled structure, and regarding the porosity data originating from old and flawed well log data. Later re-visit of well-log data points to obvious revisions of the porosity model, and these are included as suggestions in the following chapters. The model covers an area of 34.4 x 41.6 km (Figure 5-5). The fairly large area of the model has promoted the use of a coarse grid resolution of 400x400 m cells. Uniform thickness of 104 m is assumed. 36

. This trend map is used as secondary input during the facies modelling.")
38 Figure 5-5 Map of top reservoir showing position of the well Felicia-1 in the NE corner and the introduced synthetic well Top-1synt on the top of the structure Well data for conditioning The lack of reliable well log data for interpretation of porosity in the first stage of the work has resulted in the use of only target histograms for simulation of porosity model for the sand and shale facies N/G mapping A trend map is constructed based on an average value of 0.41 from the J-1 template, and a minimum area with 0.21 around the Felicia-1 well (Figure 5-6 and Figure 5-7). This trend map is used as secondary input during the facies modelling. Figure 5-6 Map for N/G trend interpolated from the Felicia-1 data point and support points with the average value of


39 Figure 5-7 Well sections showing the difference in N/G Facies modelling The facies modelling is carried out with stochastic placement of large rounded ellipses, 20x40 km areal extent, 4-12 m thick, and with a slight angle to NW-SE (Figure 5-8). This is used as a simple proxy for sheet-like shoreface deposits of large areal extent. The background facies is the marine muddy lithology from offshore deeper water deposition. Figure 5-8 Map of a single layer in the facies model showing the rounded ellipses used for modelling of the sand sheets. 38

40 5.3.4 Petrophysical modelling After the facies modelling, the total porosity PHIT is simulated with SGS, using no well data for conditioning but only target histograms being different for the sand and shale lithologies. These histograms have been derived from other studies of sand/shale sequences and are not fully adjusted to the local porosity information. From the porosity PHIT (see Figure 5-9) is calculated the fluid permeability by using macro with equations separating the sand/shale lithologies, and limiting the maximum permeabilities to 1000 and 600 for the sand/shale respectively as shown in Figure Figure 5-9 Porosity PHIT for a single layer in the model. Figure 5-10 Porosity/permeability relations for the sand and shale lithologies 39
41 5.3.5 Export of grid The grid data for the model is exported as Generic ECLIPSE style (ASCII) properties with cell origin in I=0, J=0, K. The facies designation is exported as integer values 1/0 for sand/shale, and can be used for assigning properties and saturation functions for the 2 lithologies when the model grid is set up in a reservoir simulator using SATNUM for the saturation table input. PHIE - effective porosity is exported to be used as porosity in the reservoir simulation, since this measure is restricted to the mobile water present in the model as the clay-bound water has been excluded. This therefore serves as a better property when looking into the amount of mobile water that might be replaced by the CO 2 injection. 40
42 6. Description of the model building for Vedsted structure, Northwest Denmark 6.1 Structural outline and geology of the Vedsted area The study area is the Vedsted site, an anticlinal structural closure, in northern Denmark (about 25 km east of the city of Aalborg) located in the Fjerritslev Trough as a subbasin in the Sorgenfrei-Tornquist Zone (Nielsen, 2003). The main storage reservoir is represented by the regional Upper Triassic Lower Jurassic Gassum Sand Formation (Dalhoff et al. 2011). The Gassum Formation is about 250 m thick in the Vedsted area and contains two sandy intervals divided by about 75 m thick interval of marine shales of the Fjerritslev Formation. This shale unit contains different sandstone layers of low thickness and is overlain by marine sandstones of 5 m thickness. The lower 140 m of the Gassum Formation is interpreted as fluvial sandstone interbedded with lacustrine mudstones upward grading into shallow marine sandstones interbedded with marine mudstones, while the upper 50 m of the formation are interpreted as marine shoreface sand (Nielsen 2003). Available well information indicates net to gross of 0.74 and sandstone porosity up to 20 % is estimated from core material (Dalhoff et al. 2011, Larsen et al. 2003). Existing oil exploration wells from the 1950s (Vedsted-1 and Haldager-1), Top Gassum Formation map and available 2D seismic data allowed Frykman et al. (2009) to implement a 3D structural geological model. The primary caprock of the reservoir located in the Gassum Formation is the regional marine mudstones of the Fjerritslev Formation with a 525 m thickness at the study area. The Flyvbjerg Formation is the seal of the second reservoir (Haldager Formation), with a thickness of 25 m to 50 m consisting of marine mudstones with intercalated siltstones and sandstones. This formation is then followed by a thick succession of about 780 m of mainly marine mudstones of the Borglum, Frederikshavn and Vedsted Formations. The top of the model is represented by the Chalk Group of 400 m thickness and the Quaternary of relatively low thickness (Dalhoff et al. 2011, Larsen et al. 2003). 6.2 Dynamic flow simulations Integrated dynamic fluid flow simulations studies were carried out for the Vedsted site by Frykman et al. (2009 and 2011) and Klinkby et al. (2011) to assess CO 2 storage potentials and pressure perturbation in the two main reservoirs of the Vedsted structure. The very early work on capacity (Larsen et al. 2003) was reevaluated, and according to Dalhoff et al. (2011) the total CO 2 storage potential was estimated to about 160 Mt considering a sweep efficiency of 40 % at reservoir conditions. The dynamic simulation results could be fed directly into the development of a monitoring plan as discussed by Arts et al. (2010). Simulations using the ECLIPSE 100 black-oil simulator as undertaken by Nielsen et al. (2013) demonstrated that regional pressure propagation resulting from CO 2 injection can be mitigated by formation fluid production and that the structural filling is also enhanced by the integrated pressure management concept. The geomechanical effects arising from pressure propagation during injection have been studied by Kempka et al. (in press) both concerning fault re-activation and vertical elevation displacements. The present study will focus on a workflow for assessing the dynamic storage capacity from numerical simulations, incorporating the geometry of the mapped faults and their possible effects on filling pattern. 41

43 6.3 Model setup The model area covers 12 x 16 km, with the long axis approximately aligned to fault zones mapped in the area (The rectangular model turned 25 degrees NW, Figure 6-1). The faults are included in the structural model. The updated Top_Gassum Map from the 2D seismic mapping has been imported into Petrel. Uniform thickness of the reservoir within the model area has been assumed. The main faults have been included in the gridding of the 3D model, although as vertical features and with zigzag geometry in the grid to minimise gridding irregularity. Figure 6-1 Top Gassum reservoir map. Vedsted-1 well and injection well in simulation are shown. 42
44 6.4 Well data The Vedsted-1 has TD in the upper part of the Skagerrak Formation at 2068 m b. msl. The well was drilled in 1958, with the purpose of testing the presence of hydrocarbons in the Middle Jurassic and Upper Triassic sandstones. Hydrocarbons were not encountered and the well was plugged and abandoned. From the Vedsted-1 well only an SP log and 3 resistivity logs are available. A number of core plugs covering the Gassum and Haldager Sand Formations are available from the Vedsted-1 well and the nearby Farsø-1 and Børglum-1 wells. This material has recently been evaluated for analysis procedures and possible measurement errors, and a subset has been recommended for further use. 6.5 Porosity calculations The porosity was calculated from the deep-reading resistivity log (64 ) and calibrated to core porosity data. Both the Haldager Sand and Gassum Formation are only partly cored and accordingly, the porosity evaluation outside the cored intervals is associated with considerable uncertainty. The mud composition and salinity was changed at c m, which affects the SP log readings. The shale volume is therefore calculated with two different sets of parameters. 6.6 Design and detail of geological model for the Gassum reservoir For the Gassum reservoir model area we include the 2 wells (Vedsted-1 and Haldager-1) and an area around the structure, in total 12x16 km, and rotated at an angle of 25 degrees to align with most of the faults included in the model. Laterally the grid cells extend 200x200 m. 6.7 Lithology subdivision To simplify the modelling procedure the sequence is viewed as only consisting of 2 main lithologies: sand and shale. The subdivision separates into shale and sand at a threshold of 5 % porosity on the log for PHIE (effective porosity). From an updated review of the geology and the sequence stratigraphic analysis, the reservoir is considered layered with long-range continuity of the both the sand and the shale layers. The sea-level changes have caused wide extent of the sandy deposits in blanket-like sheets, at least covering the 10 s of km scale for the model area. Therefore high continuity has generally been assumed. 6.8 Assignment of physical properties to layers, Gassum reservoir The porosity model has been converted with an equation for porosity/fluid-permeability relation: [PERMX3=20000*Pow(PHIE,3.4) ], see 2. Considering that the shale lithology might have thin silty or sandy intercalations that do not fully show up on the porosity log, we have assumed that if porosity is less than 6%, the permeability is assumed uniformly 1 md. As previously described, a number of air-permeability measurements are available from the Vedsted-1 cores, but fluid-permeability data do not exist in the Vedsted-1 database. Consequently, the airpermeabilities were transformed into assumed fluid-permeabilities by multiplying by 0.5, a factor derived from other studies. The modified Vedsted data along with some other selected data are also shown in Figure 6-2. For porosities greater than c. 20% it appears from the figure that the relationship actually used is slightly conservative compared to the limited Gassum Formation data presently available, if the air-fluid conversion is trusted. The effective porosity and the permeability model are then exported for use in Eclipse. 43
45 Permeability (fluid) md Project Gassum Fm Farsø-1 avg 10 1 Stenlille avg Børglum-1 Gassum-1 GHE fzi 6.0 GHE fzi 1.50 GHE fzi 0.75 P2 power P3 power P4 0.5 power Porosity V-1 factor 0.5 fluid Perm Figure 6-2 Porosity vs fluid-permeability relation used for the modelling is shown as line P3 - in blue x. Core measurements from the Vedsted-1 well are plotted (dark blue); the original air-permeabilities have been re-calculated to fluid-permeabilities with a factor of 0.5. Furthermore, additional data from Gassum Formation samples from other wells are shown. 6.9 External Boundary Conditions All external boundaries are no-flow boundaries. In order to moderate the pressure rise in the model, the pore volume of the outer grid cells is enlarged so that the CO 2 storage relevant volume can be considered surrounded by an infinite acting, constant pressure aquifer Further work for the Danish sites Further work would be for the Danish sites: Vedsted and Hanstholm area to carry out dynamic modelling to estimate the storage capacity. It would be also be preferable to try to indicate a minimum and maximum storage capacity for the sites. Questions maybe that also ought to be answered are mainly: 1. Will there be general pressure build up constraints? 2. Will there be well injection pressure constraints? 3. Will we vary the effects of the faults from sealing to transparent? Which will relate to compartmentalisation, and possibly well pattern decision 44
46 Table 6-1 The table includes values derived from previous projects dealing with only static simply capacity estimates (GESTCO, GeoCapacity). Evaluated Aquifers Avg depth Bulk volume Pore volume Avg K Open/ Closed Storage eff Density Storage capacity m m 3 m 3 md % t/rm 3 Gtons Vedsted E Closed Hanstholm E Closed
. Several seismic surveys with 2D technique were performed in the south-east Baltic Sea and south-west Scania.")
47 7. First estimations of storage potential in Sweden During the s southern Sweden was commercial prospected for hydrocarbons by the Swedish Oil Prospecting Company (OPAB) and the Swedish Exploration Consortium (SECAB). Several seismic surveys with 2D technique were performed in the south-east Baltic Sea and south-west Scania. Most data are in analogue form, only limited degree of digitalization has been conducted recently. During the same investigations, a number of exploration wells were drilled, preferably onshore. All data from these investigations are public and stored at the Geological Survey of Sweden. Due to very limited findings, no further exploration was performed. Furthermore, the Geological Survey of Sweden has drilled five deep wells in Scania during s. Some core material and cuttings have been stored at the Geological Survey of Sweden. Due to the NORDICCS ranking, three of the eight Swedish identified storage aquifers are selected for further description and analyses. These are as follows: Faludden sandstone Arnager Greensand Höganäs-Rya sequence Figure 7-1 Map of the southernmost Sweden showing the assumed three best CO 2 storage sites in Sweden. Blue lines represent faults in the two areas, red dots mark the position of presented litho-stratigraphic logs (see Figure 7-2 and Figure 7-3). 46
48 7.1 Geological description of the Faludden sandstone The Faludden sandstone is a member of the Borgholm Formation and is located in the south-east Baltic Sea. The sandstone was deposited in Middle Cambrian in the Baltic Syneclise which is the largest tectonic element within the south-western margin of the East-European Craton (Brangulis et al. 1993). Hence, the Faludden sandstone was deposited in a relative stable tectonic environment and sedimentation proceeded relatively slow and uniformly resulting in high homogeneity over a large area. The sandstone was deposited near shore and has a basin wards progradation from east to west. Minor variations represented by interbeds of shale and siltstone reflect distance to shore line, fluvial and deltaic influences and water depths (Erlström et al. 2011). To the south and south-east a shift in facies to more marine conditions is identified as finer grain size in an equivalent to the Faludden sandstone. The Faludden sandstone has a large lens shaped distribution weakly dipping (<1 o ) towards the east-south-east. The regional distribution of the sandstone unit covers an area of c km 2 in Swedish territory. Towards the Baltic countries the Faludden sandstone continues as the Deimena Formation where it outcrops in Estonia, and is deeply buried at depths of more than 2000 km in Lithuania and more than 3000 km in Poland (Sliaupa et al. 2012). To the northwest the Faludden sandstone is pinching out in a north-east to south-west line between the islands of Gotland and Öland following the north-western margin of the Baltic Syneclise. The Faludden sandstone upper surface is relatively smooth except from small highs with amplitudes at m and limited areal distribution (Erlström et al. 2011). In Swedish territory the Faludden sandstone is found on depth from 400 m below sea level beneath the island of Gotland to 1000 m below sea level in the deepest part offshore to the south-east. Thickness varies from 1 49 m increasing towards the Swedish economic zone to the southeast. Average thickness is 10 m onshore and 45 m offshore (OPAB 1976). In terms of CO 2 storage the Faludden sandstone represents a stratigraphic confined open/semi-closed saline aquifer with a large lateral distribution where the part deeper than 800 m is covering an area of c km 2 on Swedish territory (Mortensen 2014). The storage unit contains a structural trap, the Dalders structure, which has undergone commercial prospecting for oil, but the data is not available The CO 2 storage properties to Faludden Sandstone The Faludden sandstone consists of a clear, fine- to medium-grained, well sorted, calcite cemented quartz sandstone with local interbeds of shale and siltstone (Figure 7-2). In general, the upper 3-5 m of the sandstone is very hard and clayey with low porosity (OPAB 1976). The estimated net/gross sand is as high as 90% (Mortensen 2014). Chemical analyses performed by the Geological Survey of Sweden show silica oxide contents at 84,7-97,8% (Erlström et al. 2011) and densities at 2,65-2,67 g/ccm which further reflects the purity of the sandstone. Maximum bottom hole temperature at depth corresponding to the Faludden sandstone is in the range of o C with a gradient at 3-5 o C per 100 m which is very high compared to crystalline bedrock in Sweden normally being in the range 2 o C per 100 m. Measurements on geophysical logs together with well cores show porosities of % giving an average of 14%, and permeabilities at 0, md, averaging 147 md. In investigations by OPAB traces of oil and gas have been found in several wells from the island of Gotland and geophysical logs from the offshore area (wells B-7 and B-9) indicate gas contents in the sandstone The caprock units The Faludden sandstone sequence is followed by c. 80 m Ordovician limestone, with bentonitic limestone in the bottom c. 50 m, which is followed by c. 500 m Silurian marlstone (Figure 7-2). 47
.")
49 Figure 7-2 Generalized litho-stratigraphic log from the south-east Baltic Sea (Faludden 1 2). 48
CO2 storage modelling and capacity estimates for the Trøndelag Platform a basin modelling approach
 CO2 storage modelling and capacity estimates for the Trøndelag Platform a basin modelling approach Ane E. Lothe, Benjamin U. Emmel & Per Bergmo NORDICCS Conference Contribution D 6.1.1407 (4) August 2014
PREDICTION OF CO 2 DISTRIBUTION PATTERN IMPROVED BY GEOLOGY AND RESERVOIR SIMULATION AND VERIFIED BY TIME LAPSE SEISMIC
 Extended abstract of presentation given at Fifth International Conference on Greenhouse Gas Control Technologies Cairns, Australia, 13 th to 16 th August 2000 PREDICTION OF CO 2 DISTRIBUTION PATTERN IMPROVED
Methodology: Ranking, Site Assessments & Volumetrics
 Methodology: Ranking, Site Assessments & Volumetrics INTRODUCTION Queensland CO 2 Storage Atlas Aim to identify with highest possible certainty prospective basins for geological storage in onshore Queensland
Exploring geological storage sites for CO 2 from Norwegian gas power plants: Johansen formation
 Available online at www.sciencedirect.com Physics Energy Procedia 00 1 (2009) (2008) 2945 2952 000 000 www.elsevier.com/locate/procedia www.elsevier.com/locate/xxx GHGT-9 Exploring geological storage sites
CO2 Storage- Project list
 a) NGI involvement with CO 2 storage field sites, pilots and demos 1. In Salah CO2 storage In Salah is located in Krechba, central Algeria. Injection of CO 2 started in 2004 and halted in 2011. A total
CO 2 storage capacity and injectivity analysis through the integrated reservoir modelling
 CO 2 storage capacity and injectivity analysis through the integrated reservoir modelling Dr. Liuqi Wang Geoscience Australia CO 2 Geological Storage and Technology Training School of CAGS Beijing, P.
PRELIMINARY REPORT. Evaluations of to what extent CO 2 accumulations in the Utsira formations are possible to quantify by seismic by August 1999.
 SINTEF Petroleumsforskning AS SINTEF Petroleum Research N-7465 Trondheim, Norway Telephone: +47 73 59 11 Fax: +477359112(aut.) Enterprise no.: NO 936 882 331 MVA TITLE PRELIMINARY REPORT Evaluations of
WP 4.1. Site selection criteria and ranking methodology. Karen Kirk
 WP 4.1 Site selection criteria and ranking methodology Karen Kirk 1 Basic site selection criteria Sufficient depth and storage capacity supercritical CO 2 below 700-800 m (rule of thumb) 2 Variation of
Exploration research at SINTEF Petroleum
 Joining Forces 2016, Stavanger 2 nd and 3 rd of February 2016 Exploration research at SINTEF Petroleum Ane Lothe Research Manager, Basin Modelling Group Technology for a better society 1 Overview Short
Field Scale Modeling of Local Capillary Trapping during CO 2 Injection into the Saline Aquifer. Bo Ren, Larry Lake, Steven Bryant
 Field Scale Modeling of Local Capillary Trapping during CO 2 Injection into the Saline Aquifer Bo Ren, Larry Lake, Steven Bryant 2 nd Biennial CO 2 for EOR as CCUS Conference Houston, TX October 4-6, 2015
Current challenges at CO 2 Sites
 Current challenges at CO 2 Sites Ola Eiken et al., Statoil R&D Force seminar on injection safety 4 th December 2013 Offshore Sleipner Onshore In Salah Sub-sea Snøhvit 1 - Classification: External 2010-09-23
Seismic mapping of the Utsira Formation. Petrophysical interpretations and fracture gradient estimates.
 Presentation March 4 th 2009 OG21 Innovation Seminar: TTA2 Exploration and reservoir Characterization Venue: StatoilHydro, Sandsli CO 2 Sequestration A geophysical and geological study related to CO 2
APPENDIX C GEOLOGICAL CHANCE OF SUCCESS RYDER SCOTT COMPANY PETROLEUM CONSULTANTS
 APPENDIX C GEOLOGICAL CHANCE OF SUCCESS Page 2 The Geological Chance of Success is intended to evaluate the probability that a functioning petroleum system is in place for each prospective reservoir. The
Distibution of overpressure in the Norwegian Continental Shelf
 Distibution of overpressure in the Norwegian Continental Shelf Use of pore pressure data to reveal dynamic trapping of hydrocarbons F.Riis, A. Soltvedt, T.A. Knudsen, J.A. Øverland The problem: Integrate
Sleipner Benchmark Dataset and Model Comparison
 Sleipner Benchmark Dataset and Model Comparison IEAGHG Modeling and Risk Assessment Network Meeting 10-13 June 2013 Sarah Gasda, Center for Integrated Petroleum Research, Uni Research, Bergen, Norway Sleipner
Relinquishment Report
 Relinquishment Report Licence P1403 Block 13/22d Chevron North Sea Limited Korean National Oil Company Chevron North Sea Limited December 2009 1 SYNOPSIS... 3 2 INTRODUCTION. 3 2.1 Licence Terms.. 3 2.2
STORAGE POTENTIAL OF POLAND (THE BALTIC BASIN) Adam Wójcicki & Jolanta Pacześna, PGI-NRI
 Adam Wójcicki & Jolanta Pacześna, PGI-NRI") STORAGE POTENTIAL OF POLAND (THE BALTIC BASIN) Adam Wójcicki & Jolanta Pacześna, PGI-NRI.. Espoo, 23.05.2013 CO2 storage projects Poland and Europe 1995-..Borzęcin gas field (acidic gas 60% CO2; INiG,
STORAGE POTENTIAL OF POLAND (THE BALTIC BASIN) Adam Wójcicki & Jolanta Pacześna, PGI-NRI.. Espoo, 23.05.2013 CO2 storage projects Poland and Europe 1995-..Borzęcin gas field (acidic gas 60% CO2; INiG,
WESTCARB Regional Partnership
 WESTCARB Regional Partnership Subsurface Flow Modeling at King Island Christine Doughty, CADoughty@lbl.gov Curtis Oldenburg, CMOldenburg@lbl.gov Staff Scientists Lawrence Berkeley National Laboratory WESTCARB
5 IEAGHG CCS Summer School. Geological storage of carbon dioxide (a simple solution)
") Storage 1- Reservoirs, Traps, Seals and Storage Capacity for Storage Geological storage of carbon dioxide (a simple solution) Professor John Kaldi Chief Scientist, CO2CRC Australian School of Petroleum,
Storage 1- Reservoirs, Traps, Seals and Storage Capacity for Storage Geological storage of carbon dioxide (a simple solution) Professor John Kaldi Chief Scientist, CO2CRC Australian School of Petroleum,
Available online at ScienceDirect. Energy Procedia 114 (2017 )
") Available online at www.sciencedirect.com ScienceDirect Energy Procedia 114 (2017 ) 2772 2780 13th International Conference on Greenhouse Gas Control Technologies, GHGT-13, 14-18 November 2016, Lausanne,
Available online at www.sciencedirect.com ScienceDirect Energy Procedia 114 (2017 ) 2772 2780 13th International Conference on Greenhouse Gas Control Technologies, GHGT-13, 14-18 November 2016, Lausanne,
Third EAGE CO2 Geological Storage Workshop, Edinburgh, March
 Third EAGE CO2 Geological Storage Workshop, Edinburgh, March 26-27 2012 Tveranger, J. (Uni Research) Dahle, P. (Norwegian Computing Center) Nilsen, H.M. (SINTEF) Syversveen A.R. (Norwegian Computing Center)
Storage 4 - Modeling for CO 2 Storage. Professor John Kaldi Chief Scientist, CO2CRC Australian School of Petroleum, University of Adelaide, Australia
 Storage 4 - Modeling for CO 2 Storage Professor John Kaldi Chief Scientist, CO2CRC Australian School of Petroleum, University of Adelaide, Australia 1 Modelling 2 On Models. All models are wrong. some
CO2 storage potential of basaltic rocks in Iceland and the oceanic ridges
 CO storage potential of basaltic rocks in Iceland and the oceanic ridges Sandra Ó. Snæbjörnsdóttir, Frauke Wiese, Thráinn Fridriksson, Halldór Ármannsson, Sigurdur R. Gislason NORDICCS Conference Contribution
Tim Carr - West Virginia University
 GEOGRAPHIC EXTENT OF PETROLEUM SYSTEM A Trap Trap Trap A STRATIGRAPHIC EXTENT OF PETROLEUM SYSTEM Petroleum accumulation Top of oil window Bottom of oil window Overburden Seal Reservoir Source Underburden
Storage 6 - Modeling for CO 2 Storage. Professor John Kaldi Chief Scientist, CO2CRC Australian School of Petroleum, University of Adelaide, Australia
 Storage 6 - Modeling for CO 2 Storage Professor John Kaldi Chief Scientist, CO2CRC Australian School of Petroleum, University of Adelaide, Australia Regina, Sask., Canada, 17-22 July, 2016 Modeling 2 What
Relinquishment Report. for. Licence P1605, Block 220/27
 Relinquishment Report for Licence P1605, Block 220/27 November 2013 Licence P.1605 Relinquishment Report August 2012 1 of 11 CONTENT 1 Introduction 2 - Exploration Summary 2.1 Exploration Activity 2.2
Maximising the use of publicly available data: porosity and permeability mapping of the Rotliegend Leman Sandstone, Southern North Sea
 Maximising the use of publicly available data: porosity and permeability mapping of the Rotliegend Leman Sandstone, Southern North Sea Claire Imrie & Henk Kombrink 09 May 2018 Overview The Oil and Gas
What is the scope for carbon capture and storage in Northern Ireland. Michelle Bentham
 What is the scope for carbon capture and storage in Northern Ireland Michelle Bentham Kingsley Dunham Centre Keyworth Nottingham NG12 5GG Tel 0115 936 3100 What is Carbon Capture and Storage? Capture of
High-resolution Sequence Stratigraphy of the Glauconitic Sandstone, Upper Mannville C Pool, Cessford Field: a Record of Evolving Accommodation
 Page No. 069-1 High-resolution Sequence Stratigraphy of the Glauconitic Sandstone, Upper Mannville C Pool, Cessford Field: a Record of Evolving Accommodation Thérèse Lynch* and John Hopkins, Department
The Kingfisher Field, Uganda - A Bird in the Hand! S R Curd, R Downie, P C Logan, P Holley Heritage Oil plc *
 A Bird in the Hand! EXTENDED ABSTRACT The Kingfisher Field, Uganda - A Bird in the Hand! Heritage Oil plc * The Kingfisher Field lies on Uganda s western border beneath Lake Albert, situated in the western
From 2D Seismic to Hydrodynamic Modelling
 From 2D Seismic to Hydrodynamic Modelling A Complex Study of Turbidites in a Petroleum-Bearing Basin Marcell Lux, HC Exploration Geologist Ahmed Amran, HC Exploration Advisor Marianna Vincze, Geomodel
I. INTRODUCTION 1.1. Background and Problem Statement
 I. INTRODUCTION 1.1. Background and Problem Statement The declining of global oil and gas reserves has encouraged the exploration campaign to both the frontier area and the revisit to the mature basins.
Next steps for verifying European CO2 storage capacity Perspectives from the Baltic Region
 Next steps for verifying European CO2 storage capacity Perspectives from the Baltic Region Adam WÓJCICKI 11 h #CO 2 GeoNet#Open#Forum,"May$9$ $11,$2016$ $Venice,$San$Servolo$Island$ CO2 storage research
ISSN Grading: Open
 Geological Survey of Norway N-7441 Trondheim, Norway Tel.: 47 73 90 40 00 Telefax 47 73 92 16 20 REPORT Report no. (NGU): 2004.049 Report no. (SINTEF): 54.5272.00/02/04 ISSN 0800-3416 Grading: Open Title:
Serica Energy (UK) Limited. P.1840 Relinquishment Report. Blocks 210/19a & 210/20a. UK Northern North Sea
 Limited. P.1840 Relinquishment Report. Blocks 210/19a & 210/20a. UK Northern North Sea") Serica Energy (UK) Limited P.1840 Relinquishment Report Blocks 210/19a & 210/20a UK Northern North Sea January 2013 1 Header Licence: P.1840 Round: Licence Type: 26th Round Traditional "Drill-or-Drop"
Serica Energy (UK) Limited P.1840 Relinquishment Report Blocks 210/19a & 210/20a UK Northern North Sea January 2013 1 Header Licence: P.1840 Round: Licence Type: 26th Round Traditional "Drill-or-Drop"
MUHAMMAD S TAMANNAI, DOUGLAS WINSTONE, IAN DEIGHTON & PETER CONN, TGS Nopec Geological Products and Services, London, United Kingdom
 Geological and Geophysical Evaluation of Offshore Morondava Frontier Basin based on Satellite Gravity, Well and regional 2D Seismic Data Interpretation MUHAMMAD S TAMANNAI, DOUGLAS WINSTONE, IAN DEIGHTON
AAPG European Region Annual Conference Paris-Malmaison, France November RESOURCES PERSPECTIVES of the SOUTHERN PERMIAN BASIN AREA
 AAPG European Region Annual Conference Paris-Malmaison, France 23-24 November 2009 RESOURCES PERSPECTIVES of the SOUTHERN PERMIAN BASIN AREA J.C. DOORNENBAL, TNO Built, Environment and Geosciences, Geological
Migration Lag - What is it and how it affects Charge Risk and Fluid Properties*
 Migration Lag - What is it and how it affects Charge Risk and Fluid Properties* Zhiyong He 1 Search and Discovery Article #42014 (2017)** Posted February 20, 2017 *Adapted from oral presentation given
Uncertainties in rock pore compressibility and effects on time lapse seismic modeling An application to Norne field
 Uncertainties in rock pore compressibility and effects on time lapse seismic modeling An application to Norne field Amit Suman and Tapan Mukerji Department of Energy Resources Engineering Stanford University
Exploration _Advanced geophysical methods. Research Challenges. Séverine Pannetier-Lescoffit and Ute Mann. SINTEF Petroleum Research
 Exploration _Advanced geophysical methods * Research Challenges Séverine Pannetier-Lescoffit and Ute Mann SINTEF Petroleum Research 1 Exploration and Reservoir Characterization * Research Challenges 29%
IN POLAND. Adam WÓJCICKI. National Research Institute
 CO2 GEOLOGICAL STORAGE POTENTIAL IN POLAND Adam WÓJCICKI Polish Geological Institute National Research Institute Warsaw, June 2009 CO2 geological sequestration (definitions) Carbon capture and storage
Bulletin of Earth Sciences of Thailand. Evaluation of the Petroleum Systems in the Lanta-Similan Area, Northern Pattani Basin, Gulf of Thailand
 Evaluation of the Petroleum Systems in the Lanta-Similan Area, Northern Pattani Basin, Gulf of Thailand Sirajum Munira Petroleum Geoscience Program, Department of Geology, Faculty of Science, Chulalongkorn
GEOLOGICAL CHARACTERISATION OF CO 2 STORAGE SITES: LESSONS FROM SLEIPNER, NORTHERN NORTH SEA
 B1-3 GEOLOGICAL CHARACTERISATION OF CO 2 STORAGE SITES: LESSONS FROM SLEIPNER, NORTHERN NORTH SEA R.A. Chadwick 1, P. Zweigel 2, U. Gregersen 3, G.A.Kirby 1, G.A., S. Holloway 1 and P.N. Johannessen 3
Revised reservoir model for the Paleocene mounds of the Utsira High, North Sea, Norway John Wild (1) & Nowell Briedis (2)
 & Nowell Briedis (2)") Revised reservoir model for the Paleocene mounds of the Utsira High, North Sea, Norway John Wild (1) & Nowell Briedis (2) (1) Mobil North Sea LLC (2) Esso Exploration & Production Norway A/S (ExxonMobil
Revised reservoir model for the Paleocene mounds of the Utsira High, North Sea, Norway John Wild (1) & Nowell Briedis (2) (1) Mobil North Sea LLC (2) Esso Exploration & Production Norway A/S (ExxonMobil
The Influence of Pore Pressure in Assessing Hydrocarbon Prospectivity: A Review
 H2-2-10 The Influence of Pore Pressure in Assessing Hydrocarbon Prospectivity: A Review Sam Green 1, Stephen A O'Connor 1, Alexander P Edwards 2 1 Ikon Science, Durham, UK, 2 Ikon Science, Teddington,
RWE Dea UK SNS Limited (50%, operator) Dana Petroleum (E&P) Limited (50%)
 Dana Petroleum (E&P) Limited (50%)") 1. Licence Information Licence Number P1726 Licence Round 25 th (2008) Licence Type Traditional Blocks 43/17a & 43/18a Licensees Work Programme RWE Dea UK SNS Limited (50%, operator) Dana Petroleum (E&P)
1. Licence Information Licence Number P1726 Licence Round 25 th (2008) Licence Type Traditional Blocks 43/17a & 43/18a Licensees Work Programme RWE Dea UK SNS Limited (50%, operator) Dana Petroleum (E&P)
We LHR1 01 The Influence of Pore Pressure in Assessing Hydrocarbon Prospectivity - A Review
 We LHR1 01 The Influence of Pore Pressure in Assessing Hydrocarbon Prospectivity - A Review S. Green (Ikon Science), S.A. O'Connor (Ikon Science) & A.P. Edwards* (Ikon Science) SUMMARY Assessing the prospectivity
Modelling of CO 2 storage and long term behaviour in the Casablanca field
 Available online at www.sciencedirect.com Energy Procedia 1 (2009) (2008) 2919 2927 000 000 GHGT-9 www.elsevier.com/locate/xxx www.elsevier.com/locate/procedia Modelling of CO 2 storage and long term behaviour
Ny bassengmodellering for Barentshavet Ute Mann SINTEF Petroleumsforskning
 Ny bassengmodellering for Barentshavet Ute Mann SINTEF Petroleumsforskning www.og21.no Barents Sea - Challenges 7 different play types Carboniferous Tertiary Uplift and erosion Tilting, reactivation of
Project Document. BASE - Basement fracturing and weathering on- and offshore Norway Genesis, age, and landscape development
 Project Document BASE - Basement fracturing and weathering on- and offshore Norway Genesis, age, and landscape development Partners: Geological Survey of Norway (NGU), SINTEF Petroleum Research (SINTEF)
NAPE 2011 Lagos, Nigeria 28 November-2 December 2011 Extended Abstract
 T: +44 191 334 2191 E: info@ikonscience.com W: www.ikonscience.com Pore Pressure Prediction in the Niger Delta NAPE 2011 Lagos, Nigeria 28 November-2 December 2011 Extended Abstract PORE PRESSURE PREDICTION
Hydrocarbon Volumetric Analysis Using Seismic and Borehole Data over Umoru Field, Niger Delta-Nigeria
 International Journal of Geosciences, 2011, 2, 179-183 doi:10.4236/ijg.2011.22019 Published Online May 2011 (http://www.scirp.org/journal/ijg) Hydrocarbon Volumetric Analysis Using Seismic and Borehole
Plumbing the Depths of the Pelican Field
 Plumbing the Depths of the Pelican Field Thurza Frenz Pelican Talk Objectives To discuss the development of the northern area of the Pelican Field, in particular: The relationship between reservoir quality,
Licence P1368: Relinquishment Report (end of 2 nd term) Hurricane Exploration PLC
 Hurricane Exploration PLC") Licence P1368: Relinquishment Report (end of 2 nd term) Hurricane Exploration PLC March 2012 1. Header Licence Number: P1368 Licence Round: 23 rd Licence Type: Frontier Block Numbers: 202/4, 202/5, 204/30,
Licence P1368: Relinquishment Report (end of 2 nd term) Hurricane Exploration PLC March 2012 1. Header Licence Number: P1368 Licence Round: 23 rd Licence Type: Frontier Block Numbers: 202/4, 202/5, 204/30,
Monitoring techniques developed at CO2 natural laboratories to improve risks assessment and safety strategy
 Monitoring techniques developed at CO2 natural laboratories to improve risks assessment and safety strategy Sabina Bigi Dipartimento di Scienze della Terra Sapienza Università di Roma 3 rd International
P1488 DECC Relinquishment Report OMV (U.K.) Ltd.
 Ltd.") 1. Synopsis: P1488 DECC Relinquishment Report OMV (U.K.) Ltd. UK offshore Licence P1488 was awarded to OMV, Dana Petroleum and Rocksource in the 24 th Licence Round on the 24 th of January 2007 as a frontier
1. Synopsis: P1488 DECC Relinquishment Report OMV (U.K.) Ltd. UK offshore Licence P1488 was awarded to OMV, Dana Petroleum and Rocksource in the 24 th Licence Round on the 24 th of January 2007 as a frontier
Relinquishment Report for Licence Number P1356, Block 48/8c March 2008
 Relinquishment Report for Licence Number P1356, Block 48/8c March 2008 Table of Contents 1.0 Header...3 2.0 Synopsis...3 3.0 Exploration Activities...4 4.0 Prospectivity Analysis...11 5.0 Conclusions...12
6. THE BOREHOLE ENVIRONMENT. 6.1 Introduction. 6.2 Overburden Pressures
 6. THE BOREHOLE ENVIRONMENT 6.1 Introduction Wireline logging has a single clearly defined purpose: to give accurate and representative data on the physical properties of the rock formations and fluids
Bulletin of Earth Sciences of Thailand
 Quantitative Seismic Geomorphology of Early Miocene to Pleistocene Fluvial System of Northern Songkhla Basin, Gulf of Thailand Oanh Thi Tran Petroleum Geoscience Program, Department of Geology, Faculty
Quantitative evaluation of fault lateral sealing
 IOSR Journal of Engineering (IOSRJEN) ISSN (e): 2250-3021, ISSN (p): 2278-8719 Vol. 06, Issue 03 (March. 2016), V1 PP 29-33 www.iosrjen.org Jianan Zhu 1, Yue Gong 1 1 (College of Earth Sciences, Northeast
scaling parameters of laboratory modelling of
 Influence of low and high IFT fluid systems on scaling parameters of laboratory modelling of CO 2 injection into saline aquifers The 6 th Trondheim Conference on CO 2 Capture, Transport, and Storage 14-16
Measurement, Monitoring and Verification (MMV)
") Measurement, Monitoring and Verification (MMV) Larry Myer USCSC CCS Capacity Building Workshop Charleston, West Virginia October 25, 2011 Outline Why monitor? Information needs Monitoring methods Baselines
Measurement, Monitoring and Verification (MMV) Larry Myer USCSC CCS Capacity Building Workshop Charleston, West Virginia October 25, 2011 Outline Why monitor? Information needs Monitoring methods Baselines
Petroleum Systems (Part One) Source, Generation, and Migration
 Source, Generation, and Migration") Petroleum Systems (Part One) Source, Generation, and Migration GEOL 4233 Class January 2008 Petroleum Systems Elements Source Rock Migration Route Reservoir Rock Seal Rock Trap Processes Generation Migration
Petroleum Systems (Part One) Source, Generation, and Migration GEOL 4233 Class January 2008 Petroleum Systems Elements Source Rock Migration Route Reservoir Rock Seal Rock Trap Processes Generation Migration
P026 Outcrop-based reservoir modeling of a naturally fractured siliciclastic CO 2 sequestration site, Svalbard, Arctic Norway
 P026 Outcrop-based reservoir modeling of a naturally fractured siliciclastic CO 2 sequestration site, Svalbard, Arctic Norway K. Senger (University of Bergen / CIPR), K. Ogata* (University Centre in Svalbard),
Optimisation of Well Trajectory and Hydraulic Fracture Design in a Poor Formation Quality Gas-Condensate Reservoir
 Optimisation of Well Trajectory and Hydraulic Fracture Design in a Poor Formation Quality Gas-Condensate Reservoir Tipping, André Carlo Torres de Carvalho at8865@my.bristol.ac.uk Masters in Petroleum Engineering,
Dynamic GeoScience Martyn Millwood Hargrave Chief Executive OPTIMISE SUCCESS THROUGH SCIENCE
 Dynamic GeoScience Martyn Millwood Hargrave Chief Executive OPTIMISE SUCCESS THROUGH SCIENCE Agenda 1. Ikon Science Where we are now 2. Geoscience 2012 A motion picture 3. Rock physics, AVO and Inversion
Trapping Mechanisms along North Similan and Lanta Trends, Pattani Basin, Gulf of Thailand
 Trapping Mechanisms along North Similan and Lanta Trends, Pattani Basin, Gulf of Thailand Piyaporn Aukkanit Petroleum Geoscience Program, Department of Geology, Faculty of Science, Chulalongkorn University,
Petroleum Potential of the Application Area L12-4
 Petroleum Potential of the Application Area L12-4 The Application Area (L12-4) is underlain by the western Officer Basin, beneath the Gunbarrel Basin. The general basin architecture is outlined in Figure
Geologic influence on variations in oil and gas production from the Cardium Formation, Ferrier Oilfield, west-central Alberta, Canada
 Geologic influence on variations in oil and gas production from the Cardium Formation, Ferrier Oilfield, west-central Alberta, Canada Marco Venieri and Per Kent Pedersen Department of Geoscience, University
Relinquishment Report for Licence Number P1471 Block 16/8f March 2009
 Relinquishment Report for Licence Number P1471 Block 16/8f March 2009 Endeavour Energy UK Ltd Relinquishment Report for Licence Number P1471 Block 16/8f 1 Table of Contents 1.0 Header...3 2.0 Synopsis...3
CO 2 Atlas Assessment of Geological Storage Potential
 CO 2 Atlas Assessment of Geological Storage Potential by M. Cloete 08/04/2010, Gaberone Introduction The aim of a CO2 storage atlas is to identify the availability of geological sites that are both safe
SAND DISTRIBUTION AND RESERVOIR CHARACTERISTICS NORTH JAMJUREE FIELD, PATTANI BASIN, GULF OF THAILAND
 SAND DISTRIBUTION AND RESERVOIR CHARACTERISTICS NORTH JAMJUREE FIELD, PATTANI BASIN, GULF OF THAILAND Benjawan KIinkaew Petroleum Geoscience Program, Department of Geology, Faculty of Science, Chulalongkorn
RWE Dea UK SNS Limited (50%), Faroe Petroleum (UK) Limited
, Faroe Petroleum (UK) Limited") 1. Licence information Licence Number P1975 Licence Round 27 th (2012) Licence Type Traditional Blocks 3/28c & 9/3e Licensees Work Programme 2. Synopsis RWE Dea UK SNS Limited (50%), Faroe Petroleum (UK)
1. Licence information Licence Number P1975 Licence Round 27 th (2012) Licence Type Traditional Blocks 3/28c & 9/3e Licensees Work Programme 2. Synopsis RWE Dea UK SNS Limited (50%), Faroe Petroleum (UK)
1. LICENCE INFORMATION. P209 Block 9/29a ALL. U.K. Block 9/29a (Part Block) Operator/Partners TAQA Bratani Ltd 81%, RWE DEA UK 19%
 Operator/Partners TAQA Bratani Ltd 81%, RWE DEA UK 19%") 1. LICENCE INFORMATION Licence P209 Block 9/29a ALL Licence Round 4th round Blocks U.K. Block 9/29a (Part Block) Licence Type Traditional (Production) Well Operator TAQA Bratani Ltd Operator/Partners TAQA
1. LICENCE INFORMATION Licence P209 Block 9/29a ALL Licence Round 4th round Blocks U.K. Block 9/29a (Part Block) Licence Type Traditional (Production) Well Operator TAQA Bratani Ltd Operator/Partners TAQA
Neogene Uplift of The Barents Sea
 Neogene Uplift of The Barents Sea W. Fjeldskaar A. Amantov Tectonor/UiS, Stavanger, Norway FORCE seminar April 4, 2013 The project (2010-2012) Funding companies Flat Objective The objective of the work
Evaluating the structural integrity of fault-bound traps for CO 2 storage
 BADLEY GEOSCIENCE LIMITED Evaluating the structural integrity of fault-bound traps for CO 2 storage Graham Yielding & Peter Bretan Badley Geoscience Ltd Talk Outline Introduction Workflow for evaluating
Geological CO 2 Storage Feasibility Study: Saline Aquifers and Depleted Oil Fields, Ordos Basin, Shaanxi Province
 U.S. - CHINA CLEAN ENERGY RESEARCH CENTER 中国清洁能源研究中心 Northwest University Geological CO 2 Storage Feasibility Study: Saline Aquifers and Depleted Oil Fields, Ordos Basin, Shaanxi Province 1 Ronald Surdam,
5 ORIGINAL HYDROCARBONS IN PLACE
 5 ORIGINAL HYDROCARBONS IN PLACE The deterministic estimation of oil in place for the White Rose Field was completed using 3-D geological modelling in the RMS software package. This procedure involves
Determination of Geothermal Gradient in the Eastern Niger Delta Sedimentary Basin from Bottom Hole Temperatures
 Journal of Earth Sciences and Geotechnical Engineering, vol. 4, no. 3, 2014, 109-114 ISSN: 1792-9040 (print), 1792-9660 (online) Scienpress Ltd, 2014 Determination of Geothermal Gradient in the Eastern
Opportunities in Oil and Gas Fields Questions TABLE OF CONTENTS
 TABLE OF CONTENTS A. Asset... 3 1. What is the size of the opportunity (size the prize)?... 3 2. Volumetric Evaluation... 3 3. Probabilistic Volume Estimates... 3 4. Material Balance Application... 3 5.
Available online at GHGT-9
 Available online at www.sciencedirect.com Energy Energy Procedia 1 (2009) (2008) 2975 2982 000 000 Energy Procedia www.elsevier.com/locate/procedia www.elsevier.com/locate/xxx GHGT-9 Geological modeling
A STATIC 3D MODELING OF HYDROCARBONIC RESERVOIR WITH THE HELP OF RMS CASE study: THE SOUTH EAST ANTICLINE OF KHUZESTAN IRAN
 :43-48 www.amiemt.megig.ir A STATIC 3D MODELING OF HYDROCARBONIC RESERVOIR WITH THE HELP OF RMS CASE study: THE SOUTH EAST ANTICLINE OF KHUZESTAN IRAN Hamid reza samadi 1,mohammad hadi Salehi 2 1 PH.D
Exploration Significance of Unconformity Structure on Subtle Pools. 1 Vertical structure characteristics of unconformity
 Exploration Significance of Unconformity Structure on Subtle Pools Wu Kongyou (China University of Petroleum,College of Geo-Resources and Information,Shandong Qingdao 266555) Abstract: Vertical structure
Simulation study of density-driven natural convection mechanism in isotropic and anisotropic brine aquifers using a black oil reservoir simulator
 Available online at www.sciencedirect.com Energy Procedia 37 (23 ) 5562 5569 GHGT- Simulation study of density-driven natural convection mechanism in isotropic and anisotropic brine aquifers using a black
Tetsuya Fujii. Bachelor of Geology, Shinshu University, Japan Master of Geophysics, the University of Tokyo, Japan
 USING 2D AND 3D BASIN MODELLING AND SEISMIC SEEPAGE INDICATORS TO INVESTIGATE CONTROLS ON HYDROCARBON MIGRATION AND ACCUMULATION IN THE VULCAN SUB-BASIN, TIMOR SEA, NORTH-WESTERN AUSTRALIA By Tetsuya Fujii
WP2 country review Lithuania
 Saulius Sliaupa Rasa Sliaupiene institute of Geology and Geography WP2 country review Lithuania CO 2 emission in Lithuania (2005) 94 sources listed in the CO2 trading system of Lithuania in 2005 CO 2 emissions
FORMATION EVALUATION OF SIRP FIELD USING WIRELINE LOGS IN WESTERN DEPOBELT OF NIGER DELTA
 FORMATION EVALUATION OF SIRP FIELD USING WIRELINE LOGS IN WESTERN DEPOBELT OF NIGER DELTA 1 Obioha C, ²Adiela U. P and ³*Egesi N 1,3 Department of Geology, Faculty of Science, University of Port Harcourt,
Maturity Modeling of Gomin and South Gomin fields Southern Pattani Basin, Gulf of Thailand
 Maturity Modeling of Gomin and South Gomin fields Southern Pattani Basin, Gulf of Thailand Patinya Jaithan Petroleum Geoscience Program, Department of Geology, Faculty of Science, Chulalongkorn University,
Risking CO 2 leakage along faults what do we know?
 TCCS talk, 14.06.2017 Risking CO 2 leakage along faults what do we know? Alvar Braathen, Elin Skurtveit, Kei Ogata, Kim Senger and Jan Tveranger, and with contributions from Gabrielsen, Olaussen, Osmundsen,
CHAPTER III. METHODOLOGY
 CHAPTER III. METHODOLOGY III.1. REASONING METHODOLOGY Analytical reasoning method which used in this study are: Deductive accumulative method: Reservoir connectivity can be evaluated from geological, geophysical
Assessing our untapped energy resources. Derek Reay Geological Survey of Northern Ireland
 Assessing our untapped energy resources Derek Reay Geological Survey of Northern Ireland Talk Outline Northern Ireland energy market Oil and Gas Exploration Description Exploration risks Application of
UK P2060, Block 29/06b Licence Relinquishment
 ENDEAVOUR ENERGY UK LIMITED UK P2060, Block 29/06b Licence Relinquishment ISSUE RECORD SUMMARY Dec 2015 Final Graham Tegerdine Rev Date Description Document Owner Review Required By Table of Contents 1
Main Challenges and Uncertainties for Oil Production from Turbidite Reservoirs in Deep Water Campos Basin, Brazil*
 Main Challenges and Uncertainties for Oil Production from Turbidite Reservoirs in Deep Water Campos Basin, Brazil* Carlos H. Bruhn 1, Antonio Pinto 1, and Paulo R. Johann 1 Search and Discovery Article
CONTENTS INTRODUCTION...2
 Contents CONTENTS...1 1. INTRODUCTION...2 2. SAMPLING...3 2.1 CUTTINGS SAMPLES....3 2.2 CORE SAMPLES....3 3. ANALYTICAL METHODS...4 3.1 CLAY MINERALOGY...4 3.2 GAS ADSORPTION, SPECIFIC SURFACE AREA...4
HORDA SURVEY HERALDS NEW STRATEGY
 HORDA SURVEY HERALDS NEW STRATEGY CGG sets sights on multi-client market leadership in Norway BY IDAR HORSTAD, ERLING FRANTZEN AND JO FIRTH, CGG 12 seismic profile Figure 1: Reprocessing of the Cornerstone
Modelling and simulation of CO 2 leakage mechanisms from geological storage
 1 Modelling and simulation of CO 2 leakage mechanisms from geological storage Sorin Georgescu (sorin.georgescu@iku.sintef.no) Alv-Arne Grimstad (alv-arne.grimstad@iku.sintef.no) 2 Introduction Capture
Estimation of Pore Pressure from Well logs: A theoretical analysis and Case Study from an Offshore Basin, North Sea
 P-217 Estimation of Pore Pressure from Well logs: A theoretical analysis and Case Study from an Offshore Basin, North Sea Pritam Bera Final Year, M.Sc.Tech. (Applied Geophysics) Summary This paper concerns
P.1619 License Relinquishment Report
 P.1619 License Relinquishment Report Effective Date: 14 th October 2015 1. Licence Information License Number: P.1619 License Round: 25 th License Type: Traditional Block Number(s): 21/27b Operator: MOL
Appraising a late-middle-aged Brent Group field
 Appraising a late-middle-aged Brent Group field Reservoir learnings after nearly 20 years of Pelican field production Jill Marriott The Pelican Field The Pelican oil field is nearly 20 years old It is
Tu D Understanding the Interplay of Fractures, Stresses & Facies in Unconventional Reservoirs - Case Study from Chad Granites
 Tu D201 04 Understanding the Interplay of Fractures, Stresses & Facies in Unconventional Reservoirs - Case Study from Chad Granites D. Lirong (Chinese National Petroleum Company Ltd. (Chad)), C. Shrivastava*