Earthquake Early Warning in Subduction Zones
|
|
|
- Ashley Richard
- 5 years ago
- Views:
Transcription
1 Earthquake Early Warning in Subduction Zones Jeffrey J. McGuire 1, Frederik J. Simons 2, and John A. Collins 1 1 Department of Geology and Geophysics, Woods Hole Oceanographic Institution 2 Geosciences Department, Princeton University Abstract: Earthquake Early Warning (EEW) algorithms estimate the magnitude of an underway rupture from the first few seconds of the P wave to allow hazard assessment and mitigation before the S wave arrival. Many large subduction zone earthquakes initiate km offshore, potentially allowing seafloor instruments sufficient time to identify large ruptures before the S waves reach land. We tested an EEW algorithm using accelerograms recorded offshore Hokkaido in the region of the 2003 M w 8.1 Tokachi Oki earthquake and its aftershocks. A wavelet transform of the first ~4 seconds of the P wave concentrates information about earthquake magnitude from both waveform amplitude and frequency content. We find that wavelets with support of a few seconds provide discriminants for EEW that are both accurate enough to be useful and superior to peak acceleration or peak velocity. Additionally, we observe a scaling of wavelet coefficient magnitude above M w 6.0 indicating that, at least in a stochastic sense, the final size of a rupture can be estimated from the initial portion of the seismogram. Introduction Earthquake Early Warning (EEW) algorithms attempt to estimate the magnitude of an underway rupture from the first few seconds of the incoming P wave, so that hazard mitigation can occur before the arrival of S waves. For faults in continental crust, this requires making a magnitude estimate from only 2 3 seconds of P wave data (Allen & Kanamori, 2003; Wu & Zhao, 2006). Owing to the increase in
2 earthquake duration with magnitude, if all earthquakes initiated in the same manner, there should be no difference between the first 3 seconds of a relatively minor M5.5 and a devastating M8. Yet, EEW algorithms are gaining increasing use and several studies have presented evidence that reliable discriminants between damaging and non damaging earthquakes can be derived from the initial portion of the P wave (Allen & Kanamori, 2003; Olson & Allen, 2005; Wu & Zhao, 2006; Zollo et al., 2007). Owing to the limited number of large (M w >7) earthquakes that have been recorded by modern seismic arrays, there is considerable debate about the ability of these techniques to sense any magnitude scaling above M w ~5 6 (Rydelek & Horiuchi, 2005; Rydelek et al., 2007; Zollo et al., 2007). This issue is critically important for both hazard applications and for understanding earthquake nucleation. Many of the methods that have demonstrated scaling behavior extending to M w >6 utilized estimates of the frequency content (rather than amplitude) of the initial arrival with relatively low frequency energy indicating an impending large rupture (Kanamori, 2005; Olson & Allen, 2005; Simons et al., 2006). This observation implies that large earthquakes are more likely when slip initiates within a spatially extended nucleation zone and/or a high stress drop. Currently this debate is limited by the lack of high quality datasets for M>7 earthquakes. Subduction zone thrust faults present favorable sites for EEW of great (M w 8) earthquakes because their seismogenic zones are located almost entirely offshore. Thus, the time between when a large subduction zone thrust event initiates and when the S waves cause damage (onshore) is much longer than in continental EEW applications. Moreover, since these faults generate the largest ruptures on earth, they present a natural target for studying the scaling of earthquake nucleation. The 2003 M w 8.1 Tokachi Oki earthquake was the first great subduction zone event to be captured on scale by an array of ocean
3 bottom seismometers (OBSs) in its epicentral region (Figure 1). A cabled array of strong motion OBSs deployed in the rupture zone region by JAMSTEC (Watanabe et al., 2006; Mikada et al., 2006) provide the first high quality dataset for studying EEW algorithms in a subduction environment. Data We utilize seismograms from two accelerometers (station codes OBS1 and OBS2) of the JAMSTEC Kushiro cabled observatory ( located above the shallow portion of the seismogenic zone (Figure 1). To ensure that the P waveforms we analyzed were free of interference from surface reflections, we only utilized the two deepest (~2500 m depth) JAMSTEC stations and limited our analysis to the first ~4 seconds of the P wave arrival. We analyzed the high gain vertical component of acceleration at both stations for all events except for the mainshock for which we had to analyze the raw (i.e. unrotated but nearly vertical) Y component low gain channel due to clipping of the high gain channels and errors in the archived low gain vertical component (pers. comm. K. Obana 2007). We utilized 43 accelerograms from 4.0 M w 8.1 shallow earthquakes (FNET centroid depths 40 km), that had epicentral distances between 15 and 60 km from either station (OBS1 or OBS2) to avoid interference from the S and P n phases in the first ~4 seconds. A short term/long term average detector was used to pick the P wave arrival of each event and a 512 sample (5.12 s) window was extracted that extended from ~1 s before to ~4 s after the trigger (see Figure 2). The seismograms were then integrated to velocity using the trapezoidal algorithm (Wang, 1996). Wavelet Analysis Wavelet analysis in an EEW context seeks to exploit the expected changes in both amplitude and
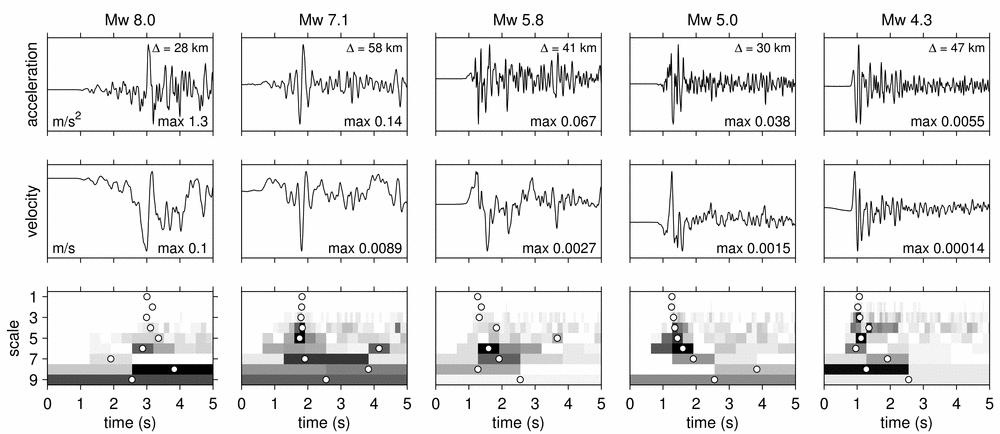
4 period of the initial P waveform with increasing earthquake magnitude. Numerous studies of earthquake corner frequency have demonstrated that magnitude information can be extracted both from the frequency band concentrating most energy as well as form the low frequency amplitude of the P wave. Thus, information on event magnitude should be contained in the portion of the seismograms we analyze for earthquakes with rupture durations shorter than ~4 seconds (M w <6). Wavelet expansions combine information about frequency content, arrival time, and signal amplitude into scale dependent wavelet coefficients, making them intrinsically suitable for EEW. We follow the approach of Simons et al., (2006) and use a biorthogonal wavelet basis (Cohen, et al., 1992) with 2 and 4 vanishing moments for the primal and dual wavelets, respectively. The wavelet expansion coefficients are calculated at N=9 scales at dyadically spaced dilations. Our window length is 2 9 =512 samples (Figure 2). Unlike Simons et al. (2006), we did not utilize any thresholding because of our prior knowledge that the P wave arrival is contained within the data window. Therefore we take the coefficient with the largest absolute value at a particular scale for each waveform as a potential indicator of magnitude. Figure 2 demonstrates that at low scales (1 to ~6) for small earthquakes, the coefficient with the largest absolute amplitude is typically concentrated near the P wave arrival. However, for larger earthquakes and larger scales (i.e. lower frequencies), the coefficient with the largest amplitude is often later in the arrival, corresponding to large bursts of energy. There is a clear pattern in Figure 2 of the largest amplitude coefficient values (e.g. darkest colors in the bottom panels) moving from small scales (~1 6) to large scales (7 9) as earthquake magnitude increases. This pattern is representative of the Tokachi Oki dataset and suggests that the largest scale coefficients, corresponding to wavelets supported on 3 5 second intervals, should provide an effective EEW discriminant.
5 The Tokachi Oki dataset demonstrates a strong correlation between the magnitude of the wavelet coefficients and earthquake moment that allows potentially damaging M w 6 earthquakes to be differentiated from smaller events. Figures 3A D show the variation in the maximum absolute value of the coefficients at scales 3, 5, 7, and 9. The values have not been corrected for wave propagation or epicentral distance in any way because these parameters would not be known reliably in real time for offshore environments. The lack of a correction for epicentral distance likely accounts for much of the scatter at a particular magnitude level (Wu & Zhao, 2006; Zollo et al., 2007). Despite this, it is clear that the M w 7 earthquakes have the largest coefficient magnitudes at every scale, and that the separation between the magnitude ~4 5 events and the magnitude 7 8 events increases with scale. Thus, the most accurate discriminants on earthquake size are the scale 8 and 9 coefficients which are only sensitive to low frequency information. To evaluate the cause of the increase in coefficient amplitude with earthquake magnitude, we compare our measurements to wavelet coefficients calculated for the Sato and Hirasawa (S H) kinematic source model (Sato & Hirasawa, 1973; Aki & Richards, 2002) of an expanding circular rupture with a constant stress drop. We calculated the vertical component seismograms for a rupture with a stress drop of 10 MPa including the near, intermediate, and far field terms in an elastic whole space using equation 4.32 of Aki and Richards (2002). The resulting displacement seismograms were differentiated and then processed using the same wavelet decomposition as the data. We processed seismograms containing all three terms as well as ones containing only the far field term. We did not correct the S H seismograms for wave propagation effects (e.g. attenuation) so they represent a best case scenario for the amount of
6 magnitude information likely to be available in the first 4 seconds of the P wave arrivals. To allow the S H coefficients to be plotted on the same scale as the data, we normalized their amplitude at M w 4.3 for each scale to equal the median of the coefficient values at that scale derived from M w 4.3 earthquakes. The S H model curves in Figure 3A D demonstrate that scaling of the coefficient values between M w 4 and M w ~6 or 7 should be expected due to the 4 s duration of our seismogram window. The upper end of the scaling region depends on the assumed stress drop and would be ~M w 6 for a 1 MPa stress drop. While the S H model is simplistic, it demonstrates that even for high (10 MPa) stress drops, we should not expect a larger coefficient value for the mainshock (M w 8.1) than the largest aftershock (M w 7.1). This result is intuitive since both the M w 7.1 and M w 8.1 earthquakes had durations significantly longer than the 4 seconds. However, despite this physical intuition, the observed coefficient values continue on the same scaling trend well beyond M w 6. A similar observation for the mainshock was made by Kanamori [2005] who used the predominant period as a metric of earthquake magnitude. One potential mechanism for generating the unusually large coefficient values for the M w 8.1 mainshock would be if its seismograms contained significant contributions from the near field (NF) term. The black curves in Figure 3 demonstrate that seismograms containing the NF term will produce higher coefficient values than those that do not. Owing to the epicentral distances and magnitudes of the various events, only the M w 8.1 mainshock in Figure 3 is likely to have near field terms contributing to its seismogram. Discussion From the EEW perspective, the best metric is the one with the best resolved difference between events that cause widespread damage (M w >6) and those that don't (M w <~6). Figure 3E compares the
7 dynamic range of the scale 9 coefficient with two common metrics derived from the same data: peak absolute value of velocity and peak absolute value of acceleration. There is a clear trend of greater separation between small and large events as one switches from peak acceleration to peak velocity to the scale 9 coefficient. This progression demonstrates the need to consider both amplitude and frequency content in an EEW metric. The large scale wavelet coefficients vary by four orders of magnitude between M w 4.0 and 8.1 and hence provide the best metric for identifying damaging earthquakes. The scaling of the wavelet coefficients across the entire earthquake size range (Figure 3) is a surprising result that may imply that the final magnitude of the rupture depends on the properties of the nucleation zone. The mainshock lasted about 50 seconds and most of the moment release occurred well downdip of the epicentral region (Yagi 2004). Thus, the large amplitude of the wavelet coefficients for the mainshock P wave (Figure 3) do not reflect the majority of the moment release but rather the properties of the epicentral region compared to the rupture zones of the aftershocks. Three factors may contribute to this difference. First, the greater propagation distance for the M7.1 (58 km) to the OBS than for the M8.1 (28 km) leads to a smaller coefficient for the M7.1 owing to geometrical spreading and attenuation. However, it is also evident from the velocity waveforms in Figure 2 that the initial portion of the M8.1 events' P wave was enriched in low frequency energy relative to the M7.1 events, despite experiencing less attenuation. This is reflected in the highest amplitude coefficient for the M7.1 event occurring at scale 5 while for the M8.1 the highest amplitude occurs at scale 8 (Figure 2). One explanation for the enriched low frequency content of the M8 is that its seismogram contains near field terms as this station may be within about 1 fault length of the source region given location uncertainties. Near field terms are proportional to the moment release history M(t) rather than the moment rate history
8 Ṁ t that specifies the ordinary far field P waveforms, making them inherently lower frequency. Moreover, they do not become a significant contribution to the seismogram until the earthquake magnitude is fairly large. Thus, near field terms may preferentially contribute to the increase in coefficient magnitude between the M w 7.1 and M w 8.0 earthquakes. A third contribution to the large amplitude wavelet coefficients may result from an unusually large stress drop in the mainshock's epicentral region that would generate higher amplitude waveforms during the first 4 seconds of the rupture than in ordinary events. Yagi's (2004) finite source inversion, which did not utilize the JAMSTEC OBS data, found that the mainshock began with a very high stress drop (~10 MPa) subevent. This is surprising in that the updip edge of the seismogenic zone is thought to represent the trenchward boundary of the zone in which the rock is competent enough to support the stress levels necessary for earthquake rupture (Moore & Saffer, 2001). However, if the rupture did begin with a high stress drop subevent, it would be expected to have a greater chance of leading to a large rupture owing to the greater stress concentration at the rupture front (Yamada & Heaton, 2007). Thus, it may be prudent to site seafloor instruments for EEW near locations of unusually competent (high velocity) rock. Overall, the large amplitude of the M w 8.1 coefficient relative to the M w 7.1 appears to imply an unusual nucleation process for the mainshock, but this may be event specific rather than a general feature of M8 earthquakes. The 2003 Tokachi Oki mainshock initiated km from the coastal region most directly affected by the strong shaking and tsunami, a distance that allows sufficient time for seafloor based EEW systems to communicate with shore. The first S waves reached shore between s after the rupture began while the P wave arrived at OBS1 8 seconds after the rupture began. Thus, the data needed to
9 calculate the wavelet coefficients in Figure 3 was available 8 18 s before the first S waves reached land. Moreover, the rupture itself lasted almost 50 s with the largest pulse of moment release occurring about s into the rupture (Yagi, 2004), so the primary damage from the main S wave pulse began >25 s after the initial magnitude estimate was available on the seafloor. The JAMSTEC OBSs had real time telemetry via a submarine cable and thus only a ~1 s transmission latency. While cabled observatories are ideal, very few have been installed due to their cost. A potential, cheaper solution is to link the OBS to a moored buoy via an acoustic modem and then to shore via a satellite link. This type of system had about a one minute seafloor to shore transmission time in a deployment off Cascadia (Frye et al., 2006), the majority of which was spent reestablishing the communications channels for each transmission. The data transmission time could be as little as ~10 s if both the acoustic and satellite communications channels were continuously open. Perhaps the strongest argument for establishing seafloor based EEW observatories in subduction zones is simply the unique sensitivity of such data to earthquake source properties. Near source seismograms are not contaminated with the arrivals of later phases, particularly refracted phases that can distort the waveform's frequency content. Thus, EEW metrics will be more accurately determined from local OBS data than regional (on land) data. Moreover, these recordings can include the near and intermediate field terms, and hence have a greater sensitivity to magnitude (Figure 3). Any seafloor observatory could also include a pressure sensor capable of detecting vertical deformation on the order of ~10 cm or greater (Tamaki et al., 2002). Since uplift of the seafloor in the source region is the source term for tsunami generation, this fundamental data type would greatly improve real time tsunami forecasts for the regions immediately adjacent to the rupture zone. Owing to the greater travel time of
10 tsunamis (minutes) such data could easily be communicated to shore in time to affect warning decisions. Acknowledgements: We thank Dr. K. Obana and Dr. T. Watanabe for help with working with the JAMSTEC OBS data. Dr. M. Yamada provided insightful suggestions on the influence of the near field term. This work was supported by the Deep Ocean Exploration Institute at WHOI. References Aki, K., and P. G. Richards (2002), Quantitative Seismology, Quantitative Seismology, 2nd Ed., University Science Books, ISBN , 704pp, Allen, R. M., and H. Kanamori (2003), The Potential for Earthquake Early Warning in Southern California, Science, 300(5620), , doi: /science Cohen, A., Daubechies, I., et al. (1992), Biorthogonal bases of compactly supported wavelets, Comm. Pure Appl. Math., 45, Kanamori, H. (2005), Real Time Seismology and Earthquake Damage Mitigation, Ann. Rev. Earth Planet. Sci., 33, Kisimoto, K. (2000), Combined Bathymetric and Topographic Mesh Data: Japan250m.grd, GSJ Openfile Report #353. Mikada, H., K. Mitsuzawa, et al. (2006), New discoveries in dynamics of an M8 earthquake phenomena and their implications from the 2003 Tokachi oki earthquake using a long term monitoring cabled observatory, Tectonophysics, 426, Moore, J. C, and D. Saffer (2001), Uptip limit of the seismogenic zone beneath the accretionary prism of southwest Japan: An effect of diagenetic to low grade metamorphic processes and increasing
11 effective stress, Geology, 29(2), Olson, E. L., and R. M. Allen (2005), The deterministic nature of earthquake rupture, Nature, 438(7065), Rydelek, P., and S. Horiuchi (2005), Earth science: is earthquake rupture deterministic, Nature, 438(7065), Rydelek, P., C. Wu, et al. (2007), Comment on "Earthquake magnitude estimation from peak amplitudes of very early seismic signals on strong motion records" by Aldo Zollo, Maria Lancieri, and Stefan Nielsen, Geophy. Res. Lett., 34, doi: /2007gl Sato, T., and T. Hirasawa (1973), Body wave spectra from propagating shear cracks, J. Phys. Earth. Simons, F. J., B. D. F. Dando, et al. (2006), Automatic detection and rapid determination of earthquake magnitude by wavelet multiscale analysis of the primary arrival, Earth and Planetary Science Letters, 250(1 2), Tamaki, T., R. Hino, et al. (2002), Vertical crustal movement on the seafloor detected with differential pressure monitoring, in Underwater Technology, Proceedings of the 2002 International Symposium on, pp Wang, L. J. (1996), Processing of Near Field Earthquake Accelerograms, Caltech Thesis. Watanabe, T., H. Takahasi, et al. (2006), Seismological monitoring on the 2003 Tokachi Oki earthquake, derived from off Kushiro permanent cabled OBSs and land based observations, Tectonophysics, 426, Wu, Y M., and Li Zhao (2006), Magnitude estimation using the first three seconds P wave amplitude in
12 earthquake early warning, Geophys Res. Lett., 33, doi: /2006gl Yagi, Y. (2004), Source rupture process of the 2003 Tokachi oki earthquake determined by joint inversion of teleseismic body wave and strong ground motion data, Earth, Planets, Space, 56, Yamada, M., and Heaton, T. (2007), Predicting the ultimate size of an earthquake which is still ongoing and its application to earthquake early warning systems, Seism. Res. Letts., Proceedings of the 2007 Seisomological Society of America Annual Meeting. Zollo, A., M. Lancieri, et al. (2007), Reply to comment by P. Rydelek et al. on "Earthquake magnitude estimation from peak amplitudes of very early seismic signals on strong motion records, Geophys Res. Lett., 34, doi: /2007gl Zollo, A., M. Lancieri, et al. (2007), Earthquake magnitude estimation from peak amplitudes of very early seismic signals on strong motion records, Geophys Res. Lett., 34, doi: /2007GL Figure Captions Figure 1. Map of the source area of the 2003 M w 8.1 Tokachi Oki earthquake. Colors indicate seafloor depth and topography in meters (Kisimoto, 2000). The locations of the JAMSTEC cabled accelerometers OBS1 and OBS2 (red triangles), the mainshock epicenter (red star), and the aftershocks utilized in this study (white circles) are shown. Inset shows the earthquake location (star) within Japan. Figure 2. Examples of seismograms and wavelet analysis for 5 earthquakes. The top panel shows the 512 sample accelerogram extracted from the raw time series using the STA/LTA trigger. Each trace
13 is labeled with its distance from the epicenter in km and its maximum amplitude in m/s 2. The middle panel shows the same trace integrated to velocity. The bottom panels plot the absolute value of the wavelet coefficients at each of the nine scales (darker shades correspond to larger amplitudes) derived from the transformation of the velocity seismograms in the middle panels. The grayscale is the same for all scales within a given panel. At the largest scale (9) equivalent to the entire duration of the window, only one coefficient is calculated. The white circles denote the interval with the largest amplitude coefficient at a given scale. Figure 3. A D) Comparison of peak amplitude of the wavelet coefficients at scales 3, 5, 7, and 9 (white circles) with the earthquake's M w estimate. The gray and black lines denote the coefficient values resulting from a wavelet transform of the velocity seismograms expected for the Sato and Hirasawa (S H) source model for a stress drop of 10 MPa. The black lines include the near and intermediate field terms of Aki and Richards equation 4.32, while the gray line includes only the farfield term. The S H model used a P wave velocity of 6 km/s, a rupture velocity of 2.5 km/s, a epicentral distance of 20 km, and a shear modulus of 3e9, and a ray takeoff angle =60. To scale for propagation effects, the S H curves have been pinned to the median value of the observed coefficient magnitudes at M w 4.3. E) Comparison of magnitude estimates. Peak absolute value of acceleration (gray squares), peak absolute value of velocity (black diamonds) and the wavelet coefficient at the 9 th scale (open circles) have all been normalized to 1 for the mainshock.

14 Figure 1. Figure 2. Figure 3.
Analysis of seafloor seismograms of the 2003 Tokachi-Oki earthquake sequence for earthquake early warning
 GEOPHYSICAL RESEARCH LETTERS, VOL. 35, L14310, doi:10.1029/2008gl033986, 2008 Analysis of seafloor seismograms of the 2003 Tokachi-Oki earthquake sequence for earthquake early warning Jeffrey J. McGuire,
Exploring the feasibility of on-site earthquake early warning using close-in records of the 2007 Noto Hanto earthquake
 LETTER Earth Planets Space, 60, 155 160, 2008 Exploring the feasibility of on-site earthquake early warning using close-in records of the 2007 Noto Hanto earthquake Yih-Min Wu 1 and Hiroo Kanamori 2 1
Japan Agency for Marine-Earth Science and Technology (JAMSTEC), 2-15 Natsushima-cho, Yokosuka, Kanagawa, , JAPAN
, 2-15 Natsushima-cho, Yokosuka, Kanagawa, , JAPAN") LARGE EARTHQUAKE AND ASSOCIATED PHENOMENA OBSERVED WITH SEAFLOOR CABLED OBSERVATORY NEAR EPICENTER - AN IMPLICATION FOR POSSIBLE ADDITIONAL MEASUREMENT WITH TELECOMMUNICATION NETWORKS FOR IDENTIFICATION
LARGE EARTHQUAKE AND ASSOCIATED PHENOMENA OBSERVED WITH SEAFLOOR CABLED OBSERVATORY NEAR EPICENTER - AN IMPLICATION FOR POSSIBLE ADDITIONAL MEASUREMENT WITH TELECOMMUNICATION NETWORKS FOR IDENTIFICATION
BROADBAND STRONG MOTION SIMULATION OF THE 2004 NIIGATA- KEN CHUETSU EARTHQUAKE: SOURCE AND SITE EFFECTS
 Third International Symposium on the Effects of Surface Geology on Seismic Motion Grenoble, France, 30 August - 1 September 2006 Paper Number: 105 BROADBAND STRONG MOTION SIMULATION OF THE 2004 NIIGATA-
Early magnitude and potential damage zone estimates for the great Mw 9 Tohoku-Oki earthquake
 GEOPHYSICAL RESEARCH LETTERS, VOL. 39,, doi:10.1029/2012gl053923, 2012 Early magnitude and potential damage zone estimates for the great Mw 9 Tohoku-Oki earthquake Simona Colombelli, 1 Aldo Zollo, 1 Gaetano
Section Forces Within Earth. 8 th Grade Earth & Space Science - Class Notes
 Section 19.1 - Forces Within Earth 8 th Grade Earth & Space Science - Class Notes Stress and Strain Stress - is the total force acting on crustal rocks per unit of area (cause) Strain deformation of materials
Effect of the Emperor seamounts on trans-oceanic propagation of the 2006 Kuril Island earthquake tsunami
 GEOPHYSICAL RESEARCH LETTERS, VOL. 35, L02611, doi:10.1029/2007gl032129, 2008 Effect of the Emperor seamounts on trans-oceanic propagation of the 2006 Kuril Island earthquake tsunami S. Koshimura, 1 Y.
FEASIBILITY STUDY ON EARTHQUAKE EARLY WARNING SYSTEM FOR THE CITY OF LIMA, PERU, USING A NEWLY DEPLOYED STRONG-MOTION NETWORK
 FEASIBILITY STUDY ON EARTHQUAKE EARLY WARNING SYSTEM FOR THE CITY OF LIMA, PERU, USING A NEWLY DEPLOYED STRONG-MOTION NETWORK Cinthia CALDERON MEE1771 Supervisor: Takumi HAYASHIDA Toshiaki YOKOI ABSTRACT
overlie the seismogenic zone offshore Costa Rica, making the margin particularly well suited for combined land and ocean geophysical studies (Figure
 Chapter 1 Introduction Historically, highly destructive large magnitude (M w >7.0) underthrusting earthquakes nucleate along the shallow segment of subduction zone megathrust fault, and this region of
Earthquake Stress Drops in Southern California
 Earthquake Stress Drops in Southern California Peter Shearer IGPP/SIO/U.C. San Diego September 11, 2009 Earthquake Research Institute Lots of data for big earthquakes (rupture dimensions, slip history,
The 2016, October 26, Central Italy Earthquake Origin Time 17:10:36 UTC, M L(ISNet) =5.3; M W(ISNet) =5.6
 =5.3; M W(ISNet) =5.6") The 2016, October 26, Central Italy Earthquake Origin Time 17:10:36 UTC, M L(ISNet) =5.3; M W(ISNet) =5.6 RISSC-Lab: Laboratorio di RIcerca in Sismologia Sperimentale e Computazionale The event as seen
The 2016, October 26, Central Italy Earthquake Origin Time 17:10:36 UTC, M L(ISNet) =5.3; M W(ISNet) =5.6 RISSC-Lab: Laboratorio di RIcerca in Sismologia Sperimentale e Computazionale The event as seen
Empirical Green s Function Analysis of the Wells, Nevada, Earthquake Source
 Nevada Bureau of Mines and Geology Special Publication 36 Empirical Green s Function Analysis of the Wells, Nevada, Earthquake Source by Mendoza, C. 1 and Hartzell S. 2 1 Centro de Geociencias, Universidad
Modelling Strong Ground Motions for Subduction Events in the Wellington Region, New Zealand
 Proceedings of the Ninth Pacific Conference on Earthquake Engineering Building an Earthquake-Resilient Society 14-16 April, 2011, Auckland, New Zealand Modelling Strong Ground Motions for Subduction Events
Earthquake stress drop estimates: What are they telling us?
 Earthquake stress drop estimates: What are they telling us? Peter Shearer IGPP/SIO/U.C. San Diego October 27, 2014 SCEC Community Stress Model Workshop Lots of data for big earthquakes (rupture dimensions,
GEOPHYSICAL RESEARCH LETTERS, VOL. 31, L19604, doi: /2004gl020366, 2004
 GEOPHYSICAL RESEARCH LETTERS, VOL. 31, L19604, doi:10.1029/2004gl020366, 2004 Characteristic seismic activity in the subducting plate boundary zone off Kamaishi, northeastern Japan, revealed by precise
Widespread Ground Motion Distribution Caused by Rupture Directivity during the 2015 Gorkha, Nepal Earthquake
 Widespread Ground Motion Distribution Caused by Rupture Directivity during the 2015 Gorkha, Nepal Earthquake Kazuki Koketsu 1, Hiroe Miyake 2, Srinagesh Davuluri 3 and Soma Nath Sapkota 4 1. Corresponding
Real Time Monitoring System for Megathrust Earthquakes and Tsunamis - Cabled Network System and Buoy System in Japan -
 Real Time Monitoring System for Megathrust Earthquakes and Tsunamis - Cabled Network System and Buoy System in Japan - 1 Subduction zones around the world Haiti Italy Turkey Tohoku Sichuan Taiwan Sumatra
Final Report for DOEI Project: Bottom Interaction in Long Range Acoustic Propagation
 Final Report for DOEI Project: Bottom Interaction in Long Range Acoustic Propagation Ralph A. Stephen Woods Hole Oceanographic Institution 360 Woods Hole Road (MS#24) Woods Hole, MA 02543 phone: (508)
I point out two possible paradoxical difficulties in the important target of the IODP in subduction zones, i.e.,
 Drilling the Seismogenic Zone: Some Paradoxes Tetsuzo Seno Earthquake Research Institute, University of Tokyo (Bull. Earthq. Res. Inst., subumitted on January 16, 2003; accepted on July 22, 2003) Abstract
Section 19.1: Forces Within Earth Section 19.2: Seismic Waves and Earth s Interior Section 19.3: Measuring and Locating.
 CH Earthquakes Section 19.1: Forces Within Earth Section 19.2: Seismic Waves and Earth s Interior Section 19.3: Measuring and Locating Earthquakes Section 19.4: Earthquakes and Society Section 19.1 Forces
Determination of earthquake early warning parameters, τ c and P d, for southern California
 Geophys. J. Int. (2007) 170, 711 717 doi: 10.1111/j.1365-246X.2007.03430.x Determination of earthquake early warning parameters, τ c and P d, for southern California Yih-Min Wu, 1 Hiroo Kanamori, 2 Richard
Source rupture process of the 2003 Tokachi-oki earthquake determined by joint inversion of teleseismic body wave and strong ground motion data
 LETTER Earth Planets Space, 56, 311 316, 2004 Source rupture process of the 2003 Tokachi-oki earthquake determined by joint inversion of teleseismic body wave and strong ground motion data Yuji Yagi International
Indian Ocean Tsunami Warning System: Example from the 12 th September 2007 Tsunami
 Indian Ocean Tsunami Warning System: Example from the 12 th September 2007 Tsunami Charitha Pattiaratchi 1 Professor of Coastal Oceanography, The University of Western Australia Email: chari.pattiaratchi@uwa.edu.au
Earthquakes. Building Earth s Surface, Part 2. Science 330 Summer What is an earthquake?
 Earthquakes Building Earth s Surface, Part 2 Science 330 Summer 2005 What is an earthquake? An earthquake is the vibration of Earth produced by the rapid release of energy Energy released radiates in all
Differentiating earthquake tsunamis from other sources; how do we tell the difference?
 Differentiating earthquake tsunamis from other sources; how do we tell the difference? David Tappin (1), Stephan Grilli (2), Jeffrey Harris (2), Timothy Masterlark (3), James Kirby (4), Fengyan Shi Shi
Estimation of S-wave scattering coefficient in the mantle from envelope characteristics before and after the ScS arrival
 GEOPHYSICAL RESEARCH LETTERS, VOL. 30, NO. 24, 2248, doi:10.1029/2003gl018413, 2003 Estimation of S-wave scattering coefficient in the mantle from envelope characteristics before and after the ScS arrival
Complicated repeating earthquakes on the convergent plate boundary: Rupture processes of the 1978 and 2005 Miyagi-ken Oki earthquakes
 Complicated repeating earthquakes on the convergent plate boundary: Rupture processes of the 1978 and 2005 Miyagi-ken Oki earthquakes Changjiang Wu 1 and Kazuki Koketsu Earthquake Research Institute, University
Earthquake patterns in the Flinders Ranges - Temporary network , preliminary results
 Earthquake patterns in the Flinders Ranges - Temporary network 2003-2006, preliminary results Objectives David Love 1, Phil Cummins 2, Natalie Balfour 3 1 Primary Industries and Resources South Australia
Earthquake magnitude estimation from peak amplitudes of very early seismic signals on strong motion records
 Click Here for Full Article GEOPHYSICAL RESEARCH LETTERS, VOL. 33, L23312, doi:10.1029/2006gl027795, 2006 Earthquake magnitude estimation from peak amplitudes of very early seismic signals on strong motion
Earthquakes and Earthquake Hazards Earth - Chapter 11 Stan Hatfield Southwestern Illinois College
 Earthquakes and Earthquake Hazards Earth - Chapter 11 Stan Hatfield Southwestern Illinois College What Is an Earthquake? An earthquake is the vibration of Earth, produced by the rapid release of energy.
Earthquakes Chapter 19
 Earthquakes Chapter 19 Does not contain complete lecture notes. What is an earthquake An earthquake is the vibration of Earth produced by the rapid release of energy Energy released radiates in all directions
Data Repository: Seismic and Geodetic Evidence For Extensive, Long-Lived Fault Damage Zones
 DR2009082 Data Repository: Seismic and Geodetic Evidence For Extensive, Long-Lived Fault Damage Zones Fault Zone Trapped Wave Data and Methods Fault zone trapped waves observed for 2 shots and 5 local
Mechanics of Earthquakes and Faulting
 Mechanics of Earthquakes and Faulting Lecture 20, 30 Nov. 2017 www.geosc.psu.edu/courses/geosc508 Seismic Spectra & Earthquake Scaling laws. Seismic Spectra & Earthquake Scaling laws. Aki, Scaling law
CHARACTERISTICS OF SOURCE SPECTRA OF SMALL AND LARGE INTERMEDIATE DEPTH EARTHQUAKES AROUND HOKKAIDO, JAPAN
 13 th World Conference on Earthquake Engineering Vancouver, B.C., Canada August 1-6, 2004 Paper No. 1861 CHARACTERISTICS OF SOURCE SPECTRA OF SMALL AND LARGE INTERMEDIATE DEPTH EARTHQUAKES AROUND HOKKAIDO,
Figure Locations of the CWB free-field strong motion stations, the epicenter, and the surface fault of the 1999 Chi-Chi, Taiwan earthquake.
 2.2 Strong Ground Motion 2.2.1 Strong Ground Motion Network The world densest digital strong ground motion network of Taiwan with the station mesh of 3 km in the urban areas (Shin et al., 2) monitored
Part 2 - Engineering Characterization of Earthquakes and Seismic Hazard. Earthquake Environment
 Part 2 - Engineering Characterization of Earthquakes and Seismic Hazard Ultimately what we want is a seismic intensity measure that will allow us to quantify effect of an earthquake on a structure. S a
Urgent aftershock observation of the 2004 off the Kii Peninsula earthquake using ocean bottom seismometers
 LETTER Earth Planets Space, 57, 363 368, 2005 Urgent aftershock observation of the 2004 off the Kii Peninsula earthquake using ocean bottom seismometers Shin ichi Sakai 1, Tomoaki Yamada 1, Masanao Shinohara
Rapid Earthquake Rupture Duration Estimates from Teleseismic Energy Rates, with
 1 2 Rapid Earthquake Rupture Duration Estimates from Teleseismic Energy Rates, with Application to Real-Time Warning 3 Jaime Andres Convers 1 and Andrew V. Newman 1 4 5 1. School of Earth and Atmospheric
Magnitude 7.9 SE of KODIAK, ALASKA
 A magnitude 7.9 earthquake occurred at 12:31 am local time 181 miles southeast of Kodiak at a depth of 25 km (15.5 miles). There are no immediate reports of damage or fatalities. Light shaking from this
Source Characteristics of Large Outer Rise Earthquakes in the Pacific Plate
 Source Characteristics of Large Outer Rise Earthquakes in the Pacific Plate T. Sasatani, N. Takai, M. Shigefuji, and Y. Miyahara Hokkaido University, Sapporo, Japan W. Kawabata Electric Power Development
What is an Earthquake?
 Earthquakes What is an Earthquake? Earthquake - sometimes violent shaking of ground caused by movement of Earth s tectonic plates; creates seismic waves Often followed by smaller earthquakes (aftershocks);
Rapid magnitude determination from peak amplitudes at local stations
 Earth Planets Space, 65, 843 853, 2013 Rapid magnitude determination from peak amplitudes at local stations Akio Katsumata 1, Hiroshi Ueno 1, Shigeki Aoki 1, Yasuhiro Yoshida 2, and Sergio Barrientos 3
Geophysical Research Letters. Supporting Information for
 Geophysical Research Letters Supporting Information for A P-wave based, on-site method for earthquake early warning S. Colombelli(1), A. Caruso(1), A. Zollo(1), G. Festa(1) and H. Kanamori(2) (1) Department
Dynamic Triggering Semi-Volcanic Tremor in Japanese Volcanic Region by The 2016 Mw 7.0 Kumamoto Earthquake
 Dynamic Triggering Semi-Volcanic Tremor in Japanese Volcanic Region by The 016 Mw 7.0 Kumamoto Earthquake Heng-Yi Su 1 *, Aitaro Kato 1 Department of Earth Sciences, National Central University, Taoyuan
Did a submarine landslide contribute to the 2011 Tohoku tsunami?
 Press Release Did a submarine landslide contribute to the 2011 Tohoku tsunami? 1. Key points Large tsunami amplitudes in Northern Tohoku (Sanriku) suggest that a secondary tsunami source lies offshore
Moment tensor inversion of near source seismograms
 Moment tensor inversion of near source seismograms Yuji Yagi and Naoki Nishimura ABSTRACT We construct a program set for estimating moment tensor solution using near source seismograms. We take the effect
ACCOUNTING FOR SITE EFFECTS IN PROBABILISTIC SEISMIC HAZARD ANALYSIS: OVERVIEW OF THE SCEC PHASE III REPORT
 ACCOUNTING FOR SITE EFFECTS IN PROBABILISTIC SEISMIC HAZARD ANALYSIS: OVERVIEW OF THE SCEC PHASE III REPORT Edward H FIELD 1 And SCEC PHASE III WORKING GROUP 2 SUMMARY Probabilistic seismic hazard analysis
Dynamic Stress Drop of Recent Earthquakes: Variations within Subduction Zones
 Pure appl. geophys. 154 (1999) 409 431 0033 4553/99/040409 23 $ 1.50+0.20/0 Dynamic Stress Drop of Recent Earthquakes: Variations within Subduction Zones LARRY J. RUFF 1 Abstract Stress drop is a fundamental
Determining the Earthquake Epicenter: Japan
 Practice Name: Hour: Determining the Earthquake Epicenter: Japan Measuring the S-P interval There are hundreds of seismic data recording stations throughout the United States and the rest of the world.
[S06 ] Shear Wave Resonances in Sediments on the Deep Sea Floor
![[S06 ] Shear Wave Resonances in Sediments on the Deep Sea Floor](/thumbs/82/85496146.jpg "[S06 ] Shear Wave Resonances in Sediments on the Deep Sea Floor") page 1 of 16 [S06 ] Shear Wave Resonances in Sediments on the Deep Sea Floor I. Zeldenrust * and R. A. Stephen ** * Department of Geology Free University, Amsterdam ** Department of Geology and Geophysics
page 1 of 16 [S06 ] Shear Wave Resonances in Sediments on the Deep Sea Floor I. Zeldenrust * and R. A. Stephen ** * Department of Geology Free University, Amsterdam ** Department of Geology and Geophysics
CHARACTERIZING EARTHQUAKE SLIP MODELS FOR THE PREDICTION OF STRONG GROUND MOTION
 CHARACTERIZING EARTHQUAKE SLIP MODELS FOR THE PREDICTION OF STRONG GROUND MOTION P G SOMERVILLE 1, K IRIKURA, N ABRAHAMSON 3, S SAWADA 4, T KAGAWA 5 And Y TATSUMI 6 SUMMARY Over the past fifteen years,
JCR (2 ), JGR- (1 ) (4 ) 11, EPSL GRL BSSA
, JGR- (1 ) (4 ) 11, EPSL GRL BSSA") Dun Wang ( ) In collaboration with: Hitoshi Kawakatsu, Jim Mori, Kazuki Koketsu, Takuto Maeda, Hiroshi Tsuroka, Jiancang Zhunag, Lihua Fang, and Qiang Yao School of Geosciences, China University of Geosciences
Dun Wang ( ) In collaboration with: Hitoshi Kawakatsu, Jim Mori, Kazuki Koketsu, Takuto Maeda, Hiroshi Tsuroka, Jiancang Zhunag, Lihua Fang, and Qiang Yao School of Geosciences, China University of Geosciences
Fault Length and Direction of Rupture Propagation for the 1993 Kushiro-Oki Earthquake as Derived from Strong Motion Duration
 Letter J. Phys. Earth, 41, 319-325, 1993 Fault Length and Direction of Rupture Propagation for the 1993 Kushiro-Oki Earthquake as Derived from Strong Motion Duration Yasuo Izutani Faculty of Engineering,
Magnitude 8.2 NORTHWEST OF IQUIQUE, CHILE
 An 8.2-magnitude earthquake struck off the coast of northern Chile, generating a local tsunami. The USGS reported the earthquake was centered 95 km (59 miles) northwest of Iquique at a depth of 20.1km
Contents of this file
 Geophysical Research Letters Supporting Information for Coseismic radiation and stress drop during the 2015 Mw 8.3 Illapel, Chile megathrust earthquake Jiuxun Yin 1,2, Hongfeng Yang 2*, Huajian Yao 1,3*
Real time Monitoring System for Earthquakes and Tsunamis (DONET)
") Real time Monitoring System for Earthquakes and Tsunamis (DONET) NankaiTrough Yoshiyuki Kaneda Japan Agency for Marine-Earth Science and Technology (JAMSTEC) POGO@Seoul Presentation 1 Earthquakes in the
Real time Monitoring System for Earthquakes and Tsunamis (DONET) NankaiTrough Yoshiyuki Kaneda Japan Agency for Marine-Earth Science and Technology (JAMSTEC) POGO@Seoul Presentation 1 Earthquakes in the
Depth-dependent slip regime on the plate interface revealed from slow earthquake activities in the Nankai subduction zone
 2010/10/11-14 Earthscope Workshop Depth-dependent slip regime on the plate interface revealed from slow earthquake activities in the Nankai subduction zone Kazushige Obara, ERI, Univ. Tokyo Recurrence
Tomographic imaging of P wave velocity structure beneath the region around Beijing
 403 Doi: 10.1007/s11589-009-0403-9 Tomographic imaging of P wave velocity structure beneath the region around Beijing Zhifeng Ding Xiaofeng Zhou Yan Wu Guiyin Li and Hong Zhang Institute of Geophysics,
Centroid moment-tensor analysis of the 2011 Tohoku earthquake. and its larger foreshocks and aftershocks
 Earth Planets Space, 99, 1 8, 2011 Centroid moment-tensor analysis of the 2011 Tohoku earthquake and its larger foreshocks and aftershocks Meredith Nettles, Göran Ekström, and Howard C. Koss Lamont-Doherty
Earthquakes Earth, 9th edition, Chapter 11 Key Concepts What is an earthquake? Earthquake focus and epicenter What is an earthquake?
 1 2 3 4 5 6 7 8 9 10 Earthquakes Earth, 9 th edition, Chapter 11 Key Concepts Earthquake basics. "" and locating earthquakes.. Destruction resulting from earthquakes. Predicting earthquakes. Earthquakes
Seismogeodesy for rapid earthquake and tsunami characterization
 Seismogeodesy for rapid earthquake and tsunami characterization Yehuda Bock Scripps Orbit and Permanent Array Center Scripps Institution of Oceanography READI & NOAA-NASA Tsunami Early Warning Projects
Possible large near-trench slip during the 2011 M w 9.0 off the Pacific coast of Tohoku Earthquake
 LETTER Earth Planets Space, 63, 687 692, 2011 Possible large near-trench slip during the 2011 M w 9.0 off the Pacific coast of Tohoku Earthquake Thorne Lay 1, Charles J. Ammon 2, Hiroo Kanamori 3, Lian
SOURCE PROCESS OF THE 2003 PUERTO PLATA EARTHQUAKE USING TELESEISMIC DATA AND STRONG GROUND MOTION SIMULATION
 Synopses of Master Papers Bulletin of IISEE, 47, 19-24, 2013 SOURCE PROCESS OF THE 2003 PUERTO PLATA EARTHQUAKE USING TELESEISMIC DATA AND STRONG GROUND MOTION SIMULATION Fabricio Moquete Everth* Supervisor:
SOURCE MODELING OF RECENT LARGE INLAND CRUSTAL EARTHQUAKES IN JAPAN AND SOURCE CHARACTERIZATION FOR STRONG MOTION PREDICTION
 SOURCE MODELING OF RECENT LARGE INLAND CRUSTAL EARTHQUAKES IN JAPAN AND SOURCE CHARACTERIZATION FOR STRONG MOTION PREDICTION Kimiyuki Asano 1 and Tomotaka Iwata 2 1 Assistant Professor, Disaster Prevention
Mechanics of Earthquakes and Faulting
 Mechanics of Earthquakes and Faulting Lecture 18, 16 Nov. 2017 www.geosc.psu.edu/courses/geosc508 Earthquake Magnitude and Moment Brune Stress Drop Seismic Spectra & Earthquake Scaling laws Scaling and
Earthquakes. Forces Within Eartth. Faults form when the forces acting on rock exceed the rock s strength.
 Earthquakes Vocabulary: Stress Strain Elastic Deformation Plastic Deformation Fault Seismic Wave Primary Wave Secondary Wave Focus Epicenter Define stress and strain as they apply to rocks. Distinguish
Three Fs of earthquakes: forces, faults, and friction. Slow accumulation and rapid release of elastic energy.
 Earthquake Machine Stick-slip: Elastic Rebound Theory Jerky motions on faults produce EQs Three Fs of earthquakes: forces, faults, and friction. Slow accumulation and rapid release of elastic energy. Three
RELATION BETWEEN RAYLEIGH WAVES AND UPLIFT OF THE SEABED DUE TO SEISMIC FAULTING
 13 th World Conference on Earthquake Engineering Vancouver, B.C., Canada August 1-6, 24 Paper No. 1359 RELATION BETWEEN RAYLEIGH WAVES AND UPLIFT OF THE SEABED DUE TO SEISMIC FAULTING Shusaku INOUE 1,
Scaling of apparent stress from broadband radiated energy catalogue and seismic moment catalogue and its focal mechanism dependence
 Earth Planets Space, 53, 943 948, 2001 Scaling of apparent stress from broadband radiated energy catalogue and seismic moment catalogue and its focal mechanism dependence Z. L. Wu Institute of Geophysics,
Sendai Earthquake NE Japan March 11, Some explanatory slides Bob Stern, Dave Scholl, others updated March
 Sendai Earthquake NE Japan March 11, 2011 Some explanatory slides Bob Stern, Dave Scholl, others updated March 14 2011 Earth has 11 large plates and many more smaller ones. Plates are 100-200 km thick
LETTER Earth Planets Space, 56, , 2004
 LETTER Earth Planets Space, 56, 353 357, 2004 Deep seismic activities preceding the three large shallow earthquakes off south-east Hokkaido, Japan the 2003 Tokachi-oki earthquake, the 1993 Kushiro-oki
The Cascading Hazards from Cascadia s Earthquakes
 Tsunamis The Cascading Hazards from Cascadia s Earthquakes Earthquakes (Nisqually earthquake, Seattle, WA) Volcanoes (Mt St Helens eruption, WA) Joan Gomberg gomberg@usgs.gov Landslides (Oso landslide,
Synthetic sensitivity analysis of high frequency radiation of 2011 Tohoku-Oki (M W 9.0) earthquake
 earthquake") Earthq Sci (214) 27(4):355 364 DOI 1.17/s11589-14-88-6 RESEARCH PAPER Synthetic sensitivity analysis of high frequency radiation of 211 Tohoku-Oki (M W 9.) earthquake Haoran Meng Yongshun John Chen Received:
Earthq Sci (214) 27(4):355 364 DOI 1.17/s11589-14-88-6 RESEARCH PAPER Synthetic sensitivity analysis of high frequency radiation of 211 Tohoku-Oki (M W 9.) earthquake Haoran Meng Yongshun John Chen Received:
High-precision location of North Korea s 2009 nuclear test
 Copyright, Seismological Research Letters, Seismological Society of America 1 High-precision location of North Korea s 2009 nuclear test Lianxing Wen & Hui Long Department of Geosciences State University
Calculation of Focal mechanism for Composite Microseismic Events
 Calculation of Focal mechanism for Composite Microseismic Events Hongliang Zhang, David W. Eaton Department of Geoscience, University of Calgary Summary It is often difficult to obtain a reliable single-event
I. Locations of Earthquakes. Announcements. Earthquakes Ch. 5. video Northridge, California earthquake, lecture on Chapter 5 Earthquakes!
 51-100-21 Environmental Geology Summer 2006 Tuesday & Thursday 6-9:20 p.m. Dr. Beyer Earthquakes Ch. 5 I. Locations of Earthquakes II. Earthquake Processes III. Effects of Earthquakes IV. Earthquake Risk
Deterministic and Non-deterministic Behavior of Earthquakes and Hazard Mitigation Strategy
 Deterministic and Non-deterministic Behavior of Earthquakes and Hazard Mitigation Strategy Hiroo Kanamori Seismological Laboratory, California Institute of Technology Earthquake Process Deterministic Non-deterministic
EQ Monitoring and Hazards NOTES.notebook. January 07, P-wave. S-wave. surface waves. distance
 Earthquake Monitoring and Hazards Reading a Seismogram General guidelines: P-wave First disruption of trace = Second disruption of trace = surface waves Largest disruption of trace = Not the distance to
Scattering and intrinsic attenuation structure in Central Anatolia, Turkey using BRTR (PS-43) array
 array") Scattering and intrinsic attenuation structure in Central Anatolia, Turkey using BRTR (PS-43) array CTBT: Science & Technology 2011 Korhan Umut SEMIN Nurcan Meral OZEL B.U. Kandilli Observatory & Earthquake
Scattering and intrinsic attenuation structure in Central Anatolia, Turkey using BRTR (PS-43) array CTBT: Science & Technology 2011 Korhan Umut SEMIN Nurcan Meral OZEL B.U. Kandilli Observatory & Earthquake
crustal structure experiment beneath Wairarapa - Wellington area: results from SAHKE
 crustal structure experiment beneath Wairarapa - Wellington area: results from SAHKE Tim Stern and SAHKE team* * VUW, GNS, University of Southern California, University of Tokyo(Japan) SAHKE = Seismic
volcanic tremor and Low frequency earthquakes at mt. vesuvius M. La Rocca 1, D. Galluzzo 2 1
 volcanic tremor and Low frequency earthquakes at mt. vesuvius M. La Rocca 1, D. Galluzzo 2 1 Università della Calabria, Cosenza, Italy 2 Istituto Nazionale di Geofisica e Vulcanologia Osservatorio Vesuviano,
Earthquake Engineering GE / CE - 479/679
 Earthquake Engineering GE / CE - 479/679 Topic 4. Seismometry John G. Anderson Director February 4-6, 2003 1 Wood-Anderson Seismograph Important because: Principles of operation are widely used. Basis
Seismic Activity and Crustal Deformation after the 2011 Off the Pacific Coast of Tohoku Earthquake
 J-RAPID Symposium March 6-7, 2013 Seismic Activity and Crustal Deformation after the 2011 Off the Pacific Coast of Tohoku Earthquake Y. Honkura Tokyo Institute of Technology Japan Science and Technology
Simulation of earthquake rupture process and strong ground motion
 Simulation of earthquake rupture process and strong ground motion Takashi Miyatake (1) and Tomohiro Inoue (2) (1) Earthquake Research Institute, University of Tokyo, Yayoi, Bunkyo, Tokyo, 113-0032, Japan
Effects of Surface Geology on Seismic Motion
 4 th IASPEI / IAEE International Symposium: Effects of Surface Geology on Seismic Motion August 23 26, 2011 University of California Santa Barbara LONG-PERIOD (3 TO 10 S) GROUND MOTIONS IN AND AROUND THE
THEORETICAL EVALUATION OF EFFECTS OF SEA ON SEISMIC GROUND MOTION
 13 th World Conference on Earthquake Engineering Vancouver, B.C., Canada August 1-6, 2004 Paper No. 3229 THEORETICAL EVALUATION OF EFFECTS OF SEA ON SEISMIC GROUND MOTION Ken HATAYAMA 1 SUMMARY I evaluated
RECIPE FOR PREDICTING STRONG GROUND MOTIONS FROM FUTURE LARGE INTRASLAB EARTHQUAKES
 RECIPE FOR PREDICTING STRONG GROUND MOTIONS FROM FUTURE LARGE INTRASLAB EARTHQUAKES T. Sasatani 1, S. Noguchi, T. Maeda 3, and N. Morikawa 4 1 Professor, Graduate School of Engineering, Hokkaido University,
REAL-TIME TSUNAMI INUNDATION FORECAST STUDY IN CHIMBOTE CITY, PERU
 REAL-TIME TSUNAMI INUNDATION FORECAST STUDY IN CHIMBOTE CITY, PERU Nabilt Moggiano Supervisor: Kenji SATAKE MEE16720 ABSTRACT For rapid forecast of tsunami inundation during a tsunamigenic event, we constructed
Rupture process of the 2007 Chuetsu-oki, Niigata, Japan, earthquake Waveform inversion using empirical Green s functions
 Earth Planets Space, 60, 1169 1176, 2008 Rupture process of the 2007 Chuetsu-oki, Niigata, Japan, earthquake Waveform inversion using empirical Green s functions Atsushi Nozu Independent Administrative
High-Frequency Ground Motion Simulation Using a Source- and Site-Specific Empirical Green s Function Approach
 High-Frequency Ground Motion Simulation Using a Source- and Site-Specific Empirical Green s Function Approach R. Mourhatch & S. Krishnan California Institute of Technology, Pasadena, CA, USA SUMMARY: A
Seismic Reflection Views of the 1994 Northridge Earthquake Hypocentral Region Using Aftershock Data and Imaging Techniques
 Seismic Reflection Views of the 1994 Northridge Earthquake Hypocentral Region Using Aftershock Data and Imaging Techniques SERGIO CHÁVEZ-PÉREZ and JOHN N. LOUIE SEISMOLOGICAL LABORATORY/174, MACKAY SCHOOL
OVERVIEW INTRODUCTION 3 WHAT'S MISSING? 4 OBJECTIVES 5
 OVERVIEW INTRODUCTION 3 WHAT'S MISSING? 4 OBJECTIVES 5 DISTORTION OF SEISMIC SOURCE SPECTRUM 6 PRINCIPLE 7 SEISMIC SOURCE SPECTRUM 8 EFFECT OF RECORDING INSTRUMENTS 9 SEISMOMETERS 9 CORRECTION FOR FREQUENCY
Three Dimensional Simulations of Tsunami Generation and Propagation
 Chapter 1 Earth Science Three Dimensional Simulations of Tsunami Generation and Propagation Project Representative Takashi Furumura Authors Tatsuhiko Saito Takashi Furumura Earthquake Research Institute,
Figure Diagram of earth movements produced by (a) P-waves and (b) S-waves.
 P-waves and (b) S-waves.") Geology 101 Name(s): Lab 10: Earthquakes When the stresses in a rock (which may or may not already be faulted) exceed the tensile strength of the rock, the rock ruptures at a point called the focus or
Geology 101 Name(s): Lab 10: Earthquakes When the stresses in a rock (which may or may not already be faulted) exceed the tensile strength of the rock, the rock ruptures at a point called the focus or
revised October 30, 2001 Carlos Mendoza
 Earthquake Sources in the circum-caribbean Region Puerto Rico Tsunami Mitigation and Warning Program Federal Emergency Management Agency Preliminary Report: Task 3 revised October 30, 2001 Carlos Mendoza
Characterizing Earthquake Rupture Models for the Prediction of Strong Ground Motion
 Characterizing Earthquake Rupture Models for the Prediction of Strong Ground Motion Paul Somerville URS Corporation, 566 El Dorado Street, Pasadena, CA, 91101, USA Summary The uncertainty in estimates
Comparison of Long-Period Ground Motions in the Kanto Basin during the 2004 Niigata Chuetsu and the 2011 Fukushima Hamado ri Earthquakes
 Comparison of Long-Period Ground Motions in the Kanto Basin during the 2004 and the 2011 Fukushima Hamado ri Earthquakes Yuka Esashi Supervisors: Kazuki Koketsu and Yujia Guo Department of Earth and Planetary
Kinematic Waveform Inversion Study of Regional Earthquakes in Southwest Iberia
 Kinematic Waveform Inversion Study of Regional Earthquakes in Southwest Iberia Ana Domingues Under supervision of Prof. João Fonseca and Dr. Susana Custódio Dep. Physics, IST, Lisbon, Portugal November
EARTHQUAKE CLUSTERS, SMALL EARTHQUAKES
 EARTHQUAKE CLUSTERS, SMALL EARTHQUAKES AND THEIR TREATMENT FOR HAZARD ESTIMATION Gary Gibson and Amy Brown RMIT University, Melbourne Seismology Research Centre, Bundoora AUTHORS Gary Gibson wrote his
UGRC 144 Science and Technology in Our Lives/Geohazards
 UGRC 144 Science and Technology in Our Lives/Geohazards Session 3 Understanding Earthquakes and Earthquake Hazards Lecturer: Dr. Patrick Asamoah Sakyi Department of Earth Science, UG Contact Information: