The Impact of Measurement Error on Propensity Score Analysis: An Empirical Investigation of Fallible Covariates
|
|
|
- Deborah Hancock
- 5 years ago
- Views:
Transcription
1 The Impact of Measurement Error on Propensity Score Analysis: An Empirical Investigation of Fallible Covariates Eun Sook Kim, Patricia Rodríguez de Gil, Jeffrey D. Kromrey, Rheta E. Lanehart, Aarti Bellara, Reginald S. Lee Modern Modeling Methods Conference, May 21st, 2013, Windsor Locks, CT
2 Introduction Background Purpose Method Results Common Support Balance Bias RMSE Type I error CI coverage and width Conclusions Further research Presentation Outline 2
3 Introduction Rubin s Causal Model (RCM) T i =Y 1i Y 0i T i = treatment effect for individual i Y 1i = potential outcome for treatment Y 0i = potential outcome for control Fundamental Problem of Causal Inference Solution to estimate causality T = E(Y 1i Z i = 1) E(Y 0i Z i = 0) where (Y 1 and Y 0 ) Z Assumptions Strongly ignorable treatment assignment Stable unit treatment value assumption (SUTVA) 3
4 Propensity Score Methods (PSM) Propensity Score (PS): Estimate of an individual s probability for being assigned to treatment group logit ( Z 1) log 1 ˆ where p is the number of predictors Use the estimated propensity score to condition treatment and control groups Caliper Matching Matching without caliper Stratification Covariance Adjustment PS Weighting ˆ 0 p i 1 ix i 4
5 Researcher s Decisions Covariate Selection PS Estimation Evaluate Common Support Trimming Samples Conditioning Methods Balance Properties Outcome Model 5
6 Covariate Selection Model specification error Relation of covariates to outcome Relation of covariates to treatment assignment Brookhart et al., 2006; Rubin & Thomas, 1996; Rubin, 1997 Measurement errors in covariates Deleterious effect of measurement error on PS analysis Bellara et al., 2013; Steiner, Cook, & Shadish,
7 Background: Previous Research Bias in Point Estimates by Covariate Reliability 7

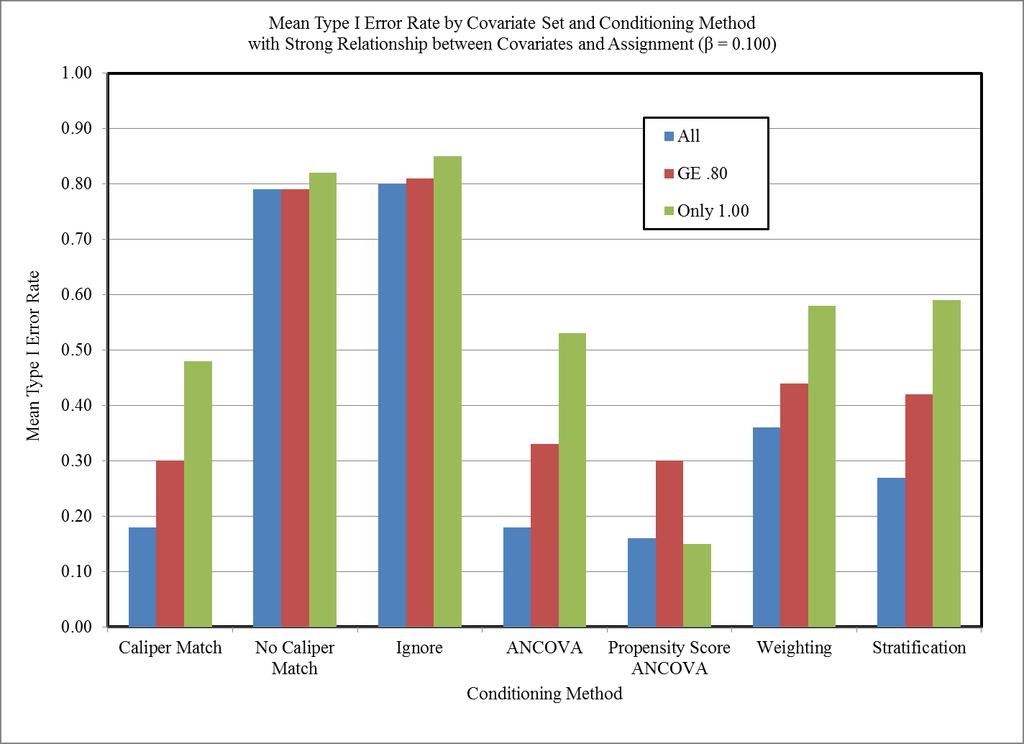
8 Background: Type I Error Rates by Covariate Reliability Type I Error Rates by Covariate Reliability 8

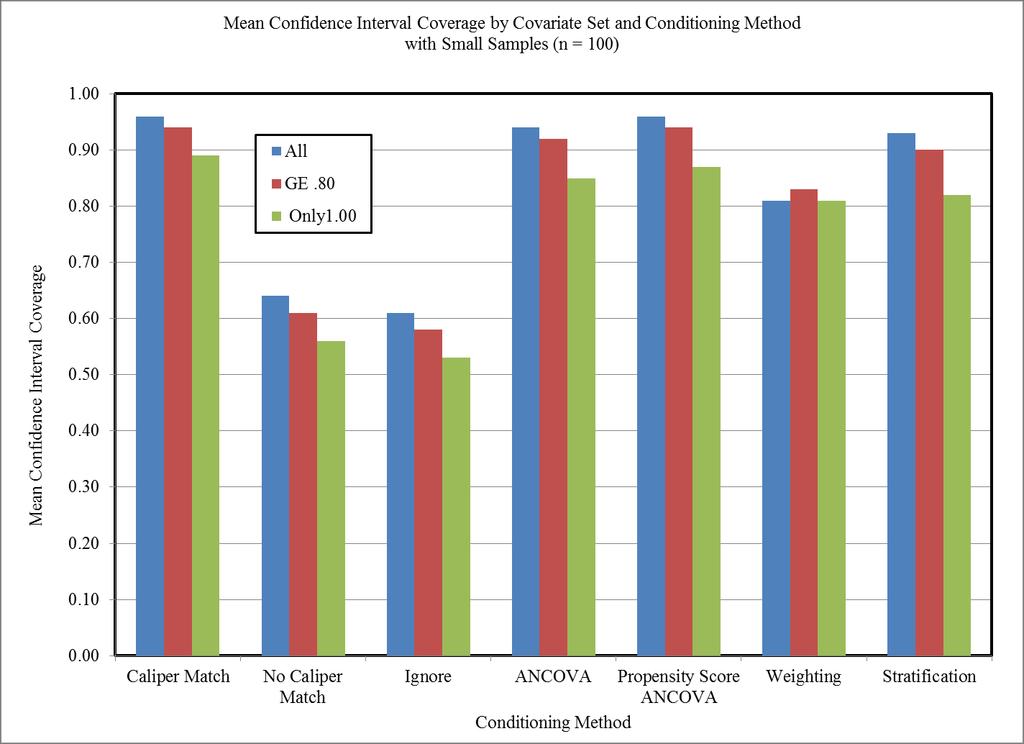
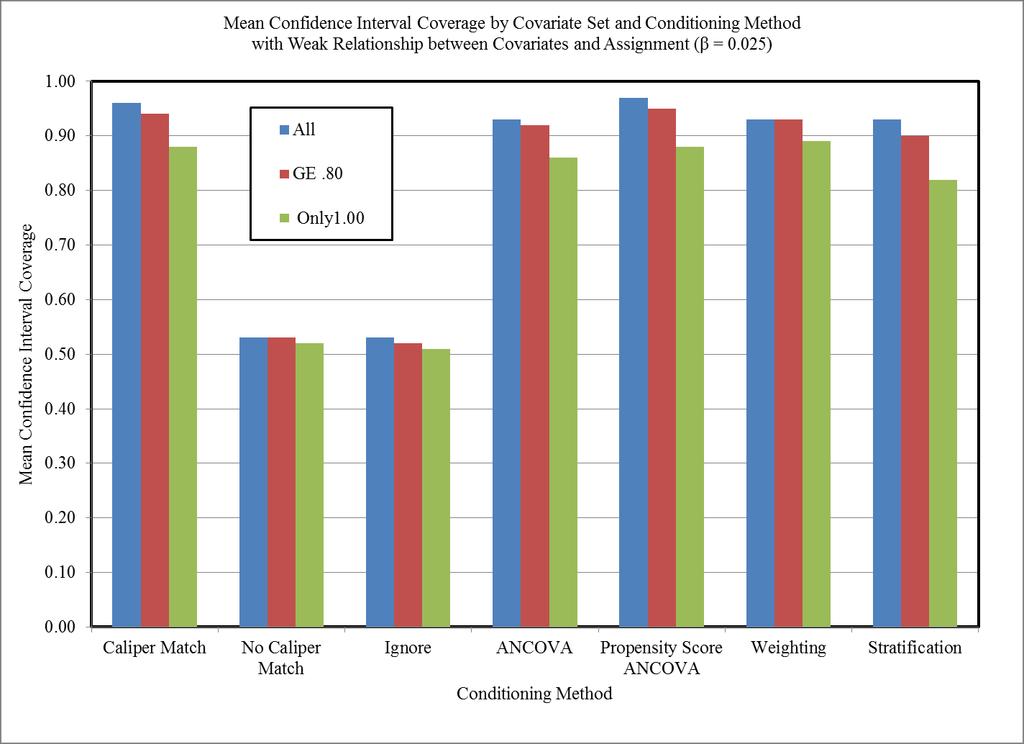
9 Background: CI Coverage by Covariate Reliability CI Coverage by Covariate Reliability 9
10 Purpose of the Study To investigate the effect of covariate selection based on measurement quality on the balance and the estimation of the treatment effect in PS analysis When the covariates in a sample have various levels of measurement error Select a full set or a subset of reliable covariates To provide guidelines in selecting covariates that could reduce selection bias more efficiently in the presence of measurement errors 10

11 Method Simulation study Fully crossed factorial mixed design with 6 between-subjects factors and 3 within-subject factors Between Number of covariates Population treatment effect Covariate relationship to treatment Covariate relationship to outcome Correlation among covariates Sample size Within PS conditioning methods Covariate selection Trimming 2160 conditions x 7 conditioning methods x 3 covariate sets x 2 trimming 5000 replications SAS IML Procedure 11
12 Method Design factors in data generation Between-subject factors: Number of covariates 9, 18, 27 Population Treatment effect 0.0, 0.2, 0.5, 0.8 Covariate relationship to treatment assignment 0.025, 0.050, Covariate relationship to outcome 0.025, 0.050, Correlation among covariates 0,.2,.5 Sample Size 50, 100, 250, 500,
13 Method Within-Subjects Factor PS conditioning methods Ignoring Covariates Matching without caliper one-to-one matching Matching with caliper Caliper width =.25 SD of PS ANCOVA PS ANCOVA PS Weighting Inverse probability of treatment weights Stratification Quintile 13
14 Within-Subject Factor: Covariate selection Method Three levels of reliability in equal proportions in a single sample.6,.8, 1.0 Covariate selection A full set Covariates with high reliability (.8) Covariates with perfect reliability only (1.0 only) 14
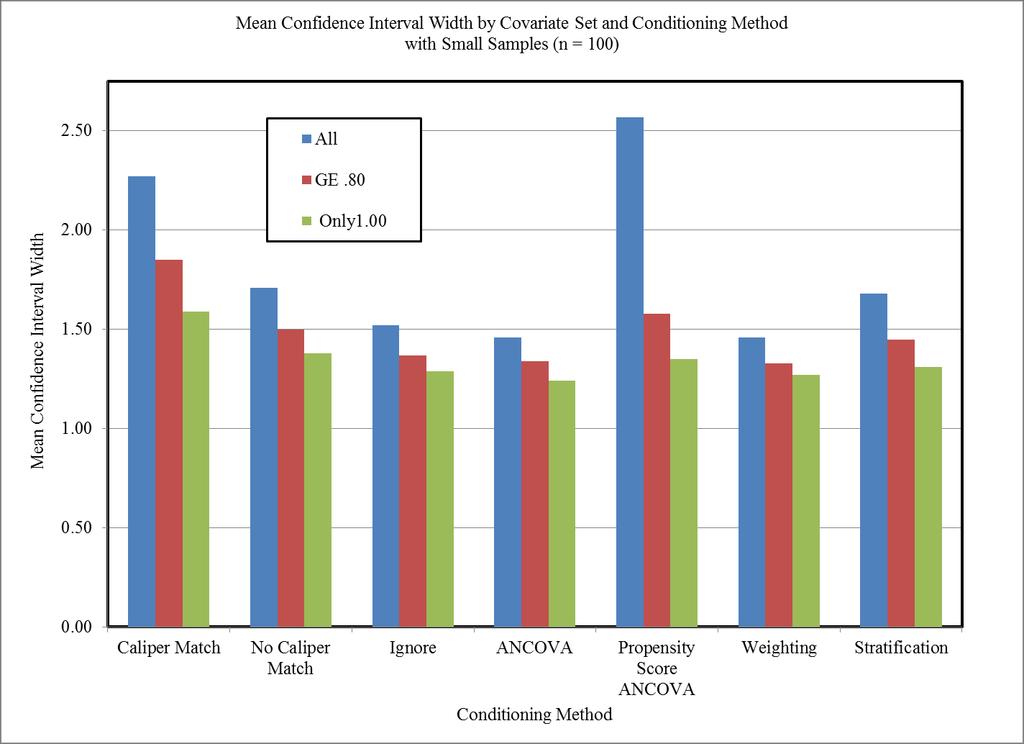
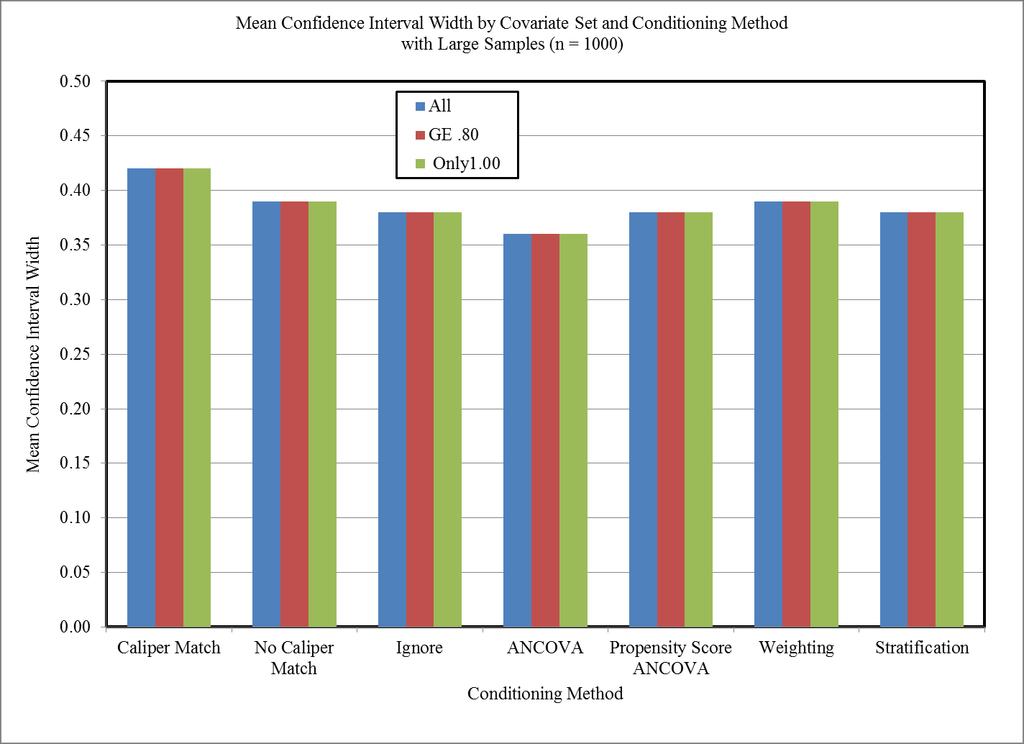
15 Results Common Support Balance Bias RMSE Type I error CI Coverage CI Width 15

16 Common Support Coverage By Sample Size and Covariate Set 16

17 Common Support Coverage by Correlation among Covariates and Covariate Set 17

18 Common Support Coverage by Covariate Relation to Outcome and Covariate Set 18

19 Common Support Coverage by Covariate Relation to Treatment Assignment and Covariate Set 19

20 Common Support Coverage by Number of Covariates And Covariate Set 20
21 Distribution of Balance of Binary Covariate 21
22 Distribution of Balance of Binary Covariate When N >
23 Distribution of Balance of Continuous Covariate When N >
24 Distribution of Balance of Binary Covariates By Covariate Set When N >
25 Balance of Binary Covariates by Covariate Set and Conditioning Method with No Correlation Among Covariates (r = 0.0) 25
26 Balance of Binary Covariates by Covariate Set and Conditioning Method with High Correlation Among Covariates (r = 0.5) 26
27 Bias Distribution of Bias Cmatch NoCmatch Ignore Ancova PS_Ancova Weighting Stratify Conditioning Method 27
28 Bias Distribution of Bias when N> 100 Caliper match NoCaliper Ignore Ancova PS_Ancova Weighting Stratify Match Conditioning Method 28
29 Distribution of Bias by Covariate Sets when N>
30 30
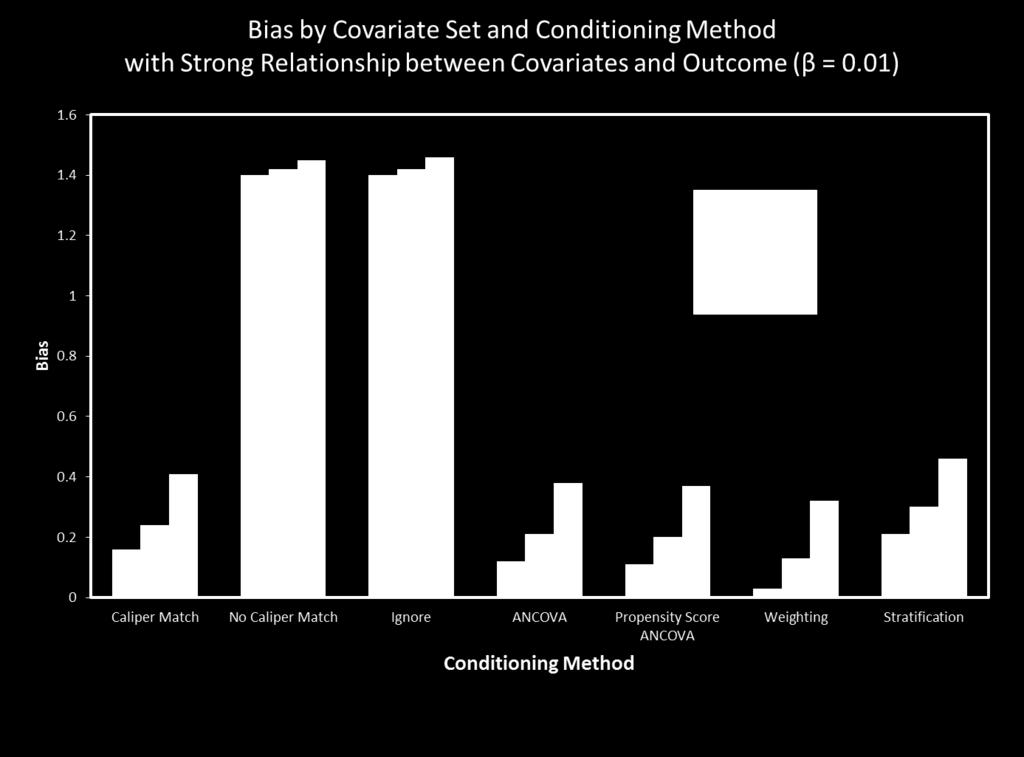
31 31
32 RMSE Mean Distribution by Method 32
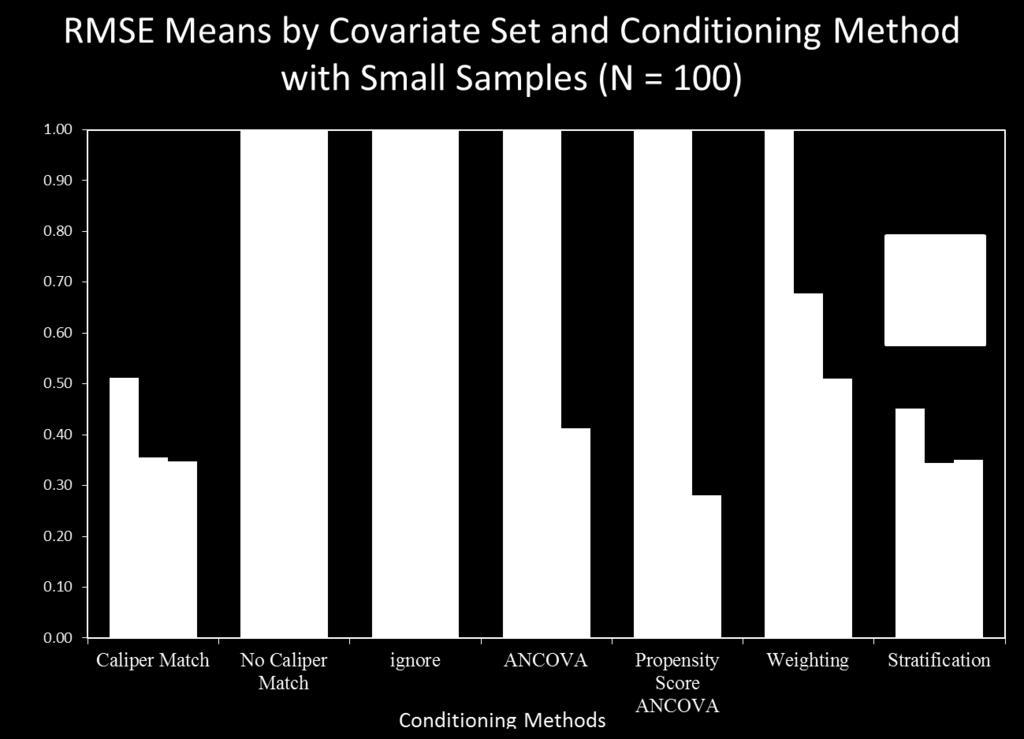
33 RMSE 33
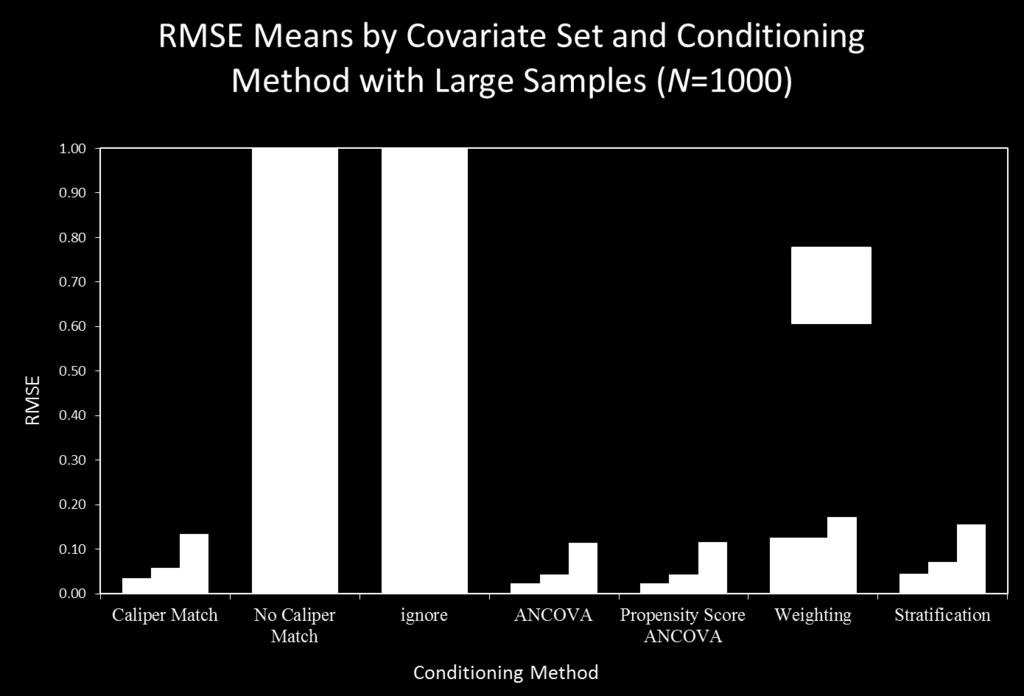
34 RMSE 34
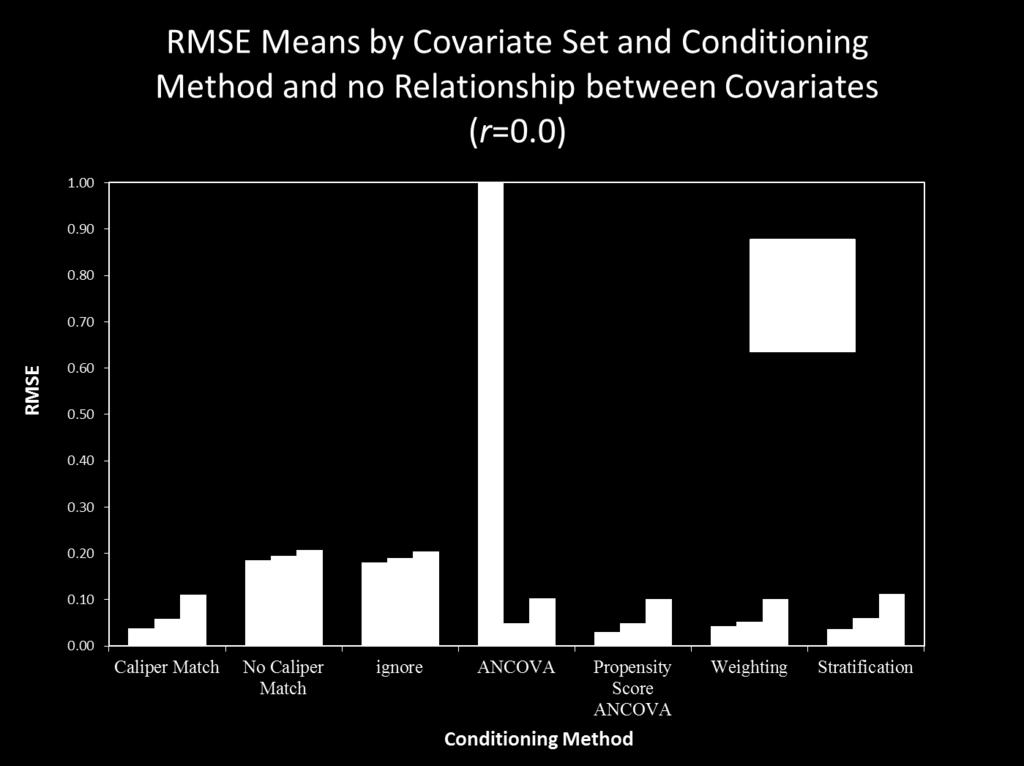
35 RMSE 35

36 RMSE 36
37 37

38 38
39 39
40 40

41 41
42 42

43 43
44 44
45 45
46 46

47 47
48 48
49 49
50 50
51 51
52 Conclusions Model specification error made deleterious effects on propensity score analysis Consistent across conditioning methods Observed in most of outcome variables (e.g., bias, Type I error) More serious as more covariates are omitted 52
53 Conclusions When there are covariates with different levels of reliability in a single sample, omitting covariates with poor measurement quality is not recommended More cautious when the covariates are highly related to outcome More cautious when the covariates are highly related to treatment assignment More cautious when sample size is large The degree depends on conditioning methods (e.g., less impact on PS ANCOVA) and also on the simulation study outcomes (e.g., negligible effect on balance)
54 Further Research Errors-in-variables model Explicitly model measurement errors in propensity score estimation using the errors-in-variables logistic model rather than omitting covariates with measurement error Propensity score analysis with binary outcome The impact of measurement error and model specification error on the estimation of binary outcomes The effect of misspecification of functional forms in propensity score estimation 54
55 Contact Information Your comments and questions are valued and encouraged. Contact the author at: Eun Sook Kim, Ph. D. Department of Educational Measurement and Research University of South Florida 4202 E. Fowler Ave. EDU 105 Tampa, FL Office: EDU 369 Phone: (813)
An Empirical Comparison of Multiple Imputation Approaches for Treating Missing Data in Observational Studies
 Paper 177-2015 An Empirical Comparison of Multiple Imputation Approaches for Treating Missing Data in Observational Studies Yan Wang, Seang-Hwane Joo, Patricia Rodríguez de Gil, Jeffrey D. Kromrey, Rheta
Propensity Score Methods for Causal Inference
 John Pura BIOS790 October 2, 2015 Causal inference Philosophical problem, statistical solution Important in various disciplines (e.g. Koch s postulates, Bradford Hill criteria, Granger causality) Good
Controlling for latent confounding by confirmatory factor analysis (CFA) Blinded Blinded
 Blinded Blinded") Controlling for latent confounding by confirmatory factor analysis (CFA) Blinded Blinded 1 Background Latent confounder is common in social and behavioral science in which most of cases the selection mechanism
Controlling for latent confounding by confirmatory factor analysis (CFA) Blinded Blinded 1 Background Latent confounder is common in social and behavioral science in which most of cases the selection mechanism
Analysis of propensity score approaches in difference-in-differences designs
 Author: Diego A. Luna Bazaldua Institution: Lynch School of Education, Boston College Contact email: diego.lunabazaldua@bc.edu Conference section: Research methods Analysis of propensity score approaches
Selection on Observables: Propensity Score Matching.
 Selection on Observables: Propensity Score Matching. Department of Economics and Management Irene Brunetti ireneb@ec.unipi.it 24/10/2017 I. Brunetti Labour Economics in an European Perspective 24/10/2017
Estimating the Marginal Odds Ratio in Observational Studies
 Estimating the Marginal Odds Ratio in Observational Studies Travis Loux Christiana Drake Department of Statistics University of California, Davis June 20, 2011 Outline The Counterfactual Model Odds Ratios
Authors and Affiliations: Nianbo Dong University of Missouri 14 Hill Hall, Columbia, MO Phone: (573)
") Prognostic Propensity Scores: A Method Accounting for the Correlations of the Covariates with Both the Treatment and the Outcome Variables in Matching and Diagnostics Authors and Affiliations: Nianbo Dong
Prognostic Propensity Scores: A Method Accounting for the Correlations of the Covariates with Both the Treatment and the Outcome Variables in Matching and Diagnostics Authors and Affiliations: Nianbo Dong
Matching. Quiz 2. Matching. Quiz 2. Exact Matching. Estimand 2/25/14
 STA 320 Design and Analysis of Causal Studies Dr. Kari Lock Morgan and Dr. Fan Li Department of Statistical Science Duke University Frequency 0 2 4 6 8 Quiz 2 Histogram of Quiz2 10 12 14 16 18 20 Quiz2
Propensity Score Weighting with Multilevel Data
 Propensity Score Weighting with Multilevel Data Fan Li Department of Statistical Science Duke University October 25, 2012 Joint work with Alan Zaslavsky and Mary Beth Landrum Introduction In comparative
Covariate Balancing Propensity Score for General Treatment Regimes
 Covariate Balancing Propensity Score for General Treatment Regimes Kosuke Imai Princeton University October 14, 2014 Talk at the Department of Psychiatry, Columbia University Joint work with Christian
Weighting Methods. Harvard University STAT186/GOV2002 CAUSAL INFERENCE. Fall Kosuke Imai
 Weighting Methods Kosuke Imai Harvard University STAT186/GOV2002 CAUSAL INFERENCE Fall 2018 Kosuke Imai (Harvard) Weighting Methods Stat186/Gov2002 Fall 2018 1 / 13 Motivation Matching methods for improving
An Introduction to Causal Analysis on Observational Data using Propensity Scores
 An Introduction to Causal Analysis on Observational Data using Propensity Scores Margie Rosenberg*, PhD, FSA Brian Hartman**, PhD, ASA Shannon Lane* *University of Wisconsin Madison **University of Connecticut
Propensity Score Analysis with Hierarchical Data
 Propensity Score Analysis with Hierarchical Data Fan Li Alan Zaslavsky Mary Beth Landrum Department of Health Care Policy Harvard Medical School May 19, 2008 Introduction Population-based observational
Causal Inference with a Continuous Treatment and Outcome: Alternative Estimators for Parametric Dose-Response Functions
 Causal Inference with a Continuous Treatment and Outcome: Alternative Estimators for Parametric Dose-Response Functions Joe Schafer Office of the Associate Director for Research and Methodology U.S. Census
Causal Inference Basics
 Causal Inference Basics Sam Lendle October 09, 2013 Observed data, question, counterfactuals Observed data: n i.i.d copies of baseline covariates W, treatment A {0, 1}, and outcome Y. O i = (W i, A i,
(Mis)use of matching techniques
use of matching techniques") University of Warsaw 5th Polish Stata Users Meeting, Warsaw, 27th November 2017 Research financed under National Science Center, Poland grant 2015/19/B/HS4/03231 Outline Introduction and motivation 1 Introduction
University of Warsaw 5th Polish Stata Users Meeting, Warsaw, 27th November 2017 Research financed under National Science Center, Poland grant 2015/19/B/HS4/03231 Outline Introduction and motivation 1 Introduction
DATA-ADAPTIVE VARIABLE SELECTION FOR
 DATA-ADAPTIVE VARIABLE SELECTION FOR CAUSAL INFERENCE Group Health Research Institute Department of Biostatistics, University of Washington shortreed.s@ghc.org joint work with Ashkan Ertefaie Department
Weighting. Homework 2. Regression. Regression. Decisions Matching: Weighting (0) W i. (1) -å l i. )Y i. (1-W i 3/5/2014. (1) = Y i.
 W i. (1) -å l i. )Y i. (1-W i 3/5/2014. (1) = Y i.") Weighting Unconfounded Homework 2 Describe imbalance direction matters STA 320 Design and Analysis of Causal Studies Dr. Kari Lock Morgan and Dr. Fan Li Department of Statistical Science Duke University
Weighting Unconfounded Homework 2 Describe imbalance direction matters STA 320 Design and Analysis of Causal Studies Dr. Kari Lock Morgan and Dr. Fan Li Department of Statistical Science Duke University
Controlling for overlap in matching
 Working Papers No. 10/2013 (95) PAWEŁ STRAWIŃSKI Controlling for overlap in matching Warsaw 2013 Controlling for overlap in matching PAWEŁ STRAWIŃSKI Faculty of Economic Sciences, University of Warsaw
Propensity Score Matching and Analysis TEXAS EVALUATION NETWORK INSTITUTE AUSTIN, TX NOVEMBER 9, 2018
 Propensity Score Matching and Analysis TEXAS EVALUATION NETWORK INSTITUTE AUSTIN, TX NOVEMBER 9, 2018 Schedule and outline 1:00 Introduction and overview 1:15 Quasi-experimental vs. experimental designs
Bayesian regression tree models for causal inference: regularization, confounding and heterogeneity
 Bayesian regression tree models for causal inference: regularization, confounding and heterogeneity P. Richard Hahn, Jared Murray, and Carlos Carvalho June 22, 2017 The problem setting We want to estimate
Measuring Social Influence Without Bias
 Measuring Social Influence Without Bias Annie Franco Bobbie NJ Macdonald December 9, 2015 The Problem CS224W: Final Paper How well can statistical models disentangle the effects of social influence from
University of Michigan School of Public Health
 University of Michigan School of Public Health The University of Michigan Department of Biostatistics Working Paper Series Year 003 Paper Weighting Adustments for Unit Nonresponse with Multiple Outcome
Primal-dual Covariate Balance and Minimal Double Robustness via Entropy Balancing
 Primal-dual Covariate Balance and Minimal Double Robustness via (Joint work with Daniel Percival) Department of Statistics, Stanford University JSM, August 9, 2015 Outline 1 2 3 1/18 Setting Rubin s causal
Vector-Based Kernel Weighting: A Simple Estimator for Improving Precision and Bias of Average Treatment Effects in Multiple Treatment Settings
 Vector-Based Kernel Weighting: A Simple Estimator for Improving Precision and Bias of Average Treatment Effects in Multiple Treatment Settings Jessica Lum, MA 1 Steven Pizer, PhD 1, 2 Melissa Garrido,
Methods for inferring short- and long-term effects of exposures on outcomes, using longitudinal data on both measures
 Methods for inferring short- and long-term effects of exposures on outcomes, using longitudinal data on both measures Ruth Keogh, Stijn Vansteelandt, Rhian Daniel Department of Medical Statistics London
Data Integration for Big Data Analysis for finite population inference
 for Big Data Analysis for finite population inference Jae-kwang Kim ISU January 23, 2018 1 / 36 What is big data? 2 / 36 Data do not speak for themselves Knowledge Reproducibility Information Intepretation
Balancing Covariates via Propensity Score Weighting: The Overlap Weights
 Balancing Covariates via Propensity Score Weighting: The Overlap Weights Kari Lock Morgan Department of Statistics Penn State University klm47@psu.edu PSU Methodology Center Brown Bag April 6th, 2017 Joint
Balancing Covariates via Propensity Score Weighting
 Balancing Covariates via Propensity Score Weighting Kari Lock Morgan Department of Statistics Penn State University klm47@psu.edu Stochastic Modeling and Computational Statistics Seminar October 17, 2014
OUTCOME REGRESSION AND PROPENSITY SCORES (CHAPTER 15) BIOS Outcome regressions and propensity scores
 BIOS Outcome regressions and propensity scores") OUTCOME REGRESSION AND PROPENSITY SCORES (CHAPTER 15) BIOS 776 1 15 Outcome regressions and propensity scores Outcome Regression and Propensity Scores ( 15) Outline 15.1 Outcome regression 15.2 Propensity
OUTCOME REGRESSION AND PROPENSITY SCORES (CHAPTER 15) BIOS 776 1 15 Outcome regressions and propensity scores Outcome Regression and Propensity Scores ( 15) Outline 15.1 Outcome regression 15.2 Propensity
Empirical Likelihood Methods for Two-sample Problems with Data Missing-by-Design
 1 / 32 Empirical Likelihood Methods for Two-sample Problems with Data Missing-by-Design Changbao Wu Department of Statistics and Actuarial Science University of Waterloo (Joint work with Min Chen and Mary
Comparing Group Means When Nonresponse Rates Differ
 UNF Digital Commons UNF Theses and Dissertations Student Scholarship 2015 Comparing Group Means When Nonresponse Rates Differ Gabriela M. Stegmann University of North Florida Suggested Citation Stegmann,
arxiv: v1 [stat.me] 15 May 2011
![arxiv: v1 [stat.me] 15 May 2011](/thumbs/76/73230968.jpg "arxiv: v1 [stat.me] 15 May 2011") Working Paper Propensity Score Analysis with Matching Weights Liang Li, Ph.D. arxiv:1105.2917v1 [stat.me] 15 May 2011 Associate Staff of Biostatistics Department of Quantitative Health Sciences, Cleveland
Working Paper Propensity Score Analysis with Matching Weights Liang Li, Ph.D. arxiv:1105.2917v1 [stat.me] 15 May 2011 Associate Staff of Biostatistics Department of Quantitative Health Sciences, Cleveland
Introduction to Econometrics. Assessing Studies Based on Multiple Regression
 Introduction to Econometrics The statistical analysis of economic (and related) data STATS301 Assessing Studies Based on Multiple Regression Titulaire: Christopher Bruffaerts Assistant: Lorenzo Ricci 1
Marginal versus conditional effects: does it make a difference? Mireille Schnitzer, PhD Université de Montréal
 Marginal versus conditional effects: does it make a difference? Mireille Schnitzer, PhD Université de Montréal Overview In observational and experimental studies, the goal may be to estimate the effect
finite-sample optimal estimation and inference on average treatment effects under unconfoundedness
 finite-sample optimal estimation and inference on average treatment effects under unconfoundedness Timothy Armstrong (Yale University) Michal Kolesár (Princeton University) September 2017 Introduction
Causal Inference with General Treatment Regimes: Generalizing the Propensity Score
 Causal Inference with General Treatment Regimes: Generalizing the Propensity Score David van Dyk Department of Statistics, University of California, Irvine vandyk@stat.harvard.edu Joint work with Kosuke
PROPENSITY SCORE MATCHING. Walter Leite
 PROPENSITY SCORE MATCHING Walter Leite 1 EXAMPLE Question: Does having a job that provides or subsidizes child care increate the length that working mothers breastfeed their children? Treatment: Working
Introduction An approximated EM algorithm Simulation studies Discussion
 1 / 33 An Approximated Expectation-Maximization Algorithm for Analysis of Data with Missing Values Gong Tang Department of Biostatistics, GSPH University of Pittsburgh NISS Workshop on Nonignorable Nonresponse
Assess Assumptions and Sensitivity Analysis. Fan Li March 26, 2014
 Assess Assumptions and Sensitivity Analysis Fan Li March 26, 2014 Two Key Assumptions 1. Overlap: 0
Targeted Maximum Likelihood Estimation in Safety Analysis
 Targeted Maximum Likelihood Estimation in Safety Analysis Sam Lendle 1 Bruce Fireman 2 Mark van der Laan 1 1 UC Berkeley 2 Kaiser Permanente ISPE Advanced Topics Session, Barcelona, August 2012 1 / 35
Ratio of Mediator Probability Weighting for Estimating Natural Direct and Indirect Effects
 Ratio of Mediator Probability Weighting for Estimating Natural Direct and Indirect Effects Guanglei Hong University of Chicago, 5736 S. Woodlawn Ave., Chicago, IL 60637 Abstract Decomposing a total causal
Chapter 11. Regression with a Binary Dependent Variable
 Chapter 11 Regression with a Binary Dependent Variable 2 Regression with a Binary Dependent Variable (SW Chapter 11) So far the dependent variable (Y) has been continuous: district-wide average test score
Since the seminal paper by Rosenbaum and Rubin (1983b) on propensity. Propensity Score Analysis. Concepts and Issues. Chapter 1. Wei Pan Haiyan Bai
 on propensity. Propensity Score Analysis. Concepts and Issues. Chapter 1. Wei Pan Haiyan Bai") Chapter 1 Propensity Score Analysis Concepts and Issues Wei Pan Haiyan Bai Since the seminal paper by Rosenbaum and Rubin (1983b) on propensity score analysis, research using propensity score analysis
Chapter 1 Propensity Score Analysis Concepts and Issues Wei Pan Haiyan Bai Since the seminal paper by Rosenbaum and Rubin (1983b) on propensity score analysis, research using propensity score analysis
A comparison of weighted estimators for the population mean. Ye Yang Weighting in surveys group
 A comparison of weighted estimators for the population mean Ye Yang Weighting in surveys group Motivation Survey sample in which auxiliary variables are known for the population and an outcome variable
Partially Identified Treatment Effects for Generalizability
 Partially Identified Treatment Effects for Generalizability Wendy Chan Human Development and Quantitative Methods Division, Graduate School of Education University of Pennsylvania, Philadelphia, Pennsylvania
Assessing Studies Based on Multiple Regression
 Assessing Studies Based on Multiple Regression Outline 1. Internal and External Validity 2. Threats to Internal Validity a. Omitted variable bias b. Functional form misspecification c. Errors-in-variables
Observational Studies and Propensity Scores
 Observational Studies and s STA 320 Design and Analysis of Causal Studies Dr. Kari Lock Morgan and Dr. Fan Li Department of Statistical Science Duke University Makeup Class Rather than making you come
Causal Inference in Observational Studies with Non-Binary Treatments. David A. van Dyk
 Causal Inference in Observational Studies with Non-Binary reatments Statistics Section, Imperial College London Joint work with Shandong Zhao and Kosuke Imai Cass Business School, October 2013 Outline
Ignoring the matching variables in cohort studies - when is it valid, and why?
 Ignoring the matching variables in cohort studies - when is it valid, and why? Arvid Sjölander Abstract In observational studies of the effect of an exposure on an outcome, the exposure-outcome association
What s New in Econometrics. Lecture 1
 What s New in Econometrics Lecture 1 Estimation of Average Treatment Effects Under Unconfoundedness Guido Imbens NBER Summer Institute, 2007 Outline 1. Introduction 2. Potential Outcomes 3. Estimands and
Marginal, crude and conditional odds ratios
 Marginal, crude and conditional odds ratios Denitions and estimation Travis Loux Gradute student, UC Davis Department of Statistics March 31, 2010 Parameter Denitions When measuring the eect of a binary
Propensity score modelling in observational studies using dimension reduction methods
 University of Colorado, Denver From the SelectedWorks of Debashis Ghosh 2011 Propensity score modelling in observational studies using dimension reduction methods Debashis Ghosh, Penn State University
Robustness to Parametric Assumptions in Missing Data Models
 Robustness to Parametric Assumptions in Missing Data Models Bryan Graham NYU Keisuke Hirano University of Arizona April 2011 Motivation Motivation We consider the classic missing data problem. In practice
Growth Mixture Modeling and Causal Inference. Booil Jo Stanford University
 Growth Mixture Modeling and Causal Inference Booil Jo Stanford University booil@stanford.edu Conference on Advances in Longitudinal Methods inthe Socialand and Behavioral Sciences June 17 18, 2010 Center
Flexible mediation analysis in the presence of non-linear relations: beyond the mediation formula.
 FACULTY OF PSYCHOLOGY AND EDUCATIONAL SCIENCES Flexible mediation analysis in the presence of non-linear relations: beyond the mediation formula. Modern Modeling Methods (M 3 ) Conference Beatrijs Moerkerke
High Dimensional Propensity Score Estimation via Covariate Balancing
 High Dimensional Propensity Score Estimation via Covariate Balancing Kosuke Imai Princeton University Talk at Columbia University May 13, 2017 Joint work with Yang Ning and Sida Peng Kosuke Imai (Princeton)
Econometric Analysis of Cross Section and Panel Data
 Econometric Analysis of Cross Section and Panel Data Jeffrey M. Wooldridge / The MIT Press Cambridge, Massachusetts London, England Contents Preface Acknowledgments xvii xxiii I INTRODUCTION AND BACKGROUND
Quantitative Economics for the Evaluation of the European Policy
 Quantitative Economics for the Evaluation of the European Policy Dipartimento di Economia e Management Irene Brunetti Davide Fiaschi Angela Parenti 1 25th of September, 2017 1 ireneb@ec.unipi.it, davide.fiaschi@unipi.it,
PSC 504: Dynamic Causal Inference
 PSC 504: Dynamic Causal Inference Matthew Blackwell 4/8/203 e problem Let s go back to a problem that we faced earlier, which is how to estimate causal effects with treatments that vary over time. We could
Dynamics in Social Networks and Causality
 Web Science & Technologies University of Koblenz Landau, Germany Dynamics in Social Networks and Causality JProf. Dr. University Koblenz Landau GESIS Leibniz Institute for the Social Sciences Last Time:
Gov 2002: 5. Matching
 Gov 2002: 5. Matching Matthew Blackwell October 1, 2015 Where are we? Where are we going? Discussed randomized experiments, started talking about observational data. Last week: no unmeasured confounders
Double Robustness. Bang and Robins (2005) Kang and Schafer (2007)
 Kang and Schafer (2007)") Double Robustness Bang and Robins (2005) Kang and Schafer (2007) Set-Up Assume throughout that treatment assignment is ignorable given covariates (similar to assumption that data are missing at random
Double Robustness Bang and Robins (2005) Kang and Schafer (2007) Set-Up Assume throughout that treatment assignment is ignorable given covariates (similar to assumption that data are missing at random
Combining multiple observational data sources to estimate causal eects
 Department of Statistics, North Carolina State University Combining multiple observational data sources to estimate causal eects Shu Yang* syang24@ncsuedu Joint work with Peng Ding UC Berkeley May 23,
Business Statistics. Lecture 10: Correlation and Linear Regression
 Business Statistics Lecture 10: Correlation and Linear Regression Scatterplot A scatterplot shows the relationship between two quantitative variables measured on the same individuals. It displays the Form
New Developments in Nonresponse Adjustment Methods
 New Developments in Nonresponse Adjustment Methods Fannie Cobben January 23, 2009 1 Introduction In this paper, we describe two relatively new techniques to adjust for (unit) nonresponse bias: The sample
Gov 2002: 13. Dynamic Causal Inference
 Gov 2002: 13. Dynamic Causal Inference Matthew Blackwell December 19, 2015 1 / 33 1. Time-varying treatments 2. Marginal structural models 2 / 33 1/ Time-varying treatments 3 / 33 Time-varying treatments
Causal Hazard Ratio Estimation By Instrumental Variables or Principal Stratification. Todd MacKenzie, PhD
 Causal Hazard Ratio Estimation By Instrumental Variables or Principal Stratification Todd MacKenzie, PhD Collaborators A. James O Malley Tor Tosteson Therese Stukel 2 Overview 1. Instrumental variable
Given a sample of n observations measured on k IVs and one DV, we obtain the equation
 Psychology 8 Lecture #13 Outline Prediction and Cross-Validation One of the primary uses of MLR is for prediction of the value of a dependent variable for future observations, or observations that were
MMWS Software Program Manual
 MMWS Software Program Manual 1 Software Development The MMWS program is regularly updated. The latest beta version can be downloaded from http://hlmsoft.net/ghong/ MMWS Click here to get MMWS. For a sample
Penalized Spline of Propensity Methods for Missing Data and Causal Inference. Roderick Little
 Penalized Spline of Propensity Methods for Missing Data and Causal Inference Roderick Little A Tail of Two Statisticians (but who s tailing who) Taylor Little Cambridge U 978 BA Math ( st class) 97 BA
Bayesian causal forests: dealing with regularization induced confounding and shrinking towards homogeneous effects
 Bayesian causal forests: dealing with regularization induced confounding and shrinking towards homogeneous effects P. Richard Hahn, Jared Murray, and Carlos Carvalho July 29, 2018 Regularization induced
Use of Matching Methods for Causal Inference in Experimental and Observational Studies. This Talk Draws on the Following Papers:
 Use of Matching Methods for Causal Inference in Experimental and Observational Studies Kosuke Imai Department of Politics Princeton University April 27, 2007 Kosuke Imai (Princeton University) Matching
Matching Techniques. Technical Session VI. Manila, December Jed Friedman. Spanish Impact Evaluation. Fund. Region
 Impact Evaluation Technical Session VI Matching Techniques Jed Friedman Manila, December 2008 Human Development Network East Asia and the Pacific Region Spanish Impact Evaluation Fund The case of random
CompSci Understanding Data: Theory and Applications
 CompSci 590.6 Understanding Data: Theory and Applications Lecture 17 Causality in Statistics Instructor: Sudeepa Roy Email: sudeepa@cs.duke.edu Fall 2015 1 Today s Reading Rubin Journal of the American
Estimating the Mean Response of Treatment Duration Regimes in an Observational Study. Anastasios A. Tsiatis.
 Estimating the Mean Response of Treatment Duration Regimes in an Observational Study Anastasios A. Tsiatis http://www.stat.ncsu.edu/ tsiatis/ Introduction to Dynamic Treatment Regimes 1 Outline Description
Econ 673: Microeconometrics Chapter 12: Estimating Treatment Effects. The Problem
 Econ 673: Microeconometrics Chapter 12: Estimating Treatment Effects The Problem Analysts are frequently interested in measuring the impact of a treatment on individual behavior; e.g., the impact of job
More Statistics tutorial at Logistic Regression and the new:
 Logistic Regression and the new: Residual Logistic Regression 1 Outline 1. Logistic Regression 2. Confounding Variables 3. Controlling for Confounding Variables 4. Residual Linear Regression 5. Residual
Bios 6648: Design & conduct of clinical research
 Bios 6648: Design & conduct of clinical research Section 2 - Formulating the scientific and statistical design designs 2.5(b) Binary 2.5(c) Skewed baseline (a) Time-to-event (revisited) (b) Binary (revisited)
PEARL VS RUBIN (GELMAN)
") PEARL VS RUBIN (GELMAN) AN EPIC battle between the Rubin Causal Model school (Gelman et al) AND the Structural Causal Model school (Pearl et al) a cursory overview Dokyun Lee WHO ARE THEY? Judea Pearl
PEARL VS RUBIN (GELMAN) AN EPIC battle between the Rubin Causal Model school (Gelman et al) AND the Structural Causal Model school (Pearl et al) a cursory overview Dokyun Lee WHO ARE THEY? Judea Pearl
Propensity Score Methods for Estimating Causal Effects from Complex Survey Data
 Propensity Score Methods for Estimating Causal Effects from Complex Survey Data Dissertation Presented in Partial Fulfillment of the Requirements for the Degree Doctor of Philosophy in the Graduate School
Multi-level Models: Idea
 Review of 140.656 Review Introduction to multi-level models The two-stage normal-normal model Two-stage linear models with random effects Three-stage linear models Two-stage logistic regression with random
Semiparametric Generalized Linear Models
 Semiparametric Generalized Linear Models North American Stata Users Group Meeting Chicago, Illinois Paul Rathouz Department of Health Studies University of Chicago prathouz@uchicago.edu Liping Gao MS Student
Variable selection and machine learning methods in causal inference
 Variable selection and machine learning methods in causal inference Debashis Ghosh Department of Biostatistics and Informatics Colorado School of Public Health Joint work with Yeying Zhu, University of
DEALING WITH MULTIVARIATE OUTCOMES IN STUDIES FOR CAUSAL EFFECTS
 DEALING WITH MULTIVARIATE OUTCOMES IN STUDIES FOR CAUSAL EFFECTS Donald B. Rubin Harvard University 1 Oxford Street, 7th Floor Cambridge, MA 02138 USA Tel: 617-495-5496; Fax: 617-496-8057 email: rubin@stat.harvard.edu
arxiv: v1 [stat.me] 8 Jun 2016
![arxiv: v1 [stat.me] 8 Jun 2016](/thumbs/73/69556897.jpg "arxiv: v1 [stat.me] 8 Jun 2016") Principal Score Methods: Assumptions and Extensions Avi Feller UC Berkeley Fabrizia Mealli Università di Firenze Luke Miratrix Harvard GSE arxiv:1606.02682v1 [stat.me] 8 Jun 2016 June 9, 2016 Abstract
Principal Score Methods: Assumptions and Extensions Avi Feller UC Berkeley Fabrizia Mealli Università di Firenze Luke Miratrix Harvard GSE arxiv:1606.02682v1 [stat.me] 8 Jun 2016 June 9, 2016 Abstract
Causal Inference by Minimizing the Dual Norm of Bias. Nathan Kallus. Cornell University and Cornell Tech
 Causal Inference by Minimizing the Dual Norm of Bias Nathan Kallus Cornell University and Cornell Tech www.nathankallus.com Matching Zoo It s a zoo of matching estimators for causal effects: PSM, NN, CM,
Can a Pseudo Panel be a Substitute for a Genuine Panel?
 Can a Pseudo Panel be a Substitute for a Genuine Panel? Min Hee Seo Washington University in St. Louis minheeseo@wustl.edu February 16th 1 / 20 Outline Motivation: gauging mechanism of changes Introduce
Estimating and Using Propensity Score in Presence of Missing Background Data. An Application to Assess the Impact of Childbearing on Wellbeing
 Estimating and Using Propensity Score in Presence of Missing Background Data. An Application to Assess the Impact of Childbearing on Wellbeing Alessandra Mattei Dipartimento di Statistica G. Parenti Università
Multidimensional Control Totals for Poststratified Weights
 Multidimensional Control Totals for Poststratified Weights Darryl V. Creel and Mansour Fahimi Joint Statistical Meetings Minneapolis, MN August 7-11, 2005 RTI International is a trade name of Research
EMERGING MARKETS - Lecture 2: Methodology refresher
 EMERGING MARKETS - Lecture 2: Methodology refresher Maria Perrotta April 4, 2013 SITE http://www.hhs.se/site/pages/default.aspx My contact: maria.perrotta@hhs.se Aim of this class There are many different
Bounds on Causal Effects in Three-Arm Trials with Non-compliance. Jing Cheng Dylan Small
 Bounds on Causal Effects in Three-Arm Trials with Non-compliance Jing Cheng Dylan Small Department of Biostatistics and Department of Statistics University of Pennsylvania June 20, 2005 A Three-Arm Randomized
Optimal Blocking by Minimizing the Maximum Within-Block Distance
 Optimal Blocking by Minimizing the Maximum Within-Block Distance Michael J. Higgins Jasjeet Sekhon Princeton University University of California at Berkeley November 14, 2013 For the Kansas State University
Chained Versus Post-Stratification Equating in a Linear Context: An Evaluation Using Empirical Data
 Research Report Chained Versus Post-Stratification Equating in a Linear Context: An Evaluation Using Empirical Data Gautam Puhan February 2 ETS RR--6 Listening. Learning. Leading. Chained Versus Post-Stratification
Formula for the t-test
 Formula for the t-test: How the t-test Relates to the Distribution of the Data for the Groups Formula for the t-test: Formula for the Standard Error of the Difference Between the Means Formula for the
G-ESTIMATION OF STRUCTURAL NESTED MODELS (CHAPTER 14) BIOS G-Estimation
 BIOS G-Estimation") G-ESTIMATION OF STRUCTURAL NESTED MODELS (CHAPTER 14) BIOS 776 1 14 G-Estimation ( G-Estimation of Structural Nested Models 14) Outline 14.1 The causal question revisited 14.2 Exchangeability revisited
G-ESTIMATION OF STRUCTURAL NESTED MODELS (CHAPTER 14) BIOS 776 1 14 G-Estimation ( G-Estimation of Structural Nested Models 14) Outline 14.1 The causal question revisited 14.2 Exchangeability revisited
ANALYTIC COMPARISON. Pearl and Rubin CAUSAL FRAMEWORKS
 ANALYTIC COMPARISON of Pearl and Rubin CAUSAL FRAMEWORKS Content Page Part I. General Considerations Chapter 1. What is the question? 16 Introduction 16 1. Randomization 17 1.1 An Example of Randomization
On the Use of Linear Fixed Effects Regression Models for Causal Inference
 On the Use of Linear Fixed Effects Regression Models for ausal Inference Kosuke Imai Department of Politics Princeton University Joint work with In Song Kim Atlantic ausal Inference onference Johns Hopkins
The problem of causality in microeconometrics.
 The problem of causality in microeconometrics. Andrea Ichino University of Bologna and Cepr June 11, 2007 Contents 1 The Problem of Causality 1 1.1 A formal framework to think about causality....................................
Estimating Causal Effects from Observational Data with the CAUSALTRT Procedure
 Paper SAS374-2017 Estimating Causal Effects from Observational Data with the CAUSALTRT Procedure Michael Lamm and Yiu-Fai Yung, SAS Institute Inc. ABSTRACT Randomized control trials have long been considered