Monitoring and Conserving Wildlife Communities across Northern Botswana. Lindsey Noel Rich. Doctor of Philosophy In Fish and Wildlife Conservation
|
|
|
- Emory Small
- 5 years ago
- Views:
Transcription
1 Monitoring and Conserving Wildlife Communities across Northern Botswana Lindsey Noel Rich Dissertation submitted to the faculty of the Virginia Polytechnic Institute and State University in partial fulfillment of the requirements for the degree of Doctor of Philosophy In Fish and Wildlife Conservation Marcella J. Kelly Sarah M. Karpanty Kathleen A. Alexander Hugh S. Robinson 9 September 2016 Blacksburg, Virginia Keywords: camera trap, carnivore, multispecies modelling, population density, species richness
2 Monitoring and Conserving Wildlife Communities across Northern Botswana Lindsey N. Rich ABSTRACT (ACADEMIC) To develop effective conservation planning and mitigate biodiversity loss, standardized metrics for monitoring and assessing biodiversity are needed. This information is particularly vital in Botswana, where knowledge of many of the diverse wildlife populations is lacking. To address this knowledge gap, my dissertation research evaluated the distributions, densities, and ecology of the wildlife community in northern Botswana, with a focus on terrestrial carnivore species given their importance both ecologically and economically. My objectives were threefold: 1) estimate the distributions of the mammal community (n = 44 species) and evaluate community, group, and species-specific responses to anthropogenic and environmental variables, 2) test whether the presence of intraguild species or resource availability had a larger influence on the seasonal distributions of carnivore species, and 3) simultaneously estimate the population densities of 7 carnivore species. To accomplish these objectives, I completed a multi-year camera trap survey in a 1,154-km 2 study area and analyzed the data using occupancy models (single and multi- species) and spatially explicit capture-recapture models. Estimates of species richness ranged from 8 to 27 unique species, species had a mean occurrence probability of 0.32 (95% credible interval = ), and estimated densities ranged from 1.8 aardwolves (Proteles cristata) to 12.7 spotted hyenas (Crocuta crocuta) per 100 km 2. The occupancy and richness of terrestrial mammals was negatively associated with human disturbance and in general, positively associated with open grasslands/floodplains. Carnivore species, specifically, tended to have greater species richness and larger population densities in open habitats than in closed. I also found carnivore distributions were positively associated with the detection rate of
3 intraguild competitors and predators, suggesting competitor/predator avoidance did not play a large role in shaping carnivore community structure. My research highlights the pivotal role protected areas and grasslands play in conserving wildlife populations in northern Botswana. Additionally, my research helps progress camera trap analyses from single to multi-species assessments. Broader application of this multi-species approach would likely result in a better understanding of wildlife and carnivore communities which in turn, may help inform management actions aimed at addressing the loss of wildlife populations globally.
4 Monitoring and Conserving Wildlife Communities across Northern Botswana Lindsey N. Rich GENERAL AUDIENCE ABSTRACT To conserve wildlife populations, information is needed on where species live, the resources (e.g., food, water, and shelter) they require, and how many there are. This information is particularly important in Botswana, where knowledge of many wildlife populations is lacking. To address this knowledge gap, my dissertation research evaluated the distributions, densities, and ecology of the wildlife community in northern Botswana, with a focus on carnivores given their importance both ecologically and economically. My objectives were threefold: 1) estimate the distributions of the mammal community (n = 44 species) and evaluate community, group, and species-specific responses to human and environmental variables, 2) test whether the presence of competitors/predators or resource availability had a larger influence on the seasonal distributions of carnivore species, and 3) estimate the population densities of 7 carnivore species. To accomplish these objectives, I completed a multi-year camera trap survey in a 1,154-km 2 study area and analyzed the data using advanced analytical techniques. I photographed 44 species of mammals and the estimated number of species per camera station ranged from 8 to 27. My estimated densities ranged from 1.8 aardwolves (Proteles cristata) to 12.7 spotted hyenas (Crocuta crocuta) per 100 km 2. Overall, mammal species were more likely to occupy grasslands and floodplains that were located further into protected areas (i.e., far from human disturbance). Open habitats seemed to be particularly important to carnivore species. In general, there were more carnivore species and these species had higher densities in open habitats than in closed. My results suggest carnivores did not avoid their competitors and predators by spatially separating themselves on the landscape, as has been found in the Serengeti. My research
5 highlights the pivotal role protected areas and grasslands play in conserving wildlife populations, and advances camera trap analyses from assessments of a single species to assessments of entire wildlife communities. My research approach is applicable to camera trap studies worldwide and broader application would likely result in a better understanding of wildlife and carnivore communities. This information, in turn, can help inform management actions aimed at addressing the loss of wildlife populations around the globe.
6 vi ACKNOWLEDGEMENTS Thank you to Dr. J. W. McNutt, the director of the Botswana Predator Conservation Trust (BPCT), for inviting me to collaborate with his organization and be based out of BPCT s field camp for the duration of my dissertation field work. I also thank Krystyna Golabek, Neil Jordan, Leanne Van der Weyde, Jessica Vitale, Hallie Walker, Geoff Gilfillan, Dix Kedikilwe, Briana Abrahms, and Kasim Rafiq at BPCT for their assistance with various parts of my dissertation field work and for becoming my lifelong friends and family. I would also like to thank the government of Botswana, the Ministry of the Environment, Wildlife and Tourism, and the Department of Wildlife and National Parks for permission to conduct this study (permit EWT 8/36/4 XXIII 44) in your breath-taking country, it was a dream come true. A huge thank you to my advisor, Dr. Marcella Kelly, for taking me on as one of your PhD students and allowing me to develop my dissertation research from the ground up. Thank goodness I had the opportunity to win you over with my dancing skills in Bhutan! Thanks also to my committee members, Dr. Hugh Robinson for mentoring me for the last 8 years, getting me Panthera camera traps, and providing feedback on manuscripts, Dr. Sarah Karpanty for all her support and feedback throughout the course of my dissertation, and Dr. Kathy Alexander for helping me acquire research permits for Botswana. I would also like to thank my fellow WHAPA lab members, particularly Anne Hilborn, Zach Farris, and Asia Murphy, who have been my rocks and go to people since day one of my PhD. Thank you as well to Amanda Hyman, Cathy Bukowski, Morgan Franke, Cordie Diggins and many others for your friendship and support. Another huge thank you to Dr. Dave Miller at Penn State for all of his help with my quantitative analyses, writing, project design, and for welcoming me into his home during my trips to Penn. You have been an invaluable mentor. Thanks also to his graduate students, Courtney Davis and David Muñoz, who I have collaborated with for publications. Lastly, but
7 vii certainly not least, thank you to my family for your unwavering support and for encouraging my crazy career path, particularly my mom who has always pushed me to follow my dreams. My research was funded by a Fulbright Study/Research Grant, PEO Scholar Award, Wilderness Wildlife Trust, Columbus Zoo, Cleveland Metroparks Zoo, Wild Felid Association, Idea Wild, Temenos Foundation, The Rufford Foundation, and the numerous donors who support the BPCT. My tuition and stipend were supported by a Cunningham Fellowship through the Virginia Tech Graduate School and a George E. and Hester B. Aker Fellowship through the College of Natural Resources and the Environment. I am extremely appreciative to all of the funders for believing in me and my research.
8 viii TABLE OF CONTENTS Abstract (academic)... ii Abstract (public)... iv Acknowledgements... vi List of figures...x List of tables... xii Attribution... xiv I. Introduction...1 Figure...7 II. Using camera trapping and hierarchical occupancy modeling to evaluate the spatial ecology of an African mammal community...15 Abstract...16 Introduction...18 Materials and methods...21 Results...28 Discussion...30 Literature cited...35 Tables...41 Figures...44 Supporting information...50 III. Carnivore distributions in Botswana shaped by resource availability and the presence of intraguild competitors/predators...51 Abstract...52 Introduction...54 Materials and methods...56
9 ix Results...62 Discussion...64 Literature cited...68 Tables...73 Figures...76 IV. Modeling densities of sympatric species: a multispecies photographic capture-recapture approach...79 Abstract...80 Introduction...82 Materials and methods...85 Results...89 Discussion...90 Literature cited...96 Tables Figures V. Conclusion Literature cited (in sections I and V)...115
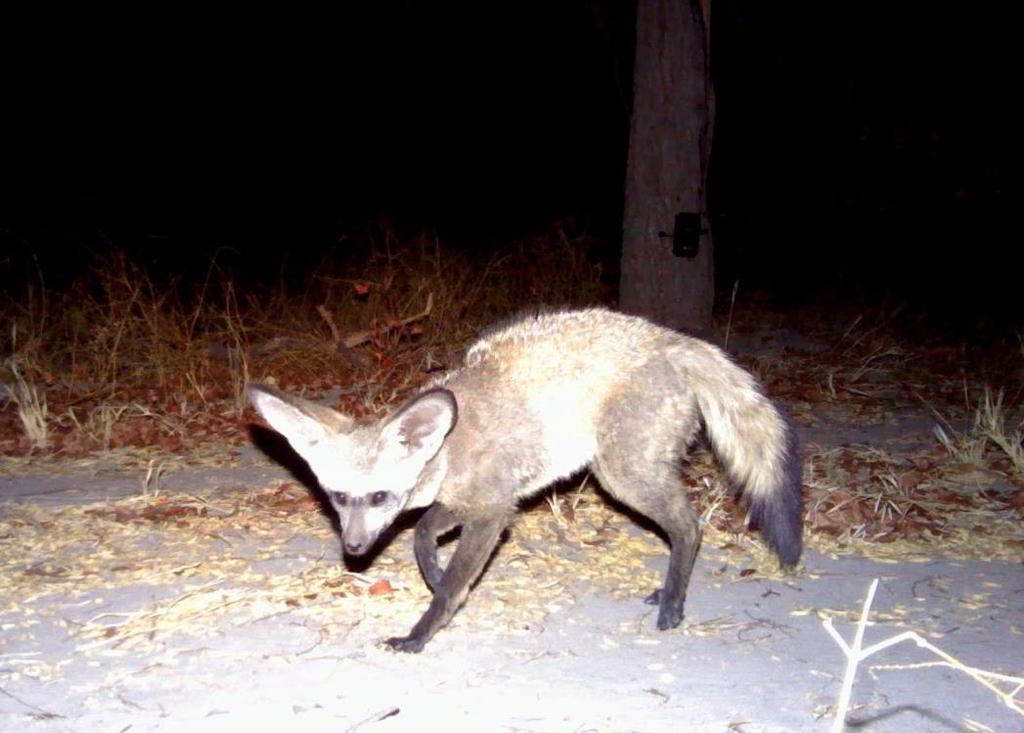
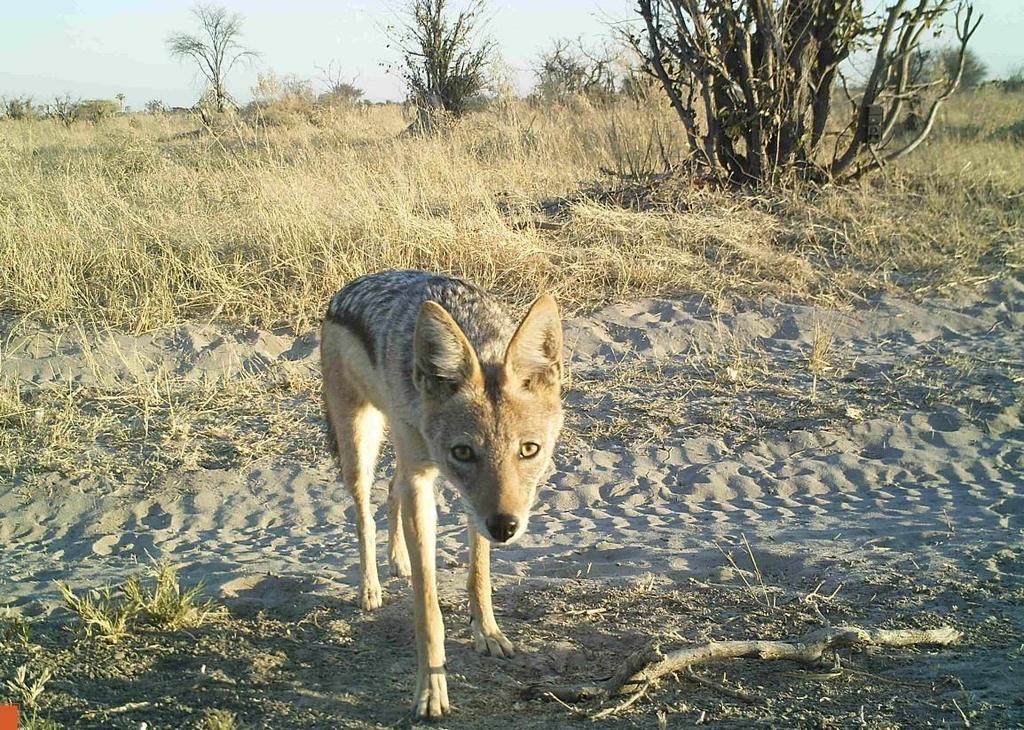
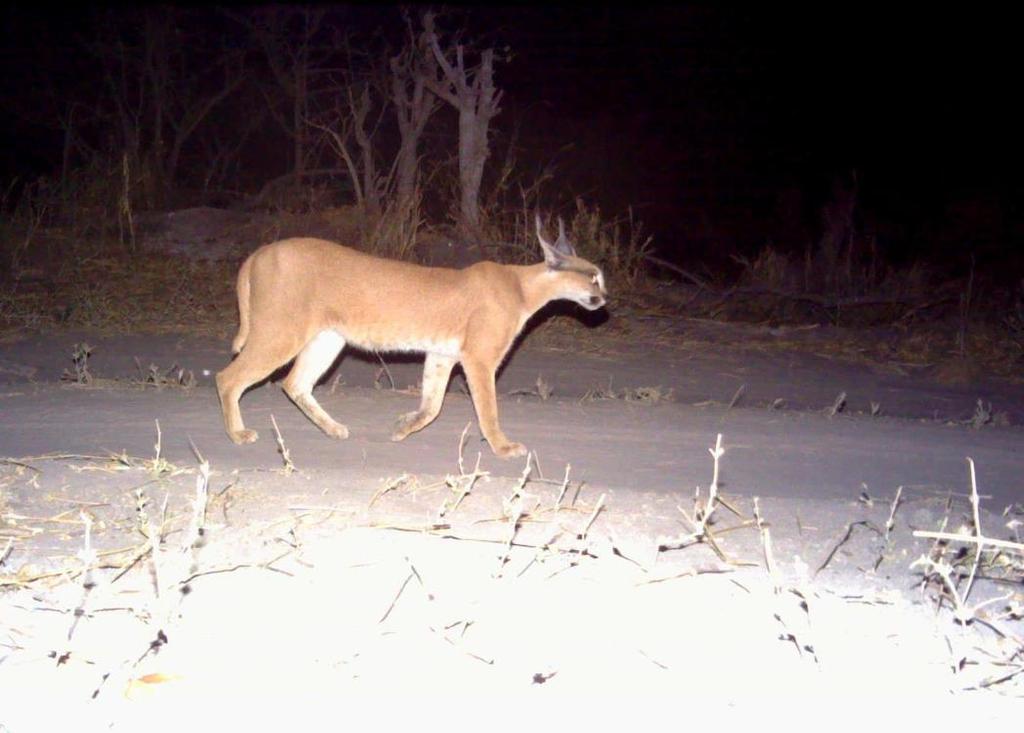
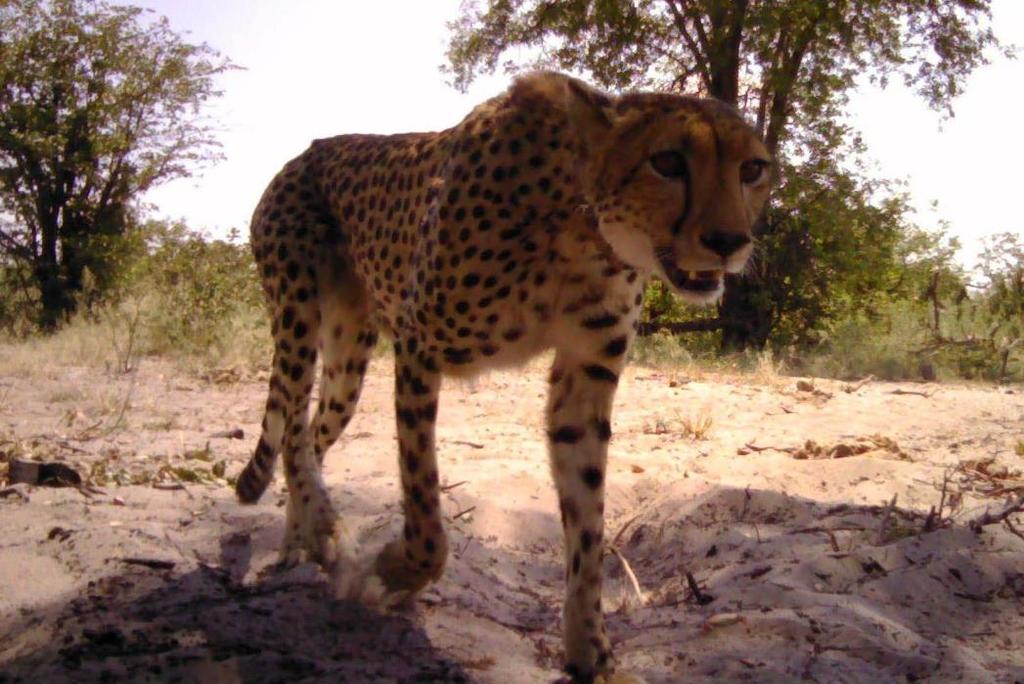
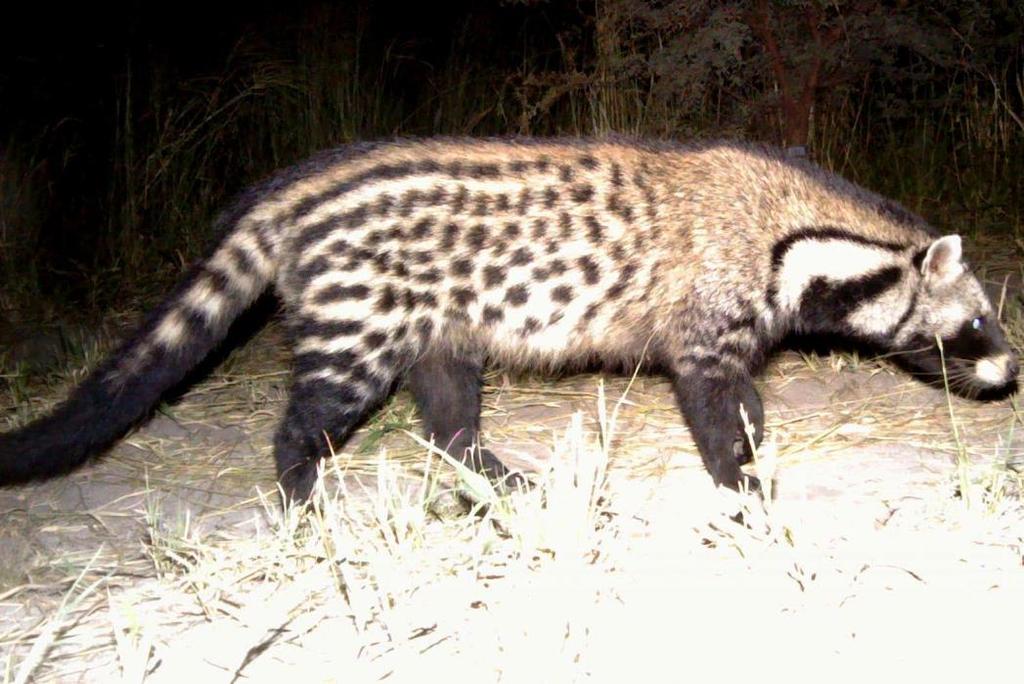
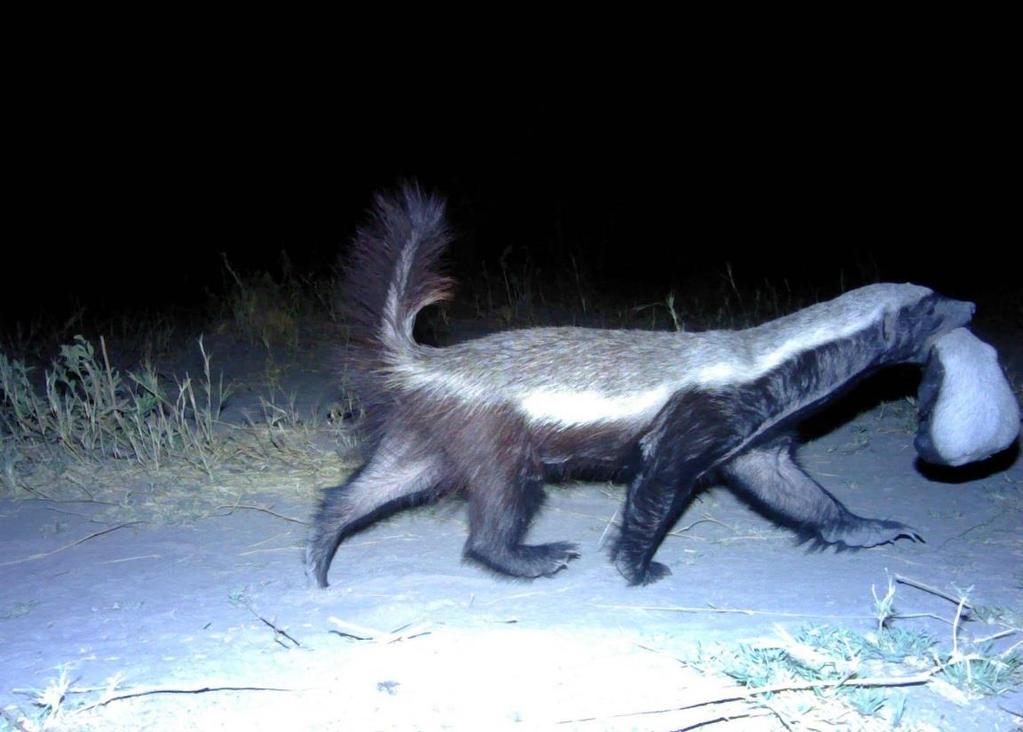
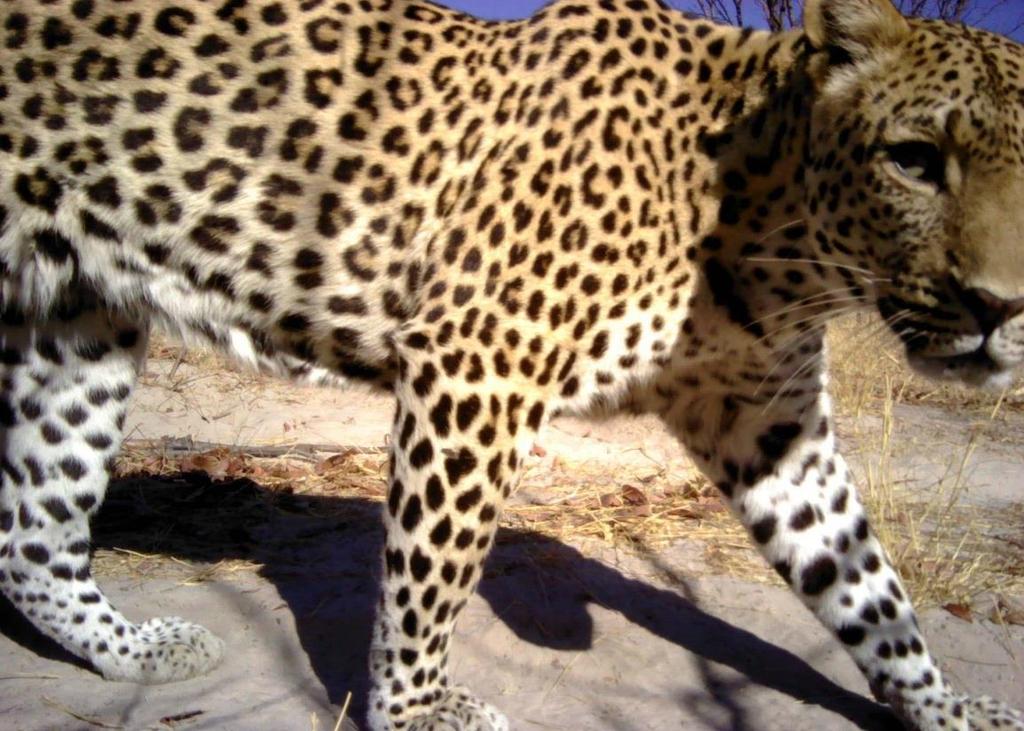
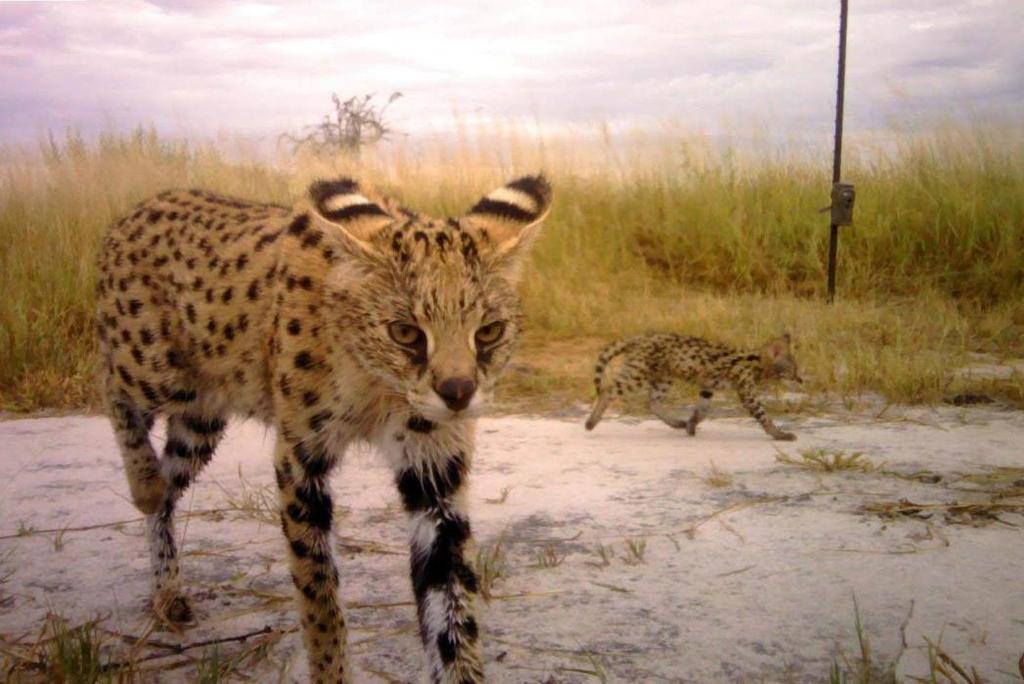
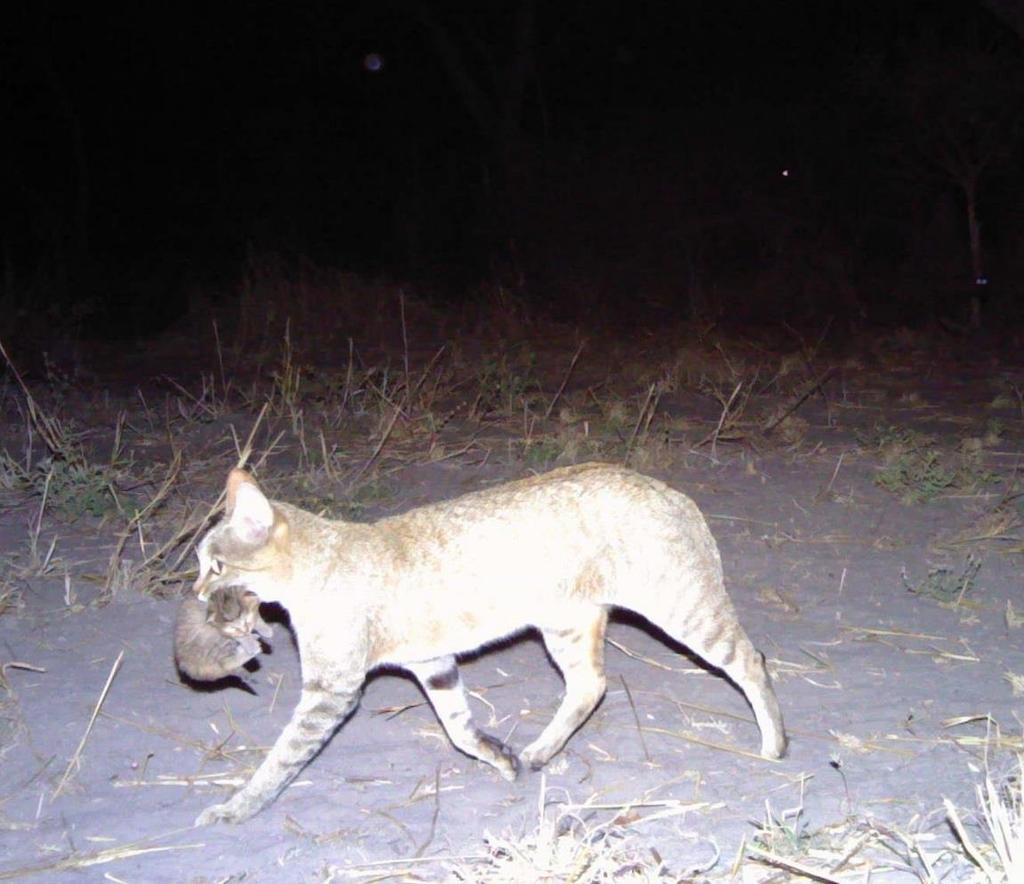
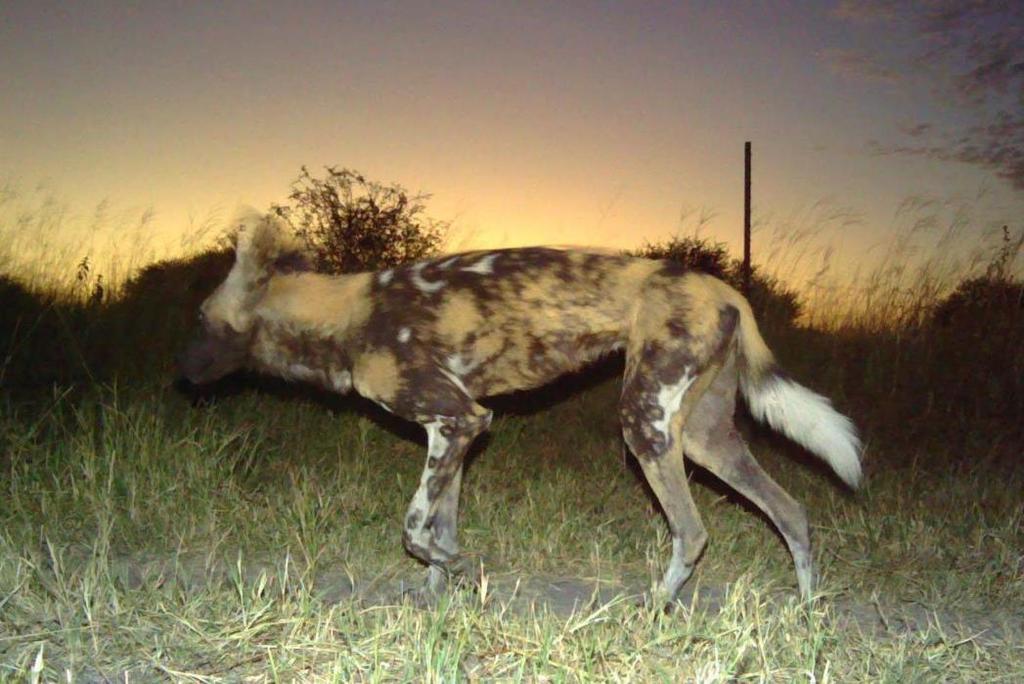
10 x LIST OF FIGURES Figure 1.1. Meso- and large carnivore species endemic to northern Botswana including the A) aardwolf (Proteles cristata), B) bat-eared fox (Otocyon megalotis), C), black-backed jackal (Canis mesomelas), D) caracal (Caracal caracal), E) cheetah (Acinonyx jubatus), F) African civet (Civettictis civetta), G) honey badger (Mellivora capensis), H) leopard (Panthera pardus), I) lion (Panthera leo), J) serval (Leptailurus serval), K) spotted hyena (Crocuta crocuta), L) African wildcat (Felis silvestris), M) and African wild dog (Lycaon pictus). Figure 2.1. The study area including the eastern section of Moremi Game Reserve, wildlife management areas NG33/34, and livestock grazing areas in Shorobe, Botswana. Figure 2.2. Mean, site-specific estimates of overall species richness and the richness of diet and body size (small < 5kg, medium 5 25 kg, large kg and extra-large 200 kg) groups of species in relation to (a) the camera station s distance into a protected wildlife area (negative values indicate camera was in a livestock area) and (b) grassland/floodplain cover. Camera trap survey took place in Ngamiland District, Botswana, Figure 2.3. Standardized beta (specified as α in model) coefficients, and 95% credible intervals, for the influence of distance into the wildlife area (a) and floodplain/grassland cover (b) on the probability a species used an area during our camera trap survey in northern Botswana, Species are arranged in body size groups including small (< 5kg), medium (5 25 kg), large ( kg) and extra-large ( 200 kg) Figure 3.1. Our camera trap survey was carried out in the eastern section of Moremi Game Reserve and wildlife management areas NG33/34, Botswana, Figure 3.2. Mean estimated probabilities of occupancy, corresponding 95% credible intervals, and raw numbers of independent photo detections for meso- and large carnivores during camera trap surveys in Ngamiland District, Botswana during the 2014 dry season and 2015 wet season.
11 xi Figure 4.1. Layout of our camera trap survey in northern Botswana, Figure 4.2. The range of distances separating 221 camera stations during a camera trap survey in Ngamiland District, Botswana, We spaced cameras at a range of distances to adequately reflect movements of small and wide-ranging carnivore species. Figure 4.3. Maximum-likelihood density estimates for a species residing at low densities, African wild dog (Lycaon pictus), and a species residing at high densities, spotted hyena (Crocuta crocuta), based on a camera trap survey (dots represent camera stations) in northern Botswana, To define the state space (i.e., an area large enough to include the activity centers of all individuals exposed to trapping) for both species, we surrounded our study area with a 25km buffer.
12 xii LIST OF TABLES Table 2.1. Mean (x ) and 95% credible interval (95% CI) estimates of the community-level hyper-parameters hypothesized to influence the probability of use (α) and detection (β) of 44 mammal species in northern Botswana, 2015 Table 2.2. Mean (x ) and 95% credible interval (95% CI) estimates of the group-level hyperparameters hypothesized to influence the probability 44 mammal species used the area sampled by our camera stations in northern Botswana, Body size groups included small (S = < 5 kg), medium (M = 5 25 kg), large (L = kg) and extra-large (XL = 200 kg) species and diet groups included omnivores (Omn), carnivores (Carn) and herbivores (Herb). Table 3.1. Covariate effects and the corresponding standard errors on carnivore species probabilities of occupancy during the dry season of 2014 (August November) and wet season of 2015 (February April) in Ngamiland District, Botswana. Table 3.2. Comparison of deviance statistics ( deviance, model with lowest deviance value has best model fit) for models used to predict carnivore occupancy ( ) probabilities during the 2014 dry season and 2015 wet season in Ngamiland District, Botswana. We compared null (no covariates), resource availability ( covariates = mopane, prey, water, EVI), intraguild interactions ( covariates = detection rate of intraguild competitors and predators), and combined ( covariates = all covariates) models. Table 4.1. Number of photographic detections (Det.), number of individuals (Indiv.), median number (range) of recaptures of individuals, and number of unresolved sightings (i.e., photos only identifiable to the species-level) for the focal carnivore species of a camera trap survey in Ngamiland District, Botswana, 2015.
13 xiii Table 4.2. Summary statistics (estimated parameter values and 95% confidence intervals) from spatially explicit capture-recapture models based on photographic captures of carnivores in Ngamiland District, Botswana, 2015, including maximum-likelihood density estimates (D) in mopane (Colophospermum mopane) and non-mopane habitat, buffer widths and the resulting state space areas, and estimates of baseline encounter rate g0 and scale parameter σ.
14 xiv ATTRIBUTION Several people aided in my dissertation research and the resulting chapters/manuscripts. A brief description of their contributions is provided here: Marcella J. Kelly, Ph.D., is my Ph.D. advisor and helped in the development of my research and study design. She also provided feedback throughout my Ph.D. and editorial comments on each manuscript. Hugh S. Robinson, Ph.D., is on my Ph.D. committee. He helped in the development of my research, provided editorial comments on each manuscript, and procured camera traps from Panthera that were instrumental in the successful completion of my dissertation field work. David A.W. Miller, Ph.D., is a professor at Penn State University. He provided guidance on the design of the camera trap survey, helped with the quantitative analyses, and contributed editorial comments on each manuscript. Dr. Tico McNutt, Ph.D., is the director of the Botswana Predator Conservation, the organization I collaborated with for my dissertation research. He helped in the development of my research (ensuring it was pertinent to wildlife conservation in Botswana), allowed me to be based out of his field camp in Botswana for the duration of my field work, and provided editorial comments on each manuscript.
15 1 I. INTRODUCTION Biodiversity loss, species-level extinction risks, and anthropogenic pressures on ecosystems are accelerating (Alkemade et al. 2009, Butchart et al. 2010). Biodiversity loss, specifically, could rank among the major drivers of ecosystem change in the 21 st century, comparable to global change stressors such as ultraviolet radiation and climate warming (Hooper et al. 2012). These alarming trends resulted in The Convention on Biological Diversity developing a strategic plan, signed by 193 nations, aimed at conserving, restoring, and wisely using biodiversity. The infrastructure required to measure trends in abundance or changes in species distribution, however, is lacking thus limiting countries ability to monitor progress towards achieving Convention goals (Ahumada et al. 2013; Schmeller et al. 2015). Additionally, the lack of rigorous data prevents the evaluation of species responses to anthropogenic and environmental threats which, in turn, precludes effective conservation planning (Feeley and Silman 2011). The conservation of carnivore species is of particular interest given their vulnerability to extinction and their impacts on ecosystems as a whole (Woodroffe and Ginsberg 1998, Ripple et al. 2014, Bauer et al. 2015). Nearly one-quarter of the world s 245 carnivore species are threatened with extinction and many more are experiencing population declines (Ginsberg 2001, Schipper et al. 2008, Ripple et al., 2014). Among the 31 largest carnivores, specifically, 19 are listed as threatened by the International Union for the Conservation of Nature (IUCN) and 24 are decreasing. African wild dogs (Lycaon pictus), tigers (Panthera tigris), and lions (Panthera leo), for example, have each disappeared from >80% of their historical range (Ripple et al. 2014, Bauer et al. 2015). Carnivores vulnerability to extinction is a consequence of both intrinsic and extrinsic factors (Woodroffe and Ginsberg 1998, Bauer et al. 2015). Intrinsic factors can include
16 2 low population densities, low reproductive rates, high food requirements, and extensive area requirements (Woodroffe and Ginsberg, 1998, Cardillo et al. 2005). Extrinsic factors can include human-wildlife conflict, habitat loss and fragmentation, and prey loss (Creel 2001, Gittleman et al. 2001). Direct persecution by humans, for example, is often a major threat to carnivores as they are hunted for trophies, bushmeat, and for real or perceived threats to livestock and human life (Woodroffe and Ginsberg 1998). The unremitting decline of many of our world s carnivores is a threat to not only the species, but to the ecosystems in which they reside. Carnivore declines have reportedly led to changes in plant diversity, biomass, and productivity, which likely have extensive impacts on nearly all other species as well as ecological processes such as nutrient cycling, the frequency of wildfires, regulation of diseases, and carbon sequestration (Ripple et al. 2014). To curtail the decline of our world s remaining carnivore species, information on the distributions, demographics, and ecology of remaining carnivore populations is needed (Gros et al. 1996, Gaston and Fuller 2009, Pettorelli et al. 2010). The wide ranging and elusive nature of many carnivore species makes them difficult to observe directly (Silver et al. 2004, Karanth et al. 2006, Balme et al. 2010). As a result, camera traps have become an increasingly common method for collecting standardized data on a diversity of carnivores (O Brien et al. 2010, Ahumada et al. 2011, Burton et al. 2015, Steenweg et al. 2016). Remote sensing cameras detect passing animals using motion- and heat-sensing infrared technology, which allows them to collect data 24 hours per day without a human having to be present. Additionally, each photographic detection has corresponding metadata on the time, date, and location of the photograph, which allows human error to be minimized. This metadata also allows researchers to account for species detection probabilities (i.e., the probability a species was present but went undetected; MacKenzie et al. 2002). As a result of
17 3 these features, camera traps have become a mainstream tool in conservation ecology and are now being used to evaluate species distributions, occupancy, density, temporal activity patterns, movement, and population trends (O Brien et al. 2010, Ahumada et al. 2013, Burton et al. 2015, Steenweg et al. 2016). Few studies, however, capitalize on the wealth of community information collected by camera traps as attention is typically focused on a single species such as tigers (Karanth and Nichols 1998, Karanth et al. 2006) or jaguars (Panthera onca; Silver et al. 2004, Soisalo and Cavalcanti 2006). This results in the majority of photos being discarded and additional, potentially valuable data being unused. Thus, multi-species assessments of camera trap data are needed. Multi-species assessments would result in considerable savings in money, time, and personnel costs, when compared to single species approaches, and a more comprehensive and efficient use of available data, which is critical for the many management agencies across the world where field data funding is limited (Zipkin et al. 2009). With recent advancements in ecological modeling, multi-species assessments of camera trap data are now possible. Multi-species hierarchical occupancy models (Dorazio and Royle 2005), for example, can be used to evaluate the spatial ecology of entire wildlife communities. As occupancy models (MacKenzie et al. 2002), they account for imperfect detection by using temporally or spatially replicated data and as hierarchical models, they integrate data across species, permitting composite analyses of communities and individual species (Russell et al. 2009, Zipkin et al. 2009). Additionally, sharing data across species permits occupancy estimates for rare and elusive species, which would not have been possible using single species approaches (Zipkin et al. 2010). Multi-species hierarchical models can also be parameterized with variables hypothesized to influence the distributions of wildlife, allowing evaluation of how these variables affect wildlife communities or a specific species of concern (Russell et al. 2009). If
18 4 density is the parameter of interest, then spatially explicit capture-recapture (SECR; Efford et al. 2009, Royle et al. 2009) and spatial mark-resight (SMR; Sollmann et al. 2013, Rich et al. 2014) models can be used to simultaneously estimate the densities of multiple, sympatric species, including both fully and partially marked (i.e., identifiable to the individual-level using natural or artificial markings) species. When employing traditional capture-recapture approaches, study designs have to be tailored to the movements of an individual study species (Karanth and Nichols 1998, Sollmann et al. 2012). Spatial models, alternatively, directly incorporate the Cartesian coordinates of where individuals were photographed, making them much more robust to varying trap array sizes and distances between camera stations. As long as there is a large enough sample of individuals and spatial recaptures across a range of distances, spatial models make it possible to now use a single camera trap survey to simultaneously estimate the densities of multiple species (O Brien and Kinnaird 2011, Sollmann et al. 2012, Sun et al. 2014). My dissertation research pushed the envelope of population modeling by using camera trap data, in combination with these recent advances in ecological modeling, to evaluate northern Botswana s wildlife community (n = 44 species), with a focus on the carnivore guild. I chose to carry out my dissertation research in northern Botswana, where the Okavango Delta is located, because it has one of the highest diversities of carnivores found anywhere in Africa (Figure 1.1) and is a stronghold for many wildlife populations (Fig. 1.1; Gittleman et al. 2001). The large carnivore guild, which includes lions, cheetahs (Acinonyx jubatus), leopards (Panthera pardus), African wild dogs, spotted hyenas (Crocuta crocuta), and brown hyenas (Hyaena brunnea), is the most diverse assemblage of large (>15 kg) carnivores in the world (Dalerum et al. 2008). Accompanying the carnivores is a wide array of herbivores including high densities of African elephants (Loxodonta africana), Burchell s zebras (Equus burchelli), and impalas (Aepyceros
19 5 melampus). These wildlife populations may be under threat, however, as Botswana has recently reported declining wildlife populations, increasing pressures from illegal hunting, and large scale changes in land use and land management policies. The perceived loss of biodiversity is of concern to the country as wildlife has both cultural and economic value; the wildlife-based tourism industry is a large contributor to Botswana s Gross Domestic Product (World Travel and Tourism Council 2015). In response to these reports, Botswana s Ministry of Environment, Wildlife, and Tourism temporarily banned wildlife hunting, which generated $20 million per year (Lindsey 2010), in early The Ministry also announced that they will be implementing additional management actions targeted at conserving wildlife. To develop these actions, information on Botswana's wildlife populations is needed. Currently, there is no large scale monitoring of carnivores in Botswana and knowledge of many wildlife species is lacking. My dissertation research addressed this knowledge gap by evaluating the distributions, densities, and ecology of the wildlife community in northern Botswana, with a focus on terrestrial carnivores. Specifically, I had three research objectives: 1) quantify species richness, evaluate species distributions, and elucidate community, group, and species-specific responses to human disturbance and environmental variables, 2) test whether the presence of intraguild species or resource availability had a larger influence on the seasonal distributions of carnivore species, and 3) evaluate the utility of using a novel camera trap study design and spatial models for estimating the population densities of multiple, sympatric carnivore species. My research is among the first to use a single camera trapping array, in combination with advanced statistical models, to evaluate the distributions of an entire wildlife community and to simultaneously estimate the densities of multiple carnivore species. Broader application of this framework would likely result in a more comprehensive and efficient use of
20 6 available camera trap data and a better understanding of terrestrial wildlife communities, including the many carnivore species across the world that are experiencing population declines and range contractions due to land-use change, fragmentation, and infrastructure development (Ginsberg 2001, Schipper et al. 2008, Alkemade et al. 2009, Butchart et al. 2010, Ripple et al. 2014). Thus, in addition to providing needed information on the population dynamics and ecology of Botswana s wildlife communities, my dissertation also provides a research framework for multi-species assessments that is applicable to the growing number of camera trap studies worldwide.
21 7 Figure 1.1. Meso- and large carnivore species endemic to northern Botswana including the A) aardwolf (Proteles cristata), B) bat-eared fox (Otocyon megalotis), C), black-backed jackal (Canis mesomelas), D) caracal (Caracal caracal), E) cheetah (Acinonyx jubatus), F) African civet (Civettictis civetta), G) honey badger (Mellivora capensis), H) leopard (Panthera pardus), I) lion (Panthera leo), J) serval (Leptailurus serval), K) spotted hyena (Crocuta crocuta), L) African wildcat (Felis silvestris), M) and African wild dog (Lycaon pictus).

22 8 Figure 1.1. A. B.
23 9 C. D.
24 10 E. F.
25 11 G. H.

26 12 I. J.

27 13 K. L.
28 M. 14
29 15 II. USING CAMERA TRAPPING AND HIERARCHICAL OCCUPANCY MODELLING TO EVALUATE THE SPATIAL ECOLOGY OF AN AFRICAN MAMMAL COMMUNITY Lindsey N. Rich, 318 Cheatham Hall, Department of Fish and Wildlife Conservation, Virginia Tech, Blacksburg, VA , USA. David A.W. Miller, Penn State, 411 Forest Resources Building, Department of Ecosystem Science and Management, University Park, PA 16802, USA. Hugh S. Robinson, Natural Sciences Building 208A, College of Forestry and Conservation, University of Montana, Missoula, MT 59812, USA. J. Weldon McNutt, Botswana Predator Conservation Trust, Private Bag 13, Maun, Botswana. E- mail: Marcella J. Kelly, 146 Cheatham Hall, Department of Fish and Wildlife Conservation, Virginia Tech, Blacksburg, VA , USA. Rich, L. N., D. A. W. Miller, H. S. Robinson, J. W. McNutt, & M. J. Kelly. Using camera trapping and hierarchical occupancy modeling to evaluate the spatial ecology of an African mammal and bird community. Journal of Applied Ecology. DOI: /
30 16 Abstract Emerging conservation paradigms have shifted from single to multi-species approaches focused on sustaining biodiversity. Multi-species hierarchical occupancy modelling provides a method for assessing biodiversity while accounting for multiple sources of uncertainty. We analysed camera trapping data with multi-species models using a Bayesian approach to estimate the distributions of a terrestrial mammal community in northern Botswana and evaluate community, group, and species-specific responses to human disturbance and environmental variables. Groupings were based on two life-history traits: body size (small, medium, large, and extralarge) and diet (carnivore, omnivore, and herbivore). We photographed 44 species of mammals over 6607 trap nights. Camera station-specific estimates of species richness ranged from 8 to 27 unique species and species had a mean occurrence probability of 0.32 (95% credible interval = ). At the community level, our model revealed species richness was generally greatest in floodplains and grasslands and with increasing distances into protected wildlife areas. Variation among species responses was explained in part by our species groupings. The positive influence of protected areas was strongest for extra-large species and herbivores while medium-sized species actually increased in the non-protected areas. The positive effect of grassland/floodplain cover, alternatively, was strongest for large species and carnivores and weakest for small species and herbivores, suggesting herbivore diversity is promoted by habitat heterogeneity. Our results highlight the importance of protected areas and grasslands in maintaining biodiversity in southern Africa. We demonstrate the utility of hierarchical Bayesian models for assessing community, group, and individual species responses to anthropogenic and environmental variables. This framework can be used to map areas of high conservation value and predict impacts of land-use change. Our approach is particularly applicable to the growing
31 17 number of camera trap studies worldwide and we suggest broader application globally will likely result in reduced costs, improved efficiency, and increased knowledge of wildlife communities. Key-words: biodiversity, body size, camera trap, diet, grasslands, hierarchical Bayesian models, human disturbance, multi-species modelling, protected areas, species richness
32 18 Introduction Prioritizing conservation actions, quantifying the impacts of management decisions, and designating protected areas are just a few of the challenging tasks faced by wildlife managers and conservationists. To address these tasks, surrogate species are often used (Carroll, Noss & Paquet 2001; Epps et al. 2011) such that by focusing on the requirements of the surrogate, the needs of an entire community are addressed (Lambeck 1997). This concept, however, is widely debated given that actions aimed at conserving a single species have positive and negative effects on a wealth of other non-target species (Simberloff et al. 1998; Wiens et al. 2008). As a result, emerging conservation and management paradigms favour multi-species vs. single species approaches where the objective is sustaining biodiversity and ecosystem functions (Yoccoz, Nichols & Boulinier 2001; Balmford et al. 2005). Multi-species hierarchical occupancy models (Dorazio & Royle 2005), a recent advancement in community modelling, can be used to evaluate the spatial ecology of wildlife communities. As occupancy models (MacKenzie et al. 2002), they account for imperfect detection by using temporally or spatially replicated data collected in a time period during which populations are assumed to be geographically closed. As hierarchical models, they integrate data across species, permitting composite analyses of communities, species groups, and individual species (Russell et al. 2009; Zipkin, DeWan & Royle 2009). Sharing data across species leads to increased precision in estimates of species richness and species-specific occupancy, particularly for rare and elusive species (Zipkin et al. 2010). Multi-species hierarchical models can also be parameterized with variables hypothesized to influence the distributions of wildlife, allowing evaluation of how these variables affect wildlife communities, groups of species, or a species of concern (Russell et al. 2009).
33 19 The spatial ecology of wildlife is often shaped by human disturbance. Increasing human populations and the corresponding demand for land has resulted in land-use change, fragmentation, and infrastructure development being some of the greatest threats to biodiversity (Alkemade et al. 2009). One of the most prevalent forms of land-use change is conversion of wildlands to agriculture. Agricultural expansion has resulted in losses of 20 50% of forested land and 25% of grasslands globally (DeFries, Foley & Asner 2004). To combat the loss of wildlands and associated biodiversity, 12.7% of the Earth s land area has been designated as protected (Bertzky et al. 2012). The success of conserving biodiversity in these protected areas, however, is mixed (Western, Russell & Cuthill 2009; Craigie et al. 2010; Kiffner, Stoner & Caro 2013). In Kenya, for example, wildlife has declined at similar rates inside and outside of protected areas (Western, Russell & Cuthill 2009), whereas in Tanzania, species within protected areas fare better (Stoner et al. 2007). Land-use change may also lead to construction of artificial barriers such as roads and fences which can alter animal movements and fragment ecosystems (Forman & Alexander 1998; Hayward & Kerley 2009). The impacts of roads on wildlife vary widely, with increased human and vehicle activity often leading to increases in road mortality, edge effects, and both legal and illegal hunting pressure (Forman & Alexander 1998). The impact of fences, in contrast, depends on the type of fence and purpose (Hayward & Kerley 2009). Fences can minimize threats from humans and domestic animals but if erected with little regard to wildlife movements, the result can be mass-mortality of migrating ungulates (Hayward & Kerley 2009). The spatial ecology of wildlife is also shaped by environmental features such as access to water, food availability, and vegetation cover. For example, occupancy of mammals often declines with increasing distance to permanent water (Pettorelli et al. 2010; Epps et al. 2011;
34 20 Schuette et al. 2013). Mesic habitats such as seasonal floodplains, however, tend to be characterized by relatively tall, less nutritious grass species (Hopcraft et al. 2012), which could result in grazing species preferring areas further from permanent water. The influence of vegetation cover, alternatively, is likely to be species-specific (Estes et al. 1991). Within the African carnivore guild, for example, black-backed jackals Canis mesomelas often avoid floodplains and grasslands (Kaunda 2001) whereas servals Leptailurus serval prefer these land covers (Pettorelli et al. 2010; Schuette et al. 2013). A species response to ecological variables may also be influenced by their life-history traits. Theory suggests, for example, that larger-bodied species in trophic groups at the top of the food chain (e.g. large carnivores) are more likely to decline than lower trophic guild species under similar conditions (Gaston & Blackburn 1996; Davies, Margules & Lawrence 2000). Lifehistory characteristics of species at high trophic levels, including low population densities, high food requirements, and large home ranges, make them particularly vulnerable to persecution and fluctuating environments (Gard 1984; Ripple et al. 2014). Large-bodied animals are also targeted by trophy hunters (Packer et al. 2009) and bushmeat hunters (Fa, Ryan & Bell 2005). Consequently, we would expect large-bodied species near the top of the food chain to show greater sensitivity to anthropogenic and environmental changes. In this study, we explore the utility of camera trap surveys and multi-species hierarchical models to inform biodiversity management. We applied our multi-species approach to a community of mammals in the Okavango Delta, Botswana a World Heritage Site that is home to abundant wildlife including some of Africa s most endangered mammals. Better understanding of the spatial ecology of the mammal community will allow managers to more fully balance gains against losses when managing the diversity of wildlife (Western et al. 2009;
35 21 Zipkin et al. 2009). Additionally, our research was motivated by the lack of broad-scale wildlife community studies. Community-level studies generally focus on a particular guild of species such as carnivores (Pettorelli et al. 2010; Schuette et al. 2013) or ungulates (Stoner et al. 2007; Western, Russell & Cuthill 2009; Kiffner, Stoner & Caro 2013). Our study is among the first to evaluate the distributions of all terrestrial mammals >0.5 kg, excluding rodents. Our specific objectives were to quantify species richness, evaluate species distributions, and elucidate community, group, and species-specific responses to human disturbance and environmental variables. We hypothesized: (i) species richness, group richness, and speciesspecific occupancy would be inversely related to human disturbance with large-bodied wildlife and carnivores expected to show the strongest relationships (Epps et al. 2011; Hopcraft et al. 2012; Schuette et al. 2013) and (ii) environmental conditions related to occupancy, in comparison with human disturbance, would be unique to each species and have weaker community and group-level effects. Our research aims to provide a better understanding of how environmental features and anthropogenic pressures are impacting species distributions in southern Africa. Additionally, our analysis framework is applicable to the growing number of camera trap studies worldwide and could be applied to various land use related activities including mapping areas of high conservation value, predicting the effects of human development, and providing guidance for management strategies aimed at sustaining biodiversity. Materials and methods Study area
36 22 Our study was carried out in Ngamiland District of Northern Botswana, where the Okavango Delta and the northern reaches of the Kalahari Desert are located. The area (ca 550 km 2 ; 19 31ʹS 23 37ʹE) included a mixture of floodplains/grasslands, acacia woodland savannas, mopane Colophospermum mopane shrub and woodlands, and mixed shrublands. Our study site included the eastern section of Moremi Game Reserve, wildlife management areas NG33/34, and part of the livestock grazing areas of Shorobe (Fig. 2.1). Wildlife was fully protected within Moremi Game Reserve and partially protected within the wildlife management areas under a policy known as community-based natural resource management (Mbaiwa, Stronza & Kreuter 2011). Both areas were primarily used for photographic tourism. Moremi, however, was open to selfdrive tourists and safari companies whereas the wildlife management areas were only accessible to Sankuyo community members and safari companies with leases in the area. Consequently, the game reserve had higher human activity (x = 6 vehicles per day per camera station) than the wildlife management areas (x = 2 vehicles per day per camera station). The wildlife management areas were separated from adjacent livestock grazing areas by an extensive 1.3-m high cable veterinary fence that was erected to prevent the transmission of foot-and-mouth disease from Cape buffalo Syncerus caffer to cattle (Keene-Young 1999). The fence aids in minimizing the impacts of human disturbance within the protected areas by helping to constrain livestock and humans to the livestock grazing areas. Carnivores and other wildlife species, however, commonly pass through the fence (Keene-Young 1999). Wildlife within the management and livestock areas could be legally killed when the animal posed a threat to human life or property (Republic of Botswana Conservation and National Parks Act 2001). Camera trap survey
37 23 We deployed Panthera v4 incandescent-flash and Bushnell TrophyCam infra-red camera traps at 221 locations across our 550-km 2 study area between February and July 2015 (Fig. 2.1). We used 5-km 2 grid cells to guide the placement of cameras. To increase our probability of photographing wildlife, we placed cameras on sand roads because wildlife species including large predators, carrion feeders, and small mammals often use lightly-travelled roads as movement corridors (Forman & Alexander, 1998). We deployed two camera stations within each grid cell, one on the road closest to the predetermined centre point of each grid cell and the second on the road closest to a predetermined random point within each grid cell. We used a rotational system for camera deployment. We divided our study area into five, ~110 km 2 subareas and sequentially sampled each area for 30 nights. We deployed an average of 44 camera stations (i.e. 88 cameras) within each sub-area. Each camera station included two opposing cameras mounted on trees. If there were no trees available, we mounted cameras on metal fence posts hammered into the ground. We secured cameras at knee height and positioned cameras to photograph flanks of passing animals. We programmed cameras to take three photos when triggered in the day with a delay of 30 seconds between photo events. At night-time, the infra-red cameras took three photos when triggered but the flash cameras could only take one photo every 15 seconds due to the flash having to re-charge. We checked cameras every 5 10 days to download photos, replace batteries, and ensure cameras were operational. Covariates We hypothesized the spatial distributions of wildlife may be influenced by two measures of human disturbance: human/vehicle capture rate and distance into the wildlife area. We did not
38 24 include distance to human development as the majority of human development was concentrated in the livestock area. To calculate human/vehicle capture rate, we determined the mean number of photo events of humans travelling by foot, donkey, horse, and vehicles per trap night for the respective camera station. Next, in ArcMap (ESRI, CA, USA), we calculated distance into the wildlife area as the distance (km) from each camera station to the veterinary fence that separated wildlife and livestock areas. For camera stations within the livestock area, we gave distances a negative value to reflect how far removed they were from the wildlife area. In addition to human disturbance, we hypothesized environmental variables including vegetation cover and distance to water may influence spatial distributions of wildlife. To quantify vegetation cover, we used a habitat map created by Bennitt, Bonyongo & Harris (2014). The dominant vegetation cover included floodplains/grasslands and mopane shrub and woodlands. For each of these vegetation covers, we calculated percentage cover within a 1-km buffered area surrounding each camera station. A 1-km buffer size provides information on the general conditions surrounding the camera station applicable to our suite of variably sized species. Floodplains/grasslands and mopane were highly correlated (Pearson r = -0.76) so we only retained floodplains/grasslands for our analyses. We estimated distance to water by calculating the distance (km) from each camera station to the nearest permanent water source including rivers, ponds, lagoons, and large pans. We were unable to account for seasonal water sources. Finally, we hypothesized human/vehicle capture rate, road density, and vegetation density may influence a species probability of being photographed. To calculate road density, we georeferenced all roads and calculated road density for the area immediately surrounding each camera station (i.e. 250-m buffered area) in ArcMap. To measure vegetation density
39 25 around camera stations, we took two photographs at knee height, pointed at 90º and 270º in relation to the road. We took these photos at the camera station, 50 m up the road and 50 m down the road for a total of six photos per station. We then digitally placed a grid over each photo and counted the number of grid cells that were 50% covered by forbs, shrubs, or trees. We divided this count by the total number of grid cells and used the mean value across the six photos as our estimate of vegetation density for the respective camera station. Modeling framework We used multi-species hierarchical occupancy modelling (Dorazio & Royle 2005) to estimate the probability species i occurred within the area sampled by a camera station during our survey period (i.e. occurrence), while accounting for incomplete detection (MacKenzie et al. 2002). Specifically, we defined occurrence, zi,j,, as a binary variable where zi,j = 1 if camera station j was within the range occupied by species i and 0 otherwise. We assumed zi,j was a Bernoulli random variable, zi,j ~ Bern(ψij), where ψij is the probability that species i occurred at camera station j. Distinguishing the true absence of a species from the non-detection of a species (i.e. species present but not photographed) requires spatially or temporally replicated data. We treated each trap day as a repeat survey at a particular camera station resulting in ~30 sampling occasions per camera station. We estimated the probability of observing species i at camera station j on trap day k conditional on the site being occupied as xi,j,k ~ Bern(pi,j,k * zi,j) where pi,j,k was the detection probability of species i at camera station j during trap day k, given species i was truly present at camera station j (MacKenzie et al. 2002). We incorporated site-level characteristics affecting species-specific occurrence and detection probabilities using a generalized linear mixed modelling approach (Dorazio & Royle
40 ; Russell et al. 2009). We followed the protocol of Zipkin, DeWan & Royle (2009) and Zipkin et al. (2010) of fitting a single model with a limited number of covariates for which there was a strong a priori justification. The occurrence probability for species i at camera station j was specified as: logit(ψij) = α0i + α1i(human/vehicle trap rate)j + α2i(wildlife area)j + α3i(floodplains/grasslands)j + α4i(water)j, and detection probability as: logit(pij) = β0i + β1i(road density)j + β2i(vegetation density)j + β3i(human/vehicle trap rate)j We standardized all covariates to have a mean of 0 and standard deviation of 1. Therefore, the inverse logit of α0i and β0i are the occurrence and detection probabilities, respectively, for species i at a camera station with average covariate values. Remaining coefficients (α1i,.., α4i, and β1i,..,β3i) represent the effect of a one standard deviation increase in the covariate value for species i. A species abundance can significantly affect detection probabilities, often resulting in strong, positive correlations between occupancy and detection (Royle & Nichols 2003). As a result, we modelled among species correlation (ρ) between α0i and β0i by specifying the two parameters to be jointly distributed (Dorazio & Royle 2005; Kéry & Royle 2008). We linked species-specific models using a mixed modelling approach. We assumed species-specific parameters were random effects derived from a normally distributed, community-level hyper-parameter (Zipkin et al. 2010). Hyper-parameters specify the mean response and variation among species within the community to a covariate (Kéry & Royle 2008). Specifically, for our community model, the α coefficients were modelled as αi ~ normal( α, σ 2 α) where α is the community-level mean and σ 2 α is the variance (Chandler et al. 2013). We also hypothesized body size and diet may influence how a species responds to the respective
41 27 covariates. Thus, we divided species into body size groups based on mean body mass for males and females (Estes 1991). Groups included extra-large ( 200kg), large (50 200kg), medium (20 50kg), and small (< 20kg) sized species (see Appendix 2.A in Supporting Information). The diet groups included carnivores, herbivores, and omnivores (Estes 1991). To assess group-level effects, we allowed α coefficients to be species-specific and governed by a group-level and community-level hyper-parameter. For our group models, α coefficients were modelled as functions of the community-level mean, group-level mean (body size or diet group), and speciesspecific effect for the respective covariate. We estimated posterior distributions of parameters using Markov chain Monte Carlo (MCMC) implemented in JAGS (version 3.4.0) through program R (R2Jags; Plummer 2011). We generated three chains of iterations after a burn-in of and thinned by 50. For priors, we used a uniform distribution of 0 to 1 on the real scale for α0i and β0i and uniform from 0 to 10 for σ parameters. We used a normal prior distribution with a mean of 0 and standard deviation of 100 on the logit-scale for the remaining covariate effects (α1i,.., α4i and β1i,..,β3i). We assessed convergence using the Gelman-Rubin statistic where values <1.1 indicated convergence (Gelman et al. 2004). During each iteration, the model generates a matrix of camera station and species-specific z values (i.e. an occupancy matrix) where as previously stated, zi,j = 1 if camera station j was within the range occupied by species i and 0 otherwise. To estimate species richness at camera station j, we summed the number of estimated species (i.e. instances where zi = 1 for camera station j) during iteration x. We then repeated this process for each of the iterations and used these values to generate a probability distribution representing camera station-specific species richness (Zipkin et al. 2010). We calculated group-level richness similarly, the only
42 28 difference being that we restricted the estimate to species belonging to the respective group. As an example, the complete specification for the diet group model and how we calculated species and group richness is presented in Appendix 2.B. Results We recorded 8668 detections of 44 species of mammals during our 6607 trap nights. Body size groups included 12 small, 11 medium, 11 large, and 10 extra-large species (Appendix 2.A). Diet groups included 21 carnivores, 18 herbivores, and 5 omnivores (Appendix 2.A). Brown hyaenas Hyaena brunnea (n = 3) and cheetahs Acinonyx jubatus (n = 3) were photographed least often while African elephants Loxodonta africana (n = 1665) and impalas Aepyceros melampus (n = 900) were photographed most often. Community-level and group-level summaries Our camera station-specific estimates of species richness ranged from 8 (95% credible interval = 5 12) to 27 (95% CI = 24 32) unique species (Appendix 2.C), with a mean of 17 (95% CI = 14 20). Species richness was generally greater in the game reserve (x = 20, 95% CI = 17 24) and wildlife management area (x = 17, 95% CI = 14 21) than within the livestock grazing area (x = 13, 95% CI = 10 16). Overall, species had lower detection probabilities in areas with high road density, vegetation density, and human/vehicle trap rates (Table 2.1). Between the human disturbance variables, distance into the wildlife area had the largest impact on community-level species richness, with richness increasing as the camera station s distance into the wildlife area increased (Table 2.1; Fig. 2.2). This positive relationship was most evident for small species,
43 29 extra-large species, and herbivores (Table 2.2; Fig. 2.2). Mean richness of medium-sized species (5 25 kg) and omnivores, conversely, increased in livestock areas (Table 2.2; Fig. 2.2). Between the environmental variables, percentage cover of floodplains/grasslands had the greater impact on community-level species richness, with richness generally increasing as floodplain/grassland cover increased (Table 2.1; Fig. 2.2). Floodplains/grasslands had the strongest influence on richness of large species followed by carnivores and omnivores, and the weakest influence on richness of small species and herbivores (Table 2.2; Fig. 2.2). The richness of all species groups were only weakly related to the camera station s distance from permanent water (Table 2.1, 2.2). Among these relationships, distance to permanent water had the largest influence on richness of extra-large species and omnivores with richness increasing close to permanent water (Table 2.2). The 95% CIs for community-level and many group-level covariate effects overlapped zero (Table 2.1, 2.2), suggesting high variability among species and species groups. This result was not unexpected, given the diversity of species. Gelman-Rubin statistics indicated convergence for all parameters. Species-level summaries The mean probability of occurrence across all species and camera stations was 0.32 (95% CI = ) but this varied dramatically among species, ranging from 0.97 for elephants to 0.04 for brown hyaenas and cheetahs. Daily detection probabilities also varied greatly among species, ranging from 0.01 to Variation among species in occurrence and detection probabilities was correlated, so that species occurring more widely were photographed on a greater proportion of days at individual camera stations (ρ = 0.39, 95% CI = ). Species-specific estimates of occurrence, detection and covariate effects are presented in Appendix 2.A.
44 30 Of the 44 species photographed, 20 were significantly (i.e. 95% CI did not overlap zero) related to distance into the wildlife area (14 positively and 6 negatively) and 23 to percentage cover of floodplain/grassland (15 positively and 8 negatively; Fig. 2.3). In contrast, occurrence of only seven and one species were significantly related to the trapping rate of humans/vehicles and distance to permanent water, respectively (Appendix 2.A). As expected, precision of estimates was lower for species with limited numbers of detections, leading to diffuse posterior distributions for their estimates of covariate effects. Discussion Our research highlights the importance of protected areas and grasslands in maintaining biodiversity in southern Africa (Millenium Ecosystem Assessment 2005; Biggs et al. 2008; Craigie et al. 2010). We found overall species richness was generally greater in floodplains and grasslands and areas located further into protected wildlife areas (Table 2.1; Fig. 2.2). Our results support regional conservation initiatives focused on grasslands as this biome is vulnerable to future land-use pressures (Biggs et al. 2008) and benefits a broad diversity of species, including large-bodied animals that are often threatened by hunting pressure (Fa, Ryan & Bell 2005; Packer et al. 2009). Additionally, over a quarter of the world s grasslands have already been lost (DeFries, Foley & Asner 2004) and the remaining grasslands are threatened by woody encroachment (Ratajczak, Nippert & Collins 2012). Our results also highlight the importance of protected wildlife areas, particularly to small and large-bodied species, herbivores, and carnivores. While the effectiveness of protected areas is mixed (Western, Russell & Cuthill 2009; Craigie et al. 2010; Kiffner, Stoner & Caro 2013), we found livestock areas had lower levels of species richness and that species richness increased with distance into protected areas.
45 31 These results are consistent with the trend of agriculture growth and habitat loss functioning as primary threats to biodiversity worldwide (Millenium Ecosystem Assessment 2005). In northern Botswana, wildlife and livestock areas are separated by the veterinary fence. The fence is positive in that in constrains livestock to the grazing areas, thus serving as an important tool in minimizing the negative impacts of human disturbance within the protected areas. The fence, however, is negative in that it is only permeable to some wildlife species (e.g. carnivores). When it was erected, for example, it cut-off migratory routes of wildebeests Connochaetes taurinus and zebras Equus burchelli and disturbed the movement patterns of additional ungulate species (Hayward & Kerley 2009). If the fence, as a physical boundary, was the underlying cause of increased species richness in wildlife areas, then we would expect species richness to be nearly constant between the core and edge of wildlife areas (Kiffner, Stoner & Caro 2013). Our results showing species richness increasing with distance from the fence, however, (Fig. 2.2) suggest other spatial factors such as land use and human wildlife conflict (e.g. poaching and retaliatory killings) are likely to be contributing drivers of this edge effect (Woodroofe & Ginsberg 1998). Results presented here suggest management of human activities on both sides of protected area borders is essential for minimizing edge effects (Woodroffe & Ginsberg 1998). The weak effects of human/vehicle trap rates and water accessibility on community-level species richness were surprising (Table 2.1). The human/vehicle trap rate results likely reflect that most of our study area was used by tourists or tourism operators, all of whom seek out areas with abundant wildlife. This human disturbance may have had minimal impact on nocturnal species given tourism activities were generally restricted to daylight hours (i.e. via Game Reserve permit rules). Distance to permanent water had a weak effect on species richness in this
46 32 study, in contrast with other studies in Africa (Pettorelli et al. 2010; Epps et al. 2011; Schuette et al. 2013). We found wildlife to be more evenly distributed across the landscape in relation to water availability perhaps because (i) our study took place during the end of the wet season and beginning of the dry season when water was less of a limiting resource, (ii) we were unable to account for ephemeral water sources and (iii) selection of high quantities of grass in wet areas vs. grass with higher nutrition in dry areas is species-dependent (Hopcraft et al. 2012). In addition to community-level effects, our multi-species approach allowed us to evaluate how specific groups of species were influenced by human and environmental factors. If managers wish to focus their efforts on conserving herbivores, for example, our research suggests protected areas and heterogeneity in vegetation types promote herbivore diversity. Similar to overall species richness, we found herbivore richness increased with distance into wildlife areas (Table 2.2; Fig. 2.2). The influence of grassland and floodplain cover, however, was highly variable (Fig. 2.2). Species that are predominantly grazers, such as zebras and impalas, were more likely to use grasslands and floodplains where their food source was abundant. We found small ungulates including steenbok Raphicerus campestris and bush duikers Sylvicapra grimmia, however, had a negative relationship with grasslands and floodplains. These small grazers may select for mixed shrub and mopane-dominated areas because they are adapted to selecting high-quality components of grass allowing them to forage in low biomass areas (Wilmshurst, Fryxell & Colucci 1999). Our research can also be used to predict which groups of species or individual species would be most impacted by increasing levels of human disturbance in and outside of protected areas. As hypothesized, we found extra-large species like giraffes Giraffa camelopardalis and roan antelopes Hippotragus equinus were most sensitive to human disturbance where the
47 33 probabilities of using an area increased with distance into the wildlife area (Table 2.2, Fig. 2.2). The groups of species that would likely be unaffected or positively affected by increasing levels of human disturbance were omnivores and medium-sized species (Fig. 2.2), such as the African civet Civettictis civetta and jackal species (Fig. 2.3). Medium-sized omnivores tend to be generalists that can use a wide array of landscapes and thrive even after extensive human modification (Roemer et al. 2009). Reliable methods for evaluating biodiversity are key to making informed conservation and management decisions (Pettorelli et al. 2010; Zipkin et al. 2010). Equally important is the need to understand how top down (e.g. humans) and bottom up (e.g. vegetation cover) factors influence diversity (Elmhagen & Rushton 2007). Our research demonstrates the utility of camera trap surveys and hierarchical models for assessing community, group, and individual species responses to both anthropogenic and environmental variables. Our study did, however, have some potential limitations. First, our sequential sampling of sub-areas may have violated the model s assumption of geographic closure (MacKenzie et al. 2002). A simulation study based on estimated occupancy and detection probabilities from our pilot season, however, found this sampling design balanced precision of occupancy estimates with survey effort. Second, because we only included camera station-specific covariates, we were unable to account for species-specific measures of predation and competition, which are known to influence species distributions (Caro and Stoner 2003). Lastly, we sampled on sand roads to maximize detection probabilities (Forman and Alexander 1998). If cameras had been placed randomly, we believe the photographic rates of many wildlife species, particularly carnivores, would have been prohibitively low. However, if any species avoided roads, then our sampling design may have resulted in their true occupancy being underestimated.
48 34 Our multi-species approach provides a method for using detection/non-detection data to estimate and evaluate species occupancy and richness that should reduce money, time, and personnel costs, which are critical for many management agencies across the world where field data funding is limited (Zipkin et al. 2009). Camera trap surveys are an ideal field method for community studies on terrestrial species because they photograph every species that passes in front of them. Few studies, however, capitalize on this wealth of community information as attention is typically focused on a single species or guild of species (Stoner et al. 2007; Pettorelli et al. 2010; Schuette et al. 2013). Unlike traditional community analyses, our multi-species approach allowed us to retain species identity while properly accounting for multiple sources of uncertainty (Kéry & Royle 2008; Zipkin et al. 2010). Many of the species in our study had low detection probabilities which, if left unaccounted for, would have resulted in underestimates of species richness and affected estimates of our ecological variables (Zipkin et al. 2010). Additionally, our multi-species approach allowed us to integrate data across species using the community-level hyper-parameter (Dorazio & Royle 2005; Russel et al. 2009; Zipkin, DeWan & Royle 2009). This permitted us to complete a comprehensive assessment of all wildlife species and resulted in increased precision of species-specific occupancy probabilities, particularly for species that were rarely photographed. We suggest that broader application of this approach to camera trap studies worldwide will likely result in a more comprehensive and efficient use of available data and a better understanding of the spatial ecology of all species within the terrestrial wildlife community.
49 35 References Alkemade, R., van Oorschot, M., Miles, L., Nellemann, C., Bakkenes, M. and Brink, B. (2009) GLOBIO3: A framework to investigate options for reducing global terrestrial biodiversity loss. Ecosystems, 12, Balmford, A., Bennun, L., ten Brink, B., Cooper, D., Cote, I.M., et al. (2005) The convention on biological diversity s 2010 target. Science, 307, Bennitt, E., Bonyongo, M.C. & Harris, S. (2014) Habitat selection by African buffalo (Syncerus caffer) in response to landscape-level fluctuations in water availability on two temporal scales. Plos One, 9, e Bertzky, B., Corrigan, C., Kemsey, J., Kenney, S., Ravilious, C., Besancon, C. & Burgess, N.D. (2012) Protected planet report: tracking progress towards global targets for protected areas, IUCN and UNEP-WCMC, Cambridge, UK. Biggs, R., Simons, H., Bakkenes, M., Scholes, R.J., Eickhout, B., vanvuuren, D. & Alkemade, R. (2008) Scenarios of biodiversity loss in southern Africa in the 21 st century. Global Environmental change, 18, Caro, T.M. & Stoner, C.J. (2003) The potential for interspecific competition among African carnivores. Biological Conservation, 110, Carroll, C., Noss, R.F. & Paquet, P.C. (2001) Carnivores as focal species for conservation planning in the Rocky Mountain region. Ecological Applications, 11, Chandler, R.B., King, D.I., Raudales, R., Trubey, R., Chandler, C. & Chávez, V.J.A. (2013) A small-scale land-sparing approach to conserving biological diversity in tropical agricultural landscapes. Conservation Biology, 27,
50 36 Craigie, I.D., Baillie, J.E.M., Balmford, A., Carbone, C., Collen, B., Green, R.E. & Hutton, J.M. (2010) Large mammal declines in Africa s protected areas. Biological Conservation, 143, Davies, K.F., Margules, C.R. & Lawrence, J.F. (2000) Which traits of species predict population declines in experimental forest fragments? Ecology, 81, DeFries, R.S., Foley, J.A. & Asner, G.P. (2004) Land-use choices: Balancing human needs and ecosystem function. Frontiers in Ecology and the Environment, 2, Dorazio, R.M. & Royle, J.A. (2005) Estimating size and composition of biological communities by modeling the occurrence of species. Journal of American Statistical Association, 100, Elmhagen, B. & Rushton, S.P. (2007) Trophic control of mesopredators in terrestrial ecosystems: top-down or bottom-up? Ecology Letters, 10, Epps, C.W., Mutayoba, B.M., Gwin, L. & Brashares, J.S. (2011) An empirical evaluation of the African elephant as a focal species for connectivity planning in East Africa. Diversity and Distributions, 17, Estes, R.D. (1991) The behavior guide to African mammals: including hoofed mammals, carnivores, and primates, The University of California Press, Berkeley. Fa, J.E., Ryan, S.F. & Bell, D.J. (2005) Hunting vulnerability, ecological characteristics and harvest rates of bushmeat species in afrotropical forests. Biological Conservation, 121, Forman, R.T.T. & Alexander, L.E. (1998) Roads and their major ecological effects. Annual Review of Ecology and Systematics, 29,
51 37 Gard, T.C Persistence in food webs. Mathematical ecology (eds S.A. Levin & T.G. Hallam Pages), pp Springer Verlag, Berlin. Gaston, K.J. & Blackburn, T.M. (1996) Conservation implications of geographic range size-body size relationships. Conservation Biology, 10, Gelman, A., Carlin, J.B., Stern, H.S. & Rubin, D.B. (2004) Bayesian Data Analysis, Chapman and Hall, Boca Raton, FL. Hayward, M.W. & Kerley, G.I.H. (2009) Fencing for conservation: restriction of evolutionary potential or a riposte to threatening processes? Biological Conservation, 142, Hopcraft, J.G.C., Anderson, T.M., Pérez-Vila, S., Mayemba, E. & Olff, H. (2012) Body size and the division of niche space: food and predation differentially shape the distribution of Serengeti grazers. Journal of Animal Ecology, 81, Kaunda, S.K.K. (2001) Spatial utilization by black-backed jackals in southeastern Botswana. African Zoology, 36, Keene-Young, R A thin line: Botswana s cattle fences. Africa Environment and Wildlife, 7, Kéry, M. & Royle, J.A. (2008) Hierarchical Bayes estimation of species richness and occupancy in spatially replicated surveys. Journal of Applied Ecology, 45, Kiffner, C., Stoner, C. & Caro, T. (2013) Edge effects and large mammal distributions in a national park. Animal Conservation, 16, Lambeck, R.J. (1997) Focal species: a multi-species umbrella for nature conservation. Conservation Biology, 11, Mbaiwa, J.E., Stronza, A. & Kreuter, U. (2011) From Collaboration to Conservation: Insights from the Okavango Delta, Botswana. Society and Natural Resources, 24,
52 38 MacKenzie, D.I., Nichols, J.D., Lachman, G.B., Droege, S., Royle, J.A. & Langtimm, C.A. (2002) Estimating site occupancy rates when detection probabilities are less than one. Ecology, 83, Millenium Ecosystem Assessment (2005) Ecosystems and Human Well-Being: Biodiversity Synthesis, World Resources Institute, Washington, DC. Packer, C., Kosmala, M., Cooley, H.S., Brink, H., Pintea, L., Garshelis, D., Purchase, G., Strauss, G., Swanson, A., Balme, G., Hunter, L. & Nowell, K. (2009) Sport hunting, predator control and conservation of large carnivores. Plos One, 4, e5941. Pettorelli, N., Lobora, A.L., Msuha, M.J., Foley, C. & Durant, S.M. (2010) Carnivore biodiversity in Tanzania: revealing the distribution patterns of secretive mammals using camera traps. Animal Conservation, 13, Plummer, M. (2011) JAGS: a program for the statistical analysis of Bayesian hierarchical models by Markov Chain Monte Carlo. Available from (accessed August 2015). Ratajzak, Z., Nippert, J.B. & Collins, S.L. (2012) Woody encroachment decreases diversity across North American grasslands and savannas. Ecology, 93, Ripple et al. (2014) Status and ecological effects of the world s largest carnivores. Science, 343, Roemer, G.W., Gompper, M.E., Van Valkenburgh B. (2009) The ecological role of the mammalian mesocarnivore. Bioscience, 59, Royle, J.A. & Nichols, J.D. (2003) Estimating abundance from repeated presence-absence data or point counts. Ecology, 84,
53 39 Russell, R.E., Royle, J.A., Saab, V.A., Lehmkuhl, J.F., Block, W.M. & Sauer, J.R. (2009) Modeling the effects of environmental disturbance on wildlife communities: avian responses to prescribed fire. Ecological Applications, 19, Schuette, P., Wagner, A.P., Wagner, M.E. & Creel, S. (2013) Occupancy patterns and niche partitioning within a diverse carnivore community exposed to anthropogenic pressures. Biological Conservation, 158, Simberloff, D. (1998) Flagships, umbrellas, and keystones: is single-species management passe in the landscape era? Biological Conservation, 83, Stoner, C., Caro, T., Mduma, S., Mlingwa, C., Sabuni, G. & Borner, M. (2007) Assessment of effectiveness of protection strategies in Tanzania based on a decade of survey data for large herbivores. Conservation Biology, 21, Western, D., Russell, S. & Cuthill, I. (2009) The status of wildlife in protected areas compared to non-protected areas of Kenya. Plos One, 4, e6140. Wiens, J.A., Hayward, G.D., Holthausen, R.S. & Wisdom, M.J. (2008) Using surrogate species and groups for conservation planning and management. Bioscience, 58, Wilmshurst, J.F., Fryxell, J.M. & Colucci, P.E. (1999) What constrains daily intake in Thomson s gazelles? Ecology, 80, Woodroffe, R. & Ginsberg, J.R. (1998) Edge effects and the extinction of populations inside protected areas. Science, 280, Yoccoz, N.G., Nichols, J.D. & Boulinier, T. (2001) Monitoring of biological diversity in space and time. Trends in Ecology and Evolution, 16,
54 40 Zipkin, E.F., DeWan, A. and Royle, J.A. (2009) Impacts of forest fragmentation on species richness: a hierarchical approach to community modeling. Journal of Applied Ecology, 46, Zipkin, E.F., Royle, J.A., Dawson, D.K. & Bates, S. (2010) Multi-species occurrence models to evaluate the effects of conservation and management actions. Biological Conservation, 143,
55 41 Table 2.1. Mean (x ) and 95% credible interval (95% CI) estimates of the community-level hyper-parameters hypothesized to influence the probability of use (α) and detection (β) of 44 mammal species in northern Botswana, 2015 Community-level hyper-parameter x 95% CI α1i Human/vehicle trap rate α2i Dist. into wildlife area α3i Floodplain/grassland α4i Dist. to permanent water β1i Road density β2i Vegetation density β3i Human/vehicle trap rate
56 42 Table 2.2. Mean (x ) and 95% credible interval (95% CI) estimates of the group-level hyperparameters hypothesized to influence the probability 44 mammal species used the area sampled by our camera stations in northern Botswana, Body size groups included small (S = < 5 kg), medium (M = 5 25 kg), large (L = kg) and extra-large (XL = 200 kg) species and diet groups included omnivores (Omn), carnivores (Carn) and herbivores (Herb). Body Size Group Diet Group Group x 95% CI Group x 95% CI Human/vehicle trap rate S Omn M Carn L Herb XL Distance into the wildlife area (km) S Omn M Carn L Herb XL Floodplain/grassland (% cover) S Omn M Carn L Herb XL Distance to water (km)
57 43 S Omn M Carn L Herb XL
58 44 Figure Captions Figure 2.1. Our study area including the eastern section of Moremi Game Reserve, wildlife management areas NG33/34, and livestock grazing areas in Shorobe, Botswana. Figure 2.2. Mean, site-specific estimates of overall species richness and the richness of diet and body size (small < 5kg, medium 5 25 kg, large kg and extra-large 200 kg) groups of species in relation to (a) the camera station s distance into a protected wildlife area (negative values indicate camera was in a livestock area) and (b) grassland/floodplain cover. Camera trap survey took place in Ngamiland District, Botswana, Figure 2.3. Standardized beta (specified as α in model) coefficients, and 95% credible intervals, for the influence of distance into the wildlife area (a) and floodplain/grassland cover (b) on the probability a species used an area during our camera trap survey in northern Botswana, Species are arranged in body size groups including small (< 5kg), medium (5 25 kg), large ( kg) and extra-large ( 200 kg)

59 Figure
60 Figure 2.2a. 46
61 Figure 2.2b. 47
62 Figure 2.3a. 48
63 Figure 2.3b. 49
64 50 Supporting Information Additional supporting information: Appendix 2.A. Species-specific probabilities of occurrence, probabilities of detection and the effects of anthropogenic and habitat covariates. Appendix 2.B. Hierarchical group model JAGS code. Appendix 2.C. Camera station-specific estimates of species richness, including overall community, carnivore, omnivore, herbivore, small (< 5kg), medium (5 25kg), large (25 200kg), and extra-large (>200kg) species richness.
65 51 III. CARNIVORE DISTRIBUTIONS IN BOTSWANA SHAPED BY RESOURCE AVAILABILITY AND THE PRESENCE OF INTRAGUILD COMPETITORS/PREDATORS Lindsey N. Rich, 318 Cheatham Hall, Department of Fish and Wildlife Conservation, Virginia Tech, Blacksburg, VA , USA. David A.W. Miller, Penn State, 411 Forest Resources Building, Department of Ecosystem Science and Management, University Park, PA 16802, USA. Hugh S. Robinson, Natural Sciences Building 208A, College of Forestry and Conservation, University of Montana, Missoula, MT 59812, USA. J. Weldon McNutt, Botswana Predator Conservation Trust, Private Bag 13, Maun, Botswana. E- mail: Marcella J. Kelly, 146 Cheatham Hall, Department of Fish and Wildlife Conservation, Virginia Tech, Blacksburg, VA , USA.
66 52 Abstract The compositions of ecological communities are shaped by the interplay between interspecific interactions and species habitat and food requirements. The influence of interspecific interactions is particularly widespread within carnivore guilds, where species must balance the trade-off between resource acquisition and potentially costly encounters with intraguild competitors/predators. We tested whether the presence of intraguild species or resource availability had a larger influence on the seasonal distributions of 10 carnivore species in northern Botswana. Specifically, we deployed 132 camera stations across a 330 km 2 area during the 2014 dry season and 2015 wet season. For each species and season, we developed occupancy models based on resource availability (i.e., prey, vegetation, and water) and on intraguild species (i.e., photographic detection rates of intraguild competitors and predators). We then used k-fold cross-validation to assess the relative predictive ability of each model. Carnivore distributions were generally negatively associated with dense vegetation and contrary to expectations, positively associated with the detection rate of intraguild species. This suggests competitor/predator avoidance did not play a large role in shaping the carnivore community in northern Botswana, which differs from other systems, and may be attributed to differences in habitat, carnivore densities, and prey availability. The predictive ability of our resource availability vs. intraguild species models differed between seasons and among species. Leopard distributions, for example, were best predicted by resource availability during the dry season and by the presence of intraguild species in the wet season. The majority of seasonal distributions were best predicted by the presence of intraguild species or a combination of both resource availability and intraguild species. As environments continually change, studies similar to ours are pertinent as they can be used to monitor distributions of wildlife communities and to better
67 53 understand the relative importance of the diversity of ecological processes impacting wildlife communities. Key words: camera trap, carnivore, community dynamics, intraguild species, occupancy modeling, seasonal distributions
68 54 Introduction Carnivore populations have declined globally due to increasing human populations, widespread habitat loss, and declining prey populations (Gittleman et al., 2001; Ripple et al., 2014; Bauer et al., 2015). African wild dogs (Lycaon pictus), tigers (Panthera tigris), and lions (Panthera leo), for example, have each disappeared from >80% of their historical range (Ripple et al., 2014; Bauer et al., 2015). As the extent and quality of wildlife habitat erodes, information on the distributions of remaining carnivore populations is needed to facilitate informed conservation actions aimed at mitigating declines (Pettorelli et al., 2010). Such information is especially pertinent for mammalian carnivores as they are wide ranging, sensitive to environmental and land use changes, and generally exist at low densities, making them particularly vulnerable to local extinctions (Woodroffe & Ginsberg, 1998; Bauer et al., 2015). The composition of carnivore communities is shaped by the interplay between competitive interactions, and species habitat and food requirements (Rosenzweig, 1966; Holt, 1984). Competitive interactions, both direct (i.e., interference) and indirect (i.e., exploitative), are particularly widespread within the carnivore community, influencing individual behavior, population dynamics, and community structure (Rosenzweig, 1966; Palomares & Caro, 1999; Caro & Stoner, 2003). Typically, competition increases as carnivore species become more similar in habitat selection, diet, activity pattern, and body size (Rosenzweig 1966). Predation and interspecific killing (i.e., killing without eating), alternatively, are more likely among carnivore species with body sizes that differ by a factor of and with overlapping diets (Donadio & Buskirk, 2006). The potential for intraguild interactions can result in spatial and temporal niche partitioning among species, with subordinate species often changing their habitat use to less optimal areas in an effort to minimize encounters with dominant species (Creel &
69 55 Creel, 1996; Durant, 1998; Berger & Gese, 2007). This can result in top predators matching the distributions of their prey, while subordinate predators balance the trade-off between resource acquisition and risk of aggression and kleptoparasitism from larger predators (Palomares & Caro, 1999; Heithaus, 2001). In East Africa, for example, cheetahs (Acinonyx jubatus) and wild dogs, both subordinate competitors, occurred in areas with lower prey densities than areas frequented by lions and spotted hyena (Crocuta crocuta), the dominant competitors (Creel & Creel, 1996; Durant, 1998). When modeling intraguild interactions and community dynamics, it is also vital to account for species decisions regarding habitat use, as habitat selection plays an important role in determining population dynamics and community structure (Brown, Laundré & Gurung, 1999; Heithaus, 2001). Prey density, for example, has been found to be a fundamental driver of carnivore densities and distributions (Carbone & Gittleman, 2002; Hayward, O Brien & Kerley, 2007) as has water availability, with carnivore occupancy often increasing close to permanent water sources (Pettorelli et al., 2010; Epps et al., 2011; Schuette et al., 2013). Vegetation cover and productivity may also influence carnivore distributions, often due to its relationship with prey abundance (Pettorelli et al., 2005). The mammalian carnivore community in northern Botswana is one of the most diverse and complex assemblages of carnivores in Africa (Gittleman et al., 2001; Caro & Stoner, 2003). The strength and frequency of interactions within this diverse carnivore guild likely varies based on resource availability, the respective species resource requirements, and their rank within the intraguild dominance hierarchy (Rosenzweig, 1966; Palomares & Caro, 1999; Heithaus, 2001; Caro & Stoner, 2003). Seasonality may also play a role as the region has distinct wet and dry
70 56 seasons, resulting in pronounced differences in vegetation which in turn, can influence prey availability (Bartlam-Brooks, Bonyongo & Harris, 2011). In this study, we tested whether the presence of intraguild species or resource availability had a stronger influence on the seasonal distributions of 10 carnivore species in northern Botswana. Specifically, for each species and season, we developed occupancy models based on variables pertaining to resource availability (i.e., prey biomass, vegetation cover, vegetation productivity, and water availability) and to the presence of intraguild species (i.e., detection rate of intraguild competitors and predators). We then used k-fold cross-validation to assess the relative predictive ability of each model. The presence of intraguild species may have a larger influence on carnivore distributions than resource availability if, for example, carnivores were avoiding intraguild competitors and predators through spatial partitioning (Durant, 1998; Berger & Gese, 2007). We expected the distributions of carnivores to have a stronger, negative association with the presence of dominant predators, as encounters with these species have a higher associated risk than encounters with competitors (Donadio & Buskirk, 2006). Resource availability, alternatively, may have a larger influence on carnivore distributions than intraguild species if, for example, resources were limited or the species was at the top of the dominance hierarchy. Overall, we predicted the distributions of large carnivores would be predominantly influenced by resource availability whereas the distributions of meso-carnivores would be influenced by both resource availability and the presence of intraguild species (Palomares & Caro, 1999; Heithaus, 2001). Our research aims to provide a better understanding of the relative importance of the diversity of ecological processes impacting wildlife communities. Materials and methods
71 57 Study area Our study was carried out in Ngamiland District of northern Botswana. The area (ca 550 km 2 ; 19 31ʹS, 23 37ʹE; elevation ca 950 m) included a mixture of floodplains/grasslands, acacia woodland savannas, mopane shrub (Colophospermum mopane) and woodlands, and mixed shrublands. Our study site included the eastern section of Moremi Game Reserve and parts of wildlife management areas NG33/34 (Fig. 3.1). Wildlife was fully protected within Moremi Game Reserve and partially protected within the wildlife management areas. Both areas were used for photographic tourism (i.e., no hunting or livestock grazing). The region has two distinct seasons, with rain (~ mm/year) falling almost exclusively during the wet season which generally lasts from November to April. Camera trap survey We deployed Panthera v4 incandescent-flash and Bushnell TrophyCam infra-red camera traps at 132 locations across a 330 km 2 area between August and November 2014 (dry season) and again between February and May 2015 (wet season). We used 5-km 2 grid cells (i.e., 2.24 x 2.24 km) to guide the placement of cameras and ensure systematic coverage of the entire study area. We placed all cameras on sand roads to increase our probability of photographing carnivores given that large predators and carrion feeders often use lightly-traveled roads as movement corridors (Forman & Alexander, 1998). If cameras had been placed randomly or on the extensive network of game trails, we believe our detection rates would have been prohibitively low. We deployed two camera stations within each grid cell, one on the road closest to the predetermined center point of each grid cell and the second on the road closest to a predetermined random point within each grid cell. We used a rotational system for camera deployment to increase our spatial
72 58 coverage where we divided our study area into three, ~110 km 2 sub-areas and sequentially sampled each area for 30 nights. We deployed an average of 44 camera stations (i.e., 88 cameras) within each sub-area. Each camera station included two opposing cameras mounted on trees, offset by m. If there were no trees available, we mounted cameras on metal fence posts hammered into the ground. We secured cameras at knee height and positioned the cameras to photograph flanks of passing animals. We programmed cameras to take three photos at each trigger event in the daytime with a delay of 30 seconds between trigger events. At nighttime, the infra-red cameras took three photos when triggered but the incandescent-flash cameras could only take one photo every 15 seconds due to the flash having to re-charge. For each station, we combined information from the 2 opposing cameras using the time/date stamps on the photographs Covariates We hypothesized resource availability including relative prey availability, vegetative cover, water, and vegetation productivity (i.e., Enhanced Vegetation Index- EVI) may influence the seasonal occupancy patterns of carnivore species. We tested for correlations (r > 0.6) among these covariates using Pearson correlation coefficients. To represent relative prey availability, we used a species-specific surrogate. For each camera station, we estimated the kilograms of prey biomass per trap night by multiplying the number of independent detections of a prey species by its average adult body mass (based on Estes, 1991) and standardized this value by sampling effort (i.e., number of days the camera station was active). Independent detections of a prey species were defined as photo events separated by 30 minutes unless different individuals could be distinguished (e.g., eight individuals in a single photo would be 8 events). We then
73 59 summed biomass values for each prey species of the respective carnivore to obtain our camera station and species-specific estimates of prey biomass. We included prey weighing < 5kg for African civets (Civettictis civetta), wildcats (Felis silvestris), and servals (Leptailurus serval), < 20 kg for black-backed jackals (Canis mesomelas), caracals (Caracal caracal), and honey badger (Mellivora capensis), < 100 kg for leopards (Panthera pardus), kg for wild dogs, and 100 kg for lions and spotted hyenas. The prey species included for each carnivore were based on Estes (1991) and kill site data from the Botswana Predator Conservation Trust (unpublished data). We used this measure of relative prey availability, as compared to estimates of prey occupancy, because it provided more detailed information regarding how frequently a prey species used the area surrounding a camera station. The dominant land covers found within our study area included open floodplains/grasslands and densely vegetated mopane shrub and woodlands. The two land cover types are negatively correlated so we only included one land cover type, mopane, in our analysis. We used a land classification map (Bennitt, Bonyongo & Harris, 2014) to calculate percent mopane cover within a 1km buffered area surrounding each camera station. A 1km buffer size provides information on the general conditions surrounding the camera station applicable to our suite of variably sized species. We estimated distance to water by calculating the distance (km) from each camera station to the nearest permanent water source. Lastly, we also included season-specific estimates of EVI. By measuring infrared reflectance, this satellite-derived measure provides information on the spatial and temporal distribution of vegetation productivity (Pettorelli et al., 2005). We downloaded monthly 30m resolution MODIS EVI data sets from the USGS and NASA land processes distributed active archive center ( We
74 60 used the median values from August through October to represent the dry season and the median values from February through April for the wet season. We also hypothesized the presence of intraguild species, as represented by the detection rate of intraguild competitors and predators, may influence the occupancy patterns of carnivore species. For each season and camera station, we standardized the number of independent detections (photo events separated by 30 minutes) of a carnivore species by sampling effort. For each of our study s target carnivores, we then summed the camera station-specific values for the intraguild species designated as competitors or dominant predators. Species that were similar in weight and diet were designated as competitors and species that were twice the size of the target carnivore were designated as dominant predators. Finally, for detectability, we hypothesized that seasonal vegetation density and vehicle activity may influence a species probability of being photographed (i.e. detection probability). To measure the vegetation density of the area immediately surrounding the camera station during each season, we took photographs at knee height, one pointed at 90º and the other at 270º in relation to the road. We took these photos at the camera station, 50m up the road and in 50m down the road. We then digitally placed a 13 x 15 grid over each photo and determined the proportion of grid cells that were 50% covered by forbs, shrubs, or trees and averaged this across the six photos as our estimate of vegetation density for the respective camera station. To represent human/vehicle activity, we determined the mean number of photo events of vehicles per trap night for the respective camera station. Modeling framework
75 61 We fit standard single season, single species occupancy models in a Bayesian framework to estimate the seasonal distributions of all meso- and large carnivores in our study area (Dorazio & Royle, 2005; MacKenzie et al., 2005). We treated each trap day as a repeat survey at a particular camera station, resulting in ~30 sampling occasions per camera station. We did not use a multiseason model because we wanted to limit the number of parameters and because our research was focused on occupancy probabilities, as compared to local colonization and extinction probabilities. We evaluated four models per species per season, a null (i.e., included detection covariates only), resource availability, intraguild species, and all-inclusive (i.e., all covariates combined) occurrence model. We limited our analysis to these four models given our objective was testing whether resource availability or the presence of intraguild species had a larger influence on the seasonal distributions of carnivores. Our resource availability occurrence (ψ) model for the respective species at camera station j was specified as: logit(ψj) = α0 + α1(prey availability)j + α2(mopane cover)j + α3(water)j + α4(evi)j the intraguild species occurrence model was specified as: logit(ψj) = α0 + α1(competitors)j + α2(predators)j and the detection (p) model associated with all occurrence models was: logit(pj) = β0 + β1(vegetation density)j + β2(human/vehicle activity)j We standardized all covariates to have a mean of 0 and standard deviation of 1. Therefore, the inverse logit of α0 and β0 are the occurrence and detection probabilities, respectively, for the species at a camera station with average covariate values. Remaining coefficients (α1,, α2 or α4 and β1) represent the effect of a one standard deviation increase in the covariate value.. We estimated posterior distributions of parameters using Markov chain Monte Carlo (MCMC) implemented in JAGS (version 3.4.0) through program R (R2Jags; Plummer, 2011).
76 62 We generated 3 chains of 100,000 iterations after a burn-in of 20,000 and thinned by 10. We used non-informative priors including a uniform distribution of 0 to 1 on the real scale for α0 and β0 and uniform from 0 to 10 for standard deviation parameters. We used a normal prior distribution with a mean of 0 and standard deviation of 100 on the logit-scale for the remaining covariate effects. We assessed convergence using the Gelman-Rubin statistic where values <1.1 indicated convergence (Gelman et al., 2004). We used k-fold cross-validation to assess the relative predictive ability of each of the occupancy models (Boyce et al., 2002; Hooten & Hobbs, 2015). We divided the data into 5 randomly chosen subsets; subsets (i.e., data from the same camera stations) were kept consistent for all species- and season-specific analyses. We fit the occupancy model 5-times, each time leaving out one of our data subsets and calculating total deviance for our set-aside data using our parameter estimates from the leave-in data. The model (i.e., null, resource availability, intraguild species, or combined) with the lowest summed deviance for all 5 subsets was considered to have the best model fit. Results We photographed the 10 carnivore species included in our study 1,935 times during our 3,384 trap nights in the 2014 dry season and 1,768 times during our 3,949 trap nights in the 2015 wet season (Fig. 3.2). With the exception of leopards, carnivores were photographed more often in the dry season than in the wet or at similar rates between seasons (Fig. 3.2). Spotted hyenas were photographed most often and servals least (Fig. 3.2). We found spotted hyenas were the most widely distributed carnivores during both seasons (ψ 0.9) whereas black-backed jackals and servals had more restricted distributions (ψ < 0.5; Fig. 3.2). African civets and honey
77 63 badgers were the only species to show differences (i.e., 95% credible intervals, CI, did not overlap) in their estimated occupancy probabilities between seasons, with distributions becoming more restricted in the wet season (Fig. 3.2). The direction and strength of covariate effects from our models pertaining to resource availability and the presence of intraguild species varied between seasons for many of the species (Table 3.1). Caracals and honey badgers, for example, had stronger, positive and negative associations with mopane cover, respectively, in the wet season. Among the covariates, mopane cover had a significant impact (i.e., 95% CI did not overlap zero) on the greatest number of species, with the majority of species being less likely to occupy mopane dominated habitats (Table 3.1). In contrast, the occupancy probabilities of most species were not influenced by relative prey availability (Table 3.1). Contrary to expectations, our intraguild species model revealed that carnivores were generally positively associated with intraguild species, particularly competitors (i.e., species that were similar in weight and diet; Table 3.1). We found that species differed in which occurrence model best predicted the respective carnivore distribution (Table 3.2). During the dry season, our combined model best predicted the distributions of lions and spotted hyena. When comparing just the resource availability and intraguild species models, however, we observed a consistent pattern across large carnivore species where resource availability better predicted species distributions than the detection rate of intraguild competitors and predators (Table 3.2). In contrast, during the wet season, the intraguild species model best predicted distributions of leopards, spotted hyenas and African wild dogs, where species were positively associated with the detection rates of intraguild competitors and predators (Table 3.2). Similarly, the relative influence of intraguild species and/or resource availability on the distributions of meso-carnivores varied between seasons. The
78 64 intraguild species model best predicted the distributions of the majority of meso-carnivores in the dry season while the combined model was generally the best predictive model in the wet season (Table 3.2). Discussion Coexistence and exclusion among intraguild carnivores can be influenced by dietary overlap and competitive ability relative to sympatric species (Durant, 1998; Heithaus, 2001; Donadio & Buskirk, 2006). Many community models of intraguild predation, however, ignore species decisions regarding habitat use despite the important role resource availability plays in shaping intraguild interactions, population dynamics and community structure (Brown et al., 1999; Heithaus, 2001; Carbone & Gittleman, 2002). Our research examined the influence of both the presence of intraguild species and resource availability on the seasonal distributions of 10 carnivore species in northern Botswana. In Botswana, and elsewhere in Africa, many members of the diverse carnivore guild compete for similar prey species (Estes, 1991; Caro & Stoner, 2003; Hayward et al., 2007) resulting in a strong dominance hierarchy where larger members of the guild have been observed killing or harassing smaller members and stealing their kills (Caro & Stoner, 2003). Theory suggests this will result in the top predators matching the distributions of their resources while the subordinate predators balance the trade-off of resource acquisition and risk (Palomares & Caro, 1999; Heithaus, 2001). Temporal partitioning has been suggested as a mechanism for coexistence within the carnivore guild yet in our study area, large carnivores have extensive temporal overlap (Cozzi et al. 2012). Overall, our research found the majority of seasonal carnivore distributions were best predicted by either the detection rate of intraguild species or a combination of both resource availability and intraguild species. Contrary to theory, we found carnivores were generally positively associated with the presence of intraguild species
79 65 and that the wet season distributions of three top predators (i.e., leopards, spotted hyenas and African wild dogs) were best predicted by the detection rate (i.e., there was a positive association) of intraguild competitors and predators. The generally positive associations we found among carnivore species differ from areas such as the Serengeti, where subdominant carnivores can be limited by and often times locally excluded from prey-rich areas by competition with dominant carnivores (Durant, 1998; Creel & Creel, 1996). Previous studies have found that the negative effects of intraguild predation are reduced in structured habitats (Janssen et al., 2007). For example, spotted hyenas are more likely to detect and steal wild dog kills in open areas where visibility is good than in thickly vegetated areas (Gorman et al., 1998). Thus, the divergent evidence of competitor/predator avoidance in the two systems may be attributed to extreme differences in habitat (i.e., the densely vegetated woodland savanna of the Okavango Delta versus the short grass plains of the Serengeti). The influence of intraguild competitors/predators has also been found to vary dependent on species densities, with reduced rates of intraguild predation when species occur at low densities (Holt & Polus, 1997; Heithaus, 2001; Caro & Stoner, 2003). Therefore, we also suggest that differences between the two systems may be attributed to carnivore densities. Lion densities in the Serengeti, for example, average ~0.118 lions km -2 (Cusack et al., 2015), more than double that of our study area (~0.053 lions km -2 ; Cozzi et al., 2013). Carnivore densities in our study area may be below the threshold at which competitor/predator avoidance begins shaping community structure (Holt & Polus, 1997; Palomares & Caro, 1999; Caro & Stoner, 2003). Lastly, the strength and frequency of intraguild interactions varies based on resource availability (Rosenzweig, 1966; Palomares & Caro, 1999; Heithaus, 2001; Caro & Stoner, 2003).
80 66 If prey resources were plentiful in our study area, the influences of intraguild competition and predation may have been minimized. Inferring ecological interactions from our observed patterns of occupancy is challenging as other factors such as the placement of camera traps or our measure of prey availability could influence the observed patterns (MacKenzie et al., 2005). We sampled on sand roads to maximize detection probabilities (Forman & Alexander, 1998). If any species avoided roads, however, then our sampling design may have resulted in their true occupancy being underestimated. Our estimates of prey availability were based on prey detection rates from the camera trap surveys and were found to influence the distributions of a small number of species when compared to photographic trapping rates of intraguild competitors and predators. This suggests detections of intraguild species did a better job representing the distributions of resources (e.g., prey) on the landscape than our estimated measure of prey availability as it is unlikely species actively sought areas occupied by other carnivores, with the possible exception of carrion feeding species (e.g., black-backed jackals and spotted hyenas). Our measure of prey availability did not account for the vulnerability of prey to predation or small mammals and insects, which are a critical part of many meso-carnivore diets (Estes, 1991). We recommend future studies better account for prey availability, potentially through independent field methods such as distance sampling and small mammal trapping, in order to improve model inferences. In general, we found seasonal occupancy patterns of most carnivore species were influenced by a unique combination of resource availability and detection rates of intraguild species. Among the resources included, mopane cover had the largest influence on species distributions where species were generally less likely to occupy areas dominated by mopane shrub and woodlands. This is consistent with previous studies reporting greater biodiversity of
81 67 African mammals in grassland savannas (Oindo & Skidmore, 2002; Rich et al., 2016). In contrast with previous studies (Pettorelli et al., 2010; Epps et al., 2011; Schuette et al., 2013), we found no evidence that permanent water was a significant predictor of carnivore distributions. This is likely because we were unable to account for smaller pans and seasonal, ephemeral water sources. Lastly, we found vegetation productivity, as measured by EVI, was negatively related to lion, honey badger, and wildcat occupancy in the dry season and black-backed jackal occupancy in both seasons. The negative association is likely because at high levels of productivity there is increased production of woody species which can result in reduced plant diversity and primary production of grass (Oindo & Skidmore, 2002). This, in turn, may result in lower occupancy of the many prey species that select for open grasslands and floodplains (Rich et al., 2016). The composition of ecological communities is shaped by the interplay between competitive interactions and species habitat and food requirements (Rosenzweig, 1966; Holt, 1984). Supporting this, our research found that close to half of the seasonal carnivore distributions were best predicted by models that accounted for both resource availability and the presence of intraguild species. The generally positive associations that we found among intraguild species suggests competitor/predator avoidance did not play a large role in shaping carnivore community structure in northern Botswana. In the future, however, this may change. As Botswana becomes hotter and drier and human development increases (Hulme et al., 2001), carnivore densities and vegetation structure will likely change, both of which could influence the strength of intraguild interactions (Holt & Polus, 1997; Gorman et al., 1998; Caro & Stoner, 2003; Janssen et al., 2007). As environments continually change, studies similar to ours are pertinent as they can be used to monitor distributions of wildlife communities and elucidate the
82 68 combined influences of resource availability and the presence of intraguild species. A comprehensive knowledge of how wildlife responds to dynamic ecosystems will enable managers to better predict how system changes may impact carnivore communities, leading to proactive instead of reactive management decisions and more informed conservation planning (Pettorelli et al., 2010). Acknowledgments We thank the government of Botswana, the Ministry of the Environment, Wildlife and Tourism and the Department of Wildlife and National Parks for permission to conduct this study (permit EWT 8/36/4 XXIII 44). We thank Ace Gabanakitso for help in the field, R.H. Walker, L. Van der Weyde, N. Jordan, and K. Golabek at BPCT for assistance, N. Robinson for EVI data and S. Karpanty and K. Alexander for feedback on the manuscript. This research was funded by a Fulbright Study/Research Grant, PEO Scholar Award, Wilderness Wildlife Trust, Columbus Zoo, Cleveland Metroparks Zoo, Wild Felid Association, Idea Wild, Temenos Foundation, The Rufford Foundation, Virginia Tech, and the numerous donors who support the BPCT. References Bartlam-Brooks, H.L.A., Bonyongo, M.C. & Harris, S. (2011) Will reconnecting ecosystems allow long-distance mammal migrations to resume? A case study of a zebra Equus burchelli migration in Botswana. Oryx 45, Bauer, H. et al. (2015) Lion (Panthera leo) populations are declining rapidly across Africa except in intensively managed areas. Proc. Natl. Acad. Sci. U.S.A. 112,
83 69 Bennitt, E., Bonyongo, M.C. & Harris, S. (2014) Habitat selection by African buffalo (Syncerus caffer) in response to landscape-level fluctuations in water availability on two temporal scales. PloS ONE 9, e Berger, K.M. & Gese, E.M. (2007) Does interference competition with wolves limit the distribution and abundance of coyotes? J. Anim. Ecol. 76, Boyce, M.S., Vernier, P.R., Nielsen, S.E. & Schmiegelow, F.K.A. (2002) Evaluating resource selection functions. Ecol. Model. 157, Brown, J.S., Laundré, J.W. & Gurung, M. (1999) The ecology of fear: optimal foraging, game theory, and trophic interactions. J. Mammal. 80, Carbone, C. & Gittleman, J.L. (2002) A common rule for the scaling of carnivore density. Science 295, Caro, T.M. & Stoner, C.J. (2003) The potential for interspecific competition among African carnivores. Biol. Conserv. 110, Cozzi, G., Broekhuis, F., McNutt, J.W. & Schmid, B. (2013) Density and habitat use of lions and spotted hyenas in northern Botswana and the influence of surveys and ecological variables on call-in survey estimation. Biodivers. Conserv. 22, Creel, S. & Creel, N.M. (1996) Limitation of African wild dogs by competition with larger carnivores. Conserv. Biol. 10, Cusack, J.J., Swanson, A., Coulson, T., Packer, C., Carbone, C., Dickman, A.J., Kosmala, M., Lintott, C. & Rowcliffe, J.M. (2015) Applying a random encounter model to estimate lion density from camera traps in Serengeti National Park, Tanzania. J. Wildl. Manage. 79,
84 70 Donadio, E. & Buskirk, S.W. (2006) Diet, morphology, and interspecific killing in Carnivora. Am. Nat. 167, Dorazio, R.M. & Royle, J.A. (2005) Estimating size and composition of biological communities by modeling the occurrence of species. Journal of American Statistical Association 100, Durant, S.M. (1998) Competition refuges and coexistence: an example from Serengeti carnivores. J. Anim. Ecol. 67, Epps, C.W., Mutayoba, B.M., Gwin, L. & Brashares, J.S. (2011) An empirical evaluation of the African elephant as a focal species for connectivity planning in East Africa. Divers. Distrib. 17, Estes, R.D. (1991) The behavior guide to African mammals: including hoofed mammals, carnivores, and primates. Berkeley: The University of California Press. Forman, R.T.T. & Alexander, L.E. (1998) Roads and their major ecological effects. Annu. Rev. Ecol. Syst. 29, Gelman, A., Carlin, J.B., Stern, H.S. & Rubin, D.B. (2004) Bayesian Data Analysis. Boca Raton: Chapman and Hall. Gittleman, J.L., Funk, S.M., Macdonald, D. & Wayne, R.K. (2001) Carnivore Conservation. Cambridge: Cambridge University Press. Gorman, M.L., Mills, M.G., Raath, J.P. & Speakman, J.R. (1998) High hunting costs make African wild dogs vulnerable to kleptoparasitism from hyaenas. Nature 391, Hayward, M.W., O Brien, J. & Kerley, G.I.H. (2007) Carrying capacity of large African predators: Predictions and tests. Biol. Conserv. 139,
85 71 Heithaus, M.R. (2001) Habitat selection by predators and prey in communities with asymmetrical intraguild predation. Oikos 92, Holt, R.D. (1984) Spatial heterogeneity, indirect interactions, and the coexistence of prey species. Am. Nat. 124, Holt, R.D. & Polis, G.A. (1997) A theoretical framework for intraguild predation. Am. Nat. 149, Hooten, M.B. & Hobbs, N.T. (2015) A guide to Bayesian model selection for ecologists. Ecol. Monogr. 85, Hulme, M., Doherty, R., Ngara, T., New, M. & Lister, D. (2001) African climate change Clim. Res. 17, Janssen, A., Sabelis, M.W., Magalhaes, S., Monterrat, M. & van der Hammen, T. (2007) Habitat structure affects intraguild predation. Ecology 88, MacKenzie, D.I., Nichols, J.D., Royle, J.A., Pollock, K.H., Hines, J.E. & Bailey, L.L. (2005) Occupancy Estimation and Modeling: Inferring Patterns and Dynamics of Species Occurrence. San Diego: Elsevier. Oindo, B.O. & Skidmore, A.K. (2002) Inter-annual variability of NDVI and species richness in Kenya. International Journal on Remote Sensing 23, Palomares, F. & Caro, T.M. (1999) Interspecific killing among mammalian carnivores. Am. Nat. 153, Pettorelli, N., Vik, J.O., Mysterud, A., Gaillard, J.M., Tucker, C.J. & Stenseth, N.C. (2005) Using the satellite-derived NDVI to assess ecological responses to environmental change. Trends Ecol. Evol. 20,
86 72 Pettorelli, N., Lobora, A.L., Msuha, M.J., Foley, C. & Durant, S.M. (2010) Carnivore biodiversity in Tanzania: revealing the distribution patterns of secretive mammals using camera traps. Anim. Conserv. 13, Plummer, M (2011) JAGS: a program for the statistical analysis of Bayesian hierarchical models by Markov Chain Monte Carlo. Available from (accessed August 2015). Rich, L.N., Miller, D.A.W., Robinson, H.S., McNutt, J.W. & Kelly, M.J. (2016) Using camera trapping and hierarchical occupancy modeling to evaluate the spatial ecology of an African mammal and bird community. J. Appl. Ecol. DOI: / Ripple, W. J. et al. (2014) Status and ecological effects of the world s largest carnivores. Science 343, Rosenzweig, M.L. (1966) Community structure in sympatric Carnivora. J. Mammal. 47, Schuette, P., Wagner, A.P., Wagner, M.E. & Creel, S. (2013) Occupancy patterns and niche partitioning within a diverse carnivore community exposed to anthropogenic pressures. Biol. Conserv. 158, Woodroffe, R. & Ginsberg, J.R. (1998) Edge effects and the extinction of populations inside protected areas. Science 280,
87 73 Table 3.1. Covariate effects and the corresponding standard errors on carnivore species probabilities of occupancy during the dry season of 2014 (August November) and wet season of 2015 (February April) in Ngamiland District, Botswana. Resource availability model Intraguild interactions model Species Mopane EVI Water Prey Competitors Predators Large carnivores Leopard -0.7 (0.72) 0.3 (0.53) -0.3 (0.33) 1.1 (1.15) 1.2 (1.01) 0.5 (0.48) Lion -2.2 (0.91) * -1.1 (0.67) * -0.9 (0.54) 0.5 (0.62) -0.4 (0.27) Spotted hyena 0.9 (0.82) 0.2 (0.96) -0.5 (0.59) 1.4 (1.21) 0.9 (0.74) Wild dog -1.3 (1.32) 0.8 (1.16) -0.6 (0.99) 1.2 (2.79) 1.1 (1.01) 0.4 (1.20) DRY SEASON Meso-carnivores BB jackal a -1.0 (0.43) * -2.1 (0.73) * -0.5 (0.37) 0.0 (0.36) 1.0 (0.35)* 0.1 (0.24) Caracal 0.4 (0.32) 0.1 (0.34) 0.2 (0.35) 0.1 (0.27) 0.1 (0.35) 1.4 (0.77)* Civet -1.3 (0.33) * 0.1 (0.29) -0.3 (0.27) 0.0 (0.25) -0.7 (0.41)* 0.6 (0.44) Honey badger 0.2 (0.58) -1.0 (0.56) * -0.7 (0.48) 2.2 (1.13) * 0.5 (0.39) 0.1 (0.37) Serval -2.2 (0.61) * -0.4 (0.39) -0.8 (0.48) -0.6 (0.34) 1.3 (0.53)* 0.6 (0.56) Wildcat -0.3 (0.40) -1.9 (0.64) * 2.3 (1.07) * -0.1 (0.35) 1.5 (0.79) * 0.0 (0.29)
88 74 Leopard -1.0 (0.88) 0.5 (0.84) 0.1 (0.81) 2.3 (2.32) 1.5 (1.65) 3.3 (1.47) * Large carnivores Lion -2.3 (0.89) * -0.8 (0.79) 0.3 (0.66) 2.3 (1.62) * 1.2 (1.21) Spotted hyena 0.0 (0.37) 0.1 (0.34) -0.2 (0.38) 1.8 (0.84) * 2.2 (0.86) * Wild dog 1.3 (1.20) -0.8 (0.82) 1.5 (1.11) 1.7 (1.50) 0.2 (0.69) 1.3 (0.62) * WET SEASON Meso-carnivores BB jackal a -0.6 (0.28) * -1.0 (0.28) * 1.1 (0.35) * 0.4 (0.28) 0.4 (0.23) * 0.1 (0.20) Caracal 0.9 (0.89) * -0.5 (0.31) -0.1 (0.52) -0.1 (0.49) 0.2 (0.43) -0.3 (0.29) Civet -1.7 (0.35) * -0.5 (0.29) -0.5 (0.30) 0.1 (0.27) 1.5 (0.45) * -0.1 (0.23) Honey badger -0.7 (0.25) * -0.1 (0.21) 0.1 (0.23) -0.0 (0.22) 1.5 (0.45) * -0.1 (0.23) Serval -5.2 (4.63) * -0.6 (1.20) -0.8 (1.41) 4.5 (7.48) 3.9 (1.61) * -0.2 (0.56) Wildcat -0.3 (0.36) 0.3 (0.31) 0.2 (0.33) 0.8 (0.64) 1.5 (0.73) * 0.3 (0.31) a BB jackal = black-backed jackal *95% credible interval did not overlap 0.0
89 75 Table 3.2. Comparison of deviance statistics ( deviance, model with lowest deviance value has best model fit) for models used to predict carnivore occupancy ( ) probabilities during the 2014 dry season and 2015 wet season in Ngamiland District, Botswana. We compared null (no covariates), resource availability ( covariates = mopane, prey, water, EVI), intraguild interactions ( covariates = detection rate of intraguild competitors and predators), and combined ( covariates = all covariates) models. Large carnivores Meso-carnivores Leopard Lion Spotted hyena 2014 Dry Season Wild dog 2015 Wet Season Black-backed jackal Caracal African civet Honey badger Serval Wildcat Null Resource availability Intraguild interactions Combined Null Resource availability Intraguild interactions Combined
90 76 Figure Captions Figure 3.1. Our camera trap survey was carried out in the eastern section of Moremi Game Reserve and wildlife management areas NG33/34, Botswana, Figure 3.2. Mean estimated probabilities of occupancy, corresponding 95% credible intervals, and raw numbers of independent photo detections for meso- and large carnivores during camera trap surveys in Ngamiland District, Botswana during the 2014 dry season and 2015 wet season.

91 Figure

92 Figure
93 79 IV. MODELING DENSITIES OF SYMPATRIC SPECIES: A MULTISPECIES PHOTOGRAPHIC CAPTURE-RECAPTURE APPROACH Lindsey N. Rich, 318 Cheatham Hall, Department of Fish and Wildlife Conservation, Virginia Tech, Blacksburg, VA , USA. LindseyRich83@gmail.com David A.W. Miller, Penn State, 411 Forest Resources Building, Department of Ecosystem Science and Management, University Park, PA 16802, USA. dxm84@psu.edu Hugh S. Robinson, Natural Sciences Building 208A, College of Forestry and Conservation, University of Montana, Missoula, MT 59812, USA. hrobinson@panthera.org J. Weldon McNutt, Botswana Predator Conservation Trust, Private Bag 13, Maun, Botswana. E- mail: tico@bpctrust.org Marcella J. Kelly, 146 Cheatham Hall, Department of Fish and Wildlife Conservation, Virginia Tech, Blacksburg, VA , USA. makelly2@vt.edu
94 80 Abstract Abundance and density of wildlife populations are fundamental parameters needed for management and conservation planning. Information on carnivore populations, however, is often scarce due to their wide ranging and elusive nature. Camera trap surveys, in combination with capture-recapture techniques, have consequently emerged as an increasingly common method for estimating the density of carnivore species that have uniquely identifiable individuals. Our research expanded this approach from single to multispecies assessments. Specifically, we evaluated the utility of using a novel camera trap study design and newly developed capture-recapture techniques for simultaneously estimating the population densities of 7 carnivore species in Botswana. We deployed camera traps at 221 locations across a 1,154-km 2 area. We sequentially rotated cameras through the study area to increase spatial coverage and spaced cameras at a range of distances to recapture individuals at multiple camera stations and adequately reflect movements of small to wide-ranging species. To estimate density for species where a subset of the population was uniquely identifiable and species where every individual was identifiable, we used, respectively, spatially explicit capture-recapture models with and without unresolved sightings (i.e., photographs only identifiable to the species-level). Lastly, we accounted for varying levels of habitat suitability by modeling density as a function of habitat, specifically, whether the habitat was dominated by mopane shrub and woodlands. Our approach allowed us to simultaneously generate estimates of density for 7 carnivore species with estimates ranging from 1.8 aardwolves/100 km 2 to 12.7 spotted hyenas/100 km 2. Densities were generally higher in non-mopane habitats than in mopane. Our research is the first to use a single camera trap survey, designed to collect spatial capture-recapture information on a diversity of carnivores, and newly developed spatial models to estimate densities of both fully- and partially-marked
95 81 species, while accounting for differential habitat use. Given the recent emergence of conservation paradigms focused on sustaining biodiversity, progressing from single to multispecies photographic capture-recapture assessments is timely. Additionally, broader application of our approach to camera trap studies worldwide would likely result in a better understanding of elusive carnivore communities which is critical to the conservation of the many carnivore species experiencing population declines. Key words: camera trap, carnivore, mark-resight, multispecies, population density, sampling design, spatially explicit capture-recapture
96 82 Introduction Abundance and density of wildlife populations are fundamental quantities in ecology as they are key, baseline parameters needed for management and conservation planning (Efford et al. 2009, Royle et al. 2009). Information on population dynamics of carnivores, however, is often scarce as carnivores range over wide areas and their elusive nature makes them difficult to count directly (Silver et al. 2004, Karanth et al. 2006, Balme et al. 2010). As a result of these challenges, camera traps have become an increasingly common tool for indirectly surveying carnivores. Camera traps do not require human observers, operate 24 hours per day, and photograph everything that passes in front of them, making them an ideal tool for monitoring carnivore communities in remote places (O Brien et al. 2010). When individuals can be identified based on natural (e.g., pelage pattern) or artificial (e.g., ear tag or radio-collar) markings, camera traps provide a method for obtaining large amounts of individual-level information over expansive areas with moderate effort (Karanth and Nichols 1998, Silver et al. 2004). Capture histories detailing when and at which camera stations individuals were photographed can then be analyzed using capture-recapture techniques to estimate population abundance and density (Otis et al. 1978, Williams et al. 2002, Efford et al. 2004, Royle and Young 2008). To date, however, density estimation using photographic capture-recapture techniques has almost exclusively focused on single, uniquely identifiable species such as tigers (Panthera tigris, Karanth and Nichols 1998, Karanth et al. 2006) and jaguars (Panthera onca; Silver et al. 2004, Soisalo and Cavalcanti 2006). Given the recent emergence of conservation and management paradigms focused on sustaining biodiversity (Yoccoz et al. 2001, Balmford et al. 2005), a multispecies photographic capture-recapture
97 83 approach that informs the management and conservation of wildlife communities, as opposed to individual species, is needed. Photographic capture-recapture techniques have been limited to individual species as traditionally, study designs had to be tailored to the movements of the respective species (Karanth and Nichols 1998, Dillon and Kelly 2007, Maffei and Noss 2008, Sollmann et al. 2012). For example, when employing non-spatial capture-recapture approaches it is recommended that trap arrays are at least 3-4 times the size of an individual home range and that cameras are spaced close enough to ensure no individual within the study area has a zero probability of capture (Karanth and Nichols 1998, Maffei and Noss 2008). This precludes simultaneously estimating the densities of multiple species with differing home range sizes and movement patterns (O Brien and Kinnaird 2011). Spatially explicit capture-recapture (SECR) models, alternatively, are much more robust to varying trap array sizes and spacing, relative to animal movement, because they directly incorporate the locations of where individuals were photographed (Sollmann et al. 2012, Sun et al. 2014). SECR models assume the probability of an individual being photographed at a camera station is a decreasing function of the distance between the camera station and the individual s activity center (Borchers and Efford 2008, Royle et al. 2009). This detection function includes two parameters: g0, the detection probability when a camera station is located on an activity center and σ, a spatial scale parameter related to an individual s home range radius (Borchers and Efford 2008, Royle and Young 2008). Estimating g0 and σ requires that some individuals are photographed at multiple camera stations. As long as there is a large enough sample of individuals and spatial recaptures across a range of distances, spatial models exhibit low bias and remain relatively precise (Sollmann et al. 2012, Sun et al.
98 ). This flexibility makes it possible to now design camera trap surveys aimed at estimating densities of multiple species simultaneously (O Brien and Kinnaird 2011, Sollmann et al. 2012). Photographic capture-recapture techniques are also generally limited to individually identifiable species. Recently, however, spatial mark-resight models have been developed to address this limitation (Sollmann et al. 2013, Rich et al. 2014, Efford in press). Spatial markresight models estimate densities of partially marked populations (e.g., from natural marks such as scars and ear nicks or from artificial marks) by incorporating spatial information and data from marked, unmarked, and marked but not identifiable individuals into a single model (Sollmann et al. 2013, Rich et al. 2014). When analyzing spatial mark-resight models using a Bayesian approach, encounter histories are treated as partially latent as only a portion of the population is uniquely identifiable (Chandler and Royle 2013, Sollmann et al. 2013). In the recently developed maximum likelihood approach, alternatively, sightings of marked but not identifiable and unmarked individuals can be pooled into unresolved sighting occasions (Efford in press). This classification may be preferable as it is often difficult to distinguish whether a photo is of a marked but not identifiable or an unmarked animal (e.g. photo is blurry, photo only includes a tail, photographed animal is walking away from the camera). When modeling unresolved sightings, the expected values for these aggregated counts are a function of covariate and detection parameters at the respective camera station (Efford in press). The unresolved sightings do not contribute to the detection histories of marked animals, rather, they inform spatial trends in density and detection (Efford in press). The goal of our research was to use a single camera trap survey, designed to collect spatial capture-recapture information on a diversity of carnivores, and newly developed spatial models to estimate densities of both fully and partially marked species, while accounting for
99 85 differential habitat use. We applied our approach to a community of 7 carnivore species in the Okavango Delta, Botswana. To adequately sample the carnivore populations, we developed a novel camera trapping study design where 1) we sequentially rotated cameras through the study area to increase our spatial coverage and 2) we spaced cameras across a range of distances to capture the movements of species ranging in size from aardwolves (~11 kg; Proteles cristata) to lions (~200 kg; Panthera leo; Table 4.1). To estimate the densities of both fully marked and partially marked populations, we used SECR models with and without unresolved sightings (Efford in press; Borchers and Efford 2008). Lastly, our study area was a mosaic of habitat types with varying levels of suitability for the respective carnivore species (Rich et al. 2016). Thus, we modeled density as a function of the two major habitat types: densely vegetated mopane (Colophospermum mopane) shrub and woodlands and the more open non-mopane areas, which consisted primarily of floodplains and grassland savannas. Methods Study area Our study was carried out in Ngamiland District of Northern Botswana, where the Okavango Delta is located. The area (ca 550 km 2 ; 19 31ʹS 23 37ʹE) has one of the highest diversities of carnivores (n = 24) found anywhere in Africa (Gittleman et al. 2001). Habitat types include, primarily, floodplains, savanna grasslands and mopane shrub and woodlands. Our study site included the eastern section of Moremi Game Reserve, wildlife management areas NG33/34, and part of the livestock grazing areas of Shorobe (Fig. 4.1). The wildlife management areas were separated from adjacent livestock grazing areas by an extensive 1.3-m high cable veterinary fence. The fence constrains livestock to the grazing areas but remains permeable to carnivores and many other wildlife species (Keene-Young 1999). The game reserve and wildlife
100 86 management areas were used primarily for photographic tourism and the livestock area was used for cattle grazing. Camera trap survey and photo classification We deployed Panthera v4 incandescent-flash and Bushnell TrophyCam infra-red camera traps at 221 locations across our 1,154-km 2 study area between February and July 2015 (Fig. 4.1). Our target species included 7 meso- and large carnivores (Table 4.1). Given predators and carrion feeders often use lightly-travelled roads as movement corridors (Forman and Alexander 1998), we placed cameras on sand roads to increase our probability of photographing carnivores. We used 5-km 2 grid cells to guide the placement of cameras. We deployed two camera stations within each grid cell, one on the road closest to the predetermined center point of each grid cell and the second on the road closest to a predetermined random point within each grid cell. This resulted in camera stations being separated by a mean of 735m with the distance to the nearest neighbouring camera station ranging from 212m to 1661m (Fig. 4.2). This survey design ensured that we were able to estimate the spatial scale parameter, σ, for species that varied in the relative extent of their movements. This was consistent with the recommendation that camera stations are spaced closer than twice the estimated value of σ (Sollmann et al. 2012, Sun et al. 2014). Having camera stations separated by a range of distances increased both our likelihood of spatial recaptures (i.e. individuals caught at multiple locations) and our likelihood of adequately reflecting the scale of species movement as needed by the SECR models. We used a rotational system for camera deployment that allowed us to extend our spatial coverage. We divided our study area into five sub-areas and sequentially sampled each area for 30 nights. We deployed an average of 44 camera stations within each sub-area. Camera stations
101 87 included two opposing cameras mounted on trees or, if no trees were available, on metal fence posts that we hammered into the ground. We secured cameras at knee height and positioned cameras to photograph flanks of passing carnivores. We programmed cameras to take three photos when triggered in the day with a delay of 30 seconds between photo events. At nighttime, the infra-red cameras took three photos when triggered but the flash cameras could only take one photo every 15 seconds due to the flash having to re-charge. We checked cameras every 5 10 days to download photos, replace batteries, and ensure cameras were operational. We identified photographic detections of spotted hyenas (Crocuta crocuta), leopards (Panthera pardus), African wild dogs (Lycaon pictus), African civets (Civettictis civetta), servals (Leptailurus serval), and aardwolves to the individual-level using pelage patterns. If we could not identify a photo to the individual level (e.g., image was blurry), we classified the photo as an unresolved sighting. We used WildID (Bolger et al. 2011) to help identify leopards, civets, and servals by pelage patterns; the remaining species were identified by eye. The behavior and space use of many felids differs between sexes (Sollmann et al. 2011). Thus, for leopards, we also distinguished males from females using secondary sexual traits and estimated density for males and females separately. We identified detections of lions to the individual level using natural markings such as ear nicks, whisker spot patterns, scars, and radio-collars (a subset of the population was collared). As with other species, if we could not identify a lion to the individual level, we labelled the photo as an unresolved sighting. Lastly, we identified whether the lion was an adult male (i.e., likely to be a territory holding male), sub-adult male, or female. We restricted our analysis to individuals that appeared to be 2 years of age. Spatial models
102 88 We collapsed daily camera trapping data from our 6-month survey period into 20 sampling occasions such that one occasion consisted of a 7-8 day sampling period. We then created capture history and camera trap input files for each individually identifiable carnivore species for use in package secr (Efford 2016). Species-specific capture histories were matrices in which each photographic detection was a vector including the individual identification, sampling occasion, and camera station of the respective detection. The camera trap input file provided camera stations Cartesian coordinates and sampling histories for each of the 20 sampling occasions; a 1 indicated the camera station was active and a 0 it was not. The trap input file also had camera station-specific estimates of vegetation density (see Rich et al for details). Lastly, we made an input file for photographic detections classified as unresolved. The models do not permit resolved and unresolved sightings in the same sampling occasion. Therefore, we created 5 additional sampling occasions, one corresponding to each of our five sub-areas (from the rotational deployment of cameras). The input file then provided a count of the number of unresolved sightings at each camera station during each of the 5 sampling occasions. The capture history, camera trap, and when appropriate, unresolved sightings files were then joined into a large detection matrix where every detection is georeferenced to a trap location. For individually identifiable species, we assumed the number of photographic detections of individual i at camera station j during sampling occasion k, yijk, was a Poisson random variable with a mean encounter rate λijk (Borchers and Efford 2008, Royle et al. 2009). We modeled the mean encounter rate using a half-normal detection kernel where the shape of the kernel is dependent on g0 and σ. We included vegetation density as a covariate for g0 as it is negatively related to the detection probability of mammals in northern Botswana (Rich et al. 2016). When appropriate, we modeled unresolved sightings as a Poisson variate that had its own baseline
103 89 encounter rate, g0, but shared σ and spatial distribution parameters with other sampling occasions (Efford in press). Density was a derived parameter, calculated by dividing N, the number of activity centers, by the area of S, the state space (Borchers and Efford 2008, Royle et al. 2009). The state space is an area large enough to include the activity centers of all individuals exposed to trapping. To define S, we used buffers surrounding our camera station grid ranging in size from 5km to 25km depending on species-specific estimates of σ (Table 4.2). We modeled density as a function of habitat and had a separate density parameter for the two major habitat types: mopane and non-mopane. To quantify vegetation cover, we used a habitat map created by Bennitt et al. (2014). To develop maximum likelihood density estimates, we fit an inhomogeneous Poisson density by maximizing the full likelihood using the secr package (Efford 2016) implemented in program R (vs 3.2.2). We then calculated density for the entire study area by calculating the area weighted mean density based on habitat; 48% of the study area was covered by mopane shrub and woodlands. Results We recorded 1,765 photographic detections of our 7 focal carnivore species over 6,607 trap nights. Spotted hyenas were photographed most often while aardwolves were photographed least (Table 4.1). Among the marked species, we identified the largest numbers of individual spotted hyenas, African civets, and leopards and the smallest numbers of aardwolves, servals, and lions (Table 4.1). Large, male felids (i.e., leopards and lions) and African wild dogs had the highest recapture rates (Table 4.1). For all species, we photographed at least some individuals at multiple camera stations (Table 4.1). Among the species where all or a subset of individuals
104 90 were uniquely identifiable, African civets and lions were the only species where greater than one-third of the photographic detections were classified as unresolved. When unresolved photos constitute less than 1/3 of the data, they contribute very little to the model and are better left ignored (Efford in press). Consequently, we only included unresolved sightings when estimating the densities of civets and lions. We were able to use our single camera trapping grid to estimate the densities of each of the 7 carnivore species, including species residing at both high and low densities (Table 4.2, Fig. 4.3). With the exception of aardwolves, carnivore densities were higher in non-mopane areas than in mopane areas (Table 4.2). Spotted hyenas (12.7/100 km 2 ) and African civets (13.3/100 km 2 ) had the highest estimated densities compared to aardwolves (1.8/100 km 2 ) and lions (1.9/100 km 2 ), which had the lowest (Table 4.2). Estimated density was 0.00 for servals in mopane areas and aardwolves in non-mopane areas due to low detection rates of these species in the respective habitat type. Male leopards and African civets had the highest estimated baseline encounter rate g0 and wild dogs and spotted hyenas had the largest estimated movement parameter σ. Estimates of g0 and σ were higher for male leopards than for females, supporting our decision to model male and female leopards separately. For lions, however, the estimated movement parameter was similar for adult male lions (σ = 3.8) and young male lions and females (σ = 4.2) so we opted to model all lions together. Discussion An understanding of population densities is needed to mitigate wildlife declines and to implement effective conservation measures. Carnivore population characteristics, in addition to their generally cryptic and elusive nature, make them difficult to count directly. Consequently,
105 91 information on population densities is lacking for many carnivore species across the world (Silver et al. 2004, Pettorelli et al. 2010, Balme et al. 2010). Our research demonstrates the utility of using a single camera trap array, in combination with spatial models, to simultaneously estimate the densities of multiple, sympatric carnivores. Our density estimates for leopards, wild dogs, civets, servals, and aardwolves are the first published population density estimates for these species in Botswana. For our camera trap survey, we maximized the number of spatial recaptures of individuals from each of our study species by spacing cameras across a range of distances. To estimate densities we implemented SECR models with and without unresolved sightings to estimate the densities of species where every individual or only a subset of individuals was uniquely identifiable. This multispecies approach is applicable to camera trap studies worldwide and can be used to gain fundamental insights into the population status and habitat use of entire carnivore communities as compared to single carnivore species. This information is particularly pertinent to the conservation of carnivores considering one-quarter of the world s 245 carnivore species are threatened with extinction and many more are experiencing population declines (Ginsberg 2001, Schipper et al. 2008, Ripple et al. 2014). In contrast to our multispecies approach, photographic capture-recapture techniques almost exclusively focus on estimating the density of a single, uniquely identifiable species, particularly large felids (Karanth and Nichols 1998, Silver et al. 2004, Sollmann et al. 2011). When employing non-spatial capture-recapture techniques, density estimates are strongly influenced by the size of the trap array and the spacing of traps relative to individual movements (Dillon and Kelly 2007, Maffei and Noss 2008, Sollmann et al. 2012). As a result, species with differing home range sizes, movement patterns, and spatial distributions cannot be sampled simultaneously (O Brien and Kinnaird 2011). Spatial density estimators, alternatively, are a
106 92 relatively new class of models that directly incorporate the spatial nature of the sampling process, allowing them to 1) account for differences among individuals in capture probability due to spatial location, 2) directly estimate density, and 3) perform well across a range of camera study designs and animal movements (Borchers and Efford 2008, Sollmann et al. 2012, Sun et al. 2014). Spatial models are robust to varying trap array sizes and spacing, but their ability to produce reliable estimates of animal movement and density depends on the number of individuals photographed and the number of spatial recaptures (i.e., photographic detections of an individual at multiple camera stations). It is therefore recommended that the extent of the sampling array is on scale with the target species home range (Efford et al. 2009, Sollmann et al. 2012). We sampled across a 1,154-km 2 study area to expose a large number of individuals to our camera trap survey. This study area size was larger than the size of a wild dog territory (~ 605 km 2 ), the carnivore species known to have the largest home range size in our study region. We were able to sample such a large area because of our rotational system for camera deployment. This design obtained an adequate number of spatial recaptures while allowing us to sample an area five times larger than if cameras had remained stationary for the entire survey duration. Despite sampling a large area, we still had a relatively small number of photographic detections for two of our study species, serval and aardwolf. In an effort to increase detections for some of the mesocarnivores, it may be advisable to deploy camera stations on and off road. We sampled on sand roads to maximize detection probabilities (Forman and Alexander 1998) because we believed the photographic rates of carnivores would have been prohibitively low if we had deployed cameras randomly or on game trails. However, if species like servals and aardwolves avoided roads, then our sampling design likely resulted in their densities being underestimated.
107 93 To ensure an adequate number of spatial recaptures, it is also recommended that camera stations are spaced closer than twice the estimated value of σ, the spatial scale parameter (Sollmann et al. 2012, Sun et al. 2014). Our camera stations were spaced much closer together (x = 734m) than the minimum recommended spacing of 2400m (based on twice the estimated σ value for serval, the species with the smallest σ estimate; Table 4.2). Camera station spacing ranged from m and our estimates of σ for the 7 carnivore species ranged from m. By having a high density of camera stations spaced at a range of distances, we were able to recapture individuals from each of our study species at multiple camera stations and adequately reflect both the large movements of African wild dogs and the shorter movements of servals. It is possible camera stations could have been spaced wider, but the 95% confidence intervals for g0 and σ show that there was residual variation in these parameters, particularly for species with a limited number of detections. Having a lower density of trapping points within the sampled area may have further reduced precision in parameter estimates (O Brien and Kinnaird 2011). Our camera trap sampling design allowed us to collect enough information to estimate the densities of 7 carnivore species, each with differing home range sizes and movement patterns. Our overall estimates of carnivore densities ranged from 1.8 aardwolf/100 km 2 to 12.7 spotted hyenas/100 km 2. Lions and spotted hyenas are the only carnivore species with published estimates of density in the Okavango Delta (Cozzi et al. 2013). We provide the first published population density estimates for leopards, wild dogs, civets, servals, and aardwolves in Botswana. Our estimates of 10.3 and 14.9 spotted hyenas/100 km 2 in mopane and non-mopane habitat, respectively, are slightly lower than previous estimates (mopane: 12.3 hyenas/100 km 2, floodplains: 16.9 hyenas/100 km 2 ) but previous estimates fall within our 95% confidence
108 94 intervals. Our estimate of 1.9 lions/100 km 2, alternatively, was substantially lower than the previous estimate of 5.8 lions/100 km 2. Cozzi et al. (2013) estimated lion and hyena densities, however, using calling stations. Converting call station responses to population estimates may be limited by the researcher s ability to estimate the proportion of animals that respond, and by accurately calculating the distance from which the species responds to the calling station (Midlane et al. 2015). Consequently, differences in estimated densities are likely attributed to the differing sampling and estimation techniques and not to an actual decline in the study area s lion population. Although wild dog densities have not been estimated explicitly in northern Botswana, our estimates of 1.1 and 3.6 wild dogs/100 km 2 in mopane and non-mopane habitats, respectively, seem reasonable based on known pack sizes (3-14) and home range sizes ( km 2 ) in the area (Pomilia et al. 2015). No density estimates were available for the aardwolf in southern Africa for comparison but our estimates of civet and serval densities were comparable to other density estimates in the region ( civets/100 km 2, servals/100 km 2 ; Amiard 2014, Ramesh and Downs 2013). Our estimated density of 2.5 and 6.8 leopards/100km 2 in mopane and non-mopane habitat, respectively, also fell within the range of estimated leopard densities in southern Africa although previous estimates of leopard density have been based on spoor surveys or non-spatial capture-recapture techniques (Boast and Houser 2012, Balme et al. 2010). Our estimated sex ratio for leopards was approximately 2 female leopards for every 1 male. This aligns with research in eastern Botswana where the territory sizes of female leopards were approximately half the size of a male leopard (Steyn and Funston 209). We had a median of 2 recaptures per female leopard compared to 5 recaptures per male leopard supporting that the
109 95 behavior and space use of felids differs between sexes and should be accounted for when estimating density (Sollmann et al. 2011). In addition to estimating density, the flexibility of spatial models also allows inferences to be drawn about the processes governing locations of individuals (Sollmann et al. 2011). We assumed activity centers followed an inhomogeneous Poisson distribution dependent on habitat and we found species activity centers, with the exception of aardwolf, were concentrated in nonmopane areas. These results highlight the importance of floodplains, grasslands, and acacia woodlands to the carnivore community in northern Botswana. For the large carnivore species, 95% confidence intervals were much larger in mopane than in non-mopane areas reflecting the uncertainty associated with these estimates due to a limited number of individuals photographed and limited number of spatial recaptures in mopane-dominated habitats. If we had assumed a homogeneous distribution of activity centers, our estimates of density would have been biased and we would not have gained valuable insights into species differential habitat use. Our research framework capitalizes on the wealth of information collected by camera traps, the robustness of spatial models in regards to study design, and on recent advances in density estimation. Our multispecies approach provides a repeatable methodology for simultaneously estimating the densities of multiple sympatric carnivore species. We demonstrate the utility of our camera trap study design for collecting spatial capture-recapture information on a diversity of carnivore species and how this data can be assessed using SECR models both with (Efford in press) and without unresolved sightings (Borchers and Efford 2008) to estimate species densities in multiple habitat types. Despite the flexibility afforded by this approach, we only identified one study that used a single camera trapping array to estimate the densities of multiple carnivores but it was restricted to individually identifiable species and assumed
110 96 carnivore densities were uniform across the study area (O Brien and Kinnaird 2011). We utilized recent advances in statistical modeling (Chandler and Royle 2013, Efford in press) to estimate the densities of both uniquely identifiable species and species where only a subset of individuals were marked. Our approach is applicable not only to camera trap surveys, but any type of survey (e.g., hair snares, scat transects, physical capture and marking) that can produce encounter history data with corresponding spatial information about the location of capture (Royle et al. 2009). Field surveys require large financial and logistical efforts in order to obtain adequate data for reliable inference (Sollmann et al. 2011). In a field where money, time, and personnel are generally limited, our multispecies study design will result in considerable savings when compared to multiple field surveys each targeting a single species (O Brien and Kinnaird 2011). Additionally, application of our approach to the increasing number of camera trap studies would result in a more efficient use of available data and a more comprehensive understanding of wildlife populations. References Amiard, P Ecology of the African Civet (Civettictis civetta) in Three Different Vegetation Types of South Africa: Study of the Population Density, the Habitat Use and the Diet. Master Thesis, University of Reims Champagne-Ardenne, Reims, France. Balme, G. A., L. T. B. Hunter, and R. Slotow Evaluating methods for counting cryptic carnivores. Journal of Wildlife Management 73: Balmford, A., L. Bennun, B. ten Brink, D. Cooper, I. M. Cote., et al The convention on biological diversity s 2010 target. Science 307:
111 97 Bennitt, E., M. C. Bonyongo, and S. Harris Habitat selection by African buffalo (Syncerus caffer) in response to landscape-level fluctuations in water availability on two temporal scales. Plos One 9:e Boast, L. K. and A. Houser Density of large predators on commercial farmland in Ghanzi, Botswana. South African Journal of Wildlife Research 42: Bolger, D. T., B. Vance, T. A. Morrison, and H. Farid Wild-ID: Pattern extraction and matching software for computer-assisted photographic mark-recapture analysis. Available from (accessed August 2014). Borchers, D. L. and M. G. Efford Spatially explicit maximum likelihood methods for capture-recapture studies. Biometrics 64: Chandler, R. B. and J. A. Royle Spatially explicit models for inference about density in unmarked or partially marked populations. Annals of Applied Statistics 7: Cozzi, G., F. Broekhuis, J. W. McNutt, and B. Schmid Density and habitat use of lions and spotted hyenas in northern Botswana and the influence of survey and ecological variables on call-in survey estimation. Biodiversity Conservation 22: Efford, M.G. In press. Mark-resight estimation of animal population density. Biometrics. Efford, M.G secr: spatially explicit capture-recapture models. R package version [accessed 10 February 2016] Efford, M. G., D. L. Borchers, and A. E. Bryom Density estimation by spatially explicit capture-recapture: Likelihood-based methods. Pages in D. L. Thompson, E. G. Cooch, and M. J. Conroy, editors. Modeling demographic processes in marked populations. Springer, New York, NY, USA.
112 98 Efford, M. G., D. K. Dawson, and C. S. Robbins DENSITY: software for analysing capture-recapture data from passive detector arrays. Animal Biodiversity and Conservation 27: Forman, R.T.T. and L. E. Alexander Roads and their major ecological effects. Annual Review of Ecology and Systematics 29: Ginsberg, J. R Setting priorities for carnivore conservation: what makes carnivores different? Pages in J. L. Gittleman, S. M. Funk, D. W. MacDonald, and R. K. Wayne, editors. Carnivore Conservation. Cambridge University Press and the Zoological Society of London, Cambridge, United Kingdom. Gittleman, J. L., S. M. Funk, D. M. Macdonald, and R. K. Wayne Carnivore Conservation. Cambridge University Press, Cambridge, United Kingdom. Karanth, K. U. and J. D. Nichols Estimation of tiger densities in India using photographic captures and recaptures. Ecology 79: Karanth, K. U., J. D. Nichols, N. S. Kumar, and J. E. Hines Assessing tiger population dynamics using photographic capture-recapture sampling. Ecology 87: Keene-Young, R A thin line: Botswana s cattle fences. Africa Environment and Wildlife 7: Maffei, L. and A. J. Noss How small is too small? Camera trap survey areas and density estimates for ocelots in the Bolivian chaco. Biotropica 40: Midlane, N., M. J. O Riain, G. A. Balme, and L. T. B. Hunter To track or to call: comparing methods for estimating population abundance of African lions Panthera leo in Kafue National Park. Biodiversity Conservation 24:
113 99 O Brien, T. G., J. E. M. Baillie, L. Krueger, and M. Cuke The Wildlife Picture Index: monitoring top trophic levels. Animal Conservation 13: O'Brien, T. G. and M. F. Kinnaird Density estimation of sympatric carnivores using spatially explicit capture-recapture methods and standard trapping grid. Ecological Applications 21: Otis, D. L., K. P. Burnham, G. C. White, and D. R. Anderson, D.R Statistical inference from capture data on closed animal populations. Wildlife Monographs 62: Pettorelli, N., A. L. Lobora, M. J. Msuha, C. Foley and S. M. Durant Carnivore biodiversity in Tanzania: revealing the distribution patterns of secretive mammals using camera traps. Animal Conservation 13: Pomilia, M. A., J. W. McNutt, and N. R. Jordan Ecological predictors of African wild dog ranging patterns in northern Botswana. Journal of Mammalogy 130: Ramesh, T. and C. T. Downs Impact of farmland use on population density and activity patterns of serval in South Africa. Journal of Mammalogy 94: Rich, L. N., D. A. W. Miller, H. S. Robinson, J. W. McNutt, and M. J. Kelly Using camera trapping and hierarchical occupancy modeling to evaluate the spatial ecology of an African mammal and bird community. Journal of Applied Ecology. DOI: / Rich, L. N., M. J. Kelly, R. Sollmann, A. J. Noss, L. Maffei, R. L. Arispe, A. Paviolo, C. D. De Angelo, Y. E. Di Blanco, and M. S. Di Bitetti Comparing capture-recapture, mark-resight and spatial mark-resight models for estimating puma densities via camera traps. Journal of Mammalogy 95:
114 100 Ripple, W. J., J. A. Estes, R. L. Beschta, C. L. Wilmers, E. G. Ritchie, M. Hebblewhite, J. Berger, B. Elmhagen, M. Letnic, M. P. Nelson, O. J. Schmitz, D. W. Smith, A. D. Wallach, and A. J. Wirsing Status and ecological effects of the world s largest carnivores. Science 343:1-11. Royle, J. A., J. D. Nichols, K. U. Karanth, and A. M. Gopalaswamy A hierarchical model for estimating density in camera trap studies. Journal of Applied Ecology 46: Royle, J. A. and K. V. Young A hierarchical model for spatial capture-recapture data. Ecology 89: Schipper, J., M. Hoffmann, J. Duckworth, and J. Conroy The 2008 IUCN red listings of the world s small carnivores. Small Carnivore Conservation 39: Silver, S. C., L. E. T. Ostro, L. K. Marsh, L. Maffei, A. J. Noss, M. J. Kelly, R. B. Wallace, H. Gómez, and G. Ayala The use of camera traps for estimating jaguar Panthera onca abundance and density using capture/recapture analysis. Oryx 38: Soisalo, M. K. and S. M. C. Cavalcanti Estimating the density of a jaguar population in the Brazilian Pantanal using camera-traps and capture recapture sampling in combination with GPS radio-telemetry. Biological Conservation 129: Sollmann, R., M. M. Furtado, B. Gardner, H. Hofer, A. T. A. Jácomo, N. M. Tôrres, and L. Silveira Improving density estimates for elusive carnivores: Accounting for sexspecific detection and movements using spatial capture-recapture models for jaguars in central Belize. Biological Conservation 144: Sollmann, R., B. Gardner, and J. L. Belant How does spatial study design influence density estimates from spatial capture-recapture models? Plos One 7:e34575.
115 101 Sollmann, R., B. Gardner, A. W. Parsons, J. J. Stocking, B. T. McClintock, T. R. Simons, K. H. Pollock, and A. F. O Connell A spatial mark-resight model augmented with telemetry data. Ecology 94: Steyn, V. and P. J. Funston Land-use and socio-spatial organization of female leopards in a semi-arid wooded savanna, Botswana. South African Journal of Wildlife Research 39: Sun, C. C., A. K. Fuller, and A. R. Royle Trap configuration and spacing influences parameter estimates in spatial capture-recapture models. Plos One 9:e Williams, B. K., J. D. Nichols, and M. J. Conroy Estimating abundance for closed populations with mark-recapture methods. Pages in Analysis and Management of Animal Populations. Academic Press, San Diego, CA, USA. Yoccoz, N. G., J. D. Nichols, and T. Boulinier Monitoring of biological diversity in space and time. Trends in Ecology and Evolution 16:
116 102 Table 4.1. Number of photographic detections (Det.), number of individuals (Indiv.), median number (range) of recaptures of individuals, and number of unresolved sightings (i.e., photos only identifiable to the species-level) for the focal carnivore species of a camera trap survey in Ngamiland District, Botswana, Common name Scientific name Det. Indiv. Recaptures Unresolved Spotted hyena Crocuta crocuta (1 16) 164 Leopard Panthera pardus F (1 10) 27 M (1 33) 14 Wild dogs Lycaon pictus (1 15) 22 Serval Leptailurus serval (1 6) 8 African civet Civettictis civetta (1 18) 126 Aardwolf Proteles cristatus (1 5) 0 Lion Panthera leo (1 8) 59
117 103 Table 4.2. Summary statistics (estimated parameter values and 95% confidence intervals) from spatially explicit capture-recapture models based on photographic captures of carnivores in Ngamiland District, Botswana, 2015, including maximum-likelihood density estimates (D) in mopane (Colophospermum mopane) and non-mopane habitat, buffer widths and the resulting state space areas, and estimates of baseline encounter rate g0 and scale parameter σ. Common name D (no./100 km 2 ) Mopane Non-mopane Overall Buffer width (km) State space (km 2 ) g0 σ (km) Spotted hyena 10.9 ( ) 14.4 ( ) 12.7 ( ) 25 6, ( ) 4.1 ( ) Leopardfemale 1.2 ( ) 4.9 ( ) 3.1 ( ) 15 3, ( ) 2.3 ( ) Leopardmale 1.2 ( ) 2.1 ( ) 1.7 ( ) 20 4, ( ) 3.2 ( ) Wild dogs 1.1 ( ) 3.6 ( ) 2.4 ( ) 25 6, ( ) 4.8 ( ) Serval ( ) 5.3 ( ) 5 1, ( ) 1.2 ( )
118 104 African civet 9.5 ( ) 16.8 ( ) 13.3 ( ) 6 1, ( ) 1.3 ( ) Aardwolf 3.7 ( ) ( ) 5 1, ( ) 2.2 ( ) Lion 1.2 ( ) 2.5 ( ) 1.9 ( ) 25 6, ( ) 3.9 ( )
119 105 Figure Captions Figure 4.1. Layout of our camera trap survey in northern Botswana, Figure 4.2. The range of distances separating 221 camera stations during a camera trap survey in Ngamiland District, Botswana, We spaced cameras at a range of distances to adequately reflect movements of small and wide-ranging carnivore species. Figure 4.3. Maximum-likelihood density estimates for a species residing at low densities, African wild dog (Lycaon pictus), and a species residing at high densities, spotted hyena (Crocuta crocuta), based on a camera trap survey (dots represent camera stations) in northern Botswana, To define the state space (i.e., an area large enough to include the activity centers of all individuals exposed to trapping) for both species, we surrounded our study area with a 25km buffer.

120 Figure
121 Figure

122 Figure
Steppe Forward 2013 Field Course: Camera Trapping For Biodiversity Monitoring Information Pack
 Steppe Forward 2013 Field Course: Camera Trapping For Biodiversity Monitoring Information Pack Who is the course for? The course is aimed second and third year undergraduate students (although not strictly
IUCN Red List Process. Cormack Gates Keith Aune
 IUCN Red List Process Cormack Gates Keith Aune The IUCN Red List Categories and Criteria have several specific aims to provide a system that can be applied consistently by different people; to improve
Resolution XIII.23. Wetlands in the Arctic and sub-arctic
 13th Meeting of the Conference of the Contracting Parties to the Ramsar Convention on Wetlands Wetlands for a Sustainable Urban Future Dubai, United Arab Emirates, 21-29 October 2018 Resolution XIII.23
Mitigating the human-elephant conflict in Sri Lanka: lessons from Southern Africa
 Mitigating the human-elephant conflict in Sri Lanka: lessons from Southern Africa Sanjay Kalpage 7 th International Wildlife Ranching Symposium Kimberly, South Africa, 11 th October, 2011 1 Overview Sri
Introduction to Part III Examining wildlife distributions and abundance using boat surveys
 Baseline Wildlife Studies in Atlantic Waters Offshore of Maryland: Final Report to the Maryland Department of Natural Resources and Maryland Energy Administration, 2015 Introduction to Part III Examining
Density estimation of sympatric carnivores using spatially explicit capture recapture methods and standard trapping grid
 Ecological Applications, 21(8), 2011, pp. 2908 2916 Ó 2011 by the Ecological Society of America Density estimation of sympatric carnivores using spatially explicit capture recapture methods and standard
Priority areas for grizzly bear conservation in western North America: an analysis of habitat and population viability INTRODUCTION METHODS
 Priority areas for grizzly bear conservation in western North America: an analysis of habitat and population viability. Carroll, C. 2005. Klamath Center for Conservation Research, Orleans, CA. Revised
Motivation for project:
 Motivation for project: Shale Gas exploration and development requested of government by Oil Companies. Shale Gas Development Strategic Environment Assessment (SGD SEA) commissioned by DEA Biodiversity
ASSESSING AND EVALUATING RECREATION RESOURCE IMPACTS: SPATIAL ANALYTICAL APPROACHES. Yu-Fai Leung
 ASSESSING AND EVALUATING RECREATION RESOURCE IMPACTS: SPATIAL ANALYTICAL APPROACHES by Yu-Fai Leung Dissertation submitted to the Faculty of the Virginia Polytechnic Institute and State University in partial
Multiple services provided by protected-areas in times of crises and implication for socio-ecological systems resilience
 Multiple services provided by protected-areas in times of crises and implication for socio-ecological systems resilience Insights from Hwange SES in Zimbabwe by Chloé Guerbois, Carli Bunding-Venter & Hervé
INDIANA ACADEMIC STANDARDS FOR SOCIAL STUDIES, WORLD GEOGRAPHY. PAGE(S) WHERE TAUGHT (If submission is not a book, cite appropriate location(s))
 WHERE TAUGHT (If submission is not a book, cite appropriate location(s))") Prentice Hall: The Cultural Landscape, An Introduction to Human Geography 2002 Indiana Academic Standards for Social Studies, World Geography (Grades 9-12) STANDARD 1: THE WORLD IN SPATIAL TERMS Students
Prentice Hall: The Cultural Landscape, An Introduction to Human Geography 2002 Indiana Academic Standards for Social Studies, World Geography (Grades 9-12) STANDARD 1: THE WORLD IN SPATIAL TERMS Students
Grant Opportunity Monitoring Bi-State Sage-grouse Populations in Nevada
 Grant Opportunity Monitoring Bi-State Sage-grouse Populations in Nevada Proposals are due no later than November 13, 2015. Grant proposal and any questions should be directed to: Shawn Espinosa @ sepsinosa@ndow.org.
Climate Change Vulnerability Assessment for Species
 Climate Change Vulnerability Assessment for Species SPECIES: Specify whether you are assessing the entire species or particular populations: This tool assesses the vulnerability or resilience of species
Home Range Size and Body Size
 Feb 11, 13 Home Range Size and Body Size Introduction Home range is the area normally traversed by an individual animal or group of animals during activities associated with feeding, resting, reproduction,
AP Environmental Science I. Unit 1-2: Biodiversity & Evolution
 NOTE/STUDY GUIDE: Unit 1-2, Biodiversity & Evolution AP Environmental Science I, Mr. Doc Miller, M.Ed. North Central High School Name: ID#: NORTH CENTRAL HIGH SCHOOL NOTE & STUDY GUIDE AP Environmental
Saving the Leuser Ecosystem with Arc GIS
 Brian Mattern APEC 480 Saving the Leuser Ecosystem with Arc GIS Background: Right now, a significant and relatively unreported crisis is occurring on the island of Sumatra. The Leuser ecosystem is a topographically
Focal Resource: BIGHORN SHEEP
 Focal Resource: BIGHORN SHEEP Taxonomy and Related Information: Bighorn sheep (Ovis canadensis); south Sierra, White and Inyo Mountains, perhaps more on east side. SENSITIVITY RESULTS.7 ADAPTIVE CAPACITY
Organism Interactions in Ecosystems
 Organism Interactions in Ecosystems Have you ever grown a plant or taken care of a pet? If so, you know they have certain needs such as water or warmth. Plants need sunlight to grow. Animals need food
World Geography. WG.1.1 Explain Earth s grid system and be able to locate places using degrees of latitude and longitude.
 Standard 1: The World in Spatial Terms Students will use maps, globes, atlases, and grid-referenced technologies, such as remote sensing, Geographic Information Systems (GIS), and Global Positioning Systems
16540/14 EE/cm 1 DG E 1A
 Council of the European Union Brussels, 5 December 2014 (OR. en) 16540/14 ENV 965 CULT 139 NOTE From: To: Subject: General Secretariat of the Council Delegations Charter of Rome on Natural and Cultural
Haida Gwaii Queen Charlotte Islands
 Haida Gwaii Queen Charlotte Islands H E R I T A G E T O U R I S M STRATE GY January 2003 Haida Gwaii/Queen Charlotte Islands Heritage Tourism Strategy Working Group The Haida Gwaii/Queen Charlotte Islands
SIF_7.1_v2. Indicator. Measurement. What should the measurement tell us?
 Indicator 7 Area of natural and semi-natural habitat Measurement 7.1 Area of natural and semi-natural habitat What should the measurement tell us? Natural habitats are considered the land and water areas
Ecology Test Biology Honors
 Do Not Write On Test Ecology Test Biology Honors Multiple Choice Identify the choice that best completes the statement or answers the question. 1. The study of the interaction of living organisms with
Evaluating Wildlife Habitats
 Lesson C5 4 Evaluating Wildlife Habitats Unit C. Animal Wildlife Management Problem Area 5. Game Animals Management Lesson 4. Evaluating Wildlife Habitats New Mexico Content Standard: Pathway Strand: Natural
Yakın Doğu Üniversitesi Mimarlık Fakültesi Peyzaj Mimarlığı Bölümü. PM 317 Human and Environment Assoc. Prof. Dr. Salih GÜCEL
 Yakın Doğu Üniversitesi Mimarlık Fakültesi Peyzaj Mimarlığı Bölümü PM 317 Human and Environment Assoc. Prof. Dr. Salih GÜCEL Ecology & Ecosystems Principles of Ecology Ecology is the study of the interactions
An Introduction to Day Two. Linking Conservation and Transportation Planning Lakewood, Colorado August 15-16, 16, 2006
 An Introduction to Day Two Linking Conservation and Transportation Planning Lakewood, Colorado August 15-16, 16, 2006 1 Agenda Day One Transportation Planning Heritage Program State Wildlife Action Plan
Trait-based Australian mammal distribution patterns and extinction risks
 Trait-based Australian mammal distribution patterns and extinction risks Jessica Berryman Salt Lake Community College Society of Conservation GIS Conference Pacific Grove, CA July 27, 2015 Extinction in
Extra Credit: due Thursday 28 September at 5pm as a.doc ed to Jake. Help session Tuesday 26 September.
 Main Points 1) Functional responses of predators -- prey switching and prey preferences -- Example: removing protected populations to save an endangered species -- apparent competition and the decline
Biology Unit 2 Test. True/False Indicate whether the statement is true or false.
 Biology Unit 2 Test True/False Indicate whether the statement is true or false. 1. A climax community is usually the stable result of succession. 2. The colonization of new sites by communities of organisms
Name: Class: Date: Ecosystem Interactions. Multiple Choice Identify the choice that best completes the statement or answers the question.
 Name: Class: _ Date: Ecosystem Interactions Multiple Choice Identify the choice that best completes the statement or answers the question. 1. In an ecosystem, organism interact with living and non-living
2017 Pre-AP Biology Ecology Quiz Study Guide
 2017 Pre-AP Biology Ecology Quiz Study Guide 1. Identify two processes that break-down organic molecules and return CO 2 to the atmosphere: 2. Identify one process that removes CO 2 from the atmosphere
Tracks as a non-invasive tool for monitoring large carnivores
 Tracks as a non-invasive tool for monitoring large carnivores -Manon AUTHELET 13th October 2015 Journée d étude «Gestion rationnelle et conservation de la grande faune» Forest Resources Management (GxABT/Ulg)
Main Points. Test #1 Thursday 1 October minutes for questions on Test #1 Tuesday 29 September.
 Main Points 1) Predation as a driver of ecological communities -- experiments in ecology -- top-down vs bottom-up regulation of populations -- example: apparent competition in northern ungulates -- example:
Southwest LRT Habitat Analysis. May 2016 Southwest LRT Project Technical Report
 Southwest LRT Habitat Analysis Southwest LRT Project Technical Report This page intentionally blank. Executive Summary This technical report describes the habitat analysis that was performed to support
United States Department of the Interior NATIONAL PARK SERVICE Northeast Region
 United States Department of the Interior NATIONAL PARK SERVICE Northeast Region June 17, 2017 REQUEST FOR STATEMENTS OF INTEREST and QUALIFICATIONS Project Title: ASSESSMENT OF NATURAL RESOURCE CONDITION
How Communities Evolve
 Chapter 1 How Communities Evolve Manuel Mendoza Department of Ecology and Evolutionary Biology Brown University, Providence, RI, USA Manuel_Mendoza@brown.edu 1.1. Introduction In Ecology, there is active
Most people used to live like this
 Urbanization Most people used to live like this Increasingly people live like this. For the first time in history, there are now more urban residents than rural residents. Land Cover & Land Use Land cover
Accounting for Ecosystem and Biodiversity Related Themes in Uganda
 Introduction Accounting for Ecosystem and Biodiversity Related Themes in Uganda Calls for more evidence-based approaches to policy have increased the need for integrated environmental-economic information
How does the greenhouse effect maintain the biosphere s temperature range? What are Earth s three main climate zones?
 Section 4 1 The Role of Climate (pages 87 89) Key Concepts How does the greenhouse effect maintain the biosphere s temperature range? What are Earth s three main climate zones? What Is Climate? (page 87)
Spatial Analysis and Modeling of Urban Land Use Changes in Lusaka, Zambia: A Case Study of a Rapidly Urbanizing Sub- Saharan African City
 Spatial Analysis and Modeling of Urban Land Use Changes in Lusaka, Zambia: A Case Study of a Rapidly Urbanizing Sub- Saharan African City January 2018 Matamyo SIMWANDA Spatial Analysis and Modeling of
Mapping African buffalo distributions, in relation to livestock disease risk
 Mapping African buffalo distributions, in relation to livestock disease risk Tim Robinson and Jennifer Siembieda Buffalo Mapping Meeting 7-8 June, Rome FAO, Canada Room Overview Modelling densities of
Goals: Be able to. Basic conflict: Economic opportunity vs. Environmental quality. Human population is growing exponentially
 Goals: Be able to Describe the general history of biodiversity and extinctions on Earth. Discuss why species go extinct. Explain why predators generally need larger land area than herbivores. Describe
Chapter 6 Vocabulary. Environment Population Community Ecosystem Abiotic Factor Biotic Factor Biome
 Biomes Chapter 6 Vocabulary Environment Population Community Ecosystem Abiotic Factor Biotic Factor Biome How Are Organisms On Earth Connected? All living things on Earth share resources, such as air,
Student Name: Teacher: Date: District: London City. Assessment: 07 Science Science Test 4. Description: Life Science Final 1.
 Student Name: Teacher: Date: District: London City Assessment: 07 Science Science Test 4 Description: Life Science Final 1 Form: 301 1. A food chain is shown. Sunlight Grass Rabbit Snake What is the abiotic
BIOS 230 Landscape Ecology. Lecture #32
 BIOS 230 Landscape Ecology Lecture #32 What is a Landscape? One definition: A large area, based on intuitive human scales and traditional geographical studies 10s of hectares to 100s of kilometers 2 (1
A Regional Database Tracking Fire Footprint Each Year within the South Atlantic Region: Current Database Description and Future Directions
 A Regional Database Tracking Fire Footprint Each Year within the South Atlantic Region: Current Database Description and Future Directions Last Updated on September 30, 2018 Contributors: NatureServe,
Navigable maritime and river waterways in the seaside - Danube Delta area and the connected rural development
 SUMMARY OF Ph-D Thesis, with title RESEARCH STUDIES ON MANAGEMENT IMPROVEMENT OF MARITIME AND RIVER TRANSPORT ACTIVITY IN THE COASTAL AND DANUBE DELTA AREA FROM AN ENVIROMENTAL, ECONOMIC AND SOCIAL PERSPECTIVE
Title: The African Elephant NYPL Digital ID:
 Title: The African Elephant NYPL Digital ID: 822545 http://digitalgallery.nypl.org/nypldigital/id?822545 What do you see in this picture? What does it look like this animal is doing or about to do? Ideas
Main Points. Terms: functional response, prey switching, apparent competition, ecosystem management
 Main Points 1) Functional responses of predators -- prey switching and prey preferences -- Example: removing protected populations to save an endangered species -- apparent competition and the decline
Project Primary Contact: Gregg Servheen, Idaho Department of Fish and Game, PO Box 25 Boise, ID ,
 Project Title: Idaho Montana Divide Project Objective: Pilot the conceptualization and coordination of a transboundary Decision Support System(DSS) for fish, wildlife, and habitats along the Idaho Montana
The National Spatial Strategy
 Purpose of this Consultation Paper This paper seeks the views of a wide range of bodies, interests and members of the public on the issues which the National Spatial Strategy should address. These views
POLAR REGIONS. By Kajavia Woods Arkansas State University
 POLAR REGIONS By Kajavia Woods Arkansas State University OVERVIEW Life in the planet s polar regions can be difficult. Winter temperatures can reach deep into the negatives, and the winter night can last
The Impact of Human Disturbance on Reticulated Giraffe Populations on Group Ranches and Conservancies
 The Impact of Human Disturbance on Reticulated Giraffe Populations on Group Ranches and Conservancies Dawn Wells, Michael Spiotta, Vincent Ontita, Jennifer Schieltz, Paula Kahumbu, Daniel I. Rubenstein
Wildlife and Traffic in the Carpathians
 Wildlife and Traffic in the Carpathians How to solve the problem between green and gray infrastructure Václav Hlaváč TRANSGREEN Kick-off Meeting Vienna, 28 February 2 March 2017 Nature Conservation Agency
Community participation in sustainable tourism - A case study of two indigenous communities
 Po-Hsin Lai Department of Park, Recreation, and Tourism Sciences Texas A&M University Community participation in sustainable tourism - A case study of two indigenous communities Community participation
Zoogeographic Regions. Reflective of the general distribution of energy and richness of food chemistry
 Terrestrial Flora & Fauna Part II In short, the animal and vegetable lines, diverging widely above, join below in a loop. 1 Asa Gray Zoogeographic Regions Reflective of the general distribution of energy
Background. North Cascades Ecosystem Grizzly Bear Restoration Plan/ Environmental Impact Statement. Steve Rochetta
 Grizzly Bear Restoration Plan/ Environmental Impact Statement Steve Rochetta Background Situated in the core of the North Cascades ecosystem (NCE), the North Cascades National Park Complex is surrounded
The Incorporation of GIS into an Evolving Ecological Approach for Tiger Conservation. Jessica Mack
 The Incorporation of GIS into an Evolving Ecological Approach for Tiger Conservation Jessica Mack Tigers have become one of the most well known conservation topics to date. It is the only species that
Multi-scale Modeling of Ecological Systems: Systems Biology in Application to Natural Resource Management
 Multi-scale Modeling of Ecological Systems: Systems Biology in Application to Natural Resource Management Louis J. Gross The Institute for Environmental Modeling Departments of Ecology and Evolutionary
ESCI 1 Lab #2: Plant Communities and extinction
 ESCI 1 Lab #2: Plant Communities and extinction Check in Review from Lab 1 Bay area maps Tree Keying ESA group activity Lecture : Species extinction and conservation Check out Field Trip #1: Henry Cowell
The inland water related tourism in South Africa by 2030 in the light of global change
 The inland water related tourism in South Africa by 2030 in the light of global change KSA 2 Water-Linked Ecosystems T4: Green economy and sustainable (green) innovations K5/2620 How can natural capital
Biomes Section 2. Chapter 6: Biomes Section 2: Forest Biomes DAY ONE
 Chapter 6: Biomes Section 2: Forest Biomes DAY ONE Of all the biomes in the world, forest biomes are the most widespread and the most diverse. The large trees of forests need a lot of water, so forests
Arizona Educator Proficiency Assessments (AEPA ) FIELD 04: GEOGRAPHY TEST OBJECTIVES
 FIELD 04: GEOGRAPHY TEST OBJECTIVES") Arizona Educator Proficiency Assessments (AEPA ) TEST OBJECTIVES Subarea Range of Objectives Approximate Test Proportions I. Geographic Concepts and Skills 1 6 25% II. World Geography 7 14 34% III. United
Arizona Educator Proficiency Assessments (AEPA ) TEST OBJECTIVES Subarea Range of Objectives Approximate Test Proportions I. Geographic Concepts and Skills 1 6 25% II. World Geography 7 14 34% III. United
WHAT IS BIOLOGICAL DIVERSITY?
 WHAT IS BIOLOGICAL DIVERSITY? Biological diversity or biodiversity is the variety of life - the wealth of life forms found on earth. 9 WHAT IS BIOLOGICAL DIVERSITY? Wilcox s (1984) definition: Biological
Chapter 52 An Introduction to Ecology and the Biosphere
 Chapter 52 An Introduction to Ecology and the Biosphere Ecology The study of the interactions between organisms and their environment. Ecology Integrates all areas of biological research and informs environmental
Renewable Energy Development and Airborne Wildlife Conservation
 Whitepaper ECHOTRACK TM RADAR ACOUSTIC TM SURVEILLANCE SYSTEM Renewable Energy Development and Airborne Wildlife Conservation Renewable energy developers must meet regulatory requirements to mitigate for
Spatiotemporal resource partitioning. of water sources by African carnivores on Namibian commercial farmlands
 Spatiotemporal resource partitioning of water sources by African carnivores on Namibian commercial farmlands Sarah Edwards 1,2 *, Alan C. Gange 2, Ingrid Wiesel 1,3 1 Brown Hyena Research Project, Lüderitz,
Define Ecology. study of the interactions that take place among organisms and their environment
 Ecology Define Ecology Define Ecology study of the interactions that take place among organisms and their environment Describe each of the following terms: Biosphere Biotic Abiotic Describe each of the
Rationale for measuring and monitoring forestrelated indicators for the "Caminos de Liderazgo
 Photo: Daniel Villafranca Rationale for measuring and monitoring forestrelated indicators for the "Caminos de Liderazgo Program", Osa Region, Costa Rica Lucia Morales Barquero April 2014 This document
Through their research, geographers gather a great deal of data about Canada.
 Ecozones What is an Ecozone? Through their research, geographers gather a great deal of data about Canada. To make sense of this information, they often organize and group areas with similar features.
A Small Migrating Herd. Mapping Wildlife Distribution 1. Mapping Wildlife Distribution 2. Conservation & Reserve Management
 A Basic Introduction to Wildlife Mapping & Modeling ~~~~~~~~~~ Rev. Ronald J. Wasowski, C.S.C. Associate Professor of Environmental Science University of Portland Portland, Oregon 8 December 2015 Introduction
Biodiversity and Protected Areas Management Project
 Biodiversity and Protected Areas Management Project Technical Advisor ESA region: Selwyn Willoughby Coordinator ESA region: Christine Mentzel FlexiCadastre EMEA Regional User Conference, Cape Town, South
Interactions in the Savannah
 Lesson Overview Savannahs cover approximately 20% of the Earth s land surface. The savannah is a type of grassland biome with scattered trees and shrubs. Although there are several different types of savannahs,
Coastal Environment. Introduction. 4.1 Coastal Environment. Extent of Coastal Environment
 4 The primary objective (set out in Chapter 2) to be implemented by this Chapter is Objective 2.4 ; the following objectives are also relevant due to the objectives integrated nature: 2.1 Tāngata whenua
Population Ecology. Text Readings. Questions to Answer in the Chapter. Chapter Reading:
 Population Ecology Text Readings Chapter Reading: Chapter # 26 in Audesirk, Audesirk and Byers: Population Growth and Regulation Pg. # 513-534. Questions to Answer in the Chapter How Does Population Size
CANINE DISTEMPER VIRUS IMPACT ON SERENGETI NATIONAL PARK LION-CHEETAH INTERACTIONS IN THE. By Aliénor Chauvenet. Dr. Sarah Durant Prof.
 CANINE DISTEMPER VIRUS IMPACT ON LION-CHEETAH INTERACTIONS IN THE SERENGETI NATIONAL PARK By Aliénor Chauvenet Supervised by: Dr. Nathalie Pettorelli Dr. Sarah Durant Prof. Tim Coulson A thesis submitted
The Governance of Land Use
 The Governance of Land Use Country fact sheet Czech Republic The planning system Levels of government and their responsibilities The Czech Republic is a unitary state with 3 levels of government: the national
Urban Climate Resilience
 Urban Climate Resilience in Southeast Asia Partnership Project Introduction Planning for climate change is a daunting challenge for governments in the Mekong Region. Limited capacity at the municipal level,
Assessment of conservation status of Qinling Natural Reserves Networks
 The Second Sino-German Wokshop on Biodiversity Conservation Assessment of conservation status of Qinling Natural Reserves Networks Example of giant panda nature reserves network Li Junsheng Chinese Research
D. Adaptive Radiation
 D. Adaptive Radiation One species new species: A new species: B new species: C new species: D Typically occurs when populations of a single species... invade a variety of new habitats, evolve under different
Ecological mapping using satellite imagery: an Abu Dhabi case study Middle East Geospatial Forum 16 th February 2015
 Ecological mapping using satellite imagery: an Abu Dhabi case study Middle East Geospatial Forum 16 th February 2015 Richard Flemmings rf@proteusgeo.com About Proteus Formed in UAE 2011 We specialise in
Desert Animals Survive Because
 Being Nocturnal Is An Adaptation That Helps Desert Animals Survive Because Most desert animals are nocturnal because it allows them to avoid extreme heat during the day. Some predators are How do animals
Chitra Sood, R.M. Bhagat and Vaibhav Kalia Centre for Geo-informatics Research and Training, CSK HPKV, Palampur , HP, India
 APPLICATION OF SPACE TECHNOLOGY AND GIS FOR INVENTORYING, MONITORING & CONSERVATION OF MOUNTAIN BIODIVERSITY WITH SPECIAL REFERENCE TO MEDICINAL PLANTS Chitra Sood, R.M. Bhagat and Vaibhav Kalia Centre
5 th Grade Ecosystems Mini Assessment Name # Date. Name # Date
 An ecosystem is a community of organisms and their interaction with their environment. (abiotic, biotic, niche, habitat, population, community)- 1. Which effect does a decrease in sunlight have on a pond
2009 WMU 525 Moose. Section Authors: Nathan Carruthers and Dave Moyles
 2009 WMU 525 Moose Section Authors: Nathan Carruthers and Dave Moyles Suggested Citation: Carruthers, N. and D. Moyles. WMU 525 Moose. Pages 78 83. In: N. Webb and R. Anderson. Delegated aerial ungulate
Chapter 6 Reading Questions
 Chapter 6 Reading Questions 1. Fill in 5 key events in the re-establishment of the New England forest in the Opening Story: 1. Farmers begin leaving 2. 3. 4. 5. 6. 7. Broadleaf forest reestablished 2.
RANGE AND ANIMAL SCIENCES AND RESOURCES MANAGEMENT - Vol. II - Catchment Management A Framework for Managing Rangelands - Hugh Milner
 CATCHMENT MANAGEMENT A FRAMEWORK FOR MANAGING RANGELANDS Hugh Milner International Water Management Consultant, Australia Keywords: Rangeland management; catchments and watersheds; catchment management
GENERAL ECOLOGY STUDY NOTES
 1.0 INTRODUCTION GENERAL ECOLOGY STUDY NOTES A community is made up of populations of different organisms living together in a unit environment. The manner in which these organisms relate together for
Bright blue marble floating in space. Biomes & Ecology
 Bright blue marble floating in space Biomes & Ecology Chapter 50 Spheres of life Molecules Cells (Tissues Organ Organ systems) Organisms Populations Community all the organisms of all the species that
ICRP & Alliance, Integrated Protection of People and the Environment
 ICRP & Alliance, Integrated Protection of People and the Environment 4 th International Symposium on the System of Radiological Protection October 10-12, 2017, Paris, France Kathryn A. Higley ICRP Committee
Chapter 8. Biogeographic Processes. Upon completion of this chapter the student will be able to:
 Chapter 8 Biogeographic Processes Chapter Objectives Upon completion of this chapter the student will be able to: 1. Define the terms ecosystem, habitat, ecological niche, and community. 2. Outline how
Ch20_Ecology, community & ecosystems
 Community Ecology Populations of different species living in the same place NICHE The sum of all the different use of abiotic resources in the habitat by s given species what the organism does what is
Chabi A.M.S. Djagoun 1, Brice Sinsin, Nicole Wrage-Mönnig 1. Contact
 Niche overlap and resource partitioning between rare topi antelope (Damaliscus korrigum) and other sympatric bulk grazers in Pendjari Biosphere Reserve (Northern Benin): Implication for topi conservation
Monitoring tigers: Any monitoring program is a compromise between science and logistic constraints - Hutto & Young ! Vast landscape low density,
 Any monitoring program is a compromise between science and logistic constraints - Hutto & Young 2003 Monitoring tigers:! Vast landscape low density,! Cryptic species, wide ranging! Limitation of professional
John Erb, Minnesota Department of Natural Resources, Forest Wildlife Research Group
 FURBEARER WINTER TRACK SURVEY SUMMARY, John Erb, Minnesota Department of Natural Resources, Forest Wildlife Research Group INTRODUCTION Monitoring the distribution and abundance of carnivores can be important
Ch 5. Evolution, Biodiversity, and Population Ecology. Part 1: Foundations of Environmental Science
 Ch 5 Evolution, Biodiversity, and Population Ecology Part 1: Foundations of Environmental Science PowerPoint Slides prepared by Jay Withgott and Heidi Marcum Copyright 2006 Pearson Education, Inc., publishing
Biomes There are 2 types: Terrestrial Biomes (on land) Aquatic Biomes (in the water)
 Aquatic Biomes (in the water)") Biomes There are 2 types: Terrestrial Biomes (on land) Aquatic Biomes (in the water) Terrestrial Biomes Grassland, Desert, and Tundra Biomes: Savanna Temperate grassland Chaparral Desert Tundra Chapter
Biomes There are 2 types: Terrestrial Biomes (on land) Aquatic Biomes (in the water) Terrestrial Biomes Grassland, Desert, and Tundra Biomes: Savanna Temperate grassland Chaparral Desert Tundra Chapter
LOUISIANA STUDENT STANDARDS FOR SOCIAL STUDIES THAT CORRELATE WITH A FIELD TRIP TO DESTREHAN PLANTATION KINDERGARTEN
 LOUISIANA STUDENT STANDARDS FOR SOCIAL STUDIES THAT CORRELATE WITH A FIELD TRIP TO DESTREHAN PLANTATION KINDERGARTEN Standard 2 Historical Thinking Skills Students distinguish between events, people, and
Biodiversity Blueprint Overview
 Biodiversity Blueprint Overview Climate Variability Climate projections for the Glenelg Hopkins Regions suggest that the weather will be hotter and drier in the coming years which will impact on land use,
Levels of Ecological Organization. Biotic and Abiotic Factors. Studying Ecology. Chapter 4 Population Ecology
 Chapter 4 Population Ecology Lesson 4.1 Studying Ecology Levels of Ecological Organization Biotic and Abiotic Factors The study of how organisms interact with each other and with their environments Scientists