Laboratory Topic 4: Projections and Geo-Positioning in ArcGIS [ LAEP/GEOG c188 ]
|
|
|
- Elvin Hall
- 5 years ago
- Views:
Transcription
![Laboratory Topic 4: Projections and Geo-Positioning in ArcGIS 10.4.1 - [ LAEP/GEOG c188 ] Projections in ArcGIS 10.4.1 In this tutorial you will learn to identify the Projection and Datum of a dataset, and if it lacks a Projection, we will define it.](/docs-images/81/82687491/images/1-1.jpg "Finally, once a Projection is defined, you will learn how to convert from one Projection to another so that you are able to perform analyses on large datasets that all have the same Projection.")

1 Laboratory Topic 4: Projections and Geo-Positioning in ArcGIS [ LAEP/GEOG c188 ] Projections in ArcGIS In this tutorial you will learn to identify the Projection and Datum of a dataset, and if it lacks a Projection, we will define it. Finally, once a Projection is defined, you will learn how to convert from one Projection to another so that you are able to perform analyses on large datasets that all have the same Projection. Note: Some of the graphics in this module are from ESRI s ArcGIS Resource Center What is a projection? A projection is a method by which the curved surface of the earth is portrayed on a flat surface. This generally requires a systematic mathematical transformation of the earth's graticule of lines of longitude and latitude onto a plane. Some projections can be visualized as a transparent globe with a light bulb at its center (though not all projections emanate from the globe's center) casting lines of latitude and longitude onto (conceptually) a sheet of paper. Generally, the paper is either flat and placed tangent to the globe (a planar or azimuthal projection) or formed into a cone or cylinder and placed over the globe (cylindrical and conical projections). Every map projection distorts distance, area, shape, direction, or some combination thereof.


2 A data set's projection tells ArcGIS where the data is located on the Planet Earth. Without a projection, the data could be located anywhere. This is a critical concept to understand as you will encounter data without projections defined, or data with different projections than what you are working in or would desire to be working in. It is not essential but often desirable that all your data be in the same projection if you are performing analyses on the data. We use projections because the Earth basically approximates an ellipsoid. However, when creating maps and GIS data files, we are viewing the Earth's surface in only 2 dimensions. Thus, we must have a way to convert the curved surface of the Earth to a flat plane. A projection is simply the mathematical process by which geographic locations are converted from a 3D sphere to a 2D flat surface. Latitude and longitude These spherical measures of latitude and longitude measure angles (in degrees) from the center of the earth to a point on the earth's surface. This coordinate reference system is often referred to as a geographic coordinate system. Longitude measures, based on the prime meridian (running from the North Pole through Greenwich, England, to the South Pole), angles in an east west direction. Longitude and latitude can locate exact positions on the surface, but they can not provide uniform units of measure for length and distance. The circles defining the parallels of latitude get gradually smaller as their distance increases from the equator. They become a single point at the North and South Poles where the meridians converge.
, representing east west, and one vertical (y), representing north south.")
3 Map projections use Cartesian coordinates A projected coordinate system is any coordinate system designed for a flat surface. The Cartesian coordinate system uses two axes: one horizontal (x), representing east west, and one vertical (y), representing north south. Projected coordinate systems also use a z- value to measure elevation above or below mean sea level. 2D Cartesian coordinate system 3D Cartesian coordinate system Types of Projections Many of you are no doubt familiar with projections from your daily experiences of reading a map, using an atlas, etc. There are a number of common projection types used around the world.
.")


4 One of the oldest and most common is the Mercator projection, (which uses the cylindrical projection method). Mercator projection This projection is useful for showing the entire Earth on a flat sheet of paper, but is rather inaccurate. Locations at the equator are correct, but the map becomes more distorted as one moves to higher latitudes - shown by the exaggeration of the rectangles. Another common projection, and one used in ArcGIS is the Universal Transverse Mercator, or UTM. This is another cylindrical projection, but it uses 2 opposite meridian lines to delineate a cylinder tangent to the Earth's surface. Unlike a geographic coordinate system, a projected coordinate system has constant lengths, angles, and areas across the two dimensions.
 of the following: --- true direction --- true distance --- true area --- true shape --- Given this problem of distortion, cartographers have invented a")
5 Every 2D projection of the Earth's surface is distorted in some way. A map can show one or more, (but never all) of the following: --- true direction --- true distance --- true area --- true shape --- Given this problem of distortion, cartographers have invented a number of different projections that do some things better than others, and these are selected depending on the expected use of the map. There are 3 main types of projections: Equal Area Projections - preserve the area of features by assigning them an area on the map that is proportional to their area on the Earth Conformal Projections - preserve the shape of small features and show directions correctly (State Plane is an example) Equidistant Projections - preserve distances to places from one or two points Many map projections are designed for specific purposes. One map projection might be used for preserving shape while another might be used for preserving the area (conformal versus equal-area projections).


6 State Plane Projection Because California is so big, a projection that covers the entire state would result in enough distortion that it would make it inaccurate for planning and design purposes. The Teale Albers projection does in fact cover the entire state, and this is used by state government agencies to show state-wide maps and planning documents. However, there is another category of projection, known as the State Plane Projection system, (the areas are shown in the map above) that break down states into smaller land areas. These land areas can then be projected onto a map with very little distortion and they are accurate enough for planning and design purposes. Data and maps of the Bay Area will most commonly work in a State Plane Projection, as the land areas we deal with are small (area) enough to easily fit in one State Plane area. Note: ArcMap was built to read a file's (ie. shapefile) projection (if it is defined) and automatically project it on-the-fly to the active Data Frame's projection. Therefore it is very important to know if a file has no defined projection. If its projection has been defined, it is important to know what it is. ArcCatalog is a great way to discover this or Right click on the layer name (feature class) in the Table of Contents (in ArcMap), select Properties! Source to discover the projection. What is Geo-Positioning? Geo-positioning allows a map (or data in a GIS) to be placed at a real world location on the surface of the Earth. A map that is not Geo-positioned, or Geo-referenced, can only tell you about distances and relations between locations on the map itself. However, if the map is tied into a world coordinate system such as Latitude and Longitude, then anyone in the world can locate the map and relate it to any other map using latitude and longitude (or any other coordinate system). Similarly, geo-positioning or geo-referencing data in GIS allows anyone in the world to locate the data on the surface of the Earth. Once you have registered your data to a world coordinate system, (such as latitude and longitude) then it can be associated with and compared to other data keyed to the same registration system. Many cities are now requiring Computer Aided Design (CAD) plans and design proposals that are geo-referenced so they can easily be plugged into the city's GIS maps.

7 Imagine a paper map without latitude or longitude, such as a schematic BART train map. Such a map contains useful data, such as the distance between the Concord and Lake Merritt train platforms, but has no reference to a location in the real world. A geographer in Botswana could not use the BART map to figure out, for instance, the distance between Concord and Gabarone, Botswana's capitol city. However, if the BART map had latitude and longitude references, anyone using the same world coordinate system could associate the BART map with their own map by comparing the latitudes and longitudes of each map. To Geo-Position data in a GIS system is to register it to a location, just as a schematic BART train map would become geo-positioned with the addition of latitude and longitude references. Registration may be relative or absolute. Relative registrations are tied to schemes such as a military grid system. Many published street maps are like this with grids labeled as A,B,C,... along the top and 1,2,3,... along the side. Absolute registrations are tied into a world coordinate system such as Latitude and Longitude. Latitude-longitude measures angles from the center of the earth to a point on the earth's surface, rather than distances on the earth's surface. Lat./long. are measured in degrees, minutes and seconds (DMS) or in decimal degrees (DD). These are often referred to as geographic coordinate systems. If you can register your data to a world coordinate system, then it may be shared and associated with other data keyed to the same registration system. It is to your advantage to geo-position your data by registering it to an absolute, world coordinate system.
 determining the projection for a given dataset, 2) defining a projection if it is not already defined for a dataset, and 3) projecting a")

8 The addition of latitude and longitude to a map, such as a transit map like the local BART map, would bring absolute registration to previously ungeo-referenced data. In this lab exercise, we will explore projections by: 1) determining the projection for a given dataset, 2) defining a projection if it is not already defined for a dataset, and 3) projecting a dataset from one projection to another There are a number of ways to check if a dataset has a projection. We will cover two here. Both ArcCatalog and ArcMap allow you to find out information on the projection of a dataset. Download the following set of data for this laboratory exercise. Start ArcCatalog and navigate to the uc_bnd.shp file. On my computer I put the data in a working directory called C:\Temp\JohnRadke\Lab4

 about the data.")
9 Above the file, there are 3 tabs that can provide information about the data: Clicking on Preview will provide a glimpse of the data in map view. Right clicking on the shapefile and selecting Properties option in the pull down menu launches a Shape Properties window where you can check some Metadata. Metadata is information (data) about the data. Metadata will often have information about the projection of the dataset. Clicking on the various Tabs the following information: will reveal
")


10 For example, clicking on XY Coordinate System tab pulls up metadata on the Projection and Datum of the layer (feature class) chosen. In this example, the Projection is the California State Plane Zone III. Zone III refers to the zone that contains the Bay Area. NAD 1983 refers to the North American Datum 1983 that was used to create the projection. Feet means that the units for the map are in feet.
 for a large area, ie North America. A horizontal geodetic datum may be local or geocentric.")

11 Datums A datum is essentially a surveyed set of bench marks, usually expressed as latitude-longitude coordinates, that create the best possible estimation of the shape of the Earth (including topographic irregularities etc) for a large area, ie North America. A horizontal geodetic datum may be local or geocentric.,recent satellite data has provided new measurements to define the best earth-fitting spheroid, that relates coordinates to the earth's center of mass. An earth-centered, or geocentric, datum uses the earth's center of mass as the origin. The most recently developed datum is WGS 1984 the World Geodetic System This most widely used geocentric datum and geographic coordinate system was designed by the U.S. Department of Defense and Global Positioning System (GPS) measurements are based on it. A local datum aligns its spheroid to closely fit the earth's surface in a particular area. The coordinates of the origin point are fixed, and all other points are calculated from it. The last Datum was done in 1983 for the North American continent. This Datum is what we will use for most of our maps in these class exercises. Projections in ArcMap The second way to determine the projection of a dataset is to look at it in ArcMap. Start ArcMap, and open the Map_P1.mxd file.

12 As a review, the.mxd ArcMap files only reference the data they contain. Thus, Map_P1.mxd only points to the data layers (feature classes) you see in the Table of Contents. However, we can discover a lot of information about the data by using tools within ArcMap. Right-click on the uc_bnd.shp file, and click on 'Properties'. This brings up a menu with a wealth of information about the data. Clicking on the 'Source' tab, brings up information about the projection:


13 Here you can see information about the Projection, and see that it is in CA State Plane Projection, zone III, NAD83 and in Feet. Now let's do the same for a dataset that has no defined projection. Select and add to ArcMap the oakw_lq.shp file. Because the projection is undefined, ArcMap is unable to display the data at the correct location (on the Earth s surface), and you get the following warning when you add data without a projection: Click
14 Right click on the oakw_lq.shp layer and select on Properties tab. The 'Source' tab displays the following: Coordinate System is undefined and the data has no projection.


15 You will also notice that the oakw_lq does not sit on top of the other data like it should, it is displayed in another location on Earth. Right click on the oakw_lq layer and select Zoom To Layer. The Data Frame / Data View window zooms to the spatial extent of the selected layer, in this instance oakw_lq.
.")
16 Insert a new Data Frame and drag the oakw_lq layer (feature class) from the above Data Frame in the Table of Contents to the new Data Frame you just created. Note that The oakw_lq layer has no spatial reference and you will be warned About this as you insert it into the new Data Frame. Make sure the layers (feature class). List by Drawing Order icon is selected or you will not be able to drag (up or down) any of the Any Data Frame will take on the coordinate system of the first layer displayed in it. Note oakw_lq has no coordinate system defined so the new Data Frame will have no coordinate system defined. However, since the data appears to be in decimal degrees, the software tries to display the data frame this way. In this image it appears to be longitude and latitude so the software guesses Decimal Degrees. however, this is never consistent and some undefined data will just remain undefined or Unknown Units. displayed something like this.
17 It is important to note that an undefined projection of a dataset will not geo-reference with a data frame unless of course it just happens to contain the same coordinate numbers (this is rare but it does occur). For example, if the data frame is in California State Plane, Zone III, NAD 83 and feet and the data that is undefined just happens to have numbers in that range, it will be displayed as if it has that projection.. Again, this is rare and never count on it to be correct. Always make sure your data layer projections are defined. Here oakw_lq does not geo-reference with the rest of the data in the California State Plane, Zone III, NAD 83 and feet data frame. Once we define a projection however, it will display correctly. This we will undertake in the next part of this laboratory exercise. However, the map on the right is what the maps in the Data Frame would look like once you have correctly defined the projection of oakw_lq


18 A Note about Data Frames: When a new 'Data Frame' is added to the Table of Contents. The new text is bolded and the map display is blank. This is because the New Data Frame is now activated and there are no layers to display in the map window. Add layers to the New Data Frame and they will appear in the map display. The advantage to adding a New Data Frame is that it has no projection defined. Thus, you can check the projection of the layer you add. Only one Data Frame can be active at one time. To Activate a Data Frame right click on it and invoke Activate..


19 The first step in Defining a Projection is knowing what projection the data was created in!! To discover this information you need to muster your detective skills by 1 st consulting the metadata. One of the files in this weeks data set is the Liqufaction Hazard Map that I downloaded from a website: The original zipped file I downloaded was called: and contained two shapefiles that did not have their Projections defined. In other words, there was no file with either of the two shapefiles. In this exercise we will use the Liqufaction Hazard Map,. Downloaded with the shapefiles came meta data in the form of HTML file called It is important to read this meta data for information on Spatial Reference when there is no predefined projection of a shapefile. I have included the copy that came with the data from this government site. Note: the metadata downloaded here is not necessarily the same as the general site meta data as web sites are dynamically changing all the time. The metadata describing the oakw_lq.shp came with it when I downloaded it. The site s meta data is generic for most of the data at the site and may reflect differences in projections and datum s. For this exercise use the copy of the meta data I downloaded with the data from the site and point to here. We will learn about downloading data from various web sites in a later Laboratory. When you double click on the icon, it brings up an html file in Firefox, Internet Explorer, or any other browser that you have defaulted to. I use FireFox: Click on the Spatial Reference Information Link, and you will see the following:

20 From this, we can gather all the information we need to know about the projection: -The decimal degrees tells us that it's in a Geographic Projection because it uses Latitude and Longitude -We also know that it uses the North American Datum of 1983 and the GRS 80 Ellipsoid. It is always good to double check the Metadata to determine what projection the data was collected in or is stored as!


21 Using ArcToolbox to define a projection: ArcToolbox is a set of utility programs (wizards) that accompany the menu drive software in ArcGIS. It can be used with ArcMap, ArcCatalog, and ArcScene. To launch it click the red toolbox. All ArcToolboxes will look similar but contain different tools depending on the licenses and extensions of the software installed on the computer you are using. The student version will have fewer tools in the toolbox from the computers in the 214 Computer laboratory and computers on the 3 rd and 4 th floors of Wurster Hall. In fact, I could build my own tools and put them in the ArcToolbox. So never panic if the tools in any of these exercises look a little different than the tools installed on your computer.

 on the Define Projection tool the")
22 To define a projection, click on 'Data Management Tools', then 'Projections and Transformations', then double click 'Define Projection' You can also open the Search window to search for and locate a tool in the Tool box. After double clicking (left button) on the Define Projection tool the following wizard appears.

 the Property wizard.")
23 Select the oakw_lq dataset as the Input Dataset or Feature Class. To select and define the Coordinate System, double click (left button) the Property wizard. button to invoke the Spatial Reference

24 Since we know from the meta data the Projection is Geographic, choose the Geographic Coordinate Systems tab. Choose North America since Oakland is in North America. Choose the North American Datum of 1983 since we know from the meta data from the web site where I got the data that the Datum used was the NAD North American Datum of 1983, a geocentric datum and graphic coordinate system based on the Geodetic Reference System 1980 ellipsoid (GRS80). This mainly used in North America where its measurements were and are obtained from both terrestrial and satellite data.
25 Some interesting facts from the US National Geodetic Survey: From NOAA: The NAD 27 was based on the Clarke Ellipsoid of 1866 and the NAD 83 is based on the Geodetic Reference System of The NAD 27 was computed with a single survey point, MEADES RANCH in Kansas, as the datum point, while the NAD 83 was computed as a geocentric reference system with no datum point. NAD 83 has been officially adopted as the legal horizontal datum for the United States by the Federal government, and has been recognized as such in legislation in 48 of the 50 states. The computation of the NAD 83 removed significant local distortions from the network which had accumulated over the years, using the original observations, and made the NAD 83 much more compatible with modern survey techniques. From NOAA: A High Accuracy Reference Network (HARN) and a High Precision Geodetic Network (HPGN) were two designations used for a statewide geodetic network upgrade. The generic acronym HARN is now used for both HARN and HPGN and was adopted to remove the confusion arising from the use of two acronyms. A HARN is a statewide or regional upgrade in accuracy of NAD 83 coordinates using Global Positioning System (GPS) observations. HARNs were observed to support the use of GPS by Federal, state, and local surveyors, geodesists, and many other applications. The cooperative network upgrading program began in Tennessee in The last field observations were completed in Indiana in September 1997 after horizontally upgrading some 16,000 survey stations to A-order or B-order status. Horizontal A-order stations have a relative accuracy of 5 mm +/- 1:10,000,000 relative to other A-order stations. Horizontal B-order stations have a relative accuracy of 8 mm +/- 1:1,000,000 relative to other A-order and B-order stations. From NOAA: Continuously Operating Reference Station (CORS) is a system for surveyors, GIS users, engineers, scientists, and the public at large that collect GPS data can use CORS data to improve the precision of their positions. CORS enhanced post-processed coordinates approach a few centimeters relative to the National Spatial Reference System, both horizontally and vertically. The CORS network is a multi-purpose cooperative endeavor involving government, academic, and private organizations. The sites are independently owned and operated. Each agency shares their data with NGS, and NGS in turn analyzes and distributes the data free of charge. As of November 2011, the CORS network contains over 1,800 stations, contributed by over 200 different organizations, and the network continues to expand. From NOAA: "The datum (was) not mean sea level, the geoid, or any other equipotential surface. Therefore it was renamed, in 1973, the National Geodetic Vertical Datum on 1929." (Geodetic Glossary, pp. 56) The North American Vertical Datum of 1988 (NAVD 88) is the vertical control datum established in 1991 by the minimum-constraint adjustment of the Canadian- Mexican-U.S. leveling observations. It held fixed the height of the primary tidal bench mark, referenced to the new International Great Lakes Datum of 1985 local mean sea level height value, at Father Point/Rimouski, Quebec, Canada. Additional tidal bench mark elevations were not used due to the demonstrated variations in sea surface topography, i.e., the fact that mean sea level is not the same equipotential surface at all tidal bench marks. From NOAA: National Spatial Reference System or the National Geodetic Reference System (NGRS) exists as a collection of discreet geodetic elements. Horizontal positions (latitude and longitude, State Plane Coordinates) referenced to a two-dimensional datum, the North American Datum of 1983 (NAD 83), and elevations (Helmert orthometric heights) referenced to a one-dimensional datum, the North American Vertical Datum of 1988 (NAVD 88) define the major components of the NGRS. By 1994, the NGRS contained information on approximately 300,000 horizontal control points and 600,000 vertical control points..
 most always choose the North American Datum")

26 After reading all this interesting information, I (personally) most always choose the North American Datum of 1983 or NAD 1983 when I am defining the projection of data in decimal degrees or degrees, minutes and seconds. Click

27 Check to see if the projection was defined correctly, Right Click on the shapefile oakw_lq and select properties. Note the results in the Layer Properties window should look like this: Finally, Right click and select 'Zoom to Layer' for the oakw_lq file and see that it now aligns with the rest of the data correctly! Note: Once defined the data layer oakw_lq will Be correctly placed in all Data Frame windows at the correct position, no matter what the projection and datum of the Data Frame. It is automatically projected on-the-fly by the software.


28 For this exercise, we will project the soils data that is currently in the California State Plane Zone III projection in meters, to the California State Plane Zone III NAD1983 feet projection, so that it matches with the rest of the data. Add the soilmu_a_ca610.shp shapefile to ArcMap. I obtained the soilmu_a_ca610.shp dataset online from the Soils Data for Alameda County at the The Soil Data Mart - Managed by the USDA Natural Resources Conservation Service: We determine soilmu_a_ca610.shp is projected in meters, by checking the projection under the properties menu:
 where there is no projection information present (no.prj file).")
 on the Project tool.")
29 Projecting a dataset is similar to (but NOT the same as) Defining a Projection for a dataset. You can only use the Define Projection tool when you have a dataset (shapefile) where there is no projection information present (no.prj file). The Project tool is also located in ArcToolbox. Data Management Tools!Projections and Transformations!Project Double click (left button) on the Project tool. Once you choose the dataset to Project, in this case the soilmu_a_ca610 shapefile, it will read the projection from that Dataset and display it in the 2 nd box. In this instance NAD_1983_statePlane_California_III_FIPS_0403
30 In the 3rd box, you should name the output file something meaningful like soilmu_a_ca610_ft.shp to distinguish it from the input file. Launch the Output Coordinate System wizard the Spatial Reference Properties window select a Projected Coordinate System. and in


31 In this example the projection, State Plane and the Datum, NAD 1983 feet. and the state plane zone, California zone III click to accept the projection parameters.


32 Click to complete the projection. Once you click, you should see the new Dataset in the Table of Contents.


33 When you check the projection, you should see that the dataset is now projected in feet: IMPORTANT NOTE: ArcMap's treatment of different Projections You may have noticed that the soils dataset did not move its location when you changed its projection. This is because ArcMap draws all data layers that already have their Projections Defined in the current Data Frame s projection. These already defined layers are projected on-the-fly into the current Data Frame s projection and thus are displayed as if they are all the same Projection and Datum.. Therefore the data is displayed in the Data Frame as if their projections are the same, even if they are different. A rule of thumb is project all your datasets into the same common projection to minimize conflicts when you are doing your research. If you still do not understand this concept see your GSI in office hours. Note: You can define the projection of a Data Frame by Right Clicking it, selecting its Properties tab, and defining its projection..
 about the projection and datum and they confirmed that it is: UTM_Zone_10N NAD83 and units in Meters.")
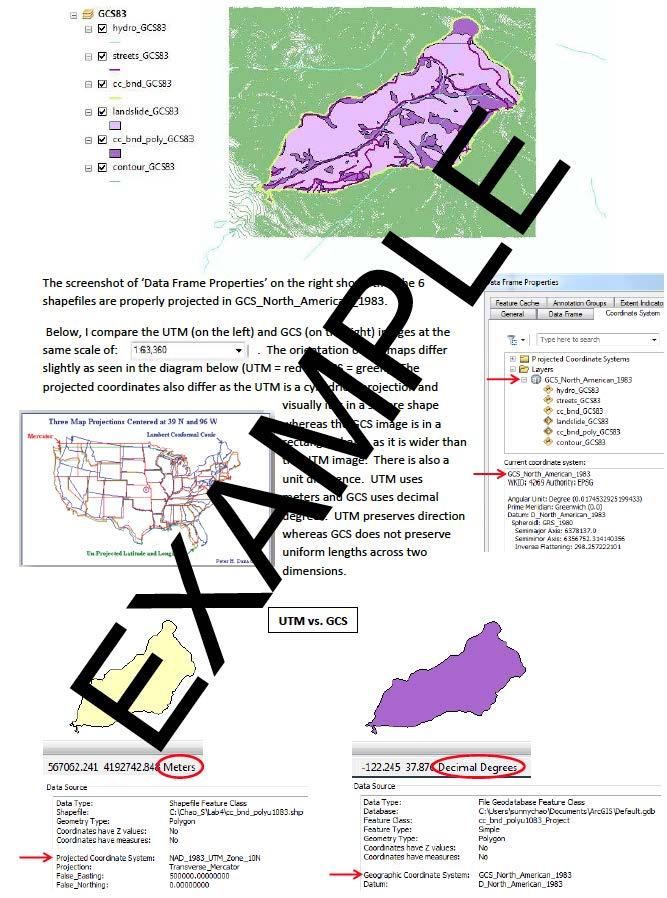
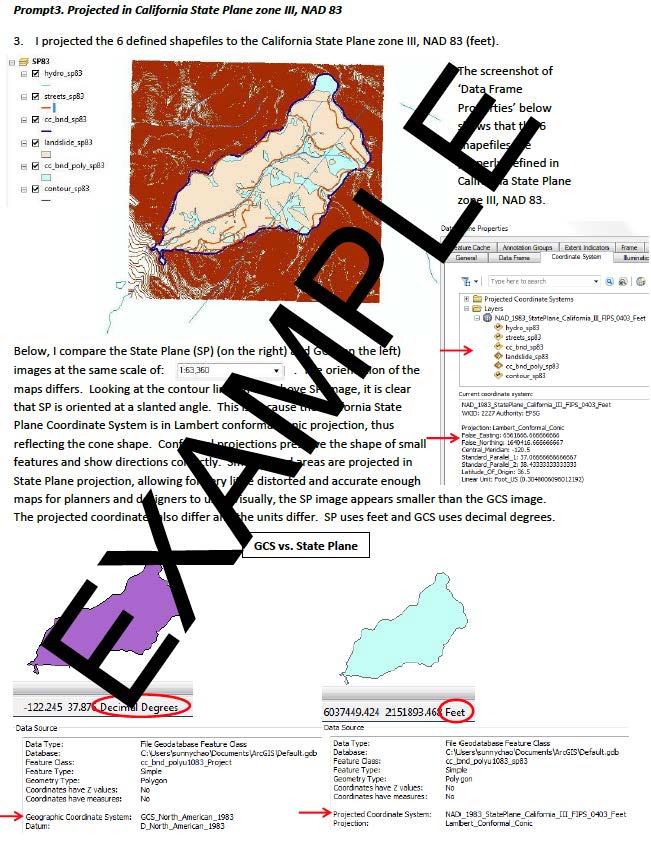
34 Use data from the following Lab 4 Assignment data set: We have asked experts (who collected the data) about the projection and datum and they confirmed that it is: UTM_Zone_10N NAD83 and units in Meters Q1: Briefly review what you did during this lab session and make sure you understand the purpose of each step. Define the projection of at least three (3) of the shapefiles from this Lab4Assignment.zip dataset. (worth 2 marks) Q2: Project the 3 shapefiles files you defined in Q1 to a Geographic Coordinate System using the datum. How do we usually refer to the X and Y axis when we discuss this projection? Make sure you include one map image of one of your newly projected shapefiles, comparing it to your UTM defined shapefiles. In other words what included in the map image would help me see that you were successful in projecting your shapefiles. In addition, provide other images (of meta data) giving proof that your projections worked. Include graphics from either ArcCatalog or ArcMap to help illustrate and prove these two projections (from Q1 and Q2) are what you say they are (refer to the examples below). (worth 4 marks) Q3: Project the 3 shapefiles you defined above to California State Plane zone III, NAD 83 (feet). Make sure you include an image of one of the layers projected in State Plane, comparing it to when it was either not defined in Q1, or to the previously defined projection in Q2. Include in your write up a discussion about the difference between what it looked like before and what it looks like after you projected it. What can you say about the coordinate system? Include graphics from ArcCatalog or ArcMap to help illustrate and prove these State Plane projections are what you say they are. (worth 3 marks) During this process you may experience a warning message about geographic transformations just close the warning and take the default
 ------------------------------------------------------- Here is an expanded grading Rubric that should answer your questions. http://c188.ced.")
35 Q4: Post your results as a.pdf file to bcourses. Include in your document several screenshots of your maps and proof of projection. (worth 1 mark for overall clarity and communication) Here is an expanded grading Rubric that should answer your questions The page limit is four (4) for all labs.
 of a data file or")
36 Here is an example of how to compare (prove) you have either: Defined and/or Projected (changed the projection/datum) of a data file or layer.

37 Here is an example of a successful lab assignment.
38

39
Georeferencing, Map Projections, Cartographic Concepts. -Coordinate Systems -Datum
 Georeferencing, Map Projections, Cartographic Concepts -Map Projections -Coordinate Systems -Datum Map projection is "the process of systematically transforming positions on the Earth's spherical surface
Georeferencing. Place names Postal addresses Postal codes Coordinate systems (lat/long, UTM, etc.)
") Georeferencing Georeferencing Used to describe the act of assigning locations to data or information Certain requirements include that they are: unique, have shared meaning, and are persistent through
Georeferencing Georeferencing Used to describe the act of assigning locations to data or information Certain requirements include that they are: unique, have shared meaning, and are persistent through
Intro to GIS Fall 2010 Georeferencing & Map Projections
 Intro to GIS Fall 2010 Georeferencing & Map Projections SHAPE OF THE EARTH Earth's Shape Geoid: shape of earth minus topographic features (irregular due to local variations in gravity) Ellipsoid: elongated
Understanding Projections for GIS
 Presented by John Schaeffer Juniper GIS Services, Inc. This PowerPoint is available at JuniperGIS.com Presentation Objectives To understand basic concepts on projections and coordinate systems for the
REFERENCING COORDINATE SYSTEMS MAP PROJECTIONS GEOREFERENCING
 GIS in Ecology SPATIAL REFERENCING COORDINATE SYSTEMS MAP PROJECTIONS GEOREFERENCING : :1 Where on earth? Early mapmakers recognized the need for a system that could locate features on the earth's surface.
ch02.pdf chap2.pdf chap02.pdf
 Introduction to Geographic Information Systems 8th Edition Karl Solutions Manual Full Download: http://testbanklive.com/download/introduction-to-geographic-information-systems-8th-edition-karl-solutions-manu
IDENTIFYING THE TYPE OF COORDINATE SYSTEM FOR DATA USING ARCMAP
 CHAPTER 1 IDENTIFYING THE TYPE OF COORDINATE SYSTEM FOR DATA USING ARCMAP I got a parcel shapefile from the county, but it doesn t line up with my other data in ArcMap. My boss told me to make a map using
GEOREFERENCING, PROJECTIONS Part I. PRESENTING DATA Part II
 Week 7 GEOREFERENCING, PROJECTIONS Part I PRESENTING DATA Part II topics of the week Georeferencing Coordinate systems Map Projections ArcMap and Projections Geo-referencing Geo-referencing is the process
What is a Map Projection?
 What is a Map Projection? It is how we represent a three dimensional Earth on a flat piece of paper However The process of transferring information from the Earth to a map causes every projection to distort
Lab #3 Map Projections.
 Lab #3 Map Projections http://visual.merriam-webster.com/images/earth/geography/cartography/map-projections.jpg Map Projections Projection: a systematic arrangement of parallels and meridians on a plane
WHERE ARE YOU? Maps & Geospatial Concepts Fall 2015
 WHERE ARE YOU? Maps & Geospatial Concepts Fall 2015 Where are you? Relative location I m at school Absolute Location 45 26 18.07 122 43 50.78 Where is Boston? Introducing Geodesy, Ellipsoids & Geoids Geodesy
NR402 GIS Applications in Natural Resources Lesson 4 Map Projections
 NR402 GIS Applications in Natural Resources Lesson 4 Map Projections From http://www.or.blm.gov/gis/ 1 Geographic coordinates Coordinates are expressed as Latitude and Longitude in Degrees, Minutes, Seconds
Identifying coordinate systems for data using ArcMap
 Chapter 1 Identifying coordinate systems for data using ArcMap I got a parcel shapefile from the county but it doesn t line up with my other data in ArcMap. My boss told me to make a map using ArcMap,
Geographic coordinate systems
 1 Geographic coordinate systems In this chapter you ll learn about longitude and latitude. You ll also learn about the parts that comprise a geographic coordinate system including Spheres and spheroids
Map projections. Rüdiger Gens
 Rüdiger Gens Coordinate systems Geographic coordinates f a: semi-major axis b: semi-minor axis Geographic latitude b Geodetic latitude a f: flattening = (a-b)/a Expresses as a fraction 1/f = about 300
Projections and Coordinate Systems
 Projections and Coordinate Systems Overview Projections Examples of different projections Coordinate systems Datums Projections Overview Projections and Coordinate Systems GIS must accurately represent
Shape e o f f the e Earth
 1 Coordinate Systems & Projections Coordinate Systems Two map layers are not going to register spatially unless they are based on the same coordinate system. 2 Contents Shape of the earth Datum Projections
Dr. ABOLGHASEM AKBARI Faculty of Civil Engineering & Earth Resources, University Malaysia Pahang (UMP)
") Workshop on : Dr. ABOLGHASEM AKBARI Faculty of Civil Engineering & Earth Resources, University Malaysia Pahang (UMP) 14-15 April 2016 Venue: Tehran, Iran GIS definitions GIS: A simplified view of the real
Workshop on : Dr. ABOLGHASEM AKBARI Faculty of Civil Engineering & Earth Resources, University Malaysia Pahang (UMP) 14-15 April 2016 Venue: Tehran, Iran GIS definitions GIS: A simplified view of the real
Lecture 4. Coordinate Systems & Projections
 Lecture 4 Coordinate Systems & Projections Outline Geodesy Geoids Ellipsoids Geographic Coordinate Systems Magnetic North vs. True North Datums Projections Applying Coordinate Systems and Projections Why
This week s topics. Week 6. FE 257. GIS and Forest Engineering Applications. Week 6
 FE 257. GIS and Forest Engineering Applications Week 6 Week 6 Last week Chapter 8 Combining and splitting landscape features and merging GIS databases Chapter 11 Overlay processes Questions? Next week
EnvSci360 Computer and Analytical Cartography
 EnvSci360 Computer and Analytical Cartography Lecture 3 Geodesy Map Projections, Datums, and Coordinate Systems 1 Geodesy The science of measuring and representing the shape and size of the earth, and
Boolean Operators and Topological OVERLAY FUNCTIONS IN GIS
 Boolean Operators and Topological OVERLAY FUNCTIONS IN GIS Query asking a question of the attribute data Standard Query Language (SQL) is used to query the data There are 4 basic statements used to get
WHERE ARE YOU? Maps & Geospatial Concepts Fall 2012
 WHERE ARE YOU? Maps & Geospatial Concepts Fall 2012 Where are you? Relative location I m at school Absolute Location 45 26 18.07 122 43 50.78 Datums Datums A reference surface of the Earth Used as the
2. GETTING STARTED WITH GIS
 2. GETTING STARTED WITH GIS What are geographic information systems and what are they used for? ArcGIS: ArcMap, ArcCatalog and ArcToolbox Vector data vs. raster data vs. attribute tables Polygons, polylines,
Control Surveys and Coordinate Systems
 Control Surveys and Coordinate Systems The Earth is Round Basic Shape of the Earth: Oblate Spheroid of Revolution The length of the equatorial axis is approximately 27 miles greater than the polar axis.
GIST 3300 / Geographic Information Systems. Last Time. Today
 GIST 3300 / 5300 Last Time Ellipsoids and Datums Today Map Projections Map Projections Today we will build on the concepts of Geographic Coordinate Systems, Ellipsoids and Datums and add the concepts of
Welcome to Lesson 4. It is important for a GIS analyst to have a thorough understanding of map projections and coordinate systems.
 Welcome to Lesson 4. It is important for a GIS analyst to have a thorough understanding of map projections and coordinate systems. A GIS without coordinates would simply be a database like Microsoft Excel
Map Projections. What does the world look like? AITOFF AZIMUTHAL EQUIDISTANT BEHRMANN EQUAL AREA CYLINDRICAL
 Map Projections What does the world look like? AITOFF AZIMUTHAL EQUIDISTANT BEHRMANN EQUAL AREA CYLINDRICAL 1 CYLINDRICAL EQUAL AREA BONNE CRASTER PARABOLIC 2 ECKERT I ECKERT III ECKERT V There are many
Coordinate Systems. Location on earth is defined by coordinates
 Coordinate Systems We think of the earth as a sphere It is actually a spheroid (ellipsoid), slightly larger in radius at the equator than at the poles Shape of the Earth Location on earth is defined by
Task 1: Start ArcMap and add the county boundary data from your downloaded dataset to the data frame.
 Exercise 6 Coordinate Systems and Map Projections The following steps describe the general process that you will follow to complete the exercise. Specific steps will be provided later in the step-by-step
Importance of Understanding Coordinate Systems and Map Projections.
 Importance of Understanding Coordinate Systems and Map Projections. 1 It is extremely important that you gain an understanding of coordinate systems and map projections. GIS works with spatial data, and,
Geography 281 Map Making with GIS Project Eight: Comparing Map Projections
 Geography 281 Map Making with GIS Project Eight: Comparing Map Projections In this activity, you will do a series of projection comparisons using maps at different scales and geographic extents. In this
ENV101 EARTH SYSTEMS
 ENV101 EARTH SYSTEMS Practical Exercise 2 Introduction to ArcMap and Map Projections 1. OVERVIEW This practical is designed to familiarise students with the use of ArcMap for visualising spatial data and
Lecture 2. Map Projections and GIS Coordinate Systems. Tomislav Sapic GIS Technologist Faculty of Natural Resources Management Lakehead University
 Lecture 2 Map Projections and GIS Coordinate Systems Tomislav Sapic GIS Technologist Faculty of Natural Resources Management Lakehead University Map Projections Map projections are mathematical formulas
Lesson 5: Map Scale and Projections
 Organizing Data and Information Lesson 5: Map Scale and Projections Map Scales Projections Information can be organized as lists, numbers, tables, text, pictures, maps, or indexes. Clusters of information
The Elements of GIS. Organizing Data and Information. The GIS Database. MAP and ATRIBUTE INFORMATION
 GIS s Roots in Cartography Getting Started With GIS Chapter 2 Dursun Z. Seker MAP and ATRIBUTE INFORMATION Data (numbers and text) store as files refer to them collectively as a database gather inform.
Outline. Shape of the Earth. Geographic Coordinates (φ, λ, z) Ellipsoid or Spheroid Rotate an ellipse around an axis. Ellipse.
 Ellipsoid or Spheroid Rotate an ellipse around an axis. Ellipse.") Map Projections Outline Geodesy and map projections Prof. D. Nagesh Kumar Department of Civil Engineering Indian Institute of Science Bangalore 560 012, India http://www.civil.iisc.ernet.in/~nagesh Shape
Map Projections Outline Geodesy and map projections Prof. D. Nagesh Kumar Department of Civil Engineering Indian Institute of Science Bangalore 560 012, India http://www.civil.iisc.ernet.in/~nagesh Shape
GEOL 452/552 - GIS for Geoscientists I. Lecture 15
 GEOL 452/552 - GIS for Geoscientists I Lecture 15 Lecture Plan Midterm Multiple choice part graded (+ solutions) Jump to Ch. 11 for one lecture Coordinate systems Projections, datums, spheroids Unprojected
Trouble-Shooting Coordinate System Problems
 Trouble-Shooting Coordinate System Problems Written by Barbara M. Parmenter. Revised on October 2, 2018 OVERVIEW OF THE EXERCISE... 1 COPYING THE MAP PROJECTION EXERCISE FOLDER TO YOUR H: DRIVE OR DESKTOP...
Working with georeferenced data. What is georeferencing? Coordinate Systems. Geographic and Projected Coordinate System
 GIS501 Fundamentals of Geographical Information Systems (GIS) Coordinate Systems Working with georeferenced data What is georeferencing? Geographically referenced data which is, in some way, referenced
The Wildlife Society Meet and Greet. Come learn about what the UNBC Student Chapter of TWS is all about!
 Georeferencing I GEOG 300, Lecture 4 Dr. Anthony Jjumba 1 The Wildlife Society Meet and Greet Quiz Come learn about what the UNBC Student Chapter of TWS is all about! 5:30 7:30 PM, Wednesday September
Introduction to Geographic Information Science. Updates/News. Last Lecture. Geography 4103 / Map Projections and Coordinate Systems
 Geography 4103 / 5103 Introduction to Geographic Information Science Map Projections and Coordinate Systems Updates/News Thursday s lecture Reading discussion 1 find the readings online open questions,
GEOGRAPHIC COORDINATE SYSTEMS
 GEOGRAPHIC COORDINATE SYSTEMS Introduction to GIS Winter 2015 What is Georeferencing? Used to establish a location on the Earth s surface 1 st order polynomial transformation Georeferencing toolbar What
Geo Referencing & Map projections CGI-GIRS 0910
 Geo Referencing & Map projections CGI-GIRS 0910 Where are you? 31UFT8361 174,7 441,2 51 58' NB 5 40' OL 2/60 Who are they? 3/60 Do geo data describe Earth s phenomena perfectly? Georeference systems ellipsoid
ArcGIS for Applied Economists Session 2
 ArcGIS for Applied Economists Session 2 Mark Westcott LMU Munich June 15, 2015 1 / 31 Topics for this session: Geographic Coordinate Systems Projections Projected Coordinate Systems Geocoding 2 / 31 Some
4 Survey Datums. 4.1 Horizontal Datum Policy SURVEY DATUMS SEPTEMBER 2006
 4 Survey Datums Today s multi-organizational Project Development efforts require the use of common, accurate horizontal and vertical survey datums and consistent, precise control-survey procedures to ensure
Coordinate Systems and Datum Transformation in ArcGIS. Brittney White and Melita Kennedy
 Coordinate Systems and Datum Transformation in ArcGIS Brittney White and Melita Kennedy Where is my data? Problem Horizontal Vertical Projections Transformations Horizontal coordinate systems Geographic
Full file at https://fratstock.eu
 Full file at https://fratstockeu Chapter 1 to Exercises 1 1 The feature data set is called Transportation It has two feature classes, majroads and interstates Method: Use the Add Data button to look at
Outline Anatomy of ArcGIS Metadata Data Types Vector Raster Conversion Adding Data Navigation Symbolization Methods Layer Files Editing Help Files
 UPlan Training Lab Exercise: Introduction to ArcGIS Outline Anatomy of ArcGIS Metadata Data Types Vector Raster Conversion Adding Data Navigation Symbolization Methods Layer Files Editing Help Files Anatomy
Trouble-Shooting Coordinate System Problems
 Trouble-Shooting Coordinate System Problems Written by Barbara M. Parmenter, revised 2/25/2014 OVERVIEW OF THE EXERCISE... 1 COPYING THE MAP PROJECTION EXERCISE FOLDER TO YOUR H: DRIVE OR DESKTOP... 2
How does an ellipsoid differ from a sphere in approximating the shape and size of the Earth?
 Chapter 02 Test Bank Worksheet Questions 1. What is a map projection? Topic: Map Projection 2. How does an ellipsoid differ from a sphere in approximating the shape and size of the Earth? Topic: Ellipsoid
Introduction to Geographic Information Systems
 Introduction to Geographic Information Systems Lynn_Carlson@brown.edu 401-863-9917 The Environmental And Remote TecHnologies Lab MacMillan Hall, Room 105 http://www.brown.edu/research/earthlab/ Outline
Geo Referencing & Map projections CGI-GIRS 0910
 Geo Referencing & Map projections CGI-GIRS 0910 Where are you? 31UFT8361 174,7 441,2 51 58' NB 5 40' OL 2/60 Who are they? 3/60 Do geo data describe Earth s phenomena perfectly? Georeference systems ellipsoid
Modern Navigation. Thomas Herring
 12.215 Modern Navigation Thomas Herring Today s class Map Projections: Why projections are needed Types of map projections Classification by type of projection Classification by characteristics of projection
BUILDING AN ACCURATE GIS
 BUILDING AN ACCURATE GIS 2006 GIS in the Rockies Denver, Colorado September 13, 2006 William E. Linzey United States Department of Commerce National Oceanic and Atmospheric Administration National Geodetic
Exercise 6: Coordinate Systems
 Exercise 6: Coordinate Systems This exercise will teach you the fundamentals of Coordinate Systems within QGIS. In this exercise you will learn: How to determine the coordinate system of a layer How the
Lecture 10-14: Map Projections and Coordinate System
 URP 1281 Surveying and Cartography Lecture 10-14: Map Projections and Coordinate System December 27, 2015 Course Teacher: Md. Esraz-Ul-Zannat Assistant Professor Department of Urban and Regional Planning
Lab 2: Projecting Geographic Data
 Lab 2: Projecting Geographic Data What you ll Learn: Basic methods for map projections in ArcMap. What You ll Produce: A map of Minnesota in three different statewide projections, a map of reprojected
Lab#3: GIS Projections and Coordinate Systems. Start Arcmap and create a data frame for each of the above coordinate systems.
 NRM338 Fall 2017 Lab#3 Page#1 of 18 In this lab, you will Lab#3: GIS Projections and Coordinate Systems 1) Define the geographic coordinate system of two GIS themes. 2) Determine the geographic coordinates
GIS in Management Planning. Lab 2 Coordinate Systems and Map Projections
 GIS in Management Planning Lab 2 Coordinate Systems and Map Projections Tomislav Sapic GIS Technologist Faculty of Natural Resources Management Lakehead University ArcGIS ArcToolbox Projections Functions
Displaying Latitude & Longitude Data (XY Data) in ArcGIS
 in ArcGIS") Displaying Latitude & Longitude Data (XY Data) in ArcGIS Created by Barbara Parmenter and updated on 2/15/2018 If you have a table of data that has longitude and latitude, or XY coordinates, you can view
Displaying Latitude & Longitude Data (XY Data) in ArcGIS Created by Barbara Parmenter and updated on 2/15/2018 If you have a table of data that has longitude and latitude, or XY coordinates, you can view
Chapter 3 Models of the Earth. 3.1 Finding Locations on the Earth. 3.1 Objectives
 Chapter 3 Models of the Earth 3.1 Finding Locations on the Earth 3.1 Objectives Explain latitude and longitude. How can latitude and longitude be used to find locations on Earth? How can a magnetic compass
Map Projections. Displaying the earth on 2 dimensional maps
 Map Projections Displaying the earth on 2 dimensional maps Map projections Define the spatial relationship between locations on earth and their relative locations on a flat map Are mathematical expressions
MAR-E1004 Basics of GIS: Georeferencing Jaakko Madetoja Slides adopted from Paula Ahonen-Rainio
 MAR-E1004 Basics of GIS: Georeferencing Jaakko Madetoja Slides adopted from Paula Ahonen-Rainio Learning goals In this session you will learn To describe the basics of different types of referencing systems
What is Geodesy? Types of Geodesy terrestrial or classical geodesy space geodesy theoretical geodesy
 What is Geodesy? Geodesy is the study of: The size, shape and motion of the earth The measurement of the position and motion of points on the earth's surface, and The study of the earth's gravity field
Map Projections & Coordinate Systems
 Map Projections & Coordinate Systems 9/7/2017 1 Why? Laying the Earth Flat Need convenient means of measuring and comparing distances, directions, areas, shapes. Traditional surveying instruments measure
Data Structures & Database Queries in GIS
 Data Structures & Database Queries in GIS Objective In this lab we will show you how to use ArcGIS for analysis of digital elevation models (DEM s), in relationship to Rocky Mountain bighorn sheep (Ovis
Projections Part I - Categories and Properties James R. Clynch February 2006
 I. Introduction and References Projections Part I - Categories and Properties James R. Clynch February 2006 The world is, approximately, a sphere. Maps are flat. Making maps requires some method of putting
Georeferencing. Geography is the key to linking attributes. Georeferencing is the key to geography.
 Georeferencing Geography is the key to linking attributes. Georeferencing is the key to geography. Why georeferencing? Many reasons for having georeferences Many different approaches to georeferencing
Referencing map features: Coordinate systems and map projections
 Referencing map features: Coordinate systems and map projections Coordinate systems and map projections if we want to integrate geographic data from many different sources, we need to use a consistent
Version 1.1 GIS Syllabus
 GEOGRAPHIC INFORMATION SYSTEMS CERTIFICATION Version 1.1 GIS Syllabus Endorsed 1 Version 1 January 2007 GIS Certification Programme 1. Target The GIS certification is aimed at: Those who wish to demonstrate
1. Geospatial technology rarely links geospatial data to nonspatial data. a. True *b. False
 Chapter 2 Where in the Geospatial World Are You? 1. Geospatial technology rarely links geospatial data to nonspatial data. 2. For geospatial technology to work, every location on Earth must be: a. inhabited
Learning ArcGIS: Introduction to ArcCatalog 10.1
 Learning ArcGIS: Introduction to ArcCatalog 10.1 Estimated Time: 1 Hour Information systems help us to manage what we know by making it easier to organize, access, manipulate, and apply knowledge to the
Lecture Plan. GEOL 452/552 - GIS for Geoscientists I. Why use Projections? Lecture 15 - chapter 11. Different types of Projections
 GEOL 452/552 - GIS for Geoscientists I Lecture 15 - chapter 11 Lecture Plan Ch. 11, one lecture Coordinate systems Projection, Datums, Dpheroid Unprojected (geographic) coord. syst., UTM On the fly projection
Data Set Projection Checklist
 1 of 6 12/20/2012 12:38 PM Data Set Projection Checklist There are two projections/coordinate systems you must worry about: 1. 2. That of your map. You can pick this to be whatever you want, and your GIS
Mapping Census Data in ArcView 3.x
 Mapping Census Data in ArcView 3.x Nancy Lemay University of Ottawa Barbara Znamirowski Trent University Workshop Outline Defining certain concepts and terms: Map scale, coordinate systems, datum and projections.
Geographic Information Systems class # 1 February 19, Coordinate reference systems in GIS: geodetic coordinates
 Geographic Information Systems class # 1 February 19, 2013 Coordinate reference systems in GIS: geodetic coordinates Manuel Campagnolo ISA Manuel Campagnolo (ISA) GIS/SIG 2012 2013 February 19, 2013 1
Dirty REMOTE SENSING : Lecture 8 A mapping interlude..
 Dirty REMOTE SENSING : Lecture 8 A mapping interlude.. Stuart Green Teagasc Spatial Analysis Group Stuart.green@teagasc.ie Web for the Week: http://electronics.howstuffworks.com/gps.htm http://www.cstars.ucdavis.edu/classes/ers186-w03/lecture17/lecture17.ppt
caused displacement of ocean water resulting in a massive tsunami. II. Purpose
 I. Introduction The Great Sumatra Earthquake event took place on December 26, 2004, and was one of the most notable and devastating natural disasters of the decade. The event consisted of a major initial
Mobile Mapping Tips and Tricks
 Mobile Mapping Tips and Tricks Projections, Datums and Geoids, May 2017 Introduction This guide is designed to provide a basic understanding of coordinate system projections, datums and geoids. The guide
The data for this lab comes from McDonald Forest. We will be working with spatial data representing the forest boundary, streams, roads, and stands.
 GIS LAB 6 Using the Projection Utility. Converting Data to Oregon s Approved Lambert Projection. Determining Stand Size, Stand Types, Road Length, and Stream Length. This lab will ask you to work with
Watershed Modeling Orange County Hydrology Using GIS Data
 v. 10.0 WMS 10.0 Tutorial Watershed Modeling Orange County Hydrology Using GIS Data Learn how to delineate sub-basins and compute soil losses for Orange County (California) hydrologic modeling Objectives
Environmental Systems Research Institute
 Introduction to ArcGIS ESRI Environmental Systems Research Institute Redlands, California 2 ESRI GIS Development Arc/Info (coverage model) Versions 1-7 from 1980 1999 Arc Macro Language (AML) ArcView (shapefile
(THIS IS AN OPTIONAL BUT WORTHWHILE EXERCISE)
") PART 2: Analysis in ArcGIS (THIS IS AN OPTIONAL BUT WORTHWHILE EXERCISE) Step 1: Start ArcCatalog and open a geodatabase If you have a shortcut icon for ArcCatalog on your desktop, double-click it to start
PART 2: Analysis in ArcGIS (THIS IS AN OPTIONAL BUT WORTHWHILE EXERCISE) Step 1: Start ArcCatalog and open a geodatabase If you have a shortcut icon for ArcCatalog on your desktop, double-click it to start
Applied Cartography and Introduction to GIS GEOG 2017 EL. Lecture-1 Chapters 1 and 2
 Applied Cartography and Introduction to GIS GEOG 2017 EL Lecture-1 Chapters 1 and 2 What is GIS? A Geographic Information System (GIS) is a computer system for capturing, storing, querying, analyzing and
Presenting Tree Inventory. Tomislav Sapic GIS Technologist Faculty of Natural Resources Management Lakehead University
 Presenting Tree Inventory Tomislav Sapic GIS Technologist Faculty of Natural Resources Management Lakehead University Suggested Options 1. Print out a Google Maps satellite image of the inventoried block
1/28/16. EGM101 Skills Toolbox. Oblate spheroid. The shape of the earth Co-ordinate systems Map projections. Geoid
 EGM101 Skills Toolbox Oblate spheroid The shape of the earth Co-ordinate systems Map projections The geoid is the shape that the surface of the oceans would take under the influence of Earth's gravitation
In this exercise we will learn how to use the analysis tools in ArcGIS with vector and raster data to further examine potential building sites.
 GIS Level 2 In the Introduction to GIS workshop we filtered data and visually examined it to determine where to potentially build a new mixed use facility. In order to get a low interest loan, the building
Delineation of Watersheds
 Delineation of Watersheds Adirondack Park, New York by Introduction Problem Watershed boundaries are increasingly being used in land and water management, separating the direction of water flow such that
Geog Lecture 29 Mapping and GIS Continued
 Geog 1000 - Lecture 29 Mapping and GIS Continued http://scholar.ulethbridge.ca/chasmer/classes/ Today s Lecture (Pgs 13-25, 28-29) 1. Hand back Assignment 3 2. Review of Dr. Peddle s lecture last week
Part 1: GIS Data from the Web: Downloading and Projecting Digital Elevation Models (DEM) and BTS Road data
 and BTS Road data") Field Geology I Hometown GIS, Part 1 October 03, 2005 Lab Exercise 2.1 Part 1: GIS Data from the Web: Downloading and Projecting Digital Elevation Models (DEM) and BTS Road data 1. Introduction a. GIS
Field Geology I Hometown GIS, Part 1 October 03, 2005 Lab Exercise 2.1 Part 1: GIS Data from the Web: Downloading and Projecting Digital Elevation Models (DEM) and BTS Road data 1. Introduction a. GIS
The Geodatabase Working with Spatial Analyst. Calculating Elevation and Slope Values for Forested Roads, Streams, and Stands.
 GIS LAB 7 The Geodatabase Working with Spatial Analyst. Calculating Elevation and Slope Values for Forested Roads, Streams, and Stands. This lab will ask you to work with the Spatial Analyst extension.
Projections & GIS Data Collection: An Overview
 Projections & GIS Data Collection: An Overview Projections Primary data capture Secondary data capture Data transfer Capturing attribute data Managing a data capture project Geodesy Basics for Geospatial
A PRIMER ON COORDINATE SYSTEMS Commonly Used in Michigan
 A PRIMER ON COORDINATE SYSTEMS Commonly Used in Michigan David P. Lusch, Ph.D., GISP Department of Geography Remote Sensing & GIS Research and Outreach Services Group Michigan State University September,
Exercise 3: GIS data on the World Wide Web
 Exercise 3: GIS data on the World Wide Web These web sites are a few examples of sites that are serving free GIS data. Many other sites exist. Search in Google or other search engine to find GIS data for
Map projections. Rüdiger Gens
 Rüdiger Gens 2 Outline! Relevant terms! Why map projections?! Map projection categories " Projection surfaces " Features preserved from distortions! Map projection examples! Right choice Relevant terms!
Georeferencing. datum. projection. scale. The next few lectures will introduce you to these elements. on the Earth, you ll need to understand how
 Georeferencing GOAL: To assign a location to all the features represented in our geographic information data In order to do so, we need to make use of the following elements: ellipsoid/geoid To determine
Working with Map Projections
 Working with Map Projections Rachel Applebaum and Margaret M. Maher Author of Lining Up Data in ArcGIS: a guide to map projections Second edition Some common problems that prevent data from aligning correctly
EOS 102: Dynamic Oceans Exercise 1: Navigating Planet Earth
 EOS 102: Dynamic Oceans Exercise 1: Navigating Planet Earth YOU MUST READ THROUGH THIS CAREFULLY! This exercise is designed to familiarize yourself with Google Earth and some of its basic functions while
Georeferencing. Where on earth are we? Critical for importing and combining layers for mapping
 Georeferencing Where on earth are we? Critical for importing and combining layers for mapping 1. The Geoid Earth is not a perfect sphere, it is ellipsoidal.. earth is the 'Geoid'. The difference between