Lab 2: Projecting Geographic Data
|
|
|
- Scot McCoy
- 5 years ago
- Views:
Transcription
1 Lab 2: Projecting Geographic Data What you ll Learn: Basic methods for map projections in ArcMap. What You ll Produce: A map of Minnesota in three different statewide projections, a map of reprojected county boundary and lakes data in central Minnesota, and a worksheet recording areas and coordinates for various projections. Background: Chapter 3 of the GIS Fundamentals textbook provides the necessary background. We introduce unavoidable distortion when we flatten the Earth s curved surface onto a flat map. Different map projections represent the same points with different X and Y (or E and N) coordinate values. We cannot mix map projections in an analysis, so we often have to re-project some of our data layers. Note that in the instructions below we often use the terms map projection, projection, and coordinate system interchangeably. A map projection is associated with a specific coordinate system, and to project data is to convert from one coordinate system to another. Each lab assumes you have a copy of the Lab 2 data files, available from the class materials at Observing How Distance May Change with a Map Projection Start ArcMap, and add two data frames. Name one Albers, and the other Mercator (see last week s lab or last week s video Data Frames for instructions) Activate the Alber s Layer (right click on data frame name, then Activate) Add the layers twocity_albers.shp, and USA_48_Albers.shp. Left click on the Measure Tool to enable it, and set the Distance Units to Miles (see Lab 1 instructions/videos in you don t remember) Left-click once on Los Angeles, then move the mouse to New York and double left-click on New York. The distance between the two cites is displayed, either in a drop-down window, or at the bottom left of the ArcMap window (it depends on the version and setup). Your measured distance should be approximately 2,440 miles. Activate the Mercator data frame. Add the layers twocity_mercator.shp, USA_48_Mercator.shp Re-measure the distance from LA to NY. The new measurement should be 1

2 approximately 3,127 miles. Lab 2: Projections The on the ground distance between LA and NY is actually 2,444 miles. The difference in measurements between the Albers and Mercator is due to unavoidable distortion caused when we stretch measurements from the curved Earth surface to a flat map surface. Notice that the distortion is different for different projections. Data Frame Coordinate Display Later in this lab you will learn to project data from an existing file to create a new file with a different coordinate systems. First we want to introduce the idea of a temporary, or on the fly projection, something that ArcMap often does when you add data to a data frame (Video: On the fly projection). A data frame usually has a specified coordinate system. You can manually set the system, or ArcMap can establish one automatically when you first load data. Once a data frame has been specified, ArcMap will display the approximate coordinates of the current cursor location in the lower-left of the frame (see the arrow below. Create a data frame, and add the minn_count_dd data. This is a data layer of Minnesota county boundaries in decimal degrees coordinates. Move your cursor around the screen and notice the coordinate values to the lower right. Note how these change along with the cursor position as the program displays the map projected coordinate values corresponding to the cursor position. You can change the units to correspond to your coordinate system, see the Video, Cursor Coordinates. 2


3 From the assigned textbook readings, you should know what decimal degrees coordinates look like. The data frame may be displaying some other coordinate units. Lab 2: Projections To change the display coordinate units while navigating around the map: -right click on the data frame name in the Table of Contents at the left of the Data Frame, then -left click on Properties, General tab This will display various panes in a window. About half-way down you can set the display units. Select Display, then Decimal Degrees (see figure on right). Click on OK to close the window, and verify that the units are now displayed as decimal degrees. You can display the county names by right clicking on the minn_county_dd name in the Table of Contents, and then checking the box for Label features in the layer near the upper left, and making sure the label field is NAME. This is a column we created for each county that contains the county name. See the Video: Label Features 3
4 Zoom in and reposition the cursor successively until you have an accurate reading for the coordinates of the northeast corner of Ramsey County (see the map figure, below). You ll know you re zoomed in enough when the coordinate values don t change or only change in the third decimal place when you move slightly off of the displayed corner. Record the decimal degree coordinates of the northeast corner of Ramsey County on the Lab 2 Worksheet, either a hand copy or printout of the page at the end, or the editable MSWord worksheet provided with this week s data files NE corner Ramsey County 4
, or projected (X,Y, or Easting/Northing).")

5 Data Layer Coordinate System vs. Data Frame Coordinate Systems Every data layer has a coordinate system associated with it. The X and Y coordinates are expressed in some units, and they may be geographic (longitude/latitude), or projected (X,Y, or Easting/Northing). I can right click on a layer name in the table of contents (TOC), then Properties, and click on the source tab to show the data coordinate system. When done for the minn_count_dd data, it shows the geographic coordinate system for the data layer: This is the coordinate system for the data set. Add the USA_48_Mercator to the same data frame. Open the Properties Source tab for this data layer, and it should display something like the window: Note it lists the projected coordinate system as World_Mercator 5

6 Grab and drag the minn_count_dd to the top of the list in the Table of contents (TOC), and zoom to all layers (click ), and you ll get a display similar to that below. Note that although the different data sets are in different projections, they line up on top of each other. Why? The layers line up because ArcMap allows a data frame to have a set projection, different from the projection for data added to the frame. ArcMap temporarily re-projects all added data to the set data frame projection. (see Video, Data Frame Projection) The reprojection is temporary, when loading data to a data frame. It doesn t change the data on the disk, but re-calculates coordinates between reading it and displaying it. This can be helpful, because we can coherently display data that are in different coordinate systems, but it can be a trap, because it can obscure the true projection of a data layer. This can be quite confusing at first, but you need make sure you understand this concept of a data frame coordinate system, with temporary reprojection, and a data layer coordinate system the coordinate system the data are stored in. If you understand this difference, you will likely save yourself much confusion and grief. Why is this important? Some operations won t work correctly, for example when editing, some overlays, or area calculations, or distance measurements, if data layers are in different coordinate systems. You may think they are in the same system if you display them together, but your geo-calculations may be wrong. Sometimes you will be confused in interpreting data, or mis-identify the coordinates because data are reprojected temporarily for display. Remember, if you have any questions about the coordinate system of a layer, look at the layer properties, as shown above. 6

 coordinate system.")

7 Let s explore this further. First let s look at the current data frame coordinate system. Right click on the name of the DATA FRAME in the TOC (with the default name of Layers, or in our case, New Data Frame in the first figure at the start of this lab), then left click on Properties Click on the Coordinate System tab, and it should display something like the window at right. The bottom half displays the current coordinate system. The GCS_WGS_1984 is the label for that specific geographic (lat./long.) coordinate system. The top half displays a selection window that allows you to set the coordinate system. Let s change the data frame coordinate system. Click on the Projected Coordinate Systems folder, then Continental, then North America, then the NAD83 Contiguous USA Albers, then O.K. Zoom to full layer, and notice it changes the shape of the US and Minnesota data, to look something like: 7


8 The data on disk haven t been changed, they ve just been temporarily reprojected to this specific Albers coordinate system. We can verify the DATA FRAME coordinate system (remember, right click on the data frame name in the TOC, then Properties, then the Coordinate System tab), it should look something like the right. Lab 2: Projections Note in the bottom window pane, it shows the new data frame coordinate system, here listed as Albers, with parameters. Change the Data Frame coordinate system again, this time selecting Projected Coordinate Systems à UTM à NAD à NAD83 UTM Zone 12 N Zoom to full extent, and display the data, noting the change in the projection, as at right. Finally, switch the Data Frame coordinate system again, this time back to the Geographic Coordinate Systems à North American à NAD83 UTM Note the change in shape. We haven t changed the projection of the data on the disk, we ve just told ArcMap to project on the fly, to a new system, before display. 8
.")
.")


9 Creating an Inset Map We can use this temporary projection to create an inset map in a different coordinate system, as you did last week; this time we ll use a different coordinate system for the inset. First, if you haven t closed out your last project, do so now, and create a ArcMap project new data frame (see figure at right). Lab 2: Projections Click here to create a new ArcMap project, or type Cntl-N on the keyboard Open the data frame properties, and verify that the data frame coordinate system is not set (right click on the data frame name, then properties, then the Coordinate System tab). The Data Frame Properties window should look like the figure at right, with the bottom pane showing no current coordinate system. We could set the data from manually through selection in the top pane. Don t do this now, but we could click on the folders, e.g., Projected coordinate systems, and navigate as above to set a coordinate system for the data frame. Alternately, we could load a layer that already has the coordinate system we want, and when we do this to an empty data frame, it will assign this layer s coordinate system to the data frame.. To clarify, loading a data layer into a new Data Frame sets the Data Frame coordinate system; all subsequent layers will be projected, if possible, on-the-fly to this original system while being displayed. Add the minn_county.shp layer to the empty data frame. Verify that the data frame coordinate system has now been set to NAD_1938_UTM_Zone_15N. 9


 Re-arrange the layers so the graticule is on top in the TOC, then the minn_count layer second, with the Countries layer")
10 Rename this data frame Minnesota Counties, and add the minn_county shapefile from the lab2 folder. Now, insert a new data frame, and name it Earth From Space. Again, verify that the data frame has no current coordinate system Now change the coordinate system for the data frame manually: Open the data frame properties, and set the Coordinate System to: Projected Coordinate Systems à World à The World from Space Again, look at the data from properties, you should see a bottom pane in the window that shows and orthographic projection, similar to the figure on the right. Add three data layers to this new data frame: Countries (boundaries of the World s countries in 1990, in geographic coordinates) minn_count (Minnesota counties, in UTM Zone 15N coordinates), and graticule15 (lines of constant latitude and longitude, at 15 degree intervals) Re-arrange the layers so the graticule is on top in the TOC, then the minn_count layer second, with the Countries layer at the bottom. Symbolize the minn_count layer so it is a solid bright color, and Countries polygons so they are a light or pastel, and the graticule as a thin black line, so that you have something like the figure at right. 10
. Notice there are boxes for each frame. They may overlap, so you may have to click one and hold to drag aside.")
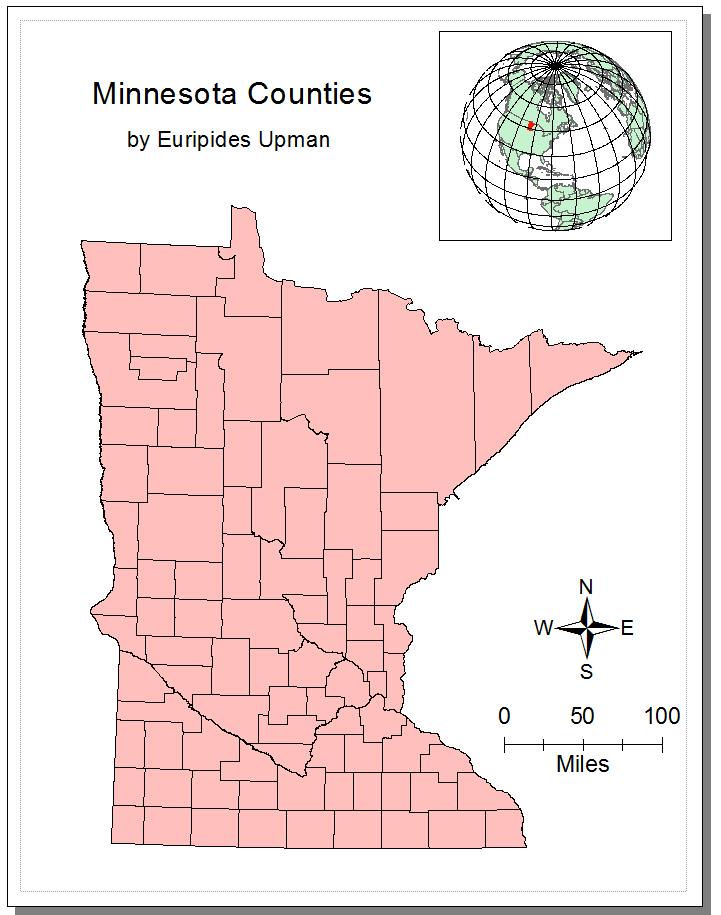
11 Zoom to the data layer full extent with, then switch to the first data frame with only the minn_count data (right click in TOC, Activate), and also zoom to full extent. Switch to layout view (see last week s lab). Notice there are boxes for each frame. They may overlap, so you may have to click one and hold to drag aside. Move and resize the boxes, perhaps also going back to the data view and panning/zooming, so that the Minnesota State box is larger, and the US/Minnesota combined data are about 1/6 th the size, as in many inset maps (see figure). You have two different frames in this common map design, with a small inset showing general location in one coordinate system, and a larger panel in a different coordinate system showing detail for the highlighted portion of the inset. Note that each panel has a bounding box or frame around it in the layout view. The larger bounding box interferes with the inset You can remove this bounding box by: right clicking on the box, selecting Properties from the bottom of the dropdown menu, and then the Frame tab in the resultant window. (see Video from last week, Data Frames) Add a North arrow to your map, a caption, your name, a legend, and descriptive title, and export/print a PDF, as instructed last week. See an example below of the map you should produce. Although you need not exactly match the colors and positions, make sure to include a proportioned main map and inset, a descriptive title, your name, a north arrow, and scale bar. 11
12 12 Lab 2: Projections

13 There are a couple of additional points about on-the fly-projections. Lab 2: Projections You may obtain data that has been projected to a coordinate system, but for which the identity of the coordinate system has been lost. This is most common with shapefiles, where the coordinate system information is stored in a.prj file, e.g., minn_county.prj. If the file is lost, damaged, mis-specified, or not copied with the rest of the shape files, then the ArcMap program can t identify the layer s coordinate system. If you know the coordinate system, you can add the prj file back or fix it for a geodatabase through the Define Projection tool in the ArcToolbox (shown at the right, we ll describe ArcToolbox more in the next section). If you don t know what the projection is, you either need to try to figure it out by matching coordinates or overlaying with other data, or you will likely have to discard the data, because it isn t very useful without knowledge of the coordinate system. Second, when you load some data you may get a message that says the datums may be incompatible, typically because there is not a datum transformation specified. You may ignore these warnings for this Lab (ONLY!). Datum transformations are described in the textbook, GIS Fundamentals, and elsewhere, and whether datum transformation differences are important depend on the source and target projections, the accuracy of the data, and the goals of the analyses. In this exercise, for the data we ve given you, the datum differences aren t significant, but datum shifts are important in many applications. 13
14 Projecting Data to a New File The Project Tool The above section describes how to reproject the coordinate values temporarily. However, we often want to permanently project the coordinate values in a data set from one coordinate system to a new data set, in a different projected coordinate system. We accomplish this in ArcGIS with the projection tool. Each time we apply the projection tool, we identify the source data set, the output data set, and the output projection. Most source data sets have a coordinate system associated with them. The Project tool reads this coordinate system to determine the input. We then specify the output, including the datum transformation, if needed, and save the new file to a target location (Video, Project to a new file). Create a New Map (FILE à Newà Blank Map) and insert two new empty data frames in addition to the default, for a total of three data frames. Now left click on the ArcToolbox, the little red toolbox along the Icon ribbon, or available via the Geoprocessing menu listed along the top bar, or perhaps a side bar (see arrows, below) 14


15 This should open the ArcToolbox (see right). Click on Data Management Tools then Projections and Transformations then Project The Project tool converts data from one coordinate system to another, saving the projected data to a new file. Detailed instructions for specific projection examples are provided a bit further on in this document, but the general process is to start the Project tool, and then: Select a data layer containing the features you like to convert to a new coordinate system Specify an output location and name for a new data layer Specify the output projection, and if need be, a datum transformation (Arc calls it a Geographic Transformation, the same thing as the datum transformation described in the textbook Apply the projection 15

16 Remember, ArcGIS shapefiles store information about the projection in a.prj file. For example, a layer named minn_county may have projection information stored in the file minn_county.prj. The.prj file is not mandatory, however, even though all data do have a coordinate system. Without a.prj, ArcMap is ignorant of the projection system, so you may have to specify the input as well as output projections in the general steps above. Detailed Instructions This section will step you through the projection screens. You will have to use these steps several more times in this Lab. In later iterations, refer back to this sequence. Start the Project Tool from the ArcToolbox, as shown in the previous figure. This opens a window where you specify the: Input data Output data set and location Output coordinate system, and optionally, a geographic transformation, usually (and in the textbook) called a datum transformation. You specify each of the projection options by clicking on the entry bars or adjacent buttons. Fill out the window as shown here, with helpful details on selecting the output coordinate system below. 16

17 Specifying the output projection is often done through navigating a tree of available options. Open the menu by clicking on the Output Coorindates selection icon: This opens a window with expandable lists, through which you can select a predefined coordinate system. The two most common choices are Geographic (latituded/longitude) and Projected (Cartesian) coordinate systems. Here successively click on the folders to select Projected, then click on Continental, 17


18 then click on North American then click on USA Contiguous Albers Equal Area Conic, then OK at the bottom of the window. Barring errors, the selected projection should show up in the Output Coordinate System window Clicking OK at the bottom of the window will perform the projection, and create a new file. The above will create the new data file, projecting from the original UTM zone 15 North 18

19 system to the Albers coordinate system you specified. Lab 2: Projections Now add the Albers_minncounty layer to an empty data frame, if it is not already added automatically. Change the name of this data frame to Albers (remember, right click on the data frame name in the table of contents, then select the Properties option, then the General tab, then type the new name in the Name textbox). Project to a UTM Coordinate System Activate one of the other data frames, and change its name to UTM Zone 15N Use the project tool again, with - input once again as the minn_county data - a new output data set, named UTM15_minncounty, - an output coordinate system via Projected Coordinate Systems, then UTM, then NAD83, then NAD83 UTM Zone 15N Your last screen when selecting the output coordinate system should look like that at the right Click on OK to apply the projection, and load the data to your data frame named UTM Zone 15N 19

, then Right click on Mercator (world), as shown below, then Left click on")
20 Project to a Custom Mercator Coordinate System Rename your remaining, empty data frame to Custom Mercator (Video, CustomProjection). Use the projection tool in ArcToolbox one more time, with - input once again as the minn_county data - a new output data set, named CustomMercator_minncounty, Lab 2: Projections - a custom output coordinate system where we select along the projection tree as before: Projected Coordinate Systems, then World, then Mercator (world), then Right click on Mercator (world), as shown below, then Left click on Copy and Modify.. 20


21 This should display a projected coordinate system properties menu (see figure at right). Lab 2: Projections You should change the name to Custom Mercator and change the Central_Meridian to You can then click on Apply, then OK to create the custom projection, and then click OK at the bottom of the projection list window to close that menu. You should then have the Project Tool window similar to that shown below Note the output coordinate system is set to Custom Mercator, And ArcGIS automatically set a Geographic Transformation (same as Datum Transformation). It guesses at the appropriate datum transformation based on your input and output, usually correctly. Hit OK to affect the projection. 21


22 Now you should have three different data frames, with three different versions of the Minnesota counties an Albers, a UTM, and a custom Mercator. Notice the shapes are different, not so much between the Albers and UTM, but noticeably so for the Mercator relative to the other two. Activate the measure tool, set the distance units to miles: Measure Distances from the northeastern-most point of Minnesota to the southwestermost point for each of your three projections. Do this as carefully as you can, it pays to expand the data frame window to as large as will fit on your screen. Write down the distances, perhaps on the lab 2 worksheet at the back of this lab, to be entered for online grading later. Also, record the coordinates for the northeast corner of Ramsey County for all three coordinate systems, as you did for the decimal degrees display at the start of this lab. Write the coordinates down for the Albers, UTM, and custom Mercator projection layers onto the worksheet at the end of this lab. 22

23 Create a map with all three Minnesota projections We wish to create a map with all three projections. For a fair comparison, we ll need to set a fixed scale for each of the data frames. First, go to the layout view, and in File > Page and Print Setup, set the Orientation button about mid-way down from Portrait to Landscape Reposition the 3 data frame boxes to be side by side and about the same size. You may want to change the colors of the layers in each data view for easy identification. On the layout view, select each data frame (one at a time), right click, select Properties and from the Data Frame tab, and change Extent to a fixed scale (see figure following). Set the scale for each Make each the same scale, something near 1:10,000,000 or so. Note you shouldn t type in the 1: or the commas into the window, we show them here for clarity. 23

 Add a name, North Arrow, title, and scalebar, and individual titles for each data")
24 The example shows a scale or 1:14,500,000, which may be a bit small, but anything between that and 1:10,000,000 should work. Make sure you choose the same fixed scale for each data frame and Apply, then OK. Note the default is a border around each data frame in the layout view, and the map looks better if you remove them, as shown before (Data Frame Properties à Frameà Bordersà none) Add a name, North Arrow, title, and scalebar, and individual titles for each data frame (see example). Note that you don t need to add a legend. 24
25 Distance Across Minnesota, from northeast to southwest, in miles: Albers: UTM Zone 15N: Custom Mercator: Coordinates of northeast corner of Ramsey County: Projection x-coordinate y-coordinate Decimal degrees Albers UTM Zone 15 Custom Mercator 25
Lab 2: Projecting Geographic Data
 Lab 2: Projecting Geographic Data What you ll Learn: Basic methods for map projections in ArcGIS Pro. What You ll Produce: A map of Minnesota in three different statewide projections, a map of reprojected
Geography 281 Map Making with GIS Project Eight: Comparing Map Projections
 Geography 281 Map Making with GIS Project Eight: Comparing Map Projections In this activity, you will do a series of projection comparisons using maps at different scales and geographic extents. In this
Task 1: Start ArcMap and add the county boundary data from your downloaded dataset to the data frame.
 Exercise 6 Coordinate Systems and Map Projections The following steps describe the general process that you will follow to complete the exercise. Specific steps will be provided later in the step-by-step
The data for this lab comes from McDonald Forest. We will be working with spatial data representing the forest boundary, streams, roads, and stands.
 GIS LAB 6 Using the Projection Utility. Converting Data to Oregon s Approved Lambert Projection. Determining Stand Size, Stand Types, Road Length, and Stream Length. This lab will ask you to work with
GEOREFERENCING, PROJECTIONS Part I. PRESENTING DATA Part II
 Week 7 GEOREFERENCING, PROJECTIONS Part I PRESENTING DATA Part II topics of the week Georeferencing Coordinate systems Map Projections ArcMap and Projections Geo-referencing Geo-referencing is the process
IDENTIFYING THE TYPE OF COORDINATE SYSTEM FOR DATA USING ARCMAP
 CHAPTER 1 IDENTIFYING THE TYPE OF COORDINATE SYSTEM FOR DATA USING ARCMAP I got a parcel shapefile from the county, but it doesn t line up with my other data in ArcMap. My boss told me to make a map using
(THIS IS AN OPTIONAL BUT WORTHWHILE EXERCISE)
") PART 2: Analysis in ArcGIS (THIS IS AN OPTIONAL BUT WORTHWHILE EXERCISE) Step 1: Start ArcCatalog and open a geodatabase If you have a shortcut icon for ArcCatalog on your desktop, double-click it to start
PART 2: Analysis in ArcGIS (THIS IS AN OPTIONAL BUT WORTHWHILE EXERCISE) Step 1: Start ArcCatalog and open a geodatabase If you have a shortcut icon for ArcCatalog on your desktop, double-click it to start
Displaying Latitude & Longitude Data (XY Data) in ArcGIS
 in ArcGIS") Displaying Latitude & Longitude Data (XY Data) in ArcGIS Created by Barbara Parmenter and updated on 2/15/2018 If you have a table of data that has longitude and latitude, or XY coordinates, you can view
Displaying Latitude & Longitude Data (XY Data) in ArcGIS Created by Barbara Parmenter and updated on 2/15/2018 If you have a table of data that has longitude and latitude, or XY coordinates, you can view
Trouble-Shooting Coordinate System Problems
 Trouble-Shooting Coordinate System Problems Written by Barbara M. Parmenter. Revised on October 2, 2018 OVERVIEW OF THE EXERCISE... 1 COPYING THE MAP PROJECTION EXERCISE FOLDER TO YOUR H: DRIVE OR DESKTOP...
Data Structures & Database Queries in GIS
 Data Structures & Database Queries in GIS Objective In this lab we will show you how to use ArcGIS for analysis of digital elevation models (DEM s), in relationship to Rocky Mountain bighorn sheep (Ovis
Identifying coordinate systems for data using ArcMap
 Chapter 1 Identifying coordinate systems for data using ArcMap I got a parcel shapefile from the county but it doesn t line up with my other data in ArcMap. My boss told me to make a map using ArcMap,
The Geodatabase Working with Spatial Analyst. Calculating Elevation and Slope Values for Forested Roads, Streams, and Stands.
 GIS LAB 7 The Geodatabase Working with Spatial Analyst. Calculating Elevation and Slope Values for Forested Roads, Streams, and Stands. This lab will ask you to work with the Spatial Analyst extension.
GIS Workshop UCLS_Fall Forum 2014 Sowmya Selvarajan, PhD TABLE OF CONTENTS
 TABLE OF CONTENTS TITLE PAGE NO. 1. ArcGIS Basics I 2 a. Open and Save a Map Document 2 b. Work with Map Layers 2 c. Navigate in a Map Document 4 d. Measure Distances 4 2. ArcGIS Basics II 5 a. Work with
MERGING (MERGE / MOSAIC) GEOSPATIAL DATA
 GEOSPATIAL DATA") This help guide describes how to merge two or more feature classes (vector) or rasters into one single feature class or raster dataset. The Merge Tool The Merge Tool combines input features from input
This help guide describes how to merge two or more feature classes (vector) or rasters into one single feature class or raster dataset. The Merge Tool The Merge Tool combines input features from input
Trouble-Shooting Coordinate System Problems
 Trouble-Shooting Coordinate System Problems Written by Barbara M. Parmenter, revised 2/25/2014 OVERVIEW OF THE EXERCISE... 1 COPYING THE MAP PROJECTION EXERCISE FOLDER TO YOUR H: DRIVE OR DESKTOP... 2
Tutorial 8 Raster Data Analysis
 Objectives Tutorial 8 Raster Data Analysis This tutorial is designed to introduce you to a basic set of raster-based analyses including: 1. Displaying Digital Elevation Model (DEM) 2. Slope calculations
How to Create Stream Networks using DEM and TauDEM
 How to Create Stream Networks using DEM and TauDEM Take note: These procedures do not describe all steps. Knowledge of ArcGIS, DEMs, and TauDEM is required. TauDEM software ( http://hydrology.neng.usu.edu/taudem/
Exercise 3: GIS data on the World Wide Web
 Exercise 3: GIS data on the World Wide Web These web sites are a few examples of sites that are serving free GIS data. Many other sites exist. Search in Google or other search engine to find GIS data for
In this exercise we will learn how to use the analysis tools in ArcGIS with vector and raster data to further examine potential building sites.
 GIS Level 2 In the Introduction to GIS workshop we filtered data and visually examined it to determine where to potentially build a new mixed use facility. In order to get a low interest loan, the building
How to Make or Plot a Graph or Chart in Excel
 This is a complete video tutorial on How to Make or Plot a Graph or Chart in Excel. To make complex chart like Gantt Chart, you have know the basic principles of making a chart. Though I have used Excel
Studying Topography, Orographic Rainfall, and Ecosystems (STORE)
") Studying Topography, Orographic Rainfall, and Ecosystems (STORE) Introduction Basic Lesson 3: Using Microsoft Excel to Analyze Weather Data: Topography and Temperature This lesson uses NCDC data to compare
Studying Topography, Orographic Rainfall, and Ecosystems (STORE) Introduction Basic Lesson 3: Using Microsoft Excel to Analyze Weather Data: Topography and Temperature This lesson uses NCDC data to compare
GIS in Management Planning. Lab 2 Coordinate Systems and Map Projections
 GIS in Management Planning Lab 2 Coordinate Systems and Map Projections Tomislav Sapic GIS Technologist Faculty of Natural Resources Management Lakehead University ArcGIS ArcToolbox Projections Functions
WindNinja Tutorial 3: Point Initialization
 WindNinja Tutorial 3: Point Initialization 6/27/2018 Introduction Welcome to WindNinja Tutorial 3: Point Initialization. This tutorial will step you through the process of downloading weather station data
Delineation of Watersheds
 Delineation of Watersheds Adirondack Park, New York by Introduction Problem Watershed boundaries are increasingly being used in land and water management, separating the direction of water flow such that
Experiment 13. Dilutions and Data Handling in a Spreadsheet rev 1/2013
 Absorbance Experiment 13 Dilutions and Data Handling in a Spreadsheet rev 1/2013 GOAL: This lab experiment will provide practice in making dilutions using pipets and introduce basic spreadsheet skills
Downloading GPS Waypoints
 Downloading Data with DNR- GPS & Importing to ArcMap and Google Earth Written by Patrick Florance & Carolyn Talmadge, updated on 4/10/17 DOWNLOADING GPS WAYPOINTS... 1 VIEWING YOUR POINTS IN GOOGLE EARTH...
Watershed Modeling Orange County Hydrology Using GIS Data
 v. 10.0 WMS 10.0 Tutorial Watershed Modeling Orange County Hydrology Using GIS Data Learn how to delineate sub-basins and compute soil losses for Orange County (California) hydrologic modeling Objectives
Introduction to ArcGIS 10.2
 Introduction to ArcGIS 10.2 Francisco Olivera, Ph.D., P.E. Srikanth Koka Lauren Walker Aishwarya Vijaykumar Keri Clary Department of Civil Engineering April 21, 2014 Contents Brief Overview of ArcGIS 10.2...
CE 365K Exercise 1: GIS Basemap for Design Project Spring 2014 Hydraulic Engineering Design
 CE 365K Exercise 1: GIS Basemap for Design Project Spring 2014 Hydraulic Engineering Design The purpose of this exercise is for you to construct a basemap in ArcGIS for your design project. You may execute
Handling Raster Data for Hydrologic Applications
 Handling Raster Data for Hydrologic Applications Prepared by Venkatesh Merwade Lyles School of Civil Engineering, Purdue University vmerwade@purdue.edu January 2018 Objective The objective of this exercise
Lab#3: GIS Projections and Coordinate Systems. Start Arcmap and create a data frame for each of the above coordinate systems.
 NRM338 Fall 2017 Lab#3 Page#1 of 18 In this lab, you will Lab#3: GIS Projections and Coordinate Systems 1) Define the geographic coordinate system of two GIS themes. 2) Determine the geographic coordinates
In order to follow this exercise you need to have completed exercise 1.
 In order to follow this exercise you need to have completed exercise 1. Contents of Exercise 2: Derive new datasets from inputs and carry out Multicriteria analysis in order to Part 1: Use Spatial Analysis
How to Convert USGS Topographic GeoPDF 1 Maps to GeoTIFF using ArcGIS 10.4
 How to Convert USGS Topographic GeoPDF 1 Maps to GeoTIFF using ArcGIS 10.4 This tutorial assumes that you have: 1) downloaded some USGS geopdfs, 2) a pdf reader such as Adobe Acrobat, and 3) ArcGIS 10.4
Vector Analysis: Farm Land Suitability Analysis in Groton, MA
 Vector Analysis: Farm Land Suitability Analysis in Groton, MA Written by Adrienne Goldsberry, revised by Carolyn Talmadge 10/9/2018 Introduction In this assignment, you will help to identify potentially
Catchment Delineation Workflow
 Catchment Delineation Workflow Slide 1 Given is a GPS point (Lat./Long.) for an outlet location. The outlet could be a proposed Dam site, a storm water drainage culvert on a rural highway, or any other
Lab#8: Working With Geodatabases. create a geodatabase with feature datasets, tables, raster datasets, and raster catalogs
 Lab#8: Geodatabase Concepts Page#1 of 25 In this lab, you will learn how to: Lab#8: Working With Geodatabases create a geodatabase with feature datasets, tables, raster datasets, and raster catalogs join
Working with ArcGIS: Classification
 Working with ArcGIS: Classification 2 Abbreviations D-click R-click TOC Double Click Right Click Table of Content Introduction The benefit from the use of geographic information system (GIS) software is
Outline Anatomy of ArcGIS Metadata Data Types Vector Raster Conversion Adding Data Navigation Symbolization Methods Layer Files Editing Help Files
 UPlan Training Lab Exercise: Introduction to ArcGIS Outline Anatomy of ArcGIS Metadata Data Types Vector Raster Conversion Adding Data Navigation Symbolization Methods Layer Files Editing Help Files Anatomy
Chemistry 14CL. Worksheet for the Molecular Modeling Workshop. (Revised FULL Version 2012 J.W. Pang) (Modified A. A. Russell)
 (Modified A. A. Russell)") Chemistry 14CL Worksheet for the Molecular Modeling Workshop (Revised FULL Version 2012 J.W. Pang) (Modified A. A. Russell) Structure of the Molecular Modeling Assignment The molecular modeling assignment
Chemistry 14CL Worksheet for the Molecular Modeling Workshop (Revised FULL Version 2012 J.W. Pang) (Modified A. A. Russell) Structure of the Molecular Modeling Assignment The molecular modeling assignment
Within this document, the term NHDPlus is used when referring to NHDPlus Version 2.1 (unless otherwise noted).
.") Exercise 7 Watershed Delineation Using ArcGIS Spatial Analyst Last Updated 4/6/2017 Within this document, the term NHDPlus is used when referring to NHDPlus Version 2.1 (unless otherwise noted). There
Exercise 7 Watershed Delineation Using ArcGIS Spatial Analyst Last Updated 4/6/2017 Within this document, the term NHDPlus is used when referring to NHDPlus Version 2.1 (unless otherwise noted). There
Global Atmospheric Circulation Patterns Analyzing TRMM data Background Objectives: Overview of Tasks must read Turn in Step 1.
 Global Atmospheric Circulation Patterns Analyzing TRMM data Eugenio Arima arima@hws.edu Hobart and William Smith Colleges Department of Environmental Studies Background: Have you ever wondered why rainforests
Lecture 2. A Review: Geographic Information Systems & ArcGIS Basics
 Lecture 2 A Review: Geographic Information Systems & ArcGIS Basics GIS Overview Types of Maps Symbolization & Classification Map Elements GIS Data Models Coordinate Systems and Projections Scale Geodatabases
Presenting Tree Inventory. Tomislav Sapic GIS Technologist Faculty of Natural Resources Management Lakehead University
 Presenting Tree Inventory Tomislav Sapic GIS Technologist Faculty of Natural Resources Management Lakehead University Suggested Options 1. Print out a Google Maps satellite image of the inventoried block
Introduction to ArcMap
 Introduction to ArcMap ArcMap ArcMap is a Map-centric GUI tool used to perform map-based tasks Mapping Create maps by working geographically and interactively Display and present Export or print Publish
Lab 5 - Introduction to the Geodatabase
 Lab 5 - Introduction to the Geodatabase 1. Design Process GIS is becoming an increasingly accessible and important tool for land managers. In this exercise you will begin creating a Personal Geodatabase
Lesson Plan 2 - Middle and High School Land Use and Land Cover Introduction. Understanding Land Use and Land Cover using Google Earth
 Understanding Land Use and Land Cover using Google Earth Image an image is a representation of reality. It can be a sketch, a painting, a photograph, or some other graphic representation such as satellite
WORKING WITH DMTI DIGITAL ELEVATION MODELS (DEM)
") WORKING WITH DMTI DIGITAL ELEVATION MODELS (DEM) Contents (Ctrl-Click to jump to a specific page) Manipulating the DEM Step 1: Finding the DEM Tiles You Need... 2 Step 2: Importing the DEM Tiles into ArcMap...
WORKING WITH DMTI DIGITAL ELEVATION MODELS (DEM) Contents (Ctrl-Click to jump to a specific page) Manipulating the DEM Step 1: Finding the DEM Tiles You Need... 2 Step 2: Importing the DEM Tiles into ArcMap...
Geography 281 Map Making with GIS Project Four: Comparing Classification Methods
 Geography 281 Map Making with GIS Project Four: Comparing Classification Methods Thematic maps commonly deal with either of two kinds of data: Qualitative Data showing differences in kind or type (e.g.,
Learning ArcGIS: Introduction to ArcCatalog 10.1
 Learning ArcGIS: Introduction to ArcCatalog 10.1 Estimated Time: 1 Hour Information systems help us to manage what we know by making it easier to organize, access, manipulate, and apply knowledge to the
caused displacement of ocean water resulting in a massive tsunami. II. Purpose
 I. Introduction The Great Sumatra Earthquake event took place on December 26, 2004, and was one of the most notable and devastating natural disasters of the decade. The event consisted of a major initial
EOS 102: Dynamic Oceans Exercise 1: Navigating Planet Earth
 EOS 102: Dynamic Oceans Exercise 1: Navigating Planet Earth YOU MUST READ THROUGH THIS CAREFULLY! This exercise is designed to familiarize yourself with Google Earth and some of its basic functions while
Lab 1: Importing Data, Rectification, Datums, Projections, and Coordinate Systems
 Lab 1: Importing Data, Rectification, Datums, Projections, and Coordinate Systems Topics covered in this lab: i. Importing spatial data to TAS ii. Rectification iii. Conversion from latitude/longitude
Create Satellite Image, Draw Maps
 Create Satellite Image, Draw Maps 1. The goal Using Google Earth, we want to create and import a background file into our Adviser program. From there, we will be creating paddock boundaries. The accuracy
ENV101 EARTH SYSTEMS
 ENV101 EARTH SYSTEMS Practical Exercise 2 Introduction to ArcMap and Map Projections 1. OVERVIEW This practical is designed to familiarise students with the use of ArcMap for visualising spatial data and
Modeling Incident Density with Contours in ArcGIS Pro
 Modeling Incident Density with Contours in ArcGIS Pro By Mike Price, Entrada/San Juan, Inc. What you will need ArcGIS Pro 1.4 license or later ArcGIS Spatial Analyst license ArcGIS Online for organizational
Assignment #0 Using Stellarium
 Name: Class: Date: Assignment #0 Using Stellarium The purpose of this exercise is to familiarize yourself with the Stellarium program and its many capabilities and features. Stellarium is a visually beautiful
Task 1: Open ArcMap and activate the Spatial Analyst extension.
 Exercise 10 Spatial Analyst The following steps describe the general process that you will follow to complete the exercise. Specific steps will be provided later in the step-by-step instructions component
Full file at https://fratstock.eu
 Full file at https://fratstockeu Chapter 1 to Exercises 1 1 The feature data set is called Transportation It has two feature classes, majroads and interstates Method: Use the Add Data button to look at
Lab 1: Importing Data, Rectification, Datums, Projections, and Output (Mapping)
") Lab 1: Importing Data, Rectification, Datums, Projections, and Output (Mapping) Topics covered in this lab: i. Importing spatial data to TAS ii. Rectification iii. Conversion from latitude/longitude to
Lab 1: Importing Data, Rectification, Datums, Projections, and Output (Mapping) Topics covered in this lab: i. Importing spatial data to TAS ii. Rectification iii. Conversion from latitude/longitude to
Experiment: Oscillations of a Mass on a Spring
 Physics NYC F17 Objective: Theory: Experiment: Oscillations of a Mass on a Spring A: to verify Hooke s law for a spring and measure its elasticity constant. B: to check the relationship between the period
Projections and Coordinate Systems
 Projections and Coordinate Systems Overview Projections Examples of different projections Coordinate systems Datums Projections Overview Projections and Coordinate Systems GIS must accurately represent
Tutorial using the 2011 Statistics Canada boundary files and the Householder survey
 Tutorial using the 2011 Statistics Canada boundary files and the Householder survey In this tutorial, we ll try to determine the wards that contain the highest income groups. To do this, we will have to
Overlay Analysis II: Using Zonal and Extract Tools to Transfer Raster Values in ArcMap
 Overlay Analysis II: Using Zonal and Extract Tools to Transfer Raster Values in ArcMap Created by Patrick Florance and Jonathan Gale, Edited by Catherine Ressijac on March 26, 2018 If you have raster data
Lab #3 Map Projections.
 Lab #3 Map Projections http://visual.merriam-webster.com/images/earth/geography/cartography/map-projections.jpg Map Projections Projection: a systematic arrangement of parallels and meridians on a plane
Introduction to Coastal GIS
 Introduction to Coastal GIS Event was held on Tues, 1/8/13 - Thurs, 1/10/13 Time: 9:00 am to 5:00 pm Location: Roger Williams University, Bristol, RI Audience: The intended audiences for this course are
Experiment 0 ~ Introduction to Statistics and Excel Tutorial. Introduction to Statistics, Error and Measurement
 Experiment 0 ~ Introduction to Statistics and Excel Tutorial Many of you already went through the introduction to laboratory practice and excel tutorial in Physics 1011. For that reason, we aren t going
1. Double-click the ArcMap icon on your computer s desktop. 2. When the ArcMap start-up dialog box appears, click An existing map and click OK.
 Module 2, Lesson 1 The earth moves In this activity, you will observe worldwide patterns of seismic activity (earthquakes) and volcanic activity (volcanoes). You will analyze the relationships of those
ArcGIS for Applied Economists Session 2
 ArcGIS for Applied Economists Session 2 Mark Westcott LMU Munich June 15, 2015 1 / 31 Topics for this session: Geographic Coordinate Systems Projections Projected Coordinate Systems Geocoding 2 / 31 Some
Part 1: GIS Data from the Web: Downloading and Projecting Digital Elevation Models (DEM) and BTS Road data
 and BTS Road data") Field Geology I Hometown GIS, Part 1 October 03, 2005 Lab Exercise 2.1 Part 1: GIS Data from the Web: Downloading and Projecting Digital Elevation Models (DEM) and BTS Road data 1. Introduction a. GIS
Field Geology I Hometown GIS, Part 1 October 03, 2005 Lab Exercise 2.1 Part 1: GIS Data from the Web: Downloading and Projecting Digital Elevation Models (DEM) and BTS Road data 1. Introduction a. GIS
Working with Map Projections
 Working with Map Projections Rachel Applebaum and Margaret M. Maher Author of Lining Up Data in ArcGIS: a guide to map projections Second edition Some common problems that prevent data from aligning correctly
Geographical Information Systems
 Geographical Information Systems Geographical Information Systems (GIS) is a relatively new technology that is now prominent in the ecological sciences. This tool allows users to map geographic features
Getting Started. Start ArcMap by opening up a new map.
 Start ArcMap by opening up a new map. Getting Started We now need to set up ArcMap to do some analysis using the Spatial Analyst extension. You will need to activate the Spatial Analyst extension by selecting
Urban Canopy Tool User Guide `bo`
 Urban Canopy Tool User Guide `bo` ADMS Urban Canopy Tool User Guide Version 2.0 June 2014 Cambridge Environmental Research Consultants Ltd. 3, King s Parade Cambridge CB2 1SJ UK Telephone: +44 (0)1223
ArcGIS 9 ArcGIS StreetMap Tutorial
 ArcGIS 9 ArcGIS StreetMap Tutorial Copyright 2001 2008 ESRI All Rights Reserved. Printed in the United States of America. The information contained in this document is the exclusive property of ESRI. This
Data Set Projection Checklist
 1 of 6 12/20/2012 12:38 PM Data Set Projection Checklist There are two projections/coordinate systems you must worry about: 1. 2. That of your map. You can pick this to be whatever you want, and your GIS
GEOG 3830 Geographic Information Systems
 1 GEOG 3830 Geographic Information Systems Lab 08: Spatial Relationships The objective of this lab exercise is to introduce students to a technique commonly used to evaluate the most basic types of spatial
Exercise 4. Watershed and Stream Network Delineation
 Exercise 4. Watershed and Stream Network Delineation GIS in Water Resources, Fall 2014 Prepared by David G Tarboton and David R. Maidment Purpose The purpose of this exercise is to illustrate watershed
GST 101: Introduction to Geospatial Technology Lab 3 - Understanding Coordinate Systems and Map Projections
 GST 101: Introduction to Geospatial Technology Lab 3 - Understanding Coordinate Systems and Map Projections Objective Explore and Understand Coordinate Systems and Map Projections Document Version: 3/3/2015
Different Displays of Thematic Maps:
 Different Displays of Thematic Maps: There are a number of different ways to display or classify thematic maps, including: Natural Breaks Equal Interval Quantile Standard Deviation What s important to
Laboratory Topic 4: Projections and Geo-Positioning in ArcGIS [ LAEP/GEOG c188 ]
![Laboratory Topic 4: Projections and Geo-Positioning in ArcGIS [ LAEP/GEOG c188 ]](/thumbs/81/82687491.jpg "Laboratory Topic 4: Projections and Geo-Positioning in ArcGIS [ LAEP/GEOG c188 ]") Laboratory Topic 4: Projections and Geo-Positioning in ArcGIS 10.4.1 - [ LAEP/GEOG c188 ] Projections in ArcGIS 10.4.1 In this tutorial you will learn to identify the Projection and Datum of a dataset,
Laboratory Topic 4: Projections and Geo-Positioning in ArcGIS 10.4.1 - [ LAEP/GEOG c188 ] Projections in ArcGIS 10.4.1 In this tutorial you will learn to identify the Projection and Datum of a dataset,
Brief Overview of Geodatabases. Procedure IT GEOGRAPHIC INFORMATION SYSTEMS LAB 9 GEODATABASE AND DIGITIZING SHAPEFILED
 Developing entirely new maps using on-screen digitizing to create spatial features (such as points, lines, and polygons) is a vital GIS capability. ArcGIS provides a useful, but proprietary, spatial data
Environmental Systems Research Institute
 Introduction to ArcGIS ESRI Environmental Systems Research Institute Redlands, California 2 ESRI GIS Development Arc/Info (coverage model) Versions 1-7 from 1980 1999 Arc Macro Language (AML) ArcView (shapefile
v Prerequisite Tutorials GSSHA WMS Basics Watershed Delineation using DEMs and 2D Grid Generation Time minutes
 v. 10.1 WMS 10.1 Tutorial GSSHA WMS Basics Creating Feature Objects and Mapping Attributes to the 2D Grid Populate hydrologic parameters in a GSSHA model using land use and soil data Objectives This tutorial
Introduction to Computer Tools and Uncertainties
 Experiment 1 Introduction to Computer Tools and Uncertainties 1.1 Objectives To become familiar with the computer programs and utilities that will be used throughout the semester. To become familiar with
Automatic Watershed Delineation using ArcSWAT/Arc GIS
 Automatic Watershed Delineation using ArcSWAT/Arc GIS By: - Endager G. and Yalelet.F 1. Watershed Delineation This tool allows the user to delineate sub watersheds based on an automatic procedure using
Exercise 4. Watershed and Stream Network Delineation
 Exercise 4. Watershed and Stream Network Delineation GIS in Water Resources, Fall 2015 Prepared by David G Tarboton and David R. Maidment Purpose The purpose of this exercise is to illustrate watershed
Lab 7: Cell, Neighborhood, and Zonal Statistics
 Lab 7: Cell, Neighborhood, and Zonal Statistics Exercise 1: Use the Cell Statistics function to detect change In this exercise, you will use the Spatial Analyst Cell Statistics function to compare the
Open ArcToolbox Spatial Analyst Tools Hydrology. This should display the tools shown at the right:
 Project 2: Watershed Functions Save and close your project, above, if you haven t done so already. Then, open a new project, and add the driftless DEM. We ll be using ArcToolbox for this new project, but
ST-Links. SpatialKit. Version 3.0.x. For ArcMap. ArcMap Extension for Directly Connecting to Spatial Databases. ST-Links Corporation.
 ST-Links SpatialKit For ArcMap Version 3.0.x ArcMap Extension for Directly Connecting to Spatial Databases ST-Links Corporation www.st-links.com 2012 Contents Introduction... 3 Installation... 3 Database
Exercise 12 Spatial Analysis on Antarctica
 Exercise 12 Spatial Analysis on Antarctica Due: Tuesday, March 6 Goal: Using ArcMap s Spatial Analyst tools for digital elevation models and rasters. Datasets: Bed elevation Ice thickness Surface elevation
Exercise 4. Watershed and Stream Network Delineation
 Exercise 4. Watershed and Stream Network Delineation GIS in Water Resources, Fall 2016 Prepared by David G Tarboton and David R. Maidment Updated to ArcGIS Pro by Paul Ruess [9/29/16 Further updated to
Experiment 1: The Same or Not The Same?
 Experiment 1: The Same or Not The Same? Learning Goals After you finish this lab, you will be able to: 1. Use Logger Pro to collect data and calculate statistics (mean and standard deviation). 2. Explain
How many states. Record high temperature
 Record high temperature How many states Class Midpoint Label 94.5 99.5 94.5-99.5 0 97 99.5 104.5 99.5-104.5 2 102 102 104.5 109.5 104.5-109.5 8 107 107 109.5 114.5 109.5-114.5 18 112 112 114.5 119.5 114.5-119.5
LAB 2 - ONE DIMENSIONAL MOTION
 Name Date Partners L02-1 LAB 2 - ONE DIMENSIONAL MOTION OBJECTIVES Slow and steady wins the race. Aesop s fable: The Hare and the Tortoise To learn how to use a motion detector and gain more familiarity
Using the Stock Hydrology Tools in ArcGIS
 Using the Stock Hydrology Tools in ArcGIS This lab exercise contains a homework assignment, detailed at the bottom, which is due Wednesday, October 6th. Several hydrology tools are part of the basic ArcGIS
2G1/3G4 GIS TUTORIAL >>>>>>>>>>>>>>>>>>>>>>>>>>>>>>>>>>>>>>>>>>>>>>>>>>>>>>>>>>>>>>>>>>>>>>>>>>>>>>>>
 > University of Michigan >Taubman College of Architecture > ARCH 552, Perimeter @ Work Out [T]here, Fall 2009 >September 24, 2009 2G1/3G4 GIS TUTORIAL >>>>>>>>>>>>>>>>>>>>>>>>>>>>>>>>>>>>>>>>>>>>>>>>>>>>>>>>>>>>>>>>>>>>>>>>>>>>>>>>
Studying Topography, Orographic Rainfall, and Ecosystems (STORE)
") Introduction Studying Topography, Orographic Rainfall, and Ecosystems (STORE) Lesson: Using ArcGIS Explorer to Analyze the Connection between Topography, Tectonics, and Rainfall GIS-intensive Lesson This
Introduction Studying Topography, Orographic Rainfall, and Ecosystems (STORE) Lesson: Using ArcGIS Explorer to Analyze the Connection between Topography, Tectonics, and Rainfall GIS-intensive Lesson This
Lab 1 Uniform Motion - Graphing and Analyzing Motion
 Lab 1 Uniform Motion - Graphing and Analyzing Motion Objectives: < To observe the distance-time relation for motion at constant velocity. < To make a straight line fit to the distance-time data. < To interpret
Exercise 6: Using Burn Severity Data to Model Erosion Risk
 Exercise 6: Using Burn Severity Data to Model Erosion Risk Document Updated: November 2009 Software Versions: ERDAS Imagine 9.3 and ArcGIS 9.3, Microsoft Office 2007 Introduction A common use of burn severity
Geodatabases and ArcCatalog
 Geodatabases and ArcCatalog Francisco Olivera, Ph.D., P.E. Srikanth Koka Lauren Walker Aishwarya Vijaykumar Keri Clary Department of Civil Engineering April 21, 2014 Contents Geodatabases and ArcCatalog...