University of Paris VI (Pierre at Marie Curie) Dates: Polish Academy of Sciences, Institute of Geography Dates:
|
|
|
- Ilene Lee
- 6 years ago
- Views:
Transcription
, Poland Tel: (+ 48 22) 3291970, Fax: (+48 22) 3291950 e-mail: dariusz.dukaczewski@igik.edu.pl, darek@igik.edu.pl Biography Position: Tutor Date of birth: 28.")
1 Dariusz Dukaczewski IGiK Instytut Geodezji i Kartografii, ZSIP (Institute of Geodesy and Cartography, GIS Department) ul. Modzelewskiego 27, Warszawa (Warsaw), Poland Tel: ( ) , Fax: (+48 22) dariusz.dukaczewski@igik.edu.pl, darek@igik.edu.pl Biography Position: Tutor Date of birth: Education: Institution: University of Warsaw, Department of Geography, Institute of Cartography Dates: Degree/Diploma: M.Sc. diploma in Geography with specialization in Cartography Institution: University of Paris VI (Pierre at Marie Curie) Dates: Degree/Diploma: DESS diploma in Remote Sensing Institution: Polish Academy of Sciences, Institute of Geography Dates: Degree/Diploma: Ph.D. diploma in Earth Sciences Professional experience: lecturer at Laboratory of Remote Sensing, Cartographic Institute (University of Warsaw) lecturer at Institute of Geography, Polish Academy of Sciences. Since lecturer, senior lecturer, tutor at IGiK. Activities: Research concerning: dynamic and interactive visualization, application of new media technologies to cartography, web cartography, application of remote sensing data in thematic mapping, decision making management, GI, Data Policy. Author of 61 published works, author or co-author of many GIS, data bases, cartographic animations, thematic maps.
2 METHOD OF CHOICE OF VARIABLES AND CARTOGRAPHIC PRESENTATION METHODS FOR COMPLEX CARTOGRAPHIC ANIMATIONS Abstract Dariusz Dukaczewski Institute of Geodesy and Cartography (IGiK), ul. Modzelewskiego 27, Warszawa Recently, the complex cartographic interactive animations, have become more widespread. Using the author s results of investigations in possibilities and limitations of application of static and dynamic variables and related cartographic methods in the creation of animations, as well as new research author proposes the entities polystaymic method of selection of variables for complex temporal cartographic animations. Introduction After over 45 years of development, digital cartographic animations have become entirely operational tool for the visualization of the dynamics. Recently it becomes also possible to create complex interactive animations, including a number of sub-animations, which allows to present more information about the correlated dynamic processes and/or about their causes. In author s opinion, one of the key factors of efficiency of cartographic animations is a proper choice of the variables at suitable levels of measurement and on an appropriate method of cartographic presentation. Using the results of investigations on entities-cartotrophic method (Dukaczewski, 2005) and new research on complex interactive animations properties author proposes the method of selection of variables and cartographic presentation methods for complex temporal animations. To achieve this goal it was necessary to propose a classification of complex animations, to investigate possibilities of combined usage of cartographic presentation methods in complex animations, to re-evaluate the possibilities of combined usage of static variables (size, value, colour, form; grain, orientation, transparency, and (proposed) brilliance, halo/aura) and dynamic variables (moment, duration, frequency, order, rate of change, and (proposed) way of transition). The next step was a creation of the matrix of combinations of groups of variables and related cartographic methods. The proposed method of choice of variables and cartographic presentation methods for complex


3 temporal animations employs the results of research in possibilities of use of variables in the creation of sub-animations. It uses also matrices of combined usage of cartographic presentation methods, as well as matrix of combined use of groups of methods and variables in the complex animations. Classification of complex animations Analysis of recent animations allowed author to propose classification based on criterion of concept of internal structure. It was possible to distinguish types of analytical and synthetical animations, and subtypes of simple and complex animations. Both in the case of simple and complex animations it is possible to distinguish monomodule and multimodule, as well as multilevel and monolevel animations. Analysing the types of scenarios, it was possible to distinguish: automatic and user-supervised scenarios of linear or non-linear type, of simple or tree structure, gradual or non-gradual order, parametrical or non-parametrical solutions and calculation or non-calculation character, what allowed to distinguish 512 types of scenarios. For the purposes of research all sub-animations were classified (like simple animations), using typology based on entity types and the measurement levels (Dukaczewski, 2005) and using the same system of notation. Evaluation of the combinations of cartographic presentation methods The object of evaluation were 24 main types of cartographic methods of presentation. Each combination was tested, taking into the consideration semiotic rules and criteria used in cartographic methodology. The result was matrix of evaluation of the combinations of cartographic presentation methods. It was possible to distinguish 191 correct combinations of methods. The most connectible method were: ordinary level point signatures, dot method, ordinary level point choropleth maps, ordinary level point cartodiagrams (appendix 1). Possibilities of combined usage of static and dynamic variables and related methods Evaluation of the application of static visual variables (Dukaczewski, 2005) was completed for the new proposed variable of aura (fig. 1), allowing symbols to be a source of light, be neutral or to be the object which absorbs the light. This (proposed) variable could be ranked Fig 1. Proposed variable of aura
4 (like grain, orientation, transparency and brillance) among the facultative static variables (Dukaczewski, 2006). The revised proposition of evaluation of application of static visual variables was shown in figure 2. point symbols line symbols area symbols level level level static visual variables quantitative ordinary nominal quantitative ordinary nominal quantitative ordinary nominal size X X X value C C C colour C C C X X? X? form X X X X X X grain X? X? N SP X X X orientation X X SP? X X SP? X X brilliance X X X X C transparency X X X X C aura X X X X X X solution correct SP? sporadically practiced, but doubtful N SP not practiced or sporadically practiced X? incorrect, doubtful C conditional X incorrect Figure 2 Evaluation of application of static visual variables at different measurement levels The next step was revision of matrix of correct combined applications of static variables (appendix 2) and revision of the matrix of semiotic evaluation of combined applications of 8 static and 7 dynamic variables: duration, order, rate of change (DiBiase, MacEachren et all., 1992), frequency, display date (MacEachren, A., 1994) and way of transition (Dukaczewski, 2000) (appendix 3). Each combination of static variables was evaluated, using criteria proposed by author (fig 2), solutions of Rød (1997), perceptual evaluations of visual variables (Köbben, Yaman, 1996), and semantic rules used in cartography. The introduction of proposed aura resulted in increase from 56 to 77 the number of correct combined applications of static variables and from 101 to 127 the number correct application of static and dynamic variables. The next step was to create the matrix of combinations of groups of variables and related cartographic methods, The result was big matrix of 127!/2 rows, based on correct combinations of static and dynamic variables (appendix 2) and matrix of correct combination of methods (appendix 1), employing the same criteria of evaluation (fig. 3).
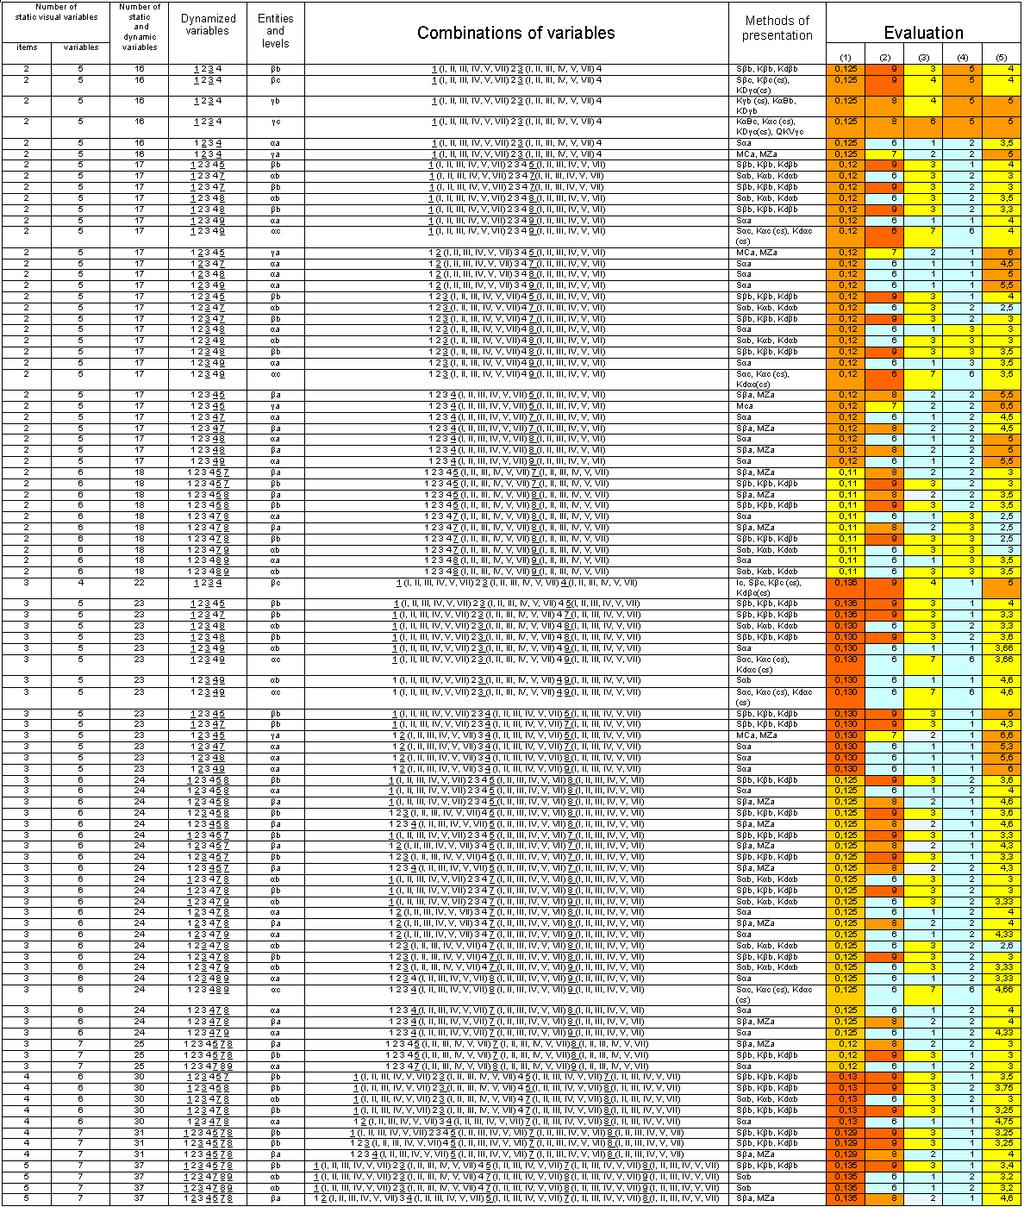
5 Fig. 3 Extract of matrix of combinations of groups of variables and related cartographic methods Method of selection of static and dynamic variables for complex temporal cartographic animations To facilitate the choice of static visual variables, dynamic variables and related combinations of methods of cartographic presentation in the case of complex cartographic animations, author proposes a method, called entities polystaymic 1. This method (based partially on author s enities cartotrophic method) employs the choice of dynamized entities and levels of measurement, the identification of types of changes and animation, the selection and verification of combinations of dynamized visual and dynamic variables as well as choice and verification of combinations of cartographic methods of presentation. Its stages are presented in figure 4. The first two stages - definition of goals of the cartographic animation and data compilation and analysis are the same like in the enities cartotrophic method. Results of these stages will allow for the definition of general organization of the complex cartographic animation, concerning the type of complex animation, their type of scenario as well as number of subanimations, scale of time. The next stage is definition of organization of N sub-animation (including type of sub-animation, number and thematic scope of time layers), which will allow the identification of entities that are going to be used to the presentation of dynamic phenomena. The definition of the measurement levels of the entities and their types will allow to define the properties of the entities (taking into the consideration the potentialities and limitations of choice of static and dynamic variables). Like in the enities cartotrophic method, at the same time, using the typology of dynamic phenomena, it is possible to define the type of changes (Dukaczewski, 2005) and the type of animation (ibid). 1 πολυσταυμη polystaimi (gr.) is one of the synonym of multilevel
6 Figure 4. Entities polystaymic method of selection of static and dynamic variables for complex temporal cartographic animations This information can be used to carry out a preliminary choice of the method of cartographic presentation for the N sub-animation (using solutions proposed by Korycka Skorupa, 2002, Dukaczewski, 2003). Using the matrix of the evaluation of the combinations of cartographic presentation methods (appendix 1) it is possible to make the preliminary choice of the combination of these methods in complex temporal cartographic animations for N and N-1 subanimation. The big matrix of evaluation of combinations of groups of the variables of 127!/2 rows allows to verify the correctness of this choice. If the result is positive, it is possible to go to the next stage or to redefine of type & organization of the complex cartographic animation. In the next stage, using the revised evaluation of application of static visual variables (fig. 2) and work on visual differentiation (Kraak, Ormeling, 1998) it is possible to choose dynamized static variables, which can be used in N sub-animation. The following stage is verification of efficiency of this choice. It should be carried out with the
7 revised matrix of correct combined applications of static variables (appendix 3). In the case of satisfying result, it is possible to choose (using the same matrix) the graphic form for the dynamized variables and to define their relations with dynamic variables as well as the methods of cartographic presentation for N sub-animation. After the verification of the correctness of this choice, it is possible to carry out the N sub-animation and then to pass to the N+1 subanimation. Conclusion The aim of this research was to contribute to the discussion on the properties and applications of variables and, hopefully, to the development of the cartographic animation methodology. Like in the case of the enities cartotrophic method, the entities polystaimic method was tested during preparation of an electronic methodological atlas of the types of cartographic animations. These tests proved that this method is operational and can be a useful aid in the preparation of complex temporal cartographic animations.
8 Bibliography 1. Bertin, J., 1967, Sémiologie graphique: Les diagrammes les reseaux les cartes; Mouton / Gauthier Villars: Paris / La Haye, 431 p. ; 2. DiBiase, D., MacEachren, A. M., Krygier, J., Reeves, C., Brenner, A., 1992, Animation and the role of map design in scientific visualisation. Cartography and Cartographic Information Systems, vol. 19 (4), p ; 3. Dukaczewski, D., 2000, Kartograficzna prezentacja dynamiki zmian użytkowania ziemi, za pomocą animowanych map elektronicznych na przykładzie Gór Izerskich; PAN, Instytut Geografii i Przestrzennego Zagospodarowania: Warszawa, PhD thesis, 183 p.; 4. DukaczewskI, D, 2003, Metody prezentacji dynamiki za pomocą zmiennych możliwych do stosowania w elektronicznych animacjach kartograficznych. report of KBN grant, Warszawa, 58 p., electronic methodological atlas;. 5. Dukaczewski, D., 2005, Entities cartotropic method of selection of static and dynamic variables for temporal cartographic animations. Proceedings of the XXII rd ACI/ICA International Cartographic Conference 2005, A Coruña, 9-16 July; 6. Dukaczewski, D., 2006, Metody prezentacji dynamiki informacji przestrzennych za pomocą interaktywnych animacji kartograficznych. report of KBN grant, Warszawa, 89 p.; 7. Köbben, B., Yaman, M., 1996, Evaluating Dynamic Visual Variables. Proceedings of the seminar on teaching animated cartography, ACI / ICA, Madrid, p ; 10. Korycka Skorupa, J., 2002, Od danych do mapy. Polski Przegląd Kartograficzny, vol. 34 (2), p ; 11. Kraak, M. J., Ormeling, F., 1998, Kartografia. Wizualizacja danych przestrzennych; Wydawnictwo Naukowe PWN: Warszawa, 274 p.; 12. Kraak, M. J., MacEachren, 1999, A. M., Visualisation for exploration of spatial data. The International Journal of Geographic Information Science, vol. 13 (4), p ; 13. MacEachren, A., 1994, Visualisation in modern cartography: setting the agenda, [in:] MacEachren, A., Taylor, D.R.F., Visualisation in Modern Cartography. Modern cartography, vol. 2; Elsevier Science Ltd.: Oxford,. 14. Rød, J. K., 1997, The third choice. Colloque 30 Ans de la Sémiologie Graphique, Paris, Décembre 1997, p ;

9


10 Appendix 2. Matrix of correct combined applications of static variables correct solutions Appendix 3 Matrix of semiotic evaluation of combined applications of static and dynamic variables and related methods of presentation
11
FROM DATA TO CARTOGRAPHIC PRESENTATION METHODS
 FROM DATA TO CARTOGRAPHIC PRESENTATION METHODS Jolanta Korycka-Skorupa Adress: Chair of Cartography, Warsaw University ul. Krakowskie Przedmiescie 30 00-927 Warsaw, POLAND tel: (4822) 55-20-632 fax: (4822)
Visualization Schemes for Spatial Processes
 Visualization Schemes for Spatial Processes Barbara HOFER and Andrew U. FRANK Summary The visualization of spatial data has a long tradition in the fields of cartography and geographic information science.
WEB MAPPING ERRORS AND THEIR TYPOLOGY.
 Abstract WEB MAPPING ERRORS AND THEIR TYPOLOGY. Elzbieta Bielecka elzbieta.bielecka@igik.edu.pl Dariusz Dukaczewski dariusz.dukaczewski@igik.edu.pl Institute of Geodesy and Cartography Modzelewskiego 27
A PROCESS TO DESIGN CREATIVE LEGENDS ON-DEMAND
 A PROCESS TO DESIGN CREATIVE LEGENDS ON-DEMAND Sidonie Christophe, Anne Ruas Laboratoire COGIT Institut Géographique National, 2/4 avenue Pasteur 94165 Saint-Mandé cedex http://recherche.ign.fr/labos/cogit/
A Framework for Visualization of Geospatial Information in 3D Virtual City Environment for Disaster Risk Management
 A Framework for Visualization of Geospatial Information in 3D Virtual City Environment for Disaster Risk Management Asli Yilmaz 1, Sebnem Duzgun 2 1 Geodetic and Geographic Information Technologies, Middle
ADAPTABLE DASHBOARD FOR VISUALIZATION OF ORIGIN-DESTINATION DATA PATTERNS
 ADAPTABLE DASHBOARD FOR VISUALIZATION OF ORIGIN-DESTINATION DATA PATTERNS Ieva Dobrāja, PhD Candidate Prof. Dr. Menno-Jan Kraak Dr. Yuri Engelhardt NCG Symposium 2017 ADAPTABLE DASHBOARD FOR VISUALIZATION
ADAPTABLE DASHBOARD FOR VISUALIZATION OF ORIGIN-DESTINATION DATA PATTERNS
 ADAPTABLE DASHBOARD FOR VISUALIZATION OF ORIGIN-DESTINATION DATA PATTERNS Ieva Dobrāja, PhD Candidate Prof. Dr. Menno-Jan Kraak Dr. Yuri Engelhardt NCG Symposium 2017 ADAPTABLE DASHBOARD FOR VISUALIZATION
GIS FOR MAZOWSZE REGION - GENERAL OUTLINE
 GIS FOR MAZOWSZE REGION - GENERAL OUTLINE S. Bialousz 1), K Mączewski 2), E. Janczar 2), K. Osinska-Skotak 1) 1) Warsaw University of Technology, Warsaw, Poland 2) Office of the Surveyor of the Mazowieckie
Geo-Visualization. GRS1011 Ron van Lammeren
 Geo-Visualization GRS1011 Ron van Lammeren Theory Semiologie Graphique http://www.flickr.com/photos/kbean/491051226/ 2/30 How to present my geo data? Visualization definitions Map making Cartographic process
Geo-Visualization. GRS09/10 Ron van Lammeren
 Geo-Visualization GRS09/10 Ron van Lammeren 2/30 Theory Semiologie Graphique http://www.flickr.com/photos/kbean/491051226/ 3/30 How to present my geo data? Visualization definitions Map making Cartographic
Comparative Analysis on the Use of Raster and Vector Data in the Optimization Process of Rural Area Planning
 Centre for Research on Settlements and Urbanism Journal of Settlements and Spatial Planning J o u r n a l h o m e p a g e: http://jssp.reviste.ubbcluj.ro Comparative Analysis on the Use of Raster and Vector
USING THE OPEN WEB PLATFORM FOR THEMATIC MAPPING IN A WEBSERVICE ENVIRONMENT. BAREND KÖBBEN
 USING THE OPEN WEB PLATFORM FOR THEMATIC MAPPING IN A WEBSERVICE ENVIRONMENT BAREND KÖBBEN kobben@itc.nl b.j.kobben@utwente.nl a story about different worlds... National GeoData Infrastructure National
Cartographic visualisation of Time
 Cartographic visualisation of Time prof Menno-Jan Kraak Barend Köbben INTERNATIONAL INSTITUTE FOR GEO-INFORMATION SCIENCE AND EARTH OBSERVATION Contents Changing Cartography
EXPLORATORY RESEARCH ON DYNAMIC VISUALIZATION BASED ON SPATIO-TEMPORAL DATABASE
 EXPLORATORY RESEARCH ON DYNAMIC VISUALIZATION BASED ON SPATIO-TEMPORAL DATABASE Yang ping a, b, Tang Xinming b, c, Lei Bing b, Zhai Liang a,b, Tian Jiaojiao d a School of Resource and Environment Science,
A cartographic approach of the process of map symbolization on gvsig software
 A cartographic approach of the process of map symbolization on gvsig software Vassilios Krassanakis Dipl. Eng., PhD Cand. NTUA krasvas@mail.ntua.gr http://users.ntua.gr/krasvas Vasilis Mitropoulos Dipl.
CONCEPTUAL DEVELOPMENT OF AN ASSISTANT FOR CHANGE DETECTION AND ANALYSIS BASED ON REMOTELY SENSED SCENES
 CONCEPTUAL DEVELOPMENT OF AN ASSISTANT FOR CHANGE DETECTION AND ANALYSIS BASED ON REMOTELY SENSED SCENES J. Schiewe University of Osnabrück, Institute for Geoinformatics and Remote Sensing, Seminarstr.
Software. People. Data. Network. What is GIS? Procedures. Hardware. Chapter 1
 People Software Data Network Procedures Hardware What is GIS? Chapter 1 Why use GIS? Mapping Measuring Monitoring Modeling Managing Five Ms of Applied GIS Chapter 2 Geography matters Quantitative analyses
Design and Development of a Large Scale Archaeological Information System A Pilot Study for the City of Sparti
 INTERNATIONAL SYMPOSIUM ON APPLICATION OF GEODETIC AND INFORMATION TECHNOLOGIES IN THE PHYSICAL PLANNING OF TERRITORIES Sofia, 09 10 November, 2000 Design and Development of a Large Scale Archaeological
MAP SYMBOL BREWER A NEW APPROACH FOR A CARTOGRAPHIC MAP SYMBOL GENERATOR
 MAP SYMBOL BREWER A NEW APPROACH FOR A CARTOGRAPHIC MAP SYMBOL GENERATOR Olaf Schnabel Institute of Cartography, Swiss Federal Institute of Technology (ETH) CH-8093 Zurich, Switzerland schnabel@karto.baug.ethz.ch
Fuzzy Generalization Inference System - the example of selection parameterization for roads and hydrographic network
 Fuzzy Generalization Inference System - the example of selection parameterization for roads and hydrographic network Anna Fiedukowicz* * Department of Cartography, WarsawUniversity of Technology This work
The concept of movable heritage cartographic presentation on the interactive map
 GEODESY AND CARTOGRAPHY Vol. 61, No 2, 2012, pp. 91-104 c Polish Academy of Sciences DOI No 10.2478/v10277-012-0024-7 The concept of movable heritage cartographic presentation on the interactive map Albina
Contents. Interactive Mapping as a Decision Support Tool. Map use: From communication to visualization. The role of maps in GIS
 Contents Interactive Mapping as a Decision Support Tool Claus Rinner Assistant Professor Department of Geography University of Toronto otru gis workshop rinner(a)geog.utoronto.ca 1 The role of maps in
Appropriate Selection of Cartographic Symbols in a GIS Environment
 Appropriate Selection of Cartographic Symbols in a GIS Environment Steve Ramroop Department of Information Science, University of Otago, Dunedin, New Zealand. Tel: +64 3 479 5608 Fax: +64 3 479 8311, sramroop@infoscience.otago.ac.nz
INTELLIGENT GENERALISATION OF URBAN ROAD NETWORKS. Alistair Edwardes and William Mackaness
 INTELLIGENT GENERALISATION OF URBAN ROAD NETWORKS Alistair Edwardes and William Mackaness Department of Geography, University of Edinburgh, Drummond Street, EDINBURGH EH8 9XP, Scotland, U.K. Tel. 0131
From map use research to usability research in geo-information processing
 Corné van Elzakker From map use research to usability research in geo-information processing INTERNATIONAL INSTITUTE FOR GEO-INFORMATION SCIENCE AND EARTH OBSERVATION International Institute for Geo-Information
Version 1.1 GIS Syllabus
 GEOGRAPHIC INFORMATION SYSTEMS CERTIFICATION Version 1.1 GIS Syllabus Endorsed 1 Version 1 January 2007 GIS Certification Programme 1. Target The GIS certification is aimed at: Those who wish to demonstrate
VISUAL ANALYTICS APPROACH FOR CONSIDERING UNCERTAINTY INFORMATION IN CHANGE ANALYSIS PROCESSES
 VISUAL ANALYTICS APPROACH FOR CONSIDERING UNCERTAINTY INFORMATION IN CHANGE ANALYSIS PROCESSES J. Schiewe HafenCity University Hamburg, Lab for Geoinformatics and Geovisualization, Hebebrandstr. 1, 22297
ELEMENTS FOR MATHEMATICAL BASIS OF ATLAS MAPS
 International Journal of Mechanical Engineering and Technology (IJMET) Volume 9, Issue 11, November 2018, pp. 2021 2028, Article ID: IJMET_09_11 213 Available online at http://www.ia aeme.com/ijmet/issues.asp?jtype=ijmet&vtype=
Intro to GIS Summer 2012 Data Visualization
 Intro to GIS Summer 2012 Data Visualization UNDERSTANDING YOUR MAP DATA Qualitative vs. Quantitative Data Qualitative Data classified by category e.g. Soil types, Animal Species Quantitative Data grouped
Cartographic Adaptations of the GAIA Visualization Method for Spatial Decision Support
 International MCDA Workshop on PROMETHEE: Research and Case Studies Cartographic Adaptations of the GAIA Visualization Method for Spatial Decision Support Karim LIDOUH January 22, 2014 Context Spatial
Laboratory on Geoinformatics and Cartography
 Research on usability testing and cognitive issues of cartographic visualizations in the context of different groups of users Milan Konečný Čeněk Šašinka, Zbyněk Štěrba Masaryk University, Brno, CZ 19.
Atlas of Map Projections: the technology of creation on the basis of program-analytical complex
 Atlas of Map Projections: the technology of creation on the basis of program-analytical complex Zagrebin G.I.* * Moscow State University of Geodesy and Cartography, Science and Education Center of Geoinformation
PROANA A USEFUL SOFTWARE FOR TERRAIN ANALYSIS AND GEOENVIRONMENTAL APPLICATIONS STUDY CASE ON THE GEODYNAMIC EVOLUTION OF ARGOLIS PENINSULA, GREECE.
 PROANA A USEFUL SOFTWARE FOR TERRAIN ANALYSIS AND GEOENVIRONMENTAL APPLICATIONS STUDY CASE ON THE GEODYNAMIC EVOLUTION OF ARGOLIS PENINSULA, GREECE. Spyridoula Vassilopoulou * Institute of Cartography
Implementing Visual Analytics Methods for Massive Collections of Movement Data
 Implementing Visual Analytics Methods for Massive Collections of Movement Data G. Andrienko, N. Andrienko Fraunhofer Institute Intelligent Analysis and Information Systems Schloss Birlinghoven, D-53754
INFORMATION SYSTEMS AND DIGITAL CARTOGRAPHY FOR SPATIAL PLANNING IN POLAND
 INFORMATION SYSTEMS AND DIGITAL CARTOGRAPHY FOR SPATIAL PLANNING IN POLAND Krzysztof Koreleski, Faculty of Environmental Engineering and Geodesy, University of Agriculture in Kraków, Poland Abstract There
3D MAPS SCALE, ACCURACY, LEVEL OF DETAIL
 26 th International Cartographic Conference August 25 30, 2013 Dresden, Germany 3D MAPS SCALE, ACCURACY, LEVEL OF DETAIL Prof. Dr. Temenoujka BANDROVA Eng. Stefan BONCHEV University of Architecture, Civil
VISUALIZATION OF SPATIO-TEMPORAL PATTERNS IN PUBLIC TRANSPORT DATA
 VISUALIZATION OF SPATIO-TEMPORAL PATTERNS IN PUBLIC TRANSPORT DATA Yedendra babu Shrinivasan, Menno-Jan Kraak International Institute for Geo-Information Science and Earth Observation, The Netherlands
New approach to multi scale cartographic modelling of reference and thematic databases in Poland
 New approach to multi scale cartographic modelling of reference and thematic databases in Poland Joanna Bac-Bronowicz Institute of Geodesy and Geoinformatics, Wroclaw University of Environmental and Life
Geometric accuracy of topographical objects at Polish topographic maps
 GEODESY AND CARTOGRAPHY Vol. 65, No 1, 2016, pp. 55-66 Polish Academy of Sciences DOI: 10.1515/geocart-2016-0003 Geometric accuracy of topographical objects at Polish topographic maps Adam Mickiewicz University
ANDREY MEDVEDEV. About me Ins tute of geography Russian Academy of Sciences. Cartography Department
 About me ANDREY MEDVEDEV 04.09.1983 a.a.medvedeff@gmail.com Ins tute of geography Russian Academy of Sciences Cartography Department ISIRA mee ng. 25.04.2015 Professional interests Cartography v Atlas
Geography (GEOG) Courses
 Courses") Geography (GEOG) 1 Geography (GEOG) Courses GEOG 100. Introduction to Human Geography. 4 (GE=D4) Introduction to the global patterns and dynamics of such human activities as population growth and movements,
Geography (GEOG) 1 Geography (GEOG) Courses GEOG 100. Introduction to Human Geography. 4 (GE=D4) Introduction to the global patterns and dynamics of such human activities as population growth and movements,
Development of a Cartographic Expert System
 Development of a Cartographic Expert System Research Team Lysandros Tsoulos, Associate Professor, NTUA Constantinos Stefanakis, Dipl. Eng, M.App.Sci., PhD 1. Introduction Cartographic design and production
APC Part I Workshop. Mapping and Cartography. 14 November 2014
 APC Part I Workshop Mapping and Cartography 14 November 2014 Cartography Cartography is the discipline dealing with the conception, production, dissemination and study of maps in all forms (ICA) A holistic
THE COLOR ANALYSIS (VISUAL VARIABLE) IN DIGITAL MAPS: A RESEARCH BASED ON TESTS WITH EIGHTH GRADE ELEMENTARY SCHOOL STUDENTS IN CURITIBA PARANÁ.
 IN DIGITAL MAPS: A RESEARCH BASED ON TESTS WITH EIGHTH GRADE ELEMENTARY SCHOOL STUDENTS IN CURITIBA PARANÁ.") THE COLOR ANALYSIS (VISUAL VARIABLE) IN DIGITAL MAPS: A RESEARCH BASED ON TESTS WITH EIGHTH GRADE ELEMENTARY SCHOOL STUDENTS IN CURITIBA PARANÁ. Monyra Guttervill Cubas*, Tony Vinicius Moreira Sampaio*
THE COLOR ANALYSIS (VISUAL VARIABLE) IN DIGITAL MAPS: A RESEARCH BASED ON TESTS WITH EIGHTH GRADE ELEMENTARY SCHOOL STUDENTS IN CURITIBA PARANÁ. Monyra Guttervill Cubas*, Tony Vinicius Moreira Sampaio*
MAPPING GUIDE CARTOGRAPHY IN ESPON 2013 CONTENT 24 PAGES
 MAPPING GUIDE CARTOGRAPHY IN ESPON 2013 CONTENT Enhancing information. This part explain how symbolize ESPON 2013 data with the good rules of graphic semiology. Maps are tool for communication. This part
Research on Object-Oriented Geographical Data Model in GIS
 Research on Object-Oriented Geographical Data Model in GIS Wang Qingshan, Wang Jiayao, Zhou Haiyan, Li Bin Institute of Information Engineering University 66 Longhai Road, ZhengZhou 450052, P.R.China Abstract
Cartograms of self-organizing maps to explore user-generated content
 Cartograms of self-organizing maps to explore user-generated content André Bruggmann, Marco M. Salvini, Sara I. Fabrikant University of Zurich, Department of Geography Zurich, Switzerland Abstract. As
GTECH 380/722 Analytical and Computer Cartography Hunter College, CUNY Department of Geography
 GTECH 380/722 Analytical and Computer Cartography Hunter College, CUNY Department of Geography Fall 2014 Mondays 5:35PM to 9:15PM Instructor: Doug Williamson, PhD Email: Douglas.Williamson@hunter.cuny.edu
Cell-based Model For GIS Generalization
 Cell-based Model For GIS Generalization Bo Li, Graeme G. Wilkinson & Souheil Khaddaj School of Computing & Information Systems Kingston University Penrhyn Road, Kingston upon Thames Surrey, KT1 2EE UK
GEOGRAPHIC INFORMATION SYSTEMS Session 8
 GEOGRAPHIC INFORMATION SYSTEMS Session 8 Introduction Geography underpins all activities associated with a census Census geography is essential to plan and manage fieldwork as well as to report results
Land Administration and Cadastre
 Geomatics play a major role in hydropower, land and water resources and other infrastructure projects. Lahmeyer International s (LI) worldwide projects require a wide range of approaches to the integration
Combining Geospatial and Statistical Data for Analysis & Dissemination
 Combining Geospatial and Statistical Data for Analysis & Dissemination (with Special Reference to Qatar Census 2010) Presentation by Mansoor Al Malki, Director of IT Department Qatar Statistics Authority
Children s Understanding of Generalisation Transformations
 Children s Understanding of Generalisation Transformations V. Filippakopoulou, B. Nakos, E. Michaelidou Cartography Laboratory, Faculty of Rural and Surveying Engineering National Technical University
CARTOGRAPHIC DESIGN PRINCIPLES FOR 3D MAPS A CONTRIBUTION TO CARTOGRAPHIC THEORY
 CARTOGRAPHIC DESIGN PRINCIPLES FOR 3D MAPS A CONTRIBUTION TO CARTOGRAPHIC THEORY Christian Haeberling Institute of Cartography Swiss Federal Institute of Technology (ETH Zurich) ETH Hoenggerberg CH-8093
Snowden Cartography 1 GEOG 315:001 Cartography Thursdays 4:00 6:30PM F375 Fall 2010 Dr. Snowden Course Description
 Snowden Cartography 1 www.drksnowden.com GEOG 315:001 Cartography Thursdays 4:00 6:30PM F375 Fall 2010 Dr. Snowden Course Description Principles and theory of basic map design, layout, and communication.
Current trends in visualisation of geospatial data with special reference to cartography (Invited Paper)
") Current trends in visualisation of geospatial data with special reference to cartography (Invited Paper) Menno-Jan Kraak ITC, Department of GeoInformation Processing PO Box 6, 7500 AA Enschede, the Netherlands
Current trends in visualisation of geospatial data with special reference to cartography (Invited Paper) Menno-Jan Kraak ITC, Department of GeoInformation Processing PO Box 6, 7500 AA Enschede, the Netherlands
Project to include Index Sheets in the Polish National Bibliography of Cartographic Materials
 Project to include Index Sheets in the Polish National Bibliography of Cartographic Materials by LUCYNA SZANIAWSKÃ BIBLIOGRAPHICAL GUIDE. OFFICIAL INDEX OF PUBLICATIONS ISSUED IN POLAND The first post-war
Model development for WebAtlas system applying in administration management.
 Model development for WebAtlas system applying in administration management. Bui Ngoc Quy, Vo Ngọc Dung, Nguyen Danh Duc, University of mining and geology, Viet Nam Key words: Webatlas, Web Map, Electronic
Evolution or Devolution of Cartographic Education?
 Evolution or Devolution of Cartographic Education? Transformations in Teaching Cartographic Concepts and Techniques Aileen Buckley Cartographic Researcher, ESRI, Inc. abuckley@esri.com Terminology UCGIS*
MASTER OF APPLIED GEOGRAPHY (M.A.GEO.) MAJOR IN GEOGRAPHIC INFORMATION SCIENCE
 MAJOR IN GEOGRAPHIC INFORMATION SCIENCE") Master of Applied Geography (M.A.Geo.) Major in Geographic Information Science 1 MASTER OF APPLIED GEOGRAPHY (M.A.GEO.) MAJOR IN GEOGRAPHIC INFORMATION SCIENCE Major Program The Master of Applied Geography
Master of Applied Geography (M.A.Geo.) Major in Geographic Information Science 1 MASTER OF APPLIED GEOGRAPHY (M.A.GEO.) MAJOR IN GEOGRAPHIC INFORMATION SCIENCE Major Program The Master of Applied Geography
MASTER OF APPLIED GEOGRAPHY (M.A.GEO.) MAJOR IN GEOGRAPHY RESOURCE AND ENVIRONMENTAL STUDIES
 MAJOR IN GEOGRAPHY RESOURCE AND ENVIRONMENTAL STUDIES") Master of Applied Geography (M.A.Geo.) Major in Geography Resource and Environmental Studies 1 MASTER OF APPLIED GEOGRAPHY (M.A.GEO.) MAJOR IN GEOGRAPHY RESOURCE AND ENVIRONMENTAL STUDIES Major Program
Master of Applied Geography (M.A.Geo.) Major in Geography Resource and Environmental Studies 1 MASTER OF APPLIED GEOGRAPHY (M.A.GEO.) MAJOR IN GEOGRAPHY RESOURCE AND ENVIRONMENTAL STUDIES Major Program
EuroSDR (European Spatial Data Research)
") EuroSDR (European Spatial Data Research) ROLLING RESEARCH PLAN 2015-2018 EuroSDR Secretariat Public Governance Institute KU Leuven Parkstraat 45 bus 3609 3000 Leuven Belgium Tel.: +32 16 32 31 80 Fax:
EuroSDR (European Spatial Data Research) ROLLING RESEARCH PLAN 2015-2018 EuroSDR Secretariat Public Governance Institute KU Leuven Parkstraat 45 bus 3609 3000 Leuven Belgium Tel.: +32 16 32 31 80 Fax:
Logical data integration into digital landscape model 1
 Logical data integration into digital landscape model 1 1 Lecture contents: 1. Overview of geodata applicable in the modelling in the landscape. 2. Introduction into the models and modelling. 3. Classification
ICA Commissions
 Association Cartographique Internationale International Cartographic Association 11 Assemblée générale - 11th General Assembly Ottawa, août 1999 - Ottawa, August 1999 ICA Commissions 1999-2003 Commission
Cartography and Children Commission: Proposals for the next 4 years
 International Cartographic Association Cartography and Children Commission: Proposals for the next 4 years José Jesús Reyes Nuñez Eötvös Loránd University Dept. of Cartography and Geoinformatics Budapest,
Different Models of the Curriculum for the Higher Education of Surveying & Mapping in China
 Different Models of the Curriculum for the Higher Education of Surveying & Mapping in China NING Jinsheng, LIU Yanfang, LIU Yaolin, China P. R. Key words: curriculum, common foundation, distinguished feature
Ana Kuveždić Divjak. Faculty of Geodesy, University of Zagreb
 Designing Map Symbols for Efficient Visualization of Spatial Information and the Process of Cartographic Communication in Crisis Situations Initial Research, Requirements and Guidelines Ana Kuveždić Divjak
Aileen Buckley, Ph.D. and Charlie Frye
 An Information Model for Maps: Towards Production from GIS Databases Aileen Buckley, Ph.D. and Charlie Frye Researchers, ESRI GIS vs. cart GIS Outline of the presentation Introduction Differences between
Interactions between Levels in an Agent Oriented Model for Generalisation
 Interactions between Levels in an Agent Oriented Model for Generalisation Adrien Maudet Université Paris-Est, IGN, COGIT, Saint-Mandé, France adrien.maudet@ign.fr Abstract. Generalisation is a complex
Chapter 7: Making Maps with GIS. 7.1 The Parts of a Map 7.2 Choosing a Map Type 7.3 Designing the Map
 Chapter 7: Making Maps with GIS 7.1 The Parts of a Map 7.2 Choosing a Map Type 7.3 Designing the Map What is a map? A graphic depiction of all or part of a geographic realm in which the real-world features
Model development for web - atlas system applying in administration management
 VNU Journal of Science, Earth Sciences 28 (2012) 29-36 Model development for web - atlas system applying in administration management Bui Ngoc Quy* Ha Noi University of Mining and Geology, Dong Ngac, Tu
A CARTOGRAPHIC DATA MODEL FOR BETTER GEOGRAPHICAL VISUALIZATION BASED ON KNOWLEDGE
 A CARTOGRAPHIC DATA MODEL FOR BETTER GEOGRAPHICAL VISUALIZATION BASED ON KNOWLEDGE Yang MEI a, *, Lin LI a a School Of Resource And Environmental Science, Wuhan University,129 Luoyu Road, Wuhan 430079,
Model Generalisation in the Context of National Infrastructure for Spatial Information
 Model Generalisation in the Context of National Infrastructure for Spatial Information Tomas MILDORF and Vaclav CADA, Czech Republic Key words: NSDI, INSPIRE, model generalization, cadastre, spatial planning
METHODS FOR STATISTICS
 DYNAMIC CARTOGRAPHIC METHODS FOR VISUALIZATION OF HEALTH STATISTICS Radim Stampach M.Sc. Assoc. Prof. Milan Konecny Ph.D. Petr Kubicek Ph.D. Laboratory on Geoinformatics and Cartography, Department of
Animating Maps: Visual Analytics meets Geoweb 2.0
 Animating Maps: Visual Analytics meets Geoweb 2.0 Piyush Yadav 1, Shailesh Deshpande 1, Raja Sengupta 2 1 Tata Research Development and Design Centre, Pune (India) Email: {piyush.yadav1, shailesh.deshpande}@tcs.com
Increasing GI awareness in local authorities in Poland experiences from the INSPIRE Academy training programme
 Increasing GI awareness in local authorities in Poland experiences from the INSPIRE Academy training programme http://www.akademiainspire.pl Maria Andrzejewska, Monika Rusztecka UNEP/GRID-Warsaw Centre,
GED 554 IT & GIS. Lecture 6 Exercise 5. May 10, 2013
 GED 554 IT & GIS Lecture 6 Exercise 5 May 10, 2013 Free GIS data sources ******************* Mapping numerical data & Symbolization ******************* Exercise: Making maps for presentation GIS DATA SOFTWARE
GTECH 380/722 Analytical and Computer Cartography Hunter College, CUNY Department of Geography
 GTECH 380/722 Analytical and Computer Cartography Hunter College, CUNY Department of Geography Spring 2010 Wednesdays 5:35PM to 9:15PM Instructor: Doug Williamson, PhD Email: Douglas.Williamson@hunter.cuny.edu
Expert paper GIS CONTENT PROPOSAL FOR UNDERGROUND MINING ROOMS
 UNDERGROUND MINING ENGINEERING 14 (2005) 95-100 UDK 62 FACULTY OF MINING AND GEOLOGY, BELGRADE YU ISSN 0354-2904 ABSTRACT Expert paper GIS CONTENT PROPOSAL FOR UNDERGROUND MINING ROOMS Milutinović Aleksandar
An Information Model for Maps: Towards Cartographic Production from GIS Databases
 An Information Model for s: Towards Cartographic Production from GIS Databases Aileen Buckley, Ph.D. and Charlie Frye Senior Cartographic Researchers, ESRI Barbara Buttenfield, Ph.D. Professor, University
3D Maps Scale, Accuracy, Level of Detail
 3D Maps Scale, Accuracy, Level of Detail Temenoujka Bandrova, Stefan Bonchev Department of Photogrammetry and Cartography, University of Architecture Civil Engineering and Geodesy, Sofia, Bulgaria, e-mails:
RGI: geo-visualization RGI. The road to. Ron van Lammeren. Centre for Geo-Information 1RL01
 : geo-visualization The road to. Ron van Lammeren 300505 1RL01 Contents Geo-visualisation Types of geo-visualisation Interacting by interfaces Role of geo-visualisation Usability and perception Constructing
CARTOGRAPHIC DESIGN IN 3D MAPS
 CARTOGRAPHIC DESIGN IN 3D MAPS Petrovic, D. University of Ljubljana, Faculty of Civil and Geodetic Engineering, Geodetic Institute of Slovenia, Jamova 2, 1000 Ljubljana, Slovenia. Fax: + 386 1 425 06 77.
GIS = Geographic Information Systems;
 What is GIS GIS = Geographic Information Systems; What Information are we talking about? Information about anything that has a place (e.g. locations of features, address of people) on Earth s surface,
Geography 360 Principles of Cartography. April 17, 2006
 Geography 360 Principles of Cartography April 17, 2006 Outlines Cartographic design principles Enhancing visual hierarchies on maps Kinds of numerical data and color scheme What is proportional symbol
Switching to AQA from Edexcel: Draft Geography AS and A-level (teaching from September 2016)
") Switching to AQA from Edexcel: Draft Geography AS and A-level (teaching from September 2016) If you are thinking of switching from OCR to AQA (from September 2016), this resource is an easy reference guide.
Switching to AQA from Edexcel: Draft Geography AS and A-level (teaching from September 2016) If you are thinking of switching from OCR to AQA (from September 2016), this resource is an easy reference guide.
Exploring the Influence of Color Distance on the Map Legibility
 Exploring the Influence of Color Distance on the Map Legibility Alžběta Brychtová, Stanislav Popelka Department of Geoinformatics, Faculty of Science, Palacký University in Olomouc, Czech Republic Abstract.
Geog183: Cartographic Design and Geovisualization Spring Quarter 2018 Lecture 3: Thematic cartography, geovisualization and visual analytics
 Geog183: Cartographic Design and Geovisualization Spring Quarter 2018 Lecture 3: Thematic cartography, geovisualization and visual analytics General Purpose or Reference Cartography Maps showing generic
CES Seminar 2016: Geospatial information services based on official statistics Key issues from the session II papers
 Norbert Rainer 64 th plenary session of the Conference of European Statisticians 28 April 2016, Paris CES Seminar 2016: Geospatial information services based on official statistics Key issues from the
Evaluation of selected maps used in early school education in Poland and proposal of a new solution
 Polish Cartographical Review Vol. 49, 2017, no. 2, pp. 67 77 DOI: 10.1515/pcr-2017-0006 KATARZYNA SŁOMSKA University of Warsaw Department of Geoinformatics, Cartography and Remote Sensing k.slomska@uw.edu.pl
ENV208/ENV508 Applied GIS. Week 2: Making maps, data visualisation, and GIS output
 ENV208/ENV508 Applied GIS Week 2: Making maps, data visualisation, and GIS output Overview GIS Output Map Making Types of Maps Key Elements GIS Output Formats Table Graph Statistics Maps Map Making Maps
EVALUATION AND APPROVAL OF ATLASES
 EVALUATION AND APPROVAL OF ATLASES Elementary and Secondary Education Frame of Reference Ministère de l Éducation, du Loisir et du Sport Direction des ressources didactiques Bureau d approbation du matériel
Overview. GIS Data Output Methods
 Overview GIS Output Formats ENV208/ENV508 Applied GIS Week 2: Making maps, data visualisation, and GIS output GIS Output Map Making Types of Maps Key Elements Table Graph Statistics Maps Map Making Maps
The French SIGMA-Cassini Research Group The Agenda for
 Page 1 of 9 The French SIGMA-Cassini Research Group The Agenda for 2005-2008 M. Mainguenaud C. Weber michel.mainguenaud@insa-rouen.fr christiane.weber@lorraine.u-strasbg.fr http://www.sigma-cassini.org
12th AGILE International Conference on Geographic Information Science 2009 page 1 of 9 Leibniz Universität Hannover, Germany
 12th AGILE International Conference on Geographic Information Science 2009 page 1 of 9 A Framework for the Generalization of 3D City Models Richard Guercke and Claus Brenner Institute of Cartography and
Abstract 1. The challenges facing Cartography in the new era.
 Geo-Informatic Tupu the New development of Cartography Qin Jianxin Ph. D. The Research Center of Geographic Information System (GIS), Hunan Normal University. Changsha, Hunan, 410081 E-Mail: qjxzxd@sina.com
Improving Map Generalisation of Buildings by Introduction of Urban Context Rules
 Improving Map Generalisation of Buildings by Introduction of Urban Context Rules S. Steiniger 1, P. Taillandier 2 1 University of Zurich, Department of Geography, Winterthurerstrasse 190, CH 8057 Zürich,
GRADUATE CERTIFICATE PROGRAM
 GRADUATE CERTIFICATE PROGRAM GEOGRAPHIC INFORMATION SCIENCES Department of Geography University of North Carolina Chapel Hill Conghe Song, Director csong @email.unc.edu 919-843-4764 (voice) 919-962-1537
Laurence Jolivet COGIT laboratory, IGN France
 On-demand map design based on user-oriented specifications Laurence Jolivet COGIT laboratory, IGN France Laurence.Jolivet@ign.fr ABSTRACT: Map making includes many tasks that can not be entirely formalized
Maps and sustainability
 Maps and sustainability The International Map Year [ mapyear.org ] Menno-Jan Kraak Maps Cartography and maps A map is a visual representation of an environment maps tell stories maps invite maps show patterns