Data Analysis. Associate.Prof.Dr.Ratana Sapbamrer Department of Community Medicine, Faculty of Medicine Chiang Mai University
|
|
|
- Dora Green
- 5 years ago
- Views:
Transcription

1 Data Analysis Associate.Prof.Dr.Ratana Sapbamrer Department of Community Medicine, Faculty of Medicine Chiang Mai University
2 Topic Outline Data analysis for descriptive statistics (qualitative data) Data analysis for descriptive statistics (quantitative data) Data analysis for analytical/inferential statistics Methods for normal distribution test
3 Review of knowledge Statistics Types of Statistics Descriptive Analytical/Inferential Describe features of data (1) make assumptions about the population at large (2) make predictions about what might happen in the future. Testing hypothesis Independent VS Dependent variables 3 Predictor VS Outcome
4 Review of knowledge Scale of Data Qualitative/ Categorical Quantitative/ Numerical Nominal Ordinal Interval Ratio
5 Data analysis for descriptive statistics


6 Data analysis for descriptive statistics in different scales Scale Qualitative Quantitative Nominal Ordinal Interval Ratio Frequency distribution Frequency Percentage 6 Central tendency Dispersion
7 Data analysis for Descriptive statistics (qualitative data) Qaulitative data Nominal Ordinal Frequency distribution Frequency Distribution table Pie chart One way table Two way table Percentage Bar chart Line chart

8 One way distribution table Analyze Descriptive statistic Frequency

9 Example: one way distribution table Personal data of gender

10

11
12
13 Two way distribution table Analyze Descriptive statistic Table Custom table

14 Example: personal data classified by gender and headache symptom

15

16
17

18 Pie chart Bar chart analyze by Excel and SPSS Line chart

19 Data analysis for descriptive statistics (quantitative data) Stat. for quantitative data Central tendency Dispersion Mean Median Mode Standard deviation Percentile IQR Coefficien t of variance Range Analyze Descriptive statistic frequency

20 Example: age

21
22 Central tendency Dispersion

23 Data analysis for Analytical/inferential statistics
24 Testing hypothesis Independent VS Dependent variables Analytical/inferential statistics Normal distribution Non-normal distribution Parametric test Testing normal distribution Non-parametric test
 -Shapiro-Wilk (n 3-50) Analyze Compare")
25 Method of normal distribution test Graph -Mean and Median -Histogram -Stem and leaf -Boxplot Statistics -Kolmogorov-Smirnov (n > 50) -Shapiro-Wilk (n 3-50) Analyze Compare mean explore
26 Mean and Median Descriptives cholesterol Mean 95% Confidence Interval for Mean Lower Bound Upper Bound Statistic Std. Error % Trimmed Mean Median Variance Std. Dev iation Minimum Maximum Range Interquartile Range Skewness Kur tosis

27 Histogram Stem and leaf Boxplot
28 * ค าข อม ลท มากกว า Q3 + 3IQR เร ยก Extreme ค าข อม ลท มากกว า Q IQR เร ยก Outlier ค าข อม ลท ย งไม ส งผ ดปกต ค าส งส ดของ Box = Q3 ค าม ธยฐาน= Q2 ค าต าส ดของ Box = Q1 ค าข อม ลท ย งไม ต าผ ดปกต ค าข อม ลท มากกว า Q1-1.5IQR เร ยก Outlier * 28 ค าข อม ลท น อยกว า Q1-3IQR เร ยก Extreme
29 Central tendency สมมาตร เบ บวก/ เบ ขวา Skewness+ เบ ลบ/ เบ ซ าย Skewness- 29
30 Dispersion High dispersion Low dispersion High dispersion Low dispersion 30
31 Statistics Kolmogorov- Smirnov test Shapiro-Wilk test N > 50 N 3-50 Tests of Normality Kolmogorov-Smirnov a Shapiro-Wilk Statistic df Sig. Statistic df Sig. cholesterol * *. This is a lower bound of the true significance. a. Lilliefors Significance Correction

32 Example: Testing normal distribution of age Analyze Compare mean explore

33
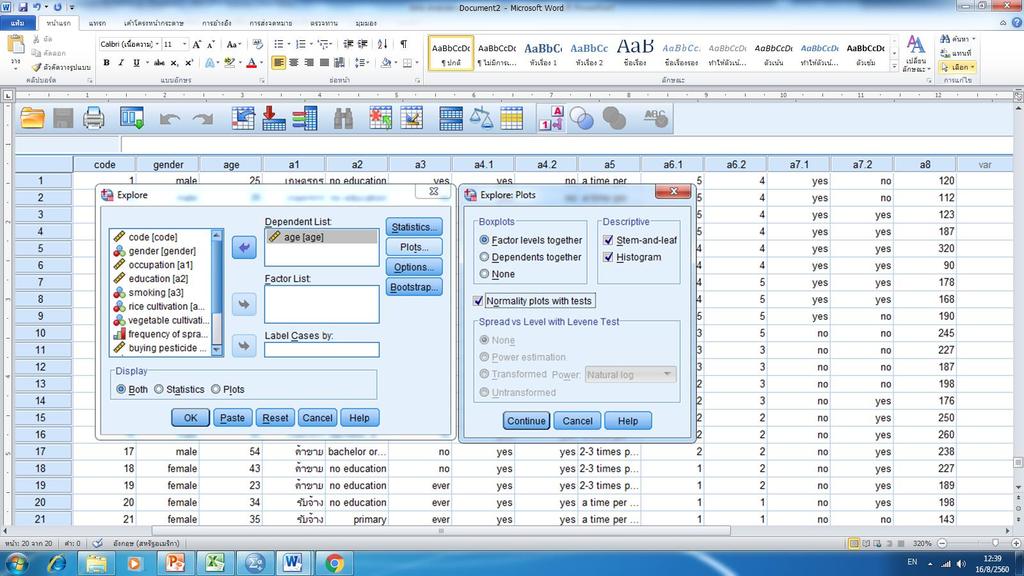
34

35 Non-normal distribution


36 age Stem-and-Leaf Plot Frequency Stem & Leaf Non-normal distribution Stem width: 10 Each leaf: 1 case(s)
37 Non-normal distribution
38 Testing hypothesis Independent VS Dependent variables Analytical/inferential statistics Normal distribution Non-normal distribution Parametric test Testing normal distribution Non-parametric test
39 Independent/ predictor Qualitative data 2 groups (pre-post) Qualitative data 2 groups (independent each other) Qualitative data >2 groups (independent each other) Dependent/ outcome Quantitative data Quantitative data Parametric test Non-parametric test Paired sample t-test 2-relate sample test 2-independent sample t-test Mann-Whitney U test Quantitative data One-way ANOVA Kruskal Wallis test Quantitative data Quantitative data Pearson correlation Spearman correlation Qualitative data Qualitative data Chi-square Qualitative + Qauntitative data Qualitative + Qauntitative data Quantitative data Qualitative data Multiple linear regression Discriminant analysis
 Cholesterol levels")
40 Example: parametric test Pearson correlation Independent/ predictor Dependent/ outcome Parametric test Non-parametric test Quantitative data Quantitative data Pearson correlation Spearman correlation Example: Investigation association between age and cholesterol levels Independent/predictor Dependent/outcome Age (Ratio) Cholesterol levels (Ratio)


41 ถ าอาย มากข น ระด บคลอเรสเตอรอลจะส งข น ถ าอาย มากข น ปร มาณมวลกระด ก จะลดลง
42 ความส มพ นธ Positive correlation Negative correlation การแปลความ สมบ รณ ส งมาก ส ง ปานกลาง ต า ต ามาก ไม น ยสาค ญ 42
43 age Correlations Totol lipid, age mg/dl age Pearson Correlation 1.899** Sig. (2-tailed)..000 N Totol lipid, mg/dl Pearson Correlation.899** 1 Sig. (2-tailed).000. N **. Correlation is significant at the 0.01 lev el (2-tailed).

44 Example: Correlation between age and cholesterol levels

45

46

47 Pearson correlation coefficient Correlation between Ratio and Ratio
48
49
50 Practice: (1) Oneway distribution table: personal data of education status (2) Two way distribution table: personal data classified by gender and occupation (3) Two way distribution table: personal data classified by smoking and headache symptom
51 Practice: (4) Central tendency and dispersion of age (Mean, median, min, max, SD., Percentile25th and 75 th ) (5) Test of normality of cholesterol (Mean, median, boxplot, histogram, stem and leaf) (6) Correlation coefficient between age and cholesterol levels
52 The end
Introduction and Descriptive Statistics p. 1 Introduction to Statistics p. 3 Statistics, Science, and Observations p. 5 Populations and Samples p.
 Preface p. xi Introduction and Descriptive Statistics p. 1 Introduction to Statistics p. 3 Statistics, Science, and Observations p. 5 Populations and Samples p. 6 The Scientific Method and the Design of
DETAILED CONTENTS PART I INTRODUCTION AND DESCRIPTIVE STATISTICS. 1. Introduction to Statistics
 DETAILED CONTENTS About the Author Preface to the Instructor To the Student How to Use SPSS With This Book PART I INTRODUCTION AND DESCRIPTIVE STATISTICS 1. Introduction to Statistics 1.1 Descriptive and
Contents. Acknowledgments. xix
 Table of Preface Acknowledgments page xv xix 1 Introduction 1 The Role of the Computer in Data Analysis 1 Statistics: Descriptive and Inferential 2 Variables and Constants 3 The Measurement of Variables
Solutions exercises of Chapter 7
 Solutions exercises of Chapter 7 Exercise 1 a. These are paired samples: each pair of half plates will have about the same level of corrosion, so the result of polishing by the two brands of polish are
BIOS 6222: Biostatistics II. Outline. Course Presentation. Course Presentation. Review of Basic Concepts. Why Nonparametrics.
 BIOS 6222: Biostatistics II Instructors: Qingzhao Yu Don Mercante Cruz Velasco 1 Outline Course Presentation Review of Basic Concepts Why Nonparametrics The sign test 2 Course Presentation Contents Justification
Nemours Biomedical Research Statistics Course. Li Xie Nemours Biostatistics Core October 14, 2014
 Nemours Biomedical Research Statistics Course Li Xie Nemours Biostatistics Core October 14, 2014 Outline Recap Introduction to Logistic Regression Recap Descriptive statistics Variable type Example of
SPSS Guide For MMI 409
 SPSS Guide For MMI 409 by John Wong March 2012 Preface Hopefully, this document can provide some guidance to MMI 409 students on how to use SPSS to solve many of the problems covered in the D Agostino
Glossary. The ISI glossary of statistical terms provides definitions in a number of different languages:
 Glossary The ISI glossary of statistical terms provides definitions in a number of different languages: http://isi.cbs.nl/glossary/index.htm Adjusted r 2 Adjusted R squared measures the proportion of the
Turning a research question into a statistical question.
 Turning a research question into a statistical question. IGINAL QUESTION: Concept Concept Concept ABOUT ONE CONCEPT ABOUT RELATIONSHIPS BETWEEN CONCEPTS TYPE OF QUESTION: DESCRIBE what s going on? DECIDE
Tastitsticsss? What s that? Principles of Biostatistics and Informatics. Variables, outcomes. Tastitsticsss? What s that?
 Tastitsticsss? What s that? Statistics describes random mass phanomenons. Principles of Biostatistics and Informatics nd Lecture: Descriptive Statistics 3 th September Dániel VERES Data Collecting (Sampling)
ESP 178 Applied Research Methods. 2/23: Quantitative Analysis
 ESP 178 Applied Research Methods 2/23: Quantitative Analysis Data Preparation Data coding create codebook that defines each variable, its response scale, how it was coded Data entry for mail surveys and
Glossary for the Triola Statistics Series
 Glossary for the Triola Statistics Series Absolute deviation The measure of variation equal to the sum of the deviations of each value from the mean, divided by the number of values Acceptance sampling
Chapter 2 Class Notes Sample & Population Descriptions Classifying variables
 Chapter 2 Class Notes Sample & Population Descriptions Classifying variables Random Variables (RVs) are discrete quantitative continuous nominal qualitative ordinal Notation and Definitions: a Sample is
Ø Set of mutually exclusive categories. Ø Classify or categorize subject. Ø No meaningful order to categorization.
 Statistical Tools in Evaluation HPS 41 Dr. Joe G. Schmalfeldt Types of Scores Continuous Scores scores with a potentially infinite number of values. Discrete Scores scores limited to a specific number
Basic Statistical Analysis
 indexerrt.qxd 8/21/2002 9:47 AM Page 1 Corrected index pages for Sprinthall Basic Statistical Analysis Seventh Edition indexerrt.qxd 8/21/2002 9:47 AM Page 656 Index Abscissa, 24 AB-STAT, vii ADD-OR rule,
Non-parametric tests, part A:
 Two types of statistical test: Non-parametric tests, part A: Parametric tests: Based on assumption that the data have certain characteristics or "parameters": Results are only valid if (a) the data are
What is Statistics? Statistics is the science of understanding data and of making decisions in the face of variability and uncertainty.
 What is Statistics? Statistics is the science of understanding data and of making decisions in the face of variability and uncertainty. Statistics is a field of study concerned with the data collection,
Parametric versus Nonparametric Statistics-when to use them and which is more powerful? Dr Mahmoud Alhussami
 Parametric versus Nonparametric Statistics-when to use them and which is more powerful? Dr Mahmoud Alhussami Parametric Assumptions The observations must be independent. Dependent variable should be continuous
Describing distributions with numbers
 Describing distributions with numbers A large number or numerical methods are available for describing quantitative data sets. Most of these methods measure one of two data characteristics: The central
Textbook Examples of. SPSS Procedure
 Textbook s of IBM SPSS Procedures Each SPSS procedure listed below has its own section in the textbook. These sections include a purpose statement that describes the statistical test, identification of
Exam details. Final Review Session. Things to Review
 Exam details Final Review Session Short answer, similar to book problems Formulae and tables will be given You CAN use a calculator Date and Time: Dec. 7, 006, 1-1:30 pm Location: Osborne Centre, Unit
Ø Set of mutually exclusive categories. Ø Classify or categorize subject. Ø No meaningful order to categorization.
 Statistical Tools in Evaluation HPS 41 Fall 213 Dr. Joe G. Schmalfeldt Types of Scores Continuous Scores scores with a potentially infinite number of values. Discrete Scores scores limited to a specific
Chapter Fifteen. Frequency Distribution, Cross-Tabulation, and Hypothesis Testing
 Chapter Fifteen Frequency Distribution, Cross-Tabulation, and Hypothesis Testing Copyright 2010 Pearson Education, Inc. publishing as Prentice Hall 15-1 Internet Usage Data Table 15.1 Respondent Sex Familiarity
Chapter 3. Data Description
 Chapter 3. Data Description Graphical Methods Pie chart It is used to display the percentage of the total number of measurements falling into each of the categories of the variable by partition a circle.
Degrees of freedom df=1. Limitations OR in SPSS LIM: Knowing σ and µ is unlikely in large
 Z Test Comparing a group mean to a hypothesis T test (about 1 mean) T test (about 2 means) Comparing mean to sample mean. Similar means = will have same response to treatment Two unknown means are different
Research Methodology Statistics Comprehensive Exam Study Guide
 Research Methodology Statistics Comprehensive Exam Study Guide References Glass, G. V., & Hopkins, K. D. (1996). Statistical methods in education and psychology (3rd ed.). Boston: Allyn and Bacon. Gravetter,
Introduction to Statistical Analysis using IBM SPSS Statistics (v24)
") to Statistical Analysis using IBM SPSS Statistics (v24) to Statistical Analysis Using IBM SPSS Statistics is a two day instructor-led classroom course that provides an application-oriented introduction
to Statistical Analysis using IBM SPSS Statistics (v24) to Statistical Analysis Using IBM SPSS Statistics is a two day instructor-led classroom course that provides an application-oriented introduction
Statistics in medicine
 Statistics in medicine Lecture 1- part 1: Describing variation, and graphical presentation Outline Sources of variation Types of variables Fatma Shebl, MD, MS, MPH, PhD Assistant Professor Chronic Disease
DATA ANALYSIS. Faculty of Civil Engineering
 DATA ANALYSIS Faculty of Civil Engineering DATA DATA - Introduction Data is a collection of facts, such as numbers, words, measurements, observations or even just descriptions of things. Qualitative data
Chapter 2: Tools for Exploring Univariate Data
 Stats 11 (Fall 2004) Lecture Note Introduction to Statistical Methods for Business and Economics Instructor: Hongquan Xu Chapter 2: Tools for Exploring Univariate Data Section 2.1: Introduction What is
Correlation and Simple Linear Regression
 Correlation and Simple Linear Regression Sasivimol Rattanasiri, Ph.D Section for Clinical Epidemiology and Biostatistics Ramathibodi Hospital, Mahidol University E-mail: sasivimol.rat@mahidol.ac.th 1 Outline
Statistical Methods. by Robert W. Lindeman WPI, Dept. of Computer Science
 Statistical Methods by Robert W. Lindeman WPI, Dept. of Computer Science gogo@wpi.edu Descriptive Methods Frequency distributions How many people were similar in the sense that according to the dependent
Last Lecture. Distinguish Populations from Samples. Knowing different Sampling Techniques. Distinguish Parameters from Statistics
 Last Lecture Distinguish Populations from Samples Importance of identifying a population and well chosen sample Knowing different Sampling Techniques Distinguish Parameters from Statistics Knowing different
SPSS LAB FILE 1
 SPSS LAB FILE www.mcdtu.wordpress.com 1 www.mcdtu.wordpress.com 2 www.mcdtu.wordpress.com 3 OBJECTIVE 1: Transporation of Data Set to SPSS Editor INPUTS: Files: group1.xlsx, group1.txt PROCEDURE FOLLOWED:
P8130: Biostatistical Methods I
 P8130: Biostatistical Methods I Lecture 2: Descriptive Statistics Cody Chiuzan, PhD Department of Biostatistics Mailman School of Public Health (MSPH) Lecture 1: Recap Intro to Biostatistics Types of Data
HYPOTHESIS TESTING II TESTS ON MEANS. Sorana D. Bolboacă
 HYPOTHESIS TESTING II TESTS ON MEANS Sorana D. Bolboacă OBJECTIVES Significance value vs p value Parametric vs non parametric tests Tests on means: 1 Dec 14 2 SIGNIFICANCE LEVEL VS. p VALUE Materials and
Review for Final. Chapter 1 Type of studies: anecdotal, observational, experimental Random sampling
 Review for Final For a detailed review of Chapters 1 7, please see the review sheets for exam 1 and. The following only briefly covers these sections. The final exam could contain problems that are included
Chapter2 Description of samples and populations. 2.1 Introduction.
 Chapter2 Description of samples and populations. 2.1 Introduction. Statistics=science of analyzing data. Information collected (data) is gathered in terms of variables (characteristics of a subject that
Dover- Sherborn High School Mathematics Curriculum Probability and Statistics
 Mathematics Curriculum A. DESCRIPTION This is a full year courses designed to introduce students to the basic elements of statistics and probability. Emphasis is placed on understanding terminology and
Describing distributions with numbers
 Describing distributions with numbers A large number or numerical methods are available for describing quantitative data sets. Most of these methods measure one of two data characteristics: The central
Learning Objectives for Stat 225
 Learning Objectives for Stat 225 08/20/12 Introduction to Probability: Get some general ideas about probability, and learn how to use sample space to compute the probability of a specific event. Set Theory:
Further Mathematics 2018 CORE: Data analysis Chapter 2 Summarising numerical data
 Chapter 2: Summarising numerical data Further Mathematics 2018 CORE: Data analysis Chapter 2 Summarising numerical data Extract from Study Design Key knowledge Types of data: categorical (nominal and ordinal)
3 Joint Distributions 71
 2.2.3 The Normal Distribution 54 2.2.4 The Beta Density 58 2.3 Functions of a Random Variable 58 2.4 Concluding Remarks 64 2.5 Problems 64 3 Joint Distributions 71 3.1 Introduction 71 3.2 Discrete Random
3rd Quartile. 1st Quartile) Minimum
 Minimum") EXST7034 - Regression Techniques Page 1 Regression diagnostics dependent variable Y3 There are a number of graphic representations which will help with problem detection and which can be used to obtain
EXST7034 - Regression Techniques Page 1 Regression diagnostics dependent variable Y3 There are a number of graphic representations which will help with problem detection and which can be used to obtain
Inferences About the Difference Between Two Means
 7 Inferences About the Difference Between Two Means Chapter Outline 7.1 New Concepts 7.1.1 Independent Versus Dependent Samples 7.1. Hypotheses 7. Inferences About Two Independent Means 7..1 Independent
Descriptive Statistics C H A P T E R 5 P P
 Descriptive Statistics C H A P T E R 5 P P 1 1 0-130 Graphing data Frequency distributions Bar graphs Qualitative variable (categories) Bars don t touch Histograms Frequency polygons Quantitative variable
An Analysis of College Algebra Exam Scores December 14, James D Jones Math Section 01
 An Analysis of College Algebra Exam s December, 000 James D Jones Math - Section 0 An Analysis of College Algebra Exam s Introduction Students often complain about a test being too difficult. Are there
unadjusted model for baseline cholesterol 22:31 Monday, April 19,
 unadjusted model for baseline cholesterol 22:31 Monday, April 19, 2004 1 Class Level Information Class Levels Values TRETGRP 3 3 4 5 SEX 2 0 1 Number of observations 916 unadjusted model for baseline cholesterol
FRANKLIN UNIVERSITY PROFICIENCY EXAM (FUPE) STUDY GUIDE
 STUDY GUIDE") FRANKLIN UNIVERSITY PROFICIENCY EXAM (FUPE) STUDY GUIDE Course Title: Probability and Statistics (MATH 80) Recommended Textbook(s): Number & Type of Questions: Probability and Statistics for Engineers
FRANKLIN UNIVERSITY PROFICIENCY EXAM (FUPE) STUDY GUIDE Course Title: Probability and Statistics (MATH 80) Recommended Textbook(s): Number & Type of Questions: Probability and Statistics for Engineers
Rank-Based Methods. Lukas Meier
 Rank-Based Methods Lukas Meier 20.01.2014 Introduction Up to now we basically always used a parametric family, like the normal distribution N (µ, σ 2 ) for modeling random data. Based on observed data
CHAPTER 17 CHI-SQUARE AND OTHER NONPARAMETRIC TESTS FROM: PAGANO, R. R. (2007)
") FROM: PAGANO, R. R. (007) I. INTRODUCTION: DISTINCTION BETWEEN PARAMETRIC AND NON-PARAMETRIC TESTS Statistical inference tests are often classified as to whether they are parametric or nonparametric Parameter
FROM: PAGANO, R. R. (007) I. INTRODUCTION: DISTINCTION BETWEEN PARAMETRIC AND NON-PARAMETRIC TESTS Statistical inference tests are often classified as to whether they are parametric or nonparametric Parameter
(quantitative or categorical variables) Numerical descriptions of center, variability, position (quantitative variables)
 Numerical descriptions of center, variability, position (quantitative variables)") 3. Descriptive Statistics Describing data with tables and graphs (quantitative or categorical variables) Numerical descriptions of center, variability, position (quantitative variables) Bivariate descriptions
3. Descriptive Statistics Describing data with tables and graphs (quantitative or categorical variables) Numerical descriptions of center, variability, position (quantitative variables) Bivariate descriptions
Introduction to Statistics with GraphPad Prism 7
 Introduction to Statistics with GraphPad Prism 7 Outline of the course Power analysis with G*Power Basic structure of a GraphPad Prism project Analysis of qualitative data Chi-square test Analysis of quantitative
STAT 200 Chapter 1 Looking at Data - Distributions
 STAT 200 Chapter 1 Looking at Data - Distributions What is Statistics? Statistics is a science that involves the design of studies, data collection, summarizing and analyzing the data, interpreting the
Introduction to inferential statistics. Alissa Melinger IGK summer school 2006 Edinburgh
 Introduction to inferential statistics Alissa Melinger IGK summer school 2006 Edinburgh Short description Prereqs: I assume no prior knowledge of stats This half day tutorial on statistical analysis will
Overview. INFOWO Statistics lecture S1: Descriptive statistics. Detailed Overview of the Statistics track. Definition
 Overview INFOWO Statistics lecture S1: Descriptive statistics Peter de Waal Introduction to statistics Descriptive statistics Department of Information and Computing Sciences Faculty of Science, Universiteit
Transition Passage to Descriptive Statistics 28
 viii Preface xiv chapter 1 Introduction 1 Disciplines That Use Quantitative Data 5 What Do You Mean, Statistics? 6 Statistics: A Dynamic Discipline 8 Some Terminology 9 Problems and Answers 12 Scales of
Why should I use a Kruskal-Wallis test? (With Minitab) Why should I use a Kruskal-Wallis test? (With SPSS)
 Why should I use a Kruskal-Wallis test? (With SPSS)") Why should I use a Kruskal-Wallis test? (With Minitab) To perform this test, select Stat > Nonparametrics > Kruskal-Wallis. Use the Kruskal-Wallis test to determine whether the medians of two or more groups
Why should I use a Kruskal-Wallis test? (With Minitab) To perform this test, select Stat > Nonparametrics > Kruskal-Wallis. Use the Kruskal-Wallis test to determine whether the medians of two or more groups
Stat 101 Exam 1 Important Formulas and Concepts 1
 1 Chapter 1 1.1 Definitions Stat 101 Exam 1 Important Formulas and Concepts 1 1. Data Any collection of numbers, characters, images, or other items that provide information about something. 2. Categorical/Qualitative
Types of Information. Topic 2 - Descriptive Statistics. Examples. Sample and Sample Size. Background Reading. Variables classified as STAT 511
 Topic 2 - Descriptive Statistics STAT 511 Professor Bruce Craig Types of Information Variables classified as Categorical (qualitative) - variable classifies individual into one of several groups or categories
Stat 427/527: Advanced Data Analysis I
 Stat 427/527: Advanced Data Analysis I Review of Chapters 1-4 Sep, 2017 1 / 18 Concepts you need to know/interpret Numerical summaries: measures of center (mean, median, mode) measures of spread (sample
BNG 495 Capstone Design. Descriptive Statistics
 BNG 495 Capstone Design Descriptive Statistics Overview The overall goal of this short course in statistics is to provide an introduction to descriptive and inferential statistical methods, with a focus
CIVL 7012/8012. Collection and Analysis of Information
 CIVL 7012/8012 Collection and Analysis of Information Uncertainty in Engineering Statistics deals with the collection and analysis of data to solve real-world problems. Uncertainty is inherent in all real
Example 2. Given the data below, complete the chart:
 Statistics 2035 Quiz 1 Solutions Example 1. 2 64 150 150 2 128 150 2 256 150 8 8 Example 2. Given the data below, complete the chart: 52.4, 68.1, 66.5, 75.0, 60.5, 78.8, 63.5, 48.9, 81.3 n=9 The data is
Nonparametric Statistics
 Nonparametric Statistics Nonparametric or Distribution-free statistics: used when data are ordinal (i.e., rankings) used when ratio/interval data are not normally distributed (data are converted to ranks)
BIOL 51A - Biostatistics 1 1. Lecture 1: Intro to Biostatistics. Smoking: hazardous? FEV (l) Smoke
 Smoke") BIOL 51A - Biostatistics 1 1 Lecture 1: Intro to Biostatistics Smoking: hazardous? FEV (l) 1 2 3 4 5 No Yes Smoke BIOL 51A - Biostatistics 1 2 Box Plot a.k.a box-and-whisker diagram or candlestick chart
BIOL 51A - Biostatistics 1 1 Lecture 1: Intro to Biostatistics Smoking: hazardous? FEV (l) 1 2 3 4 5 No Yes Smoke BIOL 51A - Biostatistics 1 2 Box Plot a.k.a box-and-whisker diagram or candlestick chart
Biostatistics for biomedical profession. BIMM34 Karin Källen & Linda Hartman November-December 2015
 Biostatistics for biomedical profession BIMM34 Karin Källen & Linda Hartman November-December 2015 12015-11-02 Who needs a course in biostatistics? - Anyone who uses quntitative methods to interpret biological
Statistics Toolbox 6. Apply statistical algorithms and probability models
 Statistics Toolbox 6 Apply statistical algorithms and probability models Statistics Toolbox provides engineers, scientists, researchers, financial analysts, and statisticians with a comprehensive set of
Z score indicates how far a raw score deviates from the sample mean in SD units. score Mean % Lower Bound
 1 EDUR 8131 Chat 3 Notes 2 Normal Distribution and Standard Scores Questions Standard Scores: Z score Z = (X M) / SD Z = deviation score divided by standard deviation Z score indicates how far a raw score
y response variable x 1, x 2,, x k -- a set of explanatory variables
 11. Multiple Regression and Correlation y response variable x 1, x 2,, x k -- a set of explanatory variables In this chapter, all variables are assumed to be quantitative. Chapters 12-14 show how to incorporate
Variables, distributions, and samples (cont.) Phil 12: Logic and Decision Making Fall 2010 UC San Diego 10/18/2010
 Phil 12: Logic and Decision Making Fall 2010 UC San Diego 10/18/2010") Variables, distributions, and samples (cont.) Phil 12: Logic and Decision Making Fall 2010 UC San Diego 10/18/2010 Review Recording observations - Must extract that which is to be analyzed: coding systems,
Variables, distributions, and samples (cont.) Phil 12: Logic and Decision Making Fall 2010 UC San Diego 10/18/2010 Review Recording observations - Must extract that which is to be analyzed: coding systems,
Full file at
 IV SOLUTIONS TO EXERCISES Note: Exercises whose answers are given in the back of the textbook are denoted by the symbol. CHAPTER Description of Samples and Populations Note: Exercises whose answers are
CHI SQUARE ANALYSIS 8/18/2011 HYPOTHESIS TESTS SO FAR PARAMETRIC VS. NON-PARAMETRIC
 CHI SQUARE ANALYSIS I N T R O D U C T I O N T O N O N - P A R A M E T R I C A N A L Y S E S HYPOTHESIS TESTS SO FAR We ve discussed One-sample t-test Dependent Sample t-tests Independent Samples t-tests
Frequency Distribution Cross-Tabulation
 Frequency Distribution Cross-Tabulation 1) Overview 2) Frequency Distribution 3) Statistics Associated with Frequency Distribution i. Measures of Location ii. Measures of Variability iii. Measures of Shape
STP 420 INTRODUCTION TO APPLIED STATISTICS NOTES
 INTRODUCTION TO APPLIED STATISTICS NOTES PART - DATA CHAPTER LOOKING AT DATA - DISTRIBUTIONS Individuals objects described by a set of data (people, animals, things) - all the data for one individual make
CHAPTER 2 Description of Samples and Populations
 Chapter 2 27 CHAPTER 2 Description of Samples and Populations 2.1.1 (a) i) Molar width ii) Continuous variable iii) A molar iv) 36 (b) i) Birthweight, date of birth, and race ii) Birthweight is continuous,
Statistics Handbook. All statistical tables were computed by the author.
 Statistics Handbook Contents Page Wilcoxon rank-sum test (Mann-Whitney equivalent) Wilcoxon matched-pairs test 3 Normal Distribution 4 Z-test Related samples t-test 5 Unrelated samples t-test 6 Variance
Nonparametric Statistics. Leah Wright, Tyler Ross, Taylor Brown
 Nonparametric Statistics Leah Wright, Tyler Ross, Taylor Brown Before we get to nonparametric statistics, what are parametric statistics? These statistics estimate and test population means, while holding
Chapters 1 & 2 Exam Review
 Problems 1-3 refer to the following five boxplots. 1.) To which of the above boxplots does the following histogram correspond? (A) A (B) B (C) C (D) D (E) E 2.) To which of the above boxplots does the
Midrange: mean of highest and lowest scores. easy to compute, rough estimate, rarely used
 Measures of Central Tendency Mode: most frequent score. best average for nominal data sometimes none or multiple modes in a sample bimodal or multimodal distributions indicate several groups included in
Statistics I Chapter 2: Univariate data analysis
 Statistics I Chapter 2: Univariate data analysis Chapter 2: Univariate data analysis Contents Graphical displays for categorical data (barchart, piechart) Graphical displays for numerical data data (histogram,
STATISTICS ( CODE NO. 08 ) PAPER I PART - I
 PAPER I PART - I") STATISTICS ( CODE NO. 08 ) PAPER I PART - I 1. Descriptive Statistics Types of data - Concepts of a Statistical population and sample from a population ; qualitative and quantitative data ; nominal and
STATISTICS ( CODE NO. 08 ) PAPER I PART - I 1. Descriptive Statistics Types of data - Concepts of a Statistical population and sample from a population ; qualitative and quantitative data ; nominal and
Basics on t-tests Independent Sample t-tests Single-Sample t-tests Summary of t-tests Multiple Tests, Effect Size Proportions. Statistiek I.
 Statistiek I t-tests John Nerbonne CLCG, Rijksuniversiteit Groningen http://www.let.rug.nl/nerbonne/teach/statistiek-i/ John Nerbonne 1/46 Overview 1 Basics on t-tests 2 Independent Sample t-tests 3 Single-Sample
Types of Statistical Tests DR. MIKE MARRAPODI
 Types of Statistical Tests DR. MIKE MARRAPODI Tests t tests ANOVA Correlation Regression Multivariate Techniques Non-parametric t tests One sample t test Independent t test Paired sample t test One sample
Empirical Research Methods
 Institut für Politikwissenschaft Schwerpunkt qualitative empirische Sozialforschung Goethe-Universität Frankfurt Fachbereich 03 Prof. Dr. Claudius Wagemann Empirical Research Methods 25 June 2013 Quantitative
Review of Multiple Regression
 Ronald H. Heck 1 Let s begin with a little review of multiple regression this week. Linear models [e.g., correlation, t-tests, analysis of variance (ANOVA), multiple regression, path analysis, multivariate
Lecture 2. Quantitative variables. There are three main graphical methods for describing, summarizing, and detecting patterns in quantitative data:
 Lecture 2 Quantitative variables There are three main graphical methods for describing, summarizing, and detecting patterns in quantitative data: Stemplot (stem-and-leaf plot) Histogram Dot plot Stemplots
Chapter 4. Displaying and Summarizing. Quantitative Data
 STAT 141 Introduction to Statistics Chapter 4 Displaying and Summarizing Quantitative Data Bin Zou (bzou@ualberta.ca) STAT 141 University of Alberta Winter 2015 1 / 31 4.1 Histograms 1 We divide the range
Statistics I Chapter 2: Univariate data analysis
 Statistics I Chapter 2: Univariate data analysis Chapter 2: Univariate data analysis Contents Graphical displays for categorical data (barchart, piechart) Graphical displays for numerical data data (histogram,
Analyzing Small Sample Experimental Data
 Analyzing Small Sample Experimental Data Session 2: Non-parametric tests and estimators I Dominik Duell (University of Essex) July 15, 2017 Pick an appropriate (non-parametric) statistic 1. Intro to non-parametric
Statistical. Psychology
 SEVENTH у *i km m it* & П SB Й EDITION Statistical M e t h o d s for Psychology D a v i d C. Howell University of Vermont ; \ WADSWORTH f% CENGAGE Learning* Australia Biaall apan Korea Меяко Singapore
Units. Exploratory Data Analysis. Variables. Student Data
 Units Exploratory Data Analysis Bret Larget Departments of Botany and of Statistics University of Wisconsin Madison Statistics 371 13th September 2005 A unit is an object that can be measured, such as
Workshop Research Methods and Statistical Analysis
 Workshop Research Methods and Statistical Analysis Session 2 Data Analysis Sandra Poeschl 08.04.2013 Page 1 Research process Research Question State of Research / Theoretical Background Design Data Collection
REVIEW: Midterm Exam. Spring 2012
 REVIEW: Midterm Exam Spring 2012 Introduction Important Definitions: - Data - Statistics - A Population - A census - A sample Types of Data Parameter (Describing a characteristic of the Population) Statistic
Chapter 1:Descriptive statistics
 Slide 1.1 Chapter 1:Descriptive statistics Descriptive statistics summarises a mass of information. We may use graphical and/or numerical methods Examples of the former are the bar chart and XY chart,
STATISTICS REVIEW. D. Parameter: a constant for the case or population under consideration.
 STATISTICS REVIEW I. Why do we need statistics? A. As human beings, we consciously and unconsciously evaluate whether variables affect phenomena of interest, but sometimes our common sense reasoning is
Introduction to Statistics
 Introduction to Statistics Data and Statistics Data consists of information coming from observations, counts, measurements, or responses. Statistics is the science of collecting, organizing, analyzing,
Sets and Set notation. Algebra 2 Unit 8 Notes
 Sets and Set notation Section 11-2 Probability Experimental Probability experimental probability of an event: Theoretical Probability number of time the event occurs P(event) = number of trials Sample
= Stat1600 Solution to Midterm #1 Form D
 Stat1600 Solution to Midterm #1 Form D 1. The chest sies, measured in inches, of Scottish militiamen in the early 19th century were recorded (adapted from DASL: Chest sies of Militiamen). A histogram of
ECLT 5810 Data Preprocessing. Prof. Wai Lam
 ECLT 5810 Data Preprocessing Prof. Wai Lam Why Data Preprocessing? Data in the real world is imperfect incomplete: lacking attribute values, lacking certain attributes of interest, or containing only aggregate