Outline: Introduction - Data used - Methods - Results
|
|
|
- Augustus Reed
- 5 years ago
- Views:
Transcription

1 Mapping of land covers in South Greenland using very high resolution satellite imagery Menaka Chellasamy, Mateja Ogric, Mogens H. Greve and René Larsen Outline: Introduction - Data used - Methods - Results DSM 2016_1st July


2
3 Arctic warming, a boon Greenland 3


4 Arctic warming, a boon Greenland 4


5 Arctic to sub-arctic 8 to 12ºC increment Agriculture in young soil 5
6 Research interests Substantial reservoir of Soil Organic Carbon (SOC) Potential areas for agriculture and animal farming Significant influence of carbon on the global C - cycle 6


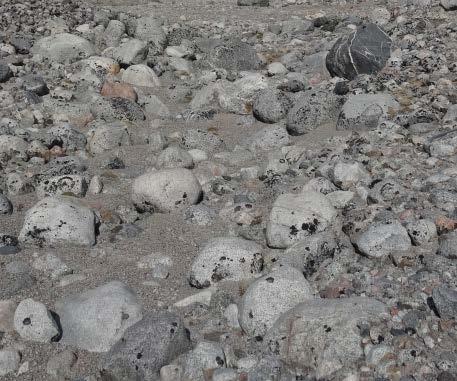
7 Study area Greenland Upernaviarssuk, 17,500 km² Focus on top soil, down to 25 cm depth Land cover map for SOC upscaling Upernaviarssuk 7


8 Land cover classes Shrubs Lichens Grass Water Shallow water Shadow Rock/ Stones Soil Sand Road 8


9 Sampling 780 land cover samples Cluster sampling ebee drone Satellite :Worldview2 Field visit 9


10 Worldview 2 Very High Resolution (VHR ) satellite imagery Upernaviarssuk Launched by DigitalGlobe, 2009 First commercial sensor with high spectral and spatial resolution 8 bands, 2m spatial resolution 10
11 Object-based supervised classification method Input Feature extraction Feature selection Image segmentation Object-based classification Accuracy assessment Comparison: 4 traditional band vs 8 bands 11
12 Object-based supervised classification method 215 from 4 bands / 392 from 8 bands, Matlab R2016a Input Feature extraction Spectral reflectances from each band Gabor texture from each band (5 frequencies and 8 orientations) Gabor texture from1st principal component from spectral bands Spectral indices (water, soil, pigment, yellowness, biomass) Feature selection Image segmentation Object-based classification Accuracy assessment 12
13 Object-based supervised classification method Weka system (Novack et al, 2011) Random Forest (RF) Fast Correlation-Based Filter (FCBF), InfoGain (IG) Relief-F (Re-F). 5 most relevant features from each algorithm are selected 12 for 4 band / 18 for 8 band Input Feature extraction Feature selection Image segmentation Object-based classification Accuracy assessment 13


14 Object-based supervised classification method Pixels Segments Input Feature extraction Feature selection Multi-resolution segmentation, ecognition 9.1 Scale 30, 50, 70, 100 compactness: 0.5, smoothness: 0.5, color: 0.9 and shape: 0.1 Image segmentation Object-based classification Accuracy assessment 14
15 Object-based supervised classification method 448 training image objects, Matlab R2016a 70 as base scale for classification mean; standard deviation; mean difference to neighbors; mean difference to scene; mean and standard deviation difference to super and sub objects; Support vector machine: radial basis function. Input Feature extraction Feature selection Image segmentation Object-based classification Accuracy assessment 15
16 Object-based supervised classification method Input Feature extraction 224 image objects for validation, Matlab R2016a Overall classification accuracy (OA), user and producer accuracy, 95% confidence level Uncertainity analaysis based on prediction probabilty (Cohen 1985) Feature selection Image segmentation Object-based classification Accuracy assessment 16

17 Segmentation results, Scale 70 4 traditional bands 8 bands 17


18 Classification results, Scale 70 Segmented image Shrub Lichens Grass 4 traditional bands 8 bands Rock/stones Road Soil Sand Water Shallow water Shadow 18
 Lichens (2,3%) Grass (20,5%) Rock/stones")
 Shallow water (0,3%) Shadow")
19 Classification results, Scale 70 Shrub (27,6 %) Lichens (2,3%) Grass (20,5%) Rock/stones (11,2%) Road (1,5%) Soil (32,1%) Sand (2,3) Water (1,8%) Shallow water (0,3%) Shadow (0,5%) 19
20 Classification accuracy Overall classification accuracy: 4 traditional bands 82.5% 8 bands 89.3% Producer accuracy (%) Uncertainty (%) 20

21 Thank you 21

22 22

23 SOC stock maps SOC stock for depth 0 5 cm RMSE = 0,94 kg/m 2 SOC stock for depth 5 15 cm RMSE = 0,82 kg/m 2 SOC stock for depth 0-15 cm RMSE = 1,12 kg/m 2 23
24 Evidence and Impact of Arctic Warming Sea ice thinning (>40%) and shrinking (11.5% / decade) Permafrost melting also releases methane Land ice melting sea level change Loss of sea ice impacts habitat of polar bears, walruses Ecosystem shifts from Arctic to subarctic communities Increase human activities shipping and oil production 24
25 SOC STOCK CALCULATIONS SSS sssss = C bbbb ddddddd ssssssss ddddd (1 CC) SOC stock (kg/m 3 ) Measured C (%) Bulk density (kg/m 2 ) Sampling depth (m) CF coarse fractions (%) 25

26 dataset 233 soil samples Two reference depths: 0 5 cm, 5 15 cm Grid sampling: 200 m 26
27 27

28 28
Object-Oriented Oriented Method to Classify the Land Use and Land Cover in San Antonio using ecognition Object-Oriented Oriented Image Analysis
 Object-Oriented Oriented Method to Classify the Land Use and Land Cover in San Antonio using ecognition Object-Oriented Oriented Image Analysis Jayar S. Griffith ES6973 Remote Sensing Image Processing
Urban land cover and land use extraction from Very High Resolution remote sensing imagery
 Urban land cover and land use extraction from Very High Resolution remote sensing imagery Mengmeng Li* 1, Alfred Stein 1, Wietske Bijker 1, Kirsten M.de Beurs 2 1 Faculty of Geo-Information Science and
Object Oriented Classification Using High-Resolution Satellite Images for HNV Farmland Identification. Shafique Matin and Stuart Green
 Object Oriented Classification Using High-Resolution Satellite Images for HNV Farmland Identification Shafique Matin and Stuart Green REDP, Teagasc Ashtown, Dublin, Ireland Correspondence: shafique.matin@teagasc.ie
Object Based Imagery Exploration with. Outline
 Object Based Imagery Exploration with Dan Craver Portland State University June 11, 2007 Outline Overview Getting Started Processing and Derivatives Object-oriented classification Literature review Demo
Classification of High Spatial Resolution Remote Sensing Images Based on Decision Fusion
 Journal of Advances in Information Technology Vol. 8, No. 1, February 2017 Classification of High Spatial Resolution Remote Sensing Images Based on Decision Fusion Guizhou Wang Institute of Remote Sensing
COMPARISON OF PIXEL-BASED AND OBJECT-BASED CLASSIFICATION METHODS FOR SEPARATION OF CROP PATTERNS
 COMPARISON OF PIXEL-BASED AND OBJECT-BASED CLASSIFICATION METHODS FOR SEPARATION OF CROP PATTERNS Levent BAŞAYİĞİT, Rabia ERSAN Suleyman Demirel University, Agriculture Faculty, Soil Science and Plant
The area on and near the Earth s surface where living things exist. The biosphere:
 The area on and near the Earth s surface where living things exist The biosphere: The Biosphere If you use an apple to model the world, which part of the apple would represent the biosphere? Today define:
Detection of Sea Ice/ Melt Pond from Aerial Photos through Object-based Image Classification Scheme
 NEMC 213 August 5-9, San Antonio, TX Detection of Sea Ice/ Melt Pond from Aerial Photos through Object-based Image Classification Scheme Xin Miao 12, Hongjie Xie 2, Zhijun Li 3, Ruibo Lei 4 1 Department
An Automated Object-Oriented Satellite Image Classification Method Integrating the FAO Land Cover Classification System (LCCS).
.") An Automated Object-Oriented Satellite Image Classification Method Integrating the FAO Land Cover Classification System (LCCS). Ruvimbo Gamanya Sibanda Prof. Dr. Philippe De Maeyer Prof. Dr. Morgan De
An Automated Object-Oriented Satellite Image Classification Method Integrating the FAO Land Cover Classification System (LCCS). Ruvimbo Gamanya Sibanda Prof. Dr. Philippe De Maeyer Prof. Dr. Morgan De
Preparation of LULC map from GE images for GIS based Urban Hydrological Modeling
 International Conference on Modeling Tools for Sustainable Water Resources Management Department of Civil Engineering, Indian Institute of Technology Hyderabad: 28-29 December 2014 Abstract Preparation
High resolution wetland mapping I.
 High resolution wetland mapping I. Based on the teaching material developed by Steve Kas, GeoVille for WOIS Product Group #5 Dr. Zoltán Vekerdy and János Grósz z.vekerdy@utwente.nl vekerdy.zoltan@mkk.szie.hu
the Clinch/Hidden Valley study site were used in this mountainous classification.
 the Clinch/Hidden Valley study site were used in this mountainous classification. Deciduous forest was present on over half of the image (Table 97). Coniferous forest and herbaceous were the only other
Urban remote sensing: from local to global and back
 Urban remote sensing: from local to global and back Paolo Gamba University of Pavia, Italy A few words about Pavia Historical University (1361) in a nice town slide 3 Geoscience and Remote Sensing Society
Object-based feature extraction of Google Earth Imagery for mapping termite mounds in Bahia, Brazil
 OPEN ACCESS Conference Proceedings Paper Sensors and Applications www.mdpi.com/journal/sensors Object-based feature extraction of Google Earth Imagery for mapping termite mounds in Bahia, Brazil Sunhui
Pan-Arctic, Regional and Local Land Cover Products
 Pan-Arctic, Regional and Local Land Cover Products Marcel Urban (1), Stefan Pöcking (1), Sören Hese (1) & Christiane Schmullius (1) (1) Friedrich-Schiller University Jena, Department of Earth Observation,
Change Detection Analysis using New Nano Satellite Imagery
 Change Detection Analysis using New Nano Satellite Imagery M. Selim Abstract: Mapping Land use /Land cover (LULC), changes studies have become interesting over the past decades through using remote sensing.
Capabilities and Limitations of Land Cover and Satellite Data for Biomass Estimation in African Ecosystems Valerio Avitabile
 Capabilities and Limitations of Land Cover and Satellite Data for Biomass Estimation in African Ecosystems Valerio Avitabile Kaniyo Pabidi - Budongo Forest Reserve November 13th, 2008 Outline of the presentation
CLIMATE CHANGE AND OIL IN THE ARCTIC
 CLIMATE CHANGE AND OIL IN THE ARCTIC What is Climate Change? Rising temperatures Changes in weather Warm acidic oceans Melting ice caps Rising sea levels Photo from uab.edu A Way Forward: Facing Climate
AN INVESTIGATION OF AUTOMATIC CHANGE DETECTION FOR TOPOGRAPHIC MAP UPDATING
 AN INVESTIGATION OF AUTOMATIC CHANGE DETECTION FOR TOPOGRAPHIC MAP UPDATING Patricia Duncan 1 & Julian Smit 2 1 The Chief Directorate: National Geospatial Information, Department of Rural Development and
Streamlining Land Change Detection to Improve Control Efficiency
 Streamlining Land Change Detection to Improve Control Efficiency Sanjay Rana sanjay.rana@rpa.gsi.gov.uk Rural Payments Agency Research and Development Teams Purpose The talk presents the methodology and
DEVELOPMENT OF DIGITAL CARTOGRAPHIC DATABASE FOR MANAGING THE ENVIRONMENT AND NATURAL RESOURCES IN THE REPUBLIC OF SERBIA
 DEVELOPMENT OF DIGITAL CARTOGRAPHIC BASE FOR MANAGING THE ENVIRONMENT AND NATURAL RESOURCES IN THE REPUBLIC OF SERBIA Dragutin Protic, Ivan Nestorov Institute for Geodesy, Faculty of Civil Engineering,
Biomes Section 1. Chapter 6: Biomes Section 1: What is a Biome? DAY ONE
 Chapter 6: Biomes Section 1: What is a Biome? DAY ONE What is a Biome? Biomes are large regions characterized by a specific type of climate and certain types of plant and animal communities. The climate
Module 2.1 Monitoring activity data for forests using remote sensing
 Module 2.1 Monitoring activity data for forests using remote sensing Module developers: Frédéric Achard, European Commission (EC) Joint Research Centre (JRC) Jukka Miettinen, EC JRC Brice Mora, Wageningen
Annual September Arctic Sea ice extent
 Annual September Arctic Sea ice extent 1979-2012 Annual September Arctic Sea ice extent 1979-2012 Notes: The month of September has the minimum sea ice cover each year. Passive microwave instruments on
LAND COVER CATEGORY DEFINITION BY IMAGE INVARIANTS FOR AUTOMATED CLASSIFICATION
 LAND COVER CATEGORY DEFINITION BY IMAGE INVARIANTS FOR AUTOMATED CLASSIFICATION Nguyen Dinh Duong Environmental Remote Sensing Laboratory Institute of Geography Hoang Quoc Viet Rd., Cau Giay, Hanoi, Vietnam
Principals and Elements of Image Interpretation
 Principals and Elements of Image Interpretation 1 Fundamentals of Photographic Interpretation Observation and inference depend on interpreter s training, experience, bias, natural visual and analytical
KNOWLEDGE-BASED CLASSIFICATION OF LAND COVER FOR THE QUALITY ASSESSEMENT OF GIS DATABASE. Israel -
 KNOWLEDGE-BASED CLASSIFICATION OF LAND COVER FOR THE QUALITY ASSESSEMENT OF GIS DATABASE Ammatzia Peled a,*, Michael Gilichinsky b a University of Haifa, Department of Geography and Environmental Studies,
Directions: Using the Succession Power Point, answer the following questions. 1. What did these events do to the earth? 2. How did the events do this?
 Name Period Date Assigned Date Due Date Returned Directions: Using the Succession Power Point, answer the following questions. 1. What did these events do to the earth? 2. How did the events do this? 3.
IMPROVING REMOTE SENSING-DERIVED LAND USE/LAND COVER CLASSIFICATION WITH THE AID OF SPATIAL INFORMATION
 IMPROVING REMOTE SENSING-DERIVED LAND USE/LAND COVER CLASSIFICATION WITH THE AID OF SPATIAL INFORMATION Yingchun Zhou1, Sunil Narumalani1, Dennis E. Jelinski2 Department of Geography, University of Nebraska,
Project. Aim: How does energy flow in Arctic and Antarctic ecosystems? Explore. The four food webs are:
 Name: Date: Aim: How does energy flow in Arctic and Antarctic ecosystems? Explore The four food webs are: o Antarctic Marine Food Web o Arctic Marine Food Web o Tundra Land Food Web o Tundra Freshwater
ATOC OUR CHANGING ENVIRONMENT Class 19 (Chp 6) Objectives of Today s Class: The Cryosphere [1] Components, time scales; [2] Seasonal snow
![ATOC OUR CHANGING ENVIRONMENT Class 19 (Chp 6) Objectives of Today s Class: The Cryosphere [1] Components, time scales; [2] Seasonal snow](/thumbs/95/126309683.jpg "ATOC OUR CHANGING ENVIRONMENT Class 19 (Chp 6) Objectives of Today s Class: The Cryosphere [1] Components, time scales; [2] Seasonal snow") ATOC 1060-002 OUR CHANGING ENVIRONMENT Class 19 (Chp 6) Objectives of Today s Class: The Cryosphere [1] Components, time scales; [2] Seasonal snow cover, permafrost, river and lake ice, ; [3]Glaciers and
ATOC 1060-002 OUR CHANGING ENVIRONMENT Class 19 (Chp 6) Objectives of Today s Class: The Cryosphere [1] Components, time scales; [2] Seasonal snow cover, permafrost, river and lake ice, ; [3]Glaciers and
GEOBIA For Land Use Mapping Using Worldview2 Image In Bengkak Village Coastal, Banyuwangi Regency, East Java
 IOP Conference Series: Earth and Environmental Science PAPER OPEN ACCESS GEOBIA For Land Use Mapping Using Worldview2 Image In Bengkak Village Coastal, Banyuwangi Regency, East Java Related content - Linear
Object-based classification of residential land use within Accra, Ghana based on QuickBird satellite data
 International Journal of Remote Sensing Vol. 28, No. 22, 20 November 2007, 5167 5173 Letter Object-based classification of residential land use within Accra, Ghana based on QuickBird satellite data D.
AUTOMATIC LAND-COVER CLASSIFICATION OF LANDSAT IMAGES USING FEATURE DATABASE IN A NETWORK
 AUTOMATIC LAND-COVER CLASSIFICATION OF LANDSAT IMAGES USING FEATURE DATABASE IN A NETWORK G. W. Yoon*, S. I. Cho, G. J. Chae, J. H. Park ETRI Telematics Research Group, Daejeon, Korea (gwyoon, chosi, cbase,
The Road to Data in Baltimore
 Creating a parcel level database from high resolution imagery By Austin Troy and Weiqi Zhou University of Vermont, Rubenstein School of Natural Resources State and local planning agencies are increasingly
Managing uncertainty when aggregating from pixels to parcels: context sensitive mapping and possibility theory
 Department of Geography Managing uncertainty when aggregating from pixels to parcels: context sensitive mapping and possibility theory Dr Lex Comber ajc36@le.ac.uk www.le.ac.uk/gg/staff/academic_comber.htm
Object Based Land Cover Extraction Using Open Source Software
 Object Based Land Cover Extraction Using Open Source Software Abhasha Joshi 1, Janak Raj Joshi 2, Nawaraj Shrestha 3, Saroj Sreshtha 4, Sudarshan Gautam 5 1 Instructor, Land Management Training Center,
Activity 3 Arctic Heat Wave?
 Activity 3 Arctic Heat Wave? Forces of Change >> Arctic >> Activity 3 >> Page 1 ACTIVITY 3 ARCTIC HEAT WAVE? THE RATE OF CLIMATE CHANGE Are Ice Caps Melting Faster? From 1979 to 2002, seasonal melting
Satellite Remote Sensing for Ocean
 Satellite Remote Sensing for Ocean August 17, 2017 Masatoshi Kamei RESTEC All rights reserved RESTEC 2015 Contents 1. About RESTEC and Remote Sensing 2. Example of Remote Sensing Technology 3. Remote Sensing
A COMPARISON BETWEEN DIFFERENT PIXEL-BASED CLASSIFICATION METHODS OVER URBAN AREA USING VERY HIGH RESOLUTION DATA INTRODUCTION
 A COMPARISON BETWEEN DIFFERENT PIXEL-BASED CLASSIFICATION METHODS OVER URBAN AREA USING VERY HIGH RESOLUTION DATA Ebrahim Taherzadeh a, Helmi Z.M. Shafri a, Seyed Hassan Khalifeh Soltani b, Shattri Mansor
Defining microclimates on Long Island using interannual surface temperature records from satellite imagery
 Defining microclimates on Long Island using interannual surface temperature records from satellite imagery Deanne Rogers*, Katherine Schwarting, and Gilbert Hanson Dept. of Geosciences, Stony Brook University,
Fundamentals of Photographic Interpretation
 Principals and Elements of Image Interpretation Fundamentals of Photographic Interpretation Observation and inference depend on interpreter s training, experience, bias, natural visual and analytical abilities.
A Method to Improve the Accuracy of Remote Sensing Data Classification by Exploiting the Multi-Scale Properties in the Scene
 Proceedings of the 8th International Symposium on Spatial Accuracy Assessment in Natural Resources and Environmental Sciences Shanghai, P. R. China, June 25-27, 2008, pp. 183-188 A Method to Improve the
New Land Cover & Land Use Data for the Chesapeake Bay Watershed
 New Land Cover & Land Use Data for the Chesapeake Bay Watershed Why? The Chesapeake Bay Program (CBP) partnership is in the process of improving and refining the Phase 6 suite of models used to inform
RANGELAND PRODUCTIVITY MODELLING: DEVELOPING AND CUSTOMISING METHODOLOGIES FOR LAND COVER MAPPING IN NAMIBIA
 RANGELAND PRODUCTIVITY MODELLING: DEVELOPING AND CUSTOMISING METHODOLOGIES FOR LAND COVER MAPPING IN NAMIBIA CELESTÉ ESPACH Agro-Ecological Zoning (AEZ) Programme, Directorate of Research and Training,
LANDSCAPE PATTERN AND PER-PIXEL CLASSIFICATION PROBABILITIES. Scott W. Mitchell,
 LANDSCAPE PATTERN AND PER-PIXEL CLASSIFICATION PROBABILITIES Scott W. Mitchell, Department of Geography and Environmental Studies, Carleton University, Loeb Building B349, 1125 Colonel By Drive, Ottawa,
Sentinel-1 Mission Status
 Sentinel-1 Mission Status Pierre Potin, Sentinel-1 Mission Manager, ESA Luca Martino, Technical Support Engineer, ESA... and the Sentinel-1 operations team PSTG SAR Coordination Working Group 14 December
C o p e r n i c u s L a n d M o n i t o r i n g S e r v i c e
 C o p e r n i c u s L a n d M o n i t o r i n g S e r v i c e Integration into existing Snow and Ice Services and draft product specifications Annett BARTSCH b.geos Copernicus High Resolution Snow and
THE CANADIAN CENTRE FOR CLIMATE MODELLING AND ANALYSIS
 THE CANADIAN CENTRE FOR CLIMATE MODELLING AND ANALYSIS As Canada s climate changes, and weather patterns shift, Canadian climate models provide guidance in an uncertain future. CANADA S CLIMATE IS CHANGING
Remote Sensing and Geographic Information System (GIS) Based Analysis of Historic Resources
 Based Analysis of Historic Resources") World War II Additional Material Remote Sensing and Geographic Information System (GIS) Based Analysis of Historic Resources By Nicole Vernon and Patrick O Day, GANDA Remote Sensing and Geographic Information
World War II Additional Material Remote Sensing and Geographic Information System (GIS) Based Analysis of Historic Resources By Nicole Vernon and Patrick O Day, GANDA Remote Sensing and Geographic Information
Welcome to NR502 GIS Applications in Natural Resources. You can take this course for 1 or 2 credits. There is also an option for 3 credits.
 Welcome to NR502 GIS Applications in Natural Resources. You can take this course for 1 or 2 credits. There is also an option for 3 credits. The 1st credit consists of a series of readings, demonstration,
Landslide Classification: An Object-Based Approach Bryan Zhou Geog 342: Final Project
 Landslide Classification: An Object-Based Approach Bryan Zhou Geog 342: Final Project Introduction One type of natural hazard that people are familiar with is landslide. Landslide is a laymen term use
European Space Agency
 Guidelines - Guidelines how/when to interact during the WebEx session: - Due to the number of attendees, please keep always your webcam and microphone switched-off - You can use anytime the chat to all
Cost-Effective Estimation of Vegetation Regrowth on Anthropogenic Features in NE BC (REMB )
") Cost-Effective Estimation of Vegetation Regrowth on Anthropogenic Features in NE BC (REMB-2017-02) FINAL PROJECT REPORT October 31, 2018 Project [1475-1] Prepared by: Prepared for: Jacqueline Howard Resource
Cost-Effective Estimation of Vegetation Regrowth on Anthropogenic Features in NE BC (REMB-2017-02) FINAL PROJECT REPORT October 31, 2018 Project [1475-1] Prepared by: Prepared for: Jacqueline Howard Resource
Deriving Uncertainty of Area Estimates from Satellite Imagery using Fuzzy Land-cover Classification
 International Journal of Information and Computation Technology. ISSN 0974-2239 Volume 3, Number 10 (2013), pp. 1059-1066 International Research Publications House http://www. irphouse.com /ijict.htm Deriving
Update on Climate Science. Professor Richard Betts, Met Office
 Update on Climate Science Professor Richard Betts, Met Office The science of climate change Crown copyright Met Office Prof Richard Betts Head of Climate Impacts Research Crown copyright Met Office Observing
SYNERGY OF SATELLITE REMOTE SENSING AND SENSOR NETWORKS ON GEO GRID
 SYNERGY OF SATELLITE REMOTE SENSING AND SENSOR NETWORKS ON GEO GRID National Institute of Advanced Industrial Science and Technology, Japan Yoshio Tanaka (on behalf of AIST GEO Grid team) Contents Brief
Ice Mass & Sea Level Change Unit 3: GROUP A Snowmelt Group
 Ice Mass & Sea Level Change Unit 3: GROUP A Snowmelt Group Becca Walker and Leigh Stearns You have been provided with two Greenland air temperature maps. Satellites equipped with radiometers (instruments
Mangrove Species Identification: Comparing WorldView-2 with Aerial Photographs
 Remote Sens. 2014, 6, 6064-6088; doi:10.3390/rs6076064 Article OPEN ACCESS remote sensing ISSN 2072-4292 www.mdpi.com/journal/remotesensing Mangrove Species Identification: Comparing WorldView-2 with Aerial
Comparison and Analysis of the Pixel-based and Object-Oriented Methods for Land Cover Classification with ETM+ Data
 IOSR Journal of Environmental Science, Toxicology and Food Technology (IOSR-JESTFT) e-issn: 2319-2402,p- ISSN: 2319-2399.Volume 9, Issue 2 Ver. II (Feb 2015), PP 48-53 www.iosrjournals.org Comparison and
A DATA FIELD METHOD FOR URBAN REMOTELY SENSED IMAGERY CLASSIFICATION CONSIDERING SPATIAL CORRELATION
 The International Archives of the Photogrammetry, Remote Sensing and Spatial Information Sciences, Volume XLI-B7, 016 XXIII ISPRS Congress, 1 19 July 016, Prague, Czech Republic A DATA FIELD METHOD FOR
A global map of mangrove forest soil carbon at 30 m spatial resolution
 Supplemental Information A global map of mangrove forest soil carbon at 30 m spatial resolution By Sanderman, Hengl, Fiske et al. SI1. Mangrove soil carbon database. Methods. A database was compiled from
Activity 4 It s a Cool Color
 Activity 4 It s a Cool Color Forces of Change >> Arctic >> Activity 4 >> Page 1 ACTIVITY 4 IT S A COOL COLOR THE ALBEDO EFFECT AND CLIMATE OVERVIEW SUGGESTED GRADE LEVEL ALIGNMENT WITH NATIONAL STANDARDS
MAPPING URBAN LAND COVER USING MULTI-SCALE AND SPATIAL AUTOCORRELATION INFORMATION IN HIGH RESOLUTION IMAGERY. Brian A. Johnson
 MAPPING URBAN LAND COVER USING MULTI-SCALE AND SPATIAL AUTOCORRELATION INFORMATION IN HIGH RESOLUTION IMAGERY by Brian A. Johnson A Dissertation Submitted to the Faculty of The Charles E. Schmidt College
Infrastructure monitoring using SAR interferometry
 Infrastructure monitoring using SAR interferometry Hossein Nahavandchi Roghayeh Shamshiri Norwegian University of Science and Technology (NTNU), Department of Civil and Environmental Engineering Geodesy
Unit Six Test Review 1. Look at the diagram below. Determine if it is primary or secondary succession.
 Unit Six Test Review 1. Look at the diagram below. Determine if it is primary or secondary succession. Begins with bare rock; no plants have lived there before Bare rock 2. Look at the diagram below and
Using MERIS and MODIS for Land Cover Mapping in the Netherlands
 Using MERIS and for Land Cover Mapping in the Netherlands Raul Zurita Milla, Michael Schaepman and Jan Clevers Wageningen University, Centre for Geo-Information, NL Introduction Actual and reliable information
PRINCIPLES OF PHOTO INTERPRETATION
 PRINCIPLES OF PHOTO INTERPRETATION Photo Interpretation the act of examining photographic images for the purpose of identifying objects and judging their significance an art more than a science Recognition
European Commission Joint Research Center, CCR / TP Ispra, Italy
 OBJECT-ORIENTED WAVELET MULTI-RESOLUTION IMAGE ANALYSIS OF THE SIBERIA GBFM RADAR MOSAIC COMBINED WITH MERIS IMAGERY FOR CONTINENTAL SCALE LAND COVER MAPPING L. Durieux *, J. Kropáček *, G. D. De Grandi
Floating Ice: Progress in Addressing Science Goals
 Polar Floating Ice: Progress in Addressing Science Goals Stephen Howell 1, Leif Toudal Pedersen 2 and Roberto Saldo 3 1 Environment Canada, Climate Research Division, Toronto, Canada 2 Danish Meteorological
UPDATING THE MINNESOTA NATIONAL WETLAND INVENTORY
 UPDATING THE MINNESOTA NATIONAL WETLAND INVENTORY An Integrated Approach Using Object-Oriented Image Analysis, Human Air-Photo Interpretation and Machine Learning AARON SMITH EQUINOX ANALYTICS INC. FUNDING
Mapping Coastal Change Using LiDAR and Multispectral Imagery
 Mapping Coastal Change Using LiDAR and Multispectral Imagery Contributor: Patrick Collins, Technical Solutions Engineer Presented by TABLE OF CONTENTS Introduction... 1 Coastal Change... 1 Mapping Coastal
Biology. Slide 1 of 39. End Show. Copyright Pearson Prentice Hall
 Biology 1 of 39 4-2 What Shapes an Ecosystem? 2 of 39 Biotic and Abiotic Factors Biotic and Abiotic Factors Ecosystems are influenced by a combination of biological and physical factors. Biotic biological
Directed Reading. Section: Types of Maps
 Skills Worksheet Directed Reading Section: Types of Maps 1. What are some of the characteristics of an area shown on maps used by Earth scientists? a. types of animals, types of plants, types of minerals
IMPACTS OF A WARMING ARCTIC
 The Earth s Greenhouse Effect Most of the heat energy emitted from the surface is absorbed by greenhouse gases which radiate heat back down to warm the lower atmosphere and the surface. Increasing the
- World-wide cities are growing at a rate of 2% annually (UN 1999). - (60,3%) will reside in urban areas in 2030.
. - (60,3%) will reside in urban areas in 2030.") THE EFFECTIVENESS OF NEW TECHNOLOGIES FOR URBAN LAND MANAGEMENT BAHAAEDDINE I. AL HADDAD Centro de Política de Suelo y Valoraciones Universidad Politécnica de Cataluña Barcelona, España www.upc.es/cpsv
THE EFFECTIVENESS OF NEW TECHNOLOGIES FOR URBAN LAND MANAGEMENT BAHAAEDDINE I. AL HADDAD Centro de Política de Suelo y Valoraciones Universidad Politécnica de Cataluña Barcelona, España www.upc.es/cpsv
A Small Migrating Herd. Mapping Wildlife Distribution 1. Mapping Wildlife Distribution 2. Conservation & Reserve Management
 A Basic Introduction to Wildlife Mapping & Modeling ~~~~~~~~~~ Rev. Ronald J. Wasowski, C.S.C. Associate Professor of Environmental Science University of Portland Portland, Oregon 8 December 2015 Introduction
Combination of Microwave and Optical Remote Sensing in Land Cover Mapping
 Combination of Microwave and Optical Remote Sensing in Land Cover Mapping Key words: microwave and optical remote sensing; land cover; mapping. SUMMARY Land cover map mapping of various types use conventional
CHAPTER-7 INTERFEROMETRIC ANALYSIS OF SPACEBORNE ENVISAT-ASAR DATA FOR VEGETATION CLASSIFICATION
 147 CHAPTER-7 INTERFEROMETRIC ANALYSIS OF SPACEBORNE ENVISAT-ASAR DATA FOR VEGETATION CLASSIFICATION 7.1 INTRODUCTION: Interferometric synthetic aperture radar (InSAR) is a rapidly evolving SAR remote
Understanding the role of land cover / land use nexus in malaria transmission under changing socio-economic climate in Myanmar
 Annual Report for Year 1 June, 2017 January, 2018 NASA Land Cover Land Use Change Program Funded under grant # NNX17AI06G: Understanding the role of land cover / land use nexus in malaria transmission
Change Detection of Daghesorkh Playa Using Multi Temporal Datasets (Isfahan Province, Iran)
") J. Appl. Environ. Biol. Sci., 6(1)23-3, 216 216, TextRoad Publication ISSN: 29-4274 Journal of Applied Environmental and Biological Sciences www.textroad.com Change Detection of Daghesorkh Playa Using
J. Appl. Environ. Biol. Sci., 6(1)23-3, 216 216, TextRoad Publication ISSN: 29-4274 Journal of Applied Environmental and Biological Sciences www.textroad.com Change Detection of Daghesorkh Playa Using
HOW GEOGRAPHY AND GEOLOGY AFFECT BIOLOGICAL DIVERSITY
 HOW GEOGRAPHY AND GEOLOGY AFFECT BIOLOGICAL DIVERSITY Factors Affecting Extinction Rates Natural Factors Climate change Cataclysmic event (volcano, earthquake) Human Activities Habitat Loss/Fragmentation
IABP Deployment Plans for 2004
 IABP Buoy Positions IABP Deployment Plans for 2004 SPRING NPEO (Multiple buoys provided by NOAA/PMEL, JAMSTEC, & CRREL) EC/NIC- CES (80N 120W, & 80N 130W) SUMMER IARC/NABOS Cruise 2 NOAA-PSC IMB (North
A Service Architecture for Processing Big Earth Data in the Cloud with Geospatial Analytics and Machine Learning
 A Service Architecture for Processing Big Earth Data in the Cloud with Geospatial Analytics and Machine Learning WOLFGANG GLATZ & THOMAS BAHR 1 Abstract: The Geospatial Services Framework (GSF) brings
Land cover classification of QuickBird multispectral data with an object-oriented approach
 Land cover classification of QuickBird multispectral data with an object-oriented approach E. Tarantino Polytechnic University of Bari, Italy Abstract Recent satellite technologies have produced new data
AGOG 485/585 /APLN 533 Spring Lecture 5: MODIS land cover product (MCD12Q1). Additional sources of MODIS data
. Additional sources of MODIS data") AGOG 485/585 /APLN 533 Spring 2019 Lecture 5: MODIS land cover product (MCD12Q1). Additional sources of MODIS data Outline Current status of land cover products Overview of the MCD12Q1 algorithm Mapping
AGOG 485/585 /APLN 533 Spring 2019 Lecture 5: MODIS land cover product (MCD12Q1). Additional sources of MODIS data Outline Current status of land cover products Overview of the MCD12Q1 algorithm Mapping
Mapping Soils, Crops, and Rangelands by Machine Analysis of Multi-Temporal ERTS-1 Data
 Purdue University Purdue e-pubs LARS Technical Reports Laboratory for Applications of Remote Sensing 1-1-1973 Mapping Soils, Crops, and Rangelands by Machine Analysis of Multi-Temporal ERTS-1 Data M. F.
Terrestrial Climate Change Variables
 Terrestrial Climate Change Variables Content Terrestrial Climate Change Variables Surface Air Temperature Land Surface Temperature Sea Level Ice Level Aerosol Particles (acid rain) Terrestrial Climate
USING HYPERSPECTRAL IMAGERY
 USING HYPERSPECTRAL IMAGERY AND LIDAR DATA TO DETECT PLANT INVASIONS 2016 ESRI CANADA SCHOLARSHIP APPLICATION CURTIS CHANCE M.SC. CANDIDATE FACULTY OF FORESTRY UNIVERSITY OF BRITISH COLUMBIA CURTIS.CHANCE@ALUMNI.UBC.CA
Data Fusion and Multi-Resolution Data
 Data Fusion and Multi-Resolution Data Nature.com www.museevirtuel-virtualmuseum.ca www.srs.fs.usda.gov Meredith Gartner 3/7/14 Data fusion and multi-resolution data Dark and Bram MAUP and raster data Hilker
Landuse and Landcover change analysis in Selaiyur village, Tambaram taluk, Chennai
 Landuse and Landcover change analysis in Selaiyur village, Tambaram taluk, Chennai K. Ilayaraja Department of Civil Engineering BIST, Bharath University Selaiyur, Chennai 73 ABSTRACT The synoptic picture
CadasterENV Sweden Time series in support of a multi-purpose land cover mapping system at national scale
 CadasterENV Sweden Time series in support of a multi-purpose land cover mapping system at national scale Mats Rosengren, Camilla Jönsson ; Metria AB Marc Paganini ; ESA ESRIN Background CadasterENV Sweden
Once a specific data set is selected, NEO will list related data sets in the panel titled Matching Datasets, which is to the right of the image.
 NASA Earth Observations (NEO): A Brief Introduction NEO is a data visualization tool that allows users to explore a wealth of environmental data collected by NASA satellites. The satellites use an array
Unit 4 Lesson 1 What Are Populations, Habitats, and Niches? Copyright Houghton Mifflin Harcourt Publishing Company
 Unit 4 Lesson 1 What Are Populations, Habitats, and Niches? Question 1 Who Lives Where? ( living & non living) Who Lives Where? All living and nonliving things in an area and their interactions make up
Causes of Changes in Arctic Sea Ice
 Causes of Changes in Arctic Sea Ice Wieslaw Maslowski Naval Postgraduate School Outline 1. Rationale 2. Observational background 3. Modeling insights on Arctic change Pacific / Atlantic Water inflow 4.
Land Cover Classification Mapping & its uses for Planning
 Land Cover Classification Mapping & its uses for Planning What is Land Cover Classification Mapping? Examples of an actual product Why use Land Cover Classification Mapping for planning? Possible uses
URBAN LAND COVER AND LAND USE CLASSIFICATION USING HIGH SPATIAL RESOLUTION IMAGES AND SPATIAL METRICS
 URBAN LAND COVER AND LAND USE CLASSIFICATION USING HIGH SPATIAL RESOLUTION IMAGES AND SPATIAL METRICS Ivan Lizarazo Universidad Distrital, Department of Cadastral Engineering, Bogota, Colombia; ilizarazo@udistrital.edu.co
Yaneev Golombek, GISP. Merrick/McLaughlin. ESRI International User. July 9, Engineering Architecture Design-Build Surveying GeoSpatial Solutions
 Yaneev Golombek, GISP GIS July Presentation 9, 2013 for Merrick/McLaughlin Conference Water ESRI International User July 9, 2013 Engineering Architecture Design-Build Surveying GeoSpatial Solutions Purpose
The Lithosphere. The Lithosphere. The Earth Consists of Overlapping Layers:
 The Lithosphere Earth and Space Unit Continued The Earth Consists of Overlapping Layers: 1. Hydrosphere + Cryosphere 2. Atmosphere 3. Biosphere 4. Lithosphere The Lithosphere The lithosphere is the hard
Contemporary Data Collection and Spatial Information Management Techniques to support Good Land Policies
 Contemporary Data Collection and Spatial Information Management Techniques to support Good Land Policies Ch. Ioannidis Associate Professor FIG Commission 3 Workshop Paris, 25-28 October 2011 Introduction