Spatial variability of building frontal area index and its relationship with urban heat island intensity
|
|
|
- Archibald Nash
- 5 years ago
- Views:
Transcription


1 Spatial variability of building frontal area index and its relationship with urban heat island intensity Man Sing WONG, Janet NICHOL Department of Land Surveying and Geo-Informatic, The Hong Kong Polytechnic University
2 Urban wind ventilation Significant urban heat island effects resulting from high building densities have been observed in temperate and tropical regions Air flow between rural and urban areas is one of the parameters governing urban heat island formation and the build-up of pollution But, most of the data included in wind and air quality studies are from ground level instruments. The gathering of data over large regions such as a city therefore is a major challenge
3 Urban wind ventilation modeling Wind tunnel model Pros: model the local wind direction and pollutant dispersion at large scales over a district Cons: limited coverage, high cost PSU/NCAR mesoscale model (known as MM5) Pros: large area coverage Cons: at coarse resolution and it needs many input parameters Computational Fluid Dynamics (CFD) model Pros: over smaller areas in greater detail Cons: highly computer-intensive and generally inapplicable to large areas or whole cities Remote Sensing + Geographic Information Systems?
4 GIS ventilation modeling GIS techniques provide solutions with simplifying assumptions and numerical approximations GIS ventilation modelling at near surface condition can be simplified through the estimating of roughness parameters: Roughness is a measure of the texture of a surface, if the roughness is large, the wind is difficult to pass through zero-plane displacement height (z d ) and the roughness length (z 0 ) (Lettau, 1969; Counihan, 1975), plan area density (λ p ), frontal area index (λ f ) (Grimmond and Oke, 1999; Burian et al., 2002), average height weighted with frontal area (z h ), depth of the roughness sub-layer (z r ) (Bottema, 1997; Grimmond and Oke, 1999) and the effective height (h eff ) (Matzarakis and Mayer, 1992) etc
5 Objectives (i) To analysis the relationship between Frontal Area Index (FAI) and Urban Heat Island Intensity (UHII) at different scales, Definition of UHII: UHII = T a in city center T a in rural areas, where T a is air temperature (ii) To find the optimum operational scale and resolution of FAI, i.e. the scale and size at which it interacts most strongly with heat island intensity

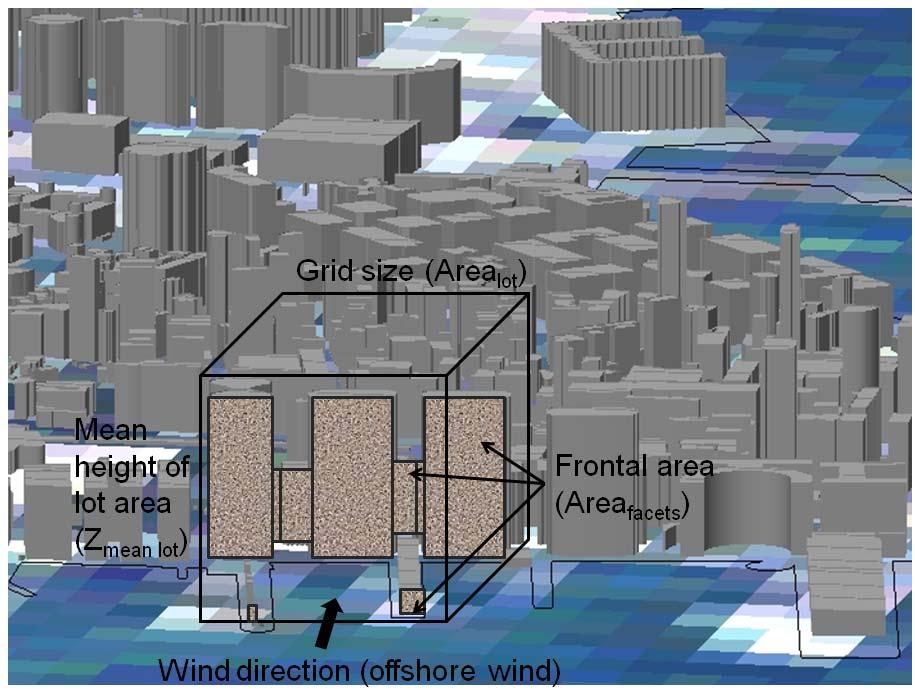
6 Calculation of Frontal Area Index Equation: λ f = A facets / A plane where λ f is the frontal area index, A facets is the total areas of building facets facing the wind direction, and A plane is the plane area A customized program was written in ESRI ArcGIS software The scale of the LIC building digital data is 1:5000
7


8 Frontal area index map Averaged λ f in eight directions over study area λ f =>0.9 means that wind is mostly blocked by buildings within a selected plane region λ f ~0.5 means that wind is half blocked High λ f values wall effect?
9 Frontal area index at different land use types Kowloon Peninsula have significantly high λ f cities, i.e. Los Angeles, Vancouver values than other countries and Commercial and industrial areas have higher values as compared to others, primary because these areas have densely high rise buildings


10 Calculation of frontal area index at different resolutions Study area Kowloon Peninsula a. b. Averaged frontal area index at eight different directions, a. at 40m resolution, b. at 400m resolution

 Frontal Area")
11 Calculation of frontal area index at different resolutions What is the appropriate Grid Size? Urban Heat Island Intensity (UHII) ASTER satellite image (winter night time) Frontal Area Index (FAI)
12 Calculation of frontal area index Grid size = 100m of plane area? Highest correlation r = (n = 4900)
13 Statistical tests of the appropriate resolution Mann Kendall test to examine whether there is a significant tendency/trend of increasing correlation between FAI and UHII when the resolution is degraded (from 40m to 400m, with interval of 20m) n-1 n S= sign(x -x ) j=1 i=j+1 1, if (xi-x j) > 0 sign(xi-x j)= 0,, if (xi-x j) = 0-1,, if (xi-x j) < 0 i j Z S-1 if S>0 Var(S) = 0 if S=0 S-1 if S<0 Var(S) where n is the number of observations (e.g. 19 resolutions in this study), x i and x j are two sequential data values (i.e. when x i = correlation at 60m, x j = correlation at 40m, when x i = correlation at 80m, x j = correlation at 60m) The Z value is used to test the presence/absence of the trend
14 Z = 0 when no trend is observed Results of statistical tests Significant level in hypothesis test (α ) Mann Kendall generated Z value Accept/Reject (90%) Reject (no significant trend) (95%) Reject (no significant trend) (99%) Reject (no significant trend) n (number of samples) 19 Hypothesis of having a significant tendency/trend from 40m to 400m resolution is rejected Imply that 100m resolution has the highest correlation between FAI and UHII

15 Applications 1. Identify and locate the ventilation paths across the Kowloon Peninsula using FAI and least cost path analysis

16 Applications 2. Investigate the impact of wall effect buildings on air ventilation within densely built districts
17 Least Cost Path Analysis Plots path of least resistance across a cost surface Grid cell value weighted by friction value according to degree of wind resistance 50 starting and ending points Many paths overlap high occurrence frequencies indicate important ventilation corridors


18 Application 1: Ventilation path East-west direction Left: Frontal area index map in east-west direction; Right: Occurrence frequency of ventilation paths in east-west direction (total number of paths is 2500) Red and purple colour represent high potential contribution of wind ventilation Orange and yellow represent moderate potential contribution of wind ventilation


19 Application 1: Ventilation path Northeast-southwest direction Left: Frontal area index map in northeast-southwest direction; Right: Occurrence frequency of ventilation paths in northeast-southwest direction (total number of paths is 5186)

20 Application 1: Ventilation path Validation strategy Oct


21 Application 1: Ventilation path Designated ventilation paths overlaid on heat island intensity image at 10m resolution Red and purple areas indicate the core regions of the urban heat island All four paths cross these core areas at the shortest distance


22 Application 2: Wall effect buildings Olympic city Union Square Harbor City Harbor Plaza

23 Application 2: Wall effect buildings Measure wind speeds to leeward of wall effect buildings facing the southeasterly winds Average and maximum wind speeds of 10.5ms -1 and 13.1ms -1 were observed to the windward of the buildings Leeward of the wall effect buildings and in inner areas was four times lower (~2.5ms -1 )

24 Application 2: Wall effect buildings Taken out the wall effect buildings (S 1, S 2, S 3, S 4 ), the λ f and the LCPs were regenerated for the westerly wind direction Removal of wall effect buildings has improved the ventilation in this inner district by 5% 16% 21% A new path provides fresh onshore air to the densely-built shopping and residential district of Tsim Sha Tsui
25 Conclusion This project studied spatial variability of building frontal area index and its relationship with urban heat island intensity, and it is a first ever study using remote sensing technique with GIS modeling (frontal area index) to (i) identify ventilation corridor and (ii) to investigate the impact of wall effect buildings on air ventilation within densely built districts The spatial resolution of 100m is found to be statistically significant and with highest correlation (r = 0.574) between FAI and UHII The optimal resolution 100m was able to explain 57.4% of the variance in the heat island intensity map Building area footprints and heights, sky view factor are the causes of Urban Heat Island Remaining 42.6% due to other factors e.g., variations in anthropogenic heat generated in the city and heat loss from different types of surface materials City planners and environmental authorities may use the derived models for pinpointing the key buildings which impede air flow to the urban core
26 Future Improvements 1. Considering the terrain elevation, since the study area is mainly flat This could be allocating a DEM value weighting to the λ f values in each cell 2. Considering different surfaces Since winds traversing a vegetated surface have a greater cooling capacity than those traversing impervious surfaces 3. Considering different weightings on different elevations of facets Ground level is more important than the tops of tall buildings, and a lower weight should be allocated to high level building facets
27 Thank you Contact: Dr Man Sing WONG Department of Land Surveying and Geo-Informatics, The Hong Kong Polytechnic University, Hong Kong Tel: (852)
Determining the Optimal Grid Size of Local Climate Zones for Spatial Mapping in High-density Cities
 Determining the Optimal Grid Size of Local Climate Zones for Spatial Mapping in High-density Cities Kevin Ka-Lun Lau, Chao Ren, Yuan Shi, Venessa Zheng,, Hong Kong Background Urbanization results in distinctive
ESTIMATION OF SURFACE ROUGHNESS LENGTH FOR URBAN LAND: A REVIEW
 ESTIMATION OF SURFACE ROUGHNESS LENGTH FOR URBAN LAND: A REVIEW Arasi Dobariya 1, Prof. Dr. N. S. Varandani 2, Prof. Huma Syed 3 1 M.E. Student, Department of environmental engineering, L.D College of
Improve Air Ventilation by Better Urban Planning
 Parametric Studies of Urban Morphologies of High Density Cities and Their Air Ventilation Performance under Neutral and Unstable Atmospheric Conditions Using Advanced Large-Eddy Simulations ICUC9, 20 th
Detection of ventilation paths using high-resolution roughness parameter mapping in a large urban area
 Building and Environment 44 (2009) 198 206 www.elsevier.com/locate/buildenv Detection of ventilation paths using high-resolution roughness parameter mapping in a large urban area T. Ga l, J. Unger Department
Application of GIS and Big Data to Assess Typhoon Impacts
 Application of GIS and Big Data to Assess Typhoon Impacts TECO Ha Noi, Viet Nam, 26 27 Feb 2018 YEUNG Hon-yin, PAN Chi-kin, TONG Yu-fai Introduction Weather forecasts told us how the weather might change
Analysis on Factors of Summer Temperature Distribution in the Basin City
 Analysis on Factors of Summer Temperature Distribution in the Basin City SHOHEI NOGUCHI 1, TAKAHIRO TANAKA 2, SATORU SADOHARA 3 1 Graduate School of Engineering, Hiroshima University, Higashihiroshima,
Remote Sensing of Urban Surface Temperatures
 Remote Sensing of Urban Surface Temperatures James Voogt University of Western Ontario London, Ontario, Canada This work is supported by the Natural Sciences and Engineering Research Council of Canada.
Wind velocity profile observations for roughness parameterization of real urban surfaces
 Wind velocity profile observations for roughness parameterization of real urban surfaces Jongyeon LIM, Ryozo OOKA, and Hideki KIKUMOTO Institute of Industrial Science The University of Tokyo Background:
Applications of GIS and Remote Sensing for Analysis of Urban Heat Island
 Chuanxin Zhu Professor Peter V. August Professor Yeqiao Wang NRS 509 December 15, 2016 Applications of GIS and Remote Sensing for Analysis of Urban Heat Island Since the last century, the global mean surface
Considerations of Urban Design and Microclimate in Historical Buildings Environment under Climate Change
 Considerations of Urban Design and Microclimate in Historical Buildings Environment under Climate Change Research team: Dr. Esther H.K. Yung, Mr. Z.N. Tan, Dr. C.K. Chau, Prof. Edwin, H.W. Chan Department
Urban micrometeorological flux observations and surface characterization State of art observational techniques and use of data in urban modeling"
 Urban micrometeorological flux observations and surface characterization State of art observational techniques and use of data in urban modeling" Sue Grimmond 1,2 1 Atmospheric Science Program, Geography,
The Road to Data in Baltimore
 Creating a parcel level database from high resolution imagery By Austin Troy and Weiqi Zhou University of Vermont, Rubenstein School of Natural Resources State and local planning agencies are increasingly
Modelling the Atmospheric Urban Heat Island and its Contributing Spatial Characteristics
 the Atmospheric Urban Heat Island and its Contributing Characteristics The Case of The Hague, the Netherlands Anna-Maria Ntarladima Alexander Wandl Hugo Ledoux 02/11/2016 Urban Heat Island (UHI) is a phenomenon
Applying "Local Climate Zone (LCZ)" into a High-density High-rise Cities - A Pilot Study in Hong Kong
 into a High-density High-rise Cities - A Pilot Study in Hong Kong") Applying "Local Climate Zone (LCZ)" into a High-density High-rise Cities - A Pilot Study in Hong Kong Chao REN Yingsheng ZHENG 1, Chao REN 1,2 *, Yuan SHI 1, Kevin Ka-Lun LAU 1, Steve Hung Lam YIM 3,4,Derrick
Applying "Local Climate Zone (LCZ)" into a High-density High-rise Cities - A Pilot Study in Hong Kong Chao REN Yingsheng ZHENG 1, Chao REN 1,2 *, Yuan SHI 1, Kevin Ka-Lun LAU 1, Steve Hung Lam YIM 3,4,Derrick
GIS in Planning, Engineering and Environmental Applications
 GIS in Planning, Engineering and Environmental Applications Herman Ng & Eric Yau November 24, 2010 GIS for Planning Herman Ng How GIS can be made useful to Planning? GIS for Planning Herman Ng Planning
Modelling the Atmospheric Urban Heat Island and its Contributing Spatial Characteristics
 the Atmospheric Urban Heat Island and its Contributing Characteristics The Case of The Hague, the Netherlands Anna-Maria Ntarladima 07/11/2016 Urban Heat Island (UHI) is a phenomenon in which a city forms
J17.3 Impact Assessment on Local Meteorology due to the Land Use Changes During Urban Development in Seoul
 J17.3 Impact Assessment on Local Meteorology due to the Land Use Changes During Urban Development in Seoul Hae-Jung Koo *, Kyu Rang Kim, Young-Jean Choi, Tae Heon Kwon, Yeon-Hee Kim, and Chee-Young Choi
MODELING URBAN THERMAL ANISOTROPY
 MODELING URBAN THERMAL ANISOTROPY J. A. Voogt a, *, E. S. Krayenhoff a a Department of Geography, University of Western Ontario, London ON N6A 5C2 Canada -javoogt@uwo.ca KEY WORDS: surface temperature,
Kimberly J. Mueller Risk Management Solutions, Newark, CA. Dr. Auguste Boissonade Risk Management Solutions, Newark, CA
 1.3 The Utility of Surface Roughness Datasets in the Modeling of United States Hurricane Property Losses Kimberly J. Mueller Risk Management Solutions, Newark, CA Dr. Auguste Boissonade Risk Management
330: Daytime urban heat island intensity in London during the winter season
 330: Daytime urban heat island intensity in London during the winter season Giridharan Renganathan Brunel University Abstract This paper will present results of the daytime urban heat island intensity
Class 9. Query, Measurement & Transformation; Spatial Buffers; Descriptive Summary, Design & Inference
 Class 9 Query, Measurement & Transformation; Spatial Buffers; Descriptive Summary, Design & Inference Spatial Analysis Turns raw data into useful information by adding greater informative content and value
Combined GIS, CFD and Neural Network Multi-Zone Model for Urban Planning and Building Simulation. Methods
 Combined GIS, CFD and Neural Network Multi-Zone Model for Urban Planning and Building Simulation Meng Kong 1, Mingshi Yu 2, Ning Liu 1, Peng Gao 2, Yanzhi Wang 1, Jianshun Zhang 1 1 School of Engineering
GENERAL EDUCATION AND TRAINING SOCIAL SCIENCES
 GENERAL EDUCATION AND TRAINING SOCIAL SCIENCES GEOGRAPHY PAPER 1 FINAL EXAMINATION NOVEMBER 2014 GRADE 8 MARKS: 50 DURATION : 1 HOUR SOCIAL SCIENCES GEOGRAPHY GRADE 8 NOVEMBER 2014 TIME: 90 MINUTES TOTAL:
INVESTIGATION FOR A POSSIBLE INFLUENCE OF IOANNINA AND METSOVO LAKES (EPIRUS, NW GREECE), ON PRECIPITATION, DURING THE WARM PERIOD OF THE YEAR
, ON PRECIPITATION, DURING THE WARM PERIOD OF THE YEAR") Proceedings of the 13 th International Conference of Environmental Science and Technology Athens, Greece, 5-7 September 2013 INVESTIGATION FOR A POSSIBLE INFLUENCE OF IOANNINA AND METSOVO LAKES (EPIRUS,
Proceedings of the 13 th International Conference of Environmental Science and Technology Athens, Greece, 5-7 September 2013 INVESTIGATION FOR A POSSIBLE INFLUENCE OF IOANNINA AND METSOVO LAKES (EPIRUS,
Welcome to NR502 GIS Applications in Natural Resources. You can take this course for 1 or 2 credits. There is also an option for 3 credits.
 Welcome to NR502 GIS Applications in Natural Resources. You can take this course for 1 or 2 credits. There is also an option for 3 credits. The 1st credit consists of a series of readings, demonstration,
International Journal of Advance Research in Engineering, Science & Technology
 Impact Factor (SJIF): 3.632 International Journal of Advance Research in Engineering, Science & Technology e-issn: 2393-9877, p-issn: 2394-2444 Volume 3, Issue 7, July-2016 Water Supply Network Study of
Map Skills and Geographic Tools
 Name: Period: Map Skills and Geographic Tools TEKS: 8.9C interpret topographic maps and satellite views to identify land and erosional features and predict how these features may be reshaped by weathering
Urban Microclimate Scale CFD Simulation
 Urban Microclimate Scale CFD Simulation 2016 CAD-IT ANSYS Convergence - Singapore Daniel HII Jun Chung PhD Candidate, Department of Building, School of Design & Environment, NUS dhjc@u.nus.edu Prof. WONG
Investigating the urban climate characteristics of two Hungarian cities with SURFEX/TEB land surface model
 Investigating the urban climate characteristics of two Hungarian cities with SURFEX/TEB land surface model Gabriella Zsebeházi Gabriella Zsebeházi and Gabriella Szépszó Hungarian Meteorological Service,
DEPENDENCE OF URBAN TEMPERATURE ELEVATION ON LAND COVER TYPES. Ping CHEN, Soo Chin LIEW and Leong Keong KWOH
 DEPENDENCE OF URBAN TEMPERATURE ELEVATION ON LAND COVER TYPES Ping CHEN, Soo Chin LIEW and Leong Keong KWOH Centre for Remote Imaging, Sensing and Processing, National University of Singapore, Lower Kent
Abstract: Introduction: 10 th ESRI India User Conference 2009 Geography in Action
 Mitigation of Thermal Pollution to enhance urban air quality through Remote Sensing and GIS Anshu Gupta, Lecturer, Centre of Remote Sensing and GIS, MANIT, Bhopal, E- mail: anshugupta20002001@gmail.com
Application of high-resolution (10 m) DEM on Flood Disaster in 3D-GIS
 DEM on Flood Disaster in 3D-GIS") Risk Analysis V: Simulation and Hazard Mitigation 263 Application of high-resolution (10 m) DEM on Flood Disaster in 3D-GIS M. Mori Department of Information and Computer Science, Kinki University, Japan
Risk Analysis V: Simulation and Hazard Mitigation 263 Application of high-resolution (10 m) DEM on Flood Disaster in 3D-GIS M. Mori Department of Information and Computer Science, Kinki University, Japan
Building Energy Demand under Urban Climate and Climate Change conditions with consideration of Urban Morphology and Building Typology
 Building Energy Demand under Urban Climate and Climate Change conditions with consideration of Urban Morphology and Building Typology - GIS Mapping of the City of Stuttgart Limei Ji Fazia Ali-Toudert 1,
Modeling of Atmospheric Effects on InSAR Measurements With the Method of Stochastic Simulation
 Modeling of Atmospheric Effects on InSAR Measurements With the Method of Stochastic Simulation Z. W. LI, X. L. DING Department of Land Surveying and Geo-Informatics, Hong Kong Polytechnic University, Hung
Soil Erosion Calculation using Remote Sensing and GIS in Río Grande de Arecibo Watershed, Puerto Rico
 Soil Erosion Calculation using Remote Sensing and GIS in Río Grande de Arecibo Watershed, Puerto Rico Alejandra M. Rojas González Department of Civil Engineering University of Puerto Rico at Mayaguez.
International Journal of Intellectual Advancements and Research in Engineering Computations
 ISSN:2348-2079 Volume-5 Issue-2 International Journal of Intellectual Advancements and Research in Engineering Computations Agricultural land investigation and change detection in Coimbatore district by
Geometric Algorithms in GIS
 Geometric Algorithms in GIS GIS Visualization Software Dr. M. Gavrilova GIS Software for Visualization ArcView GEO/SQL Digital Atmosphere AutoDesk Visual_Data GeoMedia GeoExpress CAVE? Visualization in
Summary Description Municipality of Anchorage. Anchorage Coastal Resource Atlas Project
 Summary Description Municipality of Anchorage Anchorage Coastal Resource Atlas Project By: Thede Tobish, MOA Planner; and Charlie Barnwell, MOA GIS Manager Introduction Local governments often struggle
Landscape and Urban Planning
 Landscape and Urban Planning 101 (2011) 59 74 Contents lists available at ScienceDirect Landscape and Urban Planning journal homepage: www.elsevier.com/locate/landurbplan Improving the wind environment
Quantifying the influence of wind advection on the urban heat island for an improvement of a climate change adaptation planning tool
 Quantifying the influence of wind advection on the urban heat island for an improvement of a climate change adaptation planning tool BEAR conference 15/12/2014 Bassett R., Cai X., Chapman L., Heaviside
CORRELATION BETWEEN URBAN HEAT ISLAND EFFECT AND THE THERMAL INERTIA USING ASTER DATA IN BEIJING, CHINA
 CORRELATION BETWEEN URBAN HEAT ISLAND EFFECT AND THE THERMAL INERTIA USING ASTER DATA IN BEIJING, CHINA Yurong CHEN a, *, Mingyi DU a, Rentao DONG b a School of Geomatics and Urban Information, Beijing
Investigation of the Effect of Transportation Network on Urban Growth by Using Satellite Images and Geographic Information Systems
 Presented at the FIG Congress 2018, May 6-11, 2018 in Istanbul, Turkey Investigation of the Effect of Transportation Network on Urban Growth by Using Satellite Images and Geographic Information Systems
A GIS approach to generation of thematic maps to monitor tea plantations: A case study
 Two and a Bud 59(2):41-45, 2012 RESEARCH PAPER. A GIS approach to generation of thematic maps to monitor tea plantations: A case study Minerva Saiki a I and R.M. Bhagat Department of Soils, Tocklai Experimental
Prototype Heat Island Application
 CHAM Limited Pioneering CFD Software for Education & Industry Prototype Heat Island Application PHOENICS-2011 Introduction Heat islands are large-scale phenomena in which the general urban temperature
The impact of urban geometry on the radiant environment in outdoor spaces
 ICUC9 9 th International Conference on Urban Climate 20 th -24 th July 2015, Toulouse, France The impact of urban geometry on the radiant environment in outdoor spaces Christina Chatzipoulka*, Marialena
New applications using real-time observations and ECMWF model data
 New applications using real-time observations and ECMWF model data 12 th Workshop on Meteorological Operational Systems Wim van den Berg [senior meteorological researcher, project coordinator] Overview
Exploiting Earth Observation data products for mapping Local Climate Zones
 Exploiting Earth Observation data products for mapping Local Climate Zones Zina Mitraka 1,3, Nektarios Chrysoulakis 1, Jean Philippe Gastellu-Etchegorry 2, Fabio Del Frate 3,4 1 Foundation for Research
World geography 3200/3202 Unit 2 review
 World geography 3200/3202 Unit 2 review 1. Does this statement use the terms revolve & rotate correctly? "Saturn revolves on its axis while several moons rotate around it." 2. Does this statement use the
VILLAGE INFORMATION SYSTEM (V.I.S) FOR WATERSHED MANAGEMENT IN THE NORTH AHMADNAGAR DISTRICT, MAHARASHTRA
 FOR WATERSHED MANAGEMENT IN THE NORTH AHMADNAGAR DISTRICT, MAHARASHTRA") VILLAGE INFORMATION SYSTEM (V.I.S) FOR WATERSHED MANAGEMENT IN THE NORTH AHMADNAGAR DISTRICT, MAHARASHTRA Abstract: The drought prone zone in the Western Maharashtra is not in position to achieve the agricultural
VILLAGE INFORMATION SYSTEM (V.I.S) FOR WATERSHED MANAGEMENT IN THE NORTH AHMADNAGAR DISTRICT, MAHARASHTRA Abstract: The drought prone zone in the Western Maharashtra is not in position to achieve the agricultural
P1.17 Super-high-resolution Numerical Simulation of Atmospheric Turbulence in an Area of Complex Terrain
 P1.17 Super-high-resolution Numerical Simulation of Atmospheric Turbulence in an Area of Complex Terrain P.W. Chan * Hong Kong Observatory, Hong Kong, China 1. INTRODUCTION Turbulent airflow occurs at
LOOKING FOR THE RELATIONSHIP BETWEEN SPRAWL AND WATER QUALITY: A CASE STUDY OF GLOUCESTER COUNTY, NJ
 Middle States Geographer, 2006, 39:26-33 LOOKING FOR THE RELATIONSHIP BETWEEN SPRAWL AND WATER QUALITY: A CASE STUDY OF GLOUCESTER COUNTY, NJ Donna Moffett 1 and John Hasse 2 1 Department of Earth and
ISSUED BY KENDRIYA VIDYALAYA - DOWNLOADED FROM
 CHAPTER -11 WATER IN THE ATMOSPHERE This chapter deals with Humidity, types of humidity, relative humidity, absolute humidity, specific humidity, dew point, condensation, saturated air, types of precipitation
IMPACT OF URBAN EVOLUTION ON LAND-USE CHANGE OF SARGODHA CITY, PAKISTAN
 Impact of Urban Evolution on Land-Use Change of Sargodha City in Pakistan J. Sc. & Tech. Univ. Peshawar, 2015, 39 (2), 29-36. IMPACT OF URBAN EVOLUTION ON LAND-USE CHANGE OF SARGODHA CITY, PAKISTAN SAJJAD
Abstract. 1 Introduction
 Nested dispersion simulation over the Lisbon region R. Kunz,* M. Coutinho,^ C. Borrego^ N. Moussiopoulos' "Institute for Technical Thermodynamics, University of Karlsruhe, 76128 Karlsruhe, Germany ^Department
Future Cities and Environment
 Bourikas et al. Future Cities and Environment (2016) 2:7 DOI 10.1186/s40984-016-0020-4 Future Cities and Environment TECHNICAL ARTICLE Transforming typical hourly simulation weather data files to represent
DATA APPLIANCE FOR ARCGIS
 DATA APPLIANCE FOR ARCGIS Data Appliance for ArcGIS Provides Access to Multi-Scale Basemaps Down to Medium Scale Levels Worldwide And Large Scale for Most of the World The Data Appliance includes Several
Public Transportation Infrastructure Study (PTIS) - 2 nd Technical Advisory Committee Meeting
 - 2 nd Technical Advisory Committee Meeting") Public Transportation Infrastructure Study (PTIS) - 2 nd Technical Advisory Committee Meeting Presentation to: Technical Advisory Committee (TAC) Presented by: and Team July 8th, 2009 Public Transportation
Public Transportation Infrastructure Study (PTIS) - 2 nd Technical Advisory Committee Meeting Presentation to: Technical Advisory Committee (TAC) Presented by: and Team July 8th, 2009 Public Transportation
FLOOD HAZARD MAPPING OF DHAKA-NARAYANGANJ-DEMRA (DND) PROJECT USING GEO-INFORMATICS TOOLS
 PROJECT USING GEO-INFORMATICS TOOLS") FLOOD HAZARD MAPPING OF DHAKA-NARAYANGANJ-DEMRA (DND) PROJECT USING GEO-INFORMATICS TOOLS Md. Aminul Islam MEE07178 Supervisor: Prof. Kuniyoshi TAKEUCHI ABSTRACT Dhaka-Narayanganj-Demra (DND) Project is
FLOOD HAZARD MAPPING OF DHAKA-NARAYANGANJ-DEMRA (DND) PROJECT USING GEO-INFORMATICS TOOLS Md. Aminul Islam MEE07178 Supervisor: Prof. Kuniyoshi TAKEUCHI ABSTRACT Dhaka-Narayanganj-Demra (DND) Project is
Parts of a Map. Map Skills. The Title. There are 4 main parts of a map: The Title The Compass Rose The Map Key The Scale
 Map Skills Parts of a Map There are 4 main parts of a map: The Title The Compass Rose The Map Key The Scale The Title The title of the map is usually at the top and describes the topic of the map Example:
DEVELOPMENT OF FLOOD HAZARD VULNERABILITY MAP FOR ALAPPUZHA DISTRICT
 DEVELOPMENT OF FLOOD HAZARD VULNERABILITY MAP FOR ALAPPUZHA DISTRICT Ciya Maria Roy 1, Elsa Manoj 2, Harsha Joy 3, Sarin Ravi 4, Abhinanda Roy 5 1,2,3,4 U.G. Student, Department of Civil Engineering, MITS
The AIR Tropical Cyclone Model for India
 The AIR Tropical Cyclone Model for India Tropical cyclones have caused millions, and even billions, of dollars in damage in India. The growing number of properties on the coast, together with growing insurance
Physical Geography of the United States and Canada Chapter 5 A Land of Contrasts
 Physical Geography of the United States and Canada Chapter 5 A Land of Contrasts Land Area Together the U.S. and Canada cover more than 7 million square miles. In total area, Canada ranks 2 nd and the
GRASS COVER CHANGE MODEL BASED ON CELLULAR AUTOMATA
 GRASS COVER CHANGE MODEL BASED ON CELLULAR AUTOMATA Shuai Zhang *, Jingyin Zhao, Linyi Li Digital Agricultural Engineering Technological Research Center, Shanghai Academy of Agricultural Sciences, Shanghai,
How Researchers Measure Urban Heat Islands. James Voogt Department of Geography, University of Western Ontario London ON Canada
 How Researchers Measure Urban Heat Islands James Voogt Department of Geography, University of Western Ontario London ON Canada Outline What is the urban heat island? What types of urban heat islands exist?
SPATIAL CHARACTERISTICS OF THE SURFACE CIRCULATION AND WAVE CLIMATE USING HIGH-FREQUENCY RADAR
 SPATIAL CHARACTERISTICS OF THE SURFACE CIRCULATION AND WAVE CLIMATE USING HIGH-FREQUENCY RADAR Apisit Kongprom,Siriluk Prukpitikul, Varatip Buakaew, Watchara Kesdech, and Teerawat Suwanlertcharoen Geo-Informatics
Map Skills Unit. Note taking unit
 Map Skills Unit Note taking unit Introduction To learn about the Earth, we are going to learn about two geographic tools you can use.globes and maps. Globe A globe is a round model of the planet Earth
Urban boundary layer modeling and infrastructure issues. Jason Ching
 Joint Region 10 + States Meeting NW AIRQUEST Annual and MM5 Consortium meeting Seattle, Washington October 23-25, 2007 Urban boundary layer modeling and infrastructure issues Jason Ching ARL/NOAA NERL/USEPA
ANALYSIS OF VEGETATION DISTRIBUTION IN URBAN AREAS: SPATIAL ANALYSIS APPROACH ON A REGIONAL SCALE
 ANALYSIS OF VEGETATION DISTRIBUTION IN URBAN AREAS: SPATIAL ANALYSIS APPROACH ON A REGIONAL SCALE Kiichiro Kumagai Department of Civil and Environmental System Engineering, Setsunan University 17-8 Ikedanakamachi,
Pipeline Routing Using Geospatial Information System Analysis
 Pipeline Routing Using Geospatial Information System Analysis Mahmoud Reza 1 Delavar and Fereydoon 2 Naghibi 1-Assistance Professor, Dept. of Surveying and Geomatic Eng., Eng. Faculty, University of Tehran,
8/28/2011. Contents. Lecture 1: Introduction to GIS. Dr. Bo Wu Learning Outcomes. Map A Geographic Language.
 Contents Lecture 1: Introduction to GIS Dr. Bo Wu lsbowu@polyu.edu.hk Department of Land Surveying & Geo-Informatics The Hong Kong Polytechnic University 1. Learning outcomes 2. GIS definition 3. GIS examples
Can Grid and TIN coexist?
 Can Grid and TIN coexist? Weidong Zhao, Jitang Zhao, Lei Ma, Wan Zhou, Jian Tian, Jiazhong Qian School of Resources and Environment Engineering, Hefei University of Technology, No. 193 Tunxi Road, Hefei
10/13/2011. Introduction. Introduction to GPS and GIS Workshop. Schedule. What We Will Cover
 Introduction Introduction to GPS and GIS Workshop Institute for Social and Environmental Research Nepal October 13 October 15, 2011 Alex Zvoleff azvoleff@mail.sdsu.edu http://rohan.sdsu.edu/~zvoleff Instructor:
CORRELATION OF PADDY FIELD FOR LAND BOUNDARY RECORD
 CORRELATION OF PADDY FIELD FOR LAND BOUNDARY RECORD, Hong Kong Key words: District Sheet, correlation, land boundary record, paddy field SUMMARY Land boundary rights are legally documented in land leases
URBAN CHANGE DETECTION OF LAHORE (PAKISTAN) USING A TIME SERIES OF SATELLITE IMAGES SINCE 1972
 USING A TIME SERIES OF SATELLITE IMAGES SINCE 1972") URBAN CHANGE DETECTION OF LAHORE (PAKISTAN) USING A TIME SERIES OF SATELLITE IMAGES SINCE 1972 Omar Riaz Department of Earth Sciences, University of Sargodha, Sargodha, PAKISTAN. omarriazpk@gmail.com ABSTRACT
URBAN CHANGE DETECTION OF LAHORE (PAKISTAN) USING A TIME SERIES OF SATELLITE IMAGES SINCE 1972 Omar Riaz Department of Earth Sciences, University of Sargodha, Sargodha, PAKISTAN. omarriazpk@gmail.com ABSTRACT
2.5A A STUDY OF THE OKLAHOMA CITY URBAN HEAT ISLAND USING GROUND MEASUREMENTS AND REMOTE SENSING
 2.5A A STUDY OF THE OKLAHOMA CITY URBAN HEAT ISLAND USING GROUND MEASUREMENTS AND REMOTE SENSING * Michael J. Brown 1, Austin Ivey 1, Timothy N. McPherson 1, David Boswell 1, Eric R. Pardyjak 2 1 Los Alamos
Mapping the Urban Farming in Chinese Cities:
 Submission to EDC Student of the Year Award 2015 A old female is cultivating the a public green space in the residential community(xiaoqu in Chinese characters) Source:baidu.com 2015. Mapping the Urban
Geographic Grid -Latitudes and Longitudes
 GEOGRAPHY STD 9 Geographic Grid -Latitudes and Longitudes 2018-2019 Q1. Define Geographic Grid. The network of latitudes and longitudes are known as Geographic Grid. They help us to locate places on the
FLOOD HAZARD AND RISK ASSESSMENT IN MID- EASTERN PART OF DHAKA, BANGLADESH
 FLOOD HAZARD AND RISK ASSESSMENT IN MID- EASTERN PART OF DHAKA, BANGLADESH Muhammad MASOOD MEE07180 Supervisor: Prof. Kuniyoshi TAKEUCHI ABSTRACT An inundation simulation has been done for the mid-eastern
Hydrology and Floodplain Analysis, Chapter 10
 Hydrology and Floodplain Analysis, Chapter 10 Hydrology and Floodplain Analysis, Chapter 10.1 Introduction to GIS GIS Geographical Information System Spatial Data Data linked with geographical location
R E SEARCH HIGHLIGHTS
 Canada Research Chair in Urban Change and Adaptation R E SEARCH HIGHLIGHTS PANHANDLING IN WINNIPEG PROJECT: MAPPING METHODOLOGY Research Highlight No. 11 June 2007 Introduction The general methodology
GIS for 3D Object Generation, Modelling, and Exploitation. Paul Hardy Esri
 GIS for 3D Object Generation, Modelling, and Exploitation Paul Hardy Esri ArcGIS has long understood 3D Multipatch data type in geodatabase - 3D volumetric objects - Collection of triangles, strips, fans,
MAPPING LAND USE/ LAND COVER OF WEST GODAVARI DISTRICT USING NDVI TECHNIQUES AND GIS Anusha. B 1, Sridhar. P 2
 MAPPING LAND USE/ LAND COVER OF WEST GODAVARI DISTRICT USING NDVI TECHNIQUES AND GIS Anusha. B 1, Sridhar. P 2 1 M. Tech. Student, Department of Geoinformatics, SVECW, Bhimavaram, A.P, India 2 Assistant
Tropical Climates Zone
 Tropical Climates Zone RAIN FOREST CENTRAL AFRICA, SOUTH AMERICA (AMAZON), CENTRAL AMERICA, S.E. ASIA HUMID/WARM ANNUAL RAINFALL 200 CM TYPE #1: TROPICAL DESERT N. AFRICA (SAHARA) & S.W. ASIA < 25 CM
The Atmosphere and Atmospheric Energy Chapter 3 and 4
 The Atmosphere and Atmospheric Energy Chapter 3 and 4 Size of the Earth s Atmosphere Atmosphere produced over 4.6 billion years of development Protects us from radiation Completely surrounds the earth
LES of wind turbulence and heat environment around dense tall buildings
 EACWE 5 Florence, Italy 19 th 23 rd July 2009 LES of wind turbulence and heat environment around dense tall buildings Flying Sphere image Museo Ideale L. Da Vinci Tsuyoshi Nozu 1, Takeshi Kishida 2, Tetsuro
Crowdsourcing approach for large scale mapping of built-up land
 Crowdsourcing approach for large scale mapping of built-up land Kavinda Gunasekara Kavinda@ait.asia Geoinformatics Center Asian Institute of Technology, Thailand. Regional expert workshop on land accounting
Summer air temperature distribution and thermal environment in urban areas of Japan
 ATMOSPHERIC SCIENCE LETTERS Atmos. Sci. Let. 9: 209 213 (2008) Published online 16 June 2008 in Wiley InterScience (www.interscience.wiley.com).189 Summer air temperature distribution and thermal environment
RELATION OF SURROUNDING BUILDING CONFIGURATION AND MITIGATION EFFECTS OF SCHOOL LAWN PLANTING
 RELATION OF SURROUNDING BUILDING CONFIGURATION AND MITIGATION EFFECTS OF SCHOOL LAWN PLANTING Takayuki Harada 1, Noriko Umemiya 1, Yuta Sakurai 1, Ryota Matsui 1, Ryohei Kawamoto 1, Toshiki Naotuka 1,Yumi
Terrain Analysis through Maps.
 Terrain Analysis through Maps Need for Maps Theodolite Every Inch on Earth is Measured Maps are Prepared based on these Measurements Classification of Maps Function Scale Physical (Natural Features)
GEOGRAPHY STD.9 LATITUDE & LONGITUDE
 GEOGRAPHY STD.9 LATITUDE & LONGITUDE 1. What is the Earth Grid? A. The complete network of meridians & parallels is called the earth Grid. 2. What is Latitude? A. The latitude of a place is the distance
GIS for the Non-Expert
 GIS for the Non-Expert Ann Forsyth University of Minnesota February 2006 GIS for the Non-Expert 1. Definitions and problems 2. Measures being tested in Twin Cities Walking Study Basic approach, data, variables
NR402 GIS Applications in Natural Resources
 NR402 GIS Applications in Natural Resources Lesson 1 Introduction to GIS Eva Strand, University of Idaho Map of the Pacific Northwest from http://www.or.blm.gov/gis/ Welcome to NR402 GIS Applications in
Software for Landuse Management: Modelling with GIS
 O. R. SODEINDE, Nigeria Key words: ABSTRACT Land use management has been a very important issue in the planning and maintenance of environmental and economic development of a geographic area. Therefore,
BROADBAND DEMAND AGGREGATION: PLANNING BROADBAND IN RURAL NORTHERN CALIFORNIA
 BROADBAND DEMAND AGGREGATION: PLANNING BROADBAND IN RURAL NORTHERN CALIFORNIA Steven J. Steinberg, Ph.D a,b, *, Rebecca Degagne a, M.S., Michael Gough a a Institute for Spatial Analysis, Humboldt State
ANALYSIS OF URBAN PLANNING IN ISA TOWN USING GEOGRAPHIC INFORMATION SYSTEMS TECHNIQUES
 ANALYSIS OF URBAN PLANNING IN ISA TOWN USING GEOGRAPHIC INFORMATION SYSTEMS TECHNIQUES Lamya HAIDER, Prof. Mohamed AIT BELAID (*) Corre, and Dr. Anwar S. Khalil Arabian Gulf University (AGU), College of
6. State two factors and explain how each influences the weather in Ohio. Respond in the space provided in your Answer Document.
 6. State two factors and explain how each influences the weather in Ohio. Respond in the space provided in your Answer Document. (4 points) Sample Response for Item 6 (Extended Response): Other Correct
Mapping and Spatial Characterisation of Major Urban Centres in Parts of South Eastern Nigeria with Nigeriasat-1 Imagery
 Mapping and Spatial Characterisation of Major Urban Centres in Parts of South Eastern Nigeria with Joel I. IGBOKWE, Nigeria Key words: Urban Planning, Urban growth, Urban Infrastructure, Landuse, Satellite
CHARACTERIZATION OF SOLAR ACCESS IN MEDITERRANEAN CITIES: ORIENTED SKY FACTOR
 CHARACTERIZATION OF SOLAR ACCESS IN MEDITERRANEAN CITIES: ORIENTED SKY FACTOR Garcia-Nevado, Elena School of Architecture of Barcelona elena.garcia.nevado@upc.edu Pagès-Ramon, Anna School of Architecture
STEREO ANALYST FOR ERDAS IMAGINE Stereo Feature Collection for the GIS Professional
 STEREO ANALYST FOR ERDAS IMAGINE Stereo Feature Collection for the GIS Professional STEREO ANALYST FOR ERDAS IMAGINE Has Your GIS Gone Flat? Hexagon Geospatial takes three-dimensional geographic imaging
EVALUATION OF VENTILATION PERFORMANCE IN VOID SPACE BY EXCEEDANCE PROBABILITIES BASED ON CFD SIMULATION
 EVALUATION OF VENTILATION PERFORMANCE IN VOID SPACE BY EXCEEDANCE PROBABILITIES BASED ON CFD SIMULATION Zhen BU 1, Shinsuke KATO 2, Yoshihiro ISHIDA 2, and Hong HUANG 2 1 Graduate School of Engineering,