NASA MODIS and VIIRS Burned Area Products Update
|
|
|
- Maud Wells
- 5 years ago
- Views:
Transcription
1 NASA MODIS and VIIRS Burned Area Products Update Louis Giglio, Luigi Michael Humber, William Walsh, David Roy, Christopher JusIce GOFC Fire Implementa0on Team Mee0ng November 2016
2 MODIS Burned Area Products MODIS CollecIons 5 and 5.1 MCD45A1 MCD45A1- based GIS Products (SCF) MCD64A1 (SCF) 500- m Monthly Shapefiles m GeoTIFF 500- m Monthly MODIS CollecIon 6 MCD64A1 MCD64A1- based GIS Products (SCF) MCD64CMQ (SCF) MCD64CDQ (SCF) 500- m Monthly Shapefiles m GeoTIFF 0.25 Monthly 0.25 Daily
3 MODIS C6 BA Product Status C6 MCD64A1 operaional producion began five days ago Public release January 2017
4 July 2002 MCD64A1 Global Browse h[p://landweb.nascom.nasa.gov/cgi- bin/browse/browsemodis.cgi

5 December 2003 MCD64A1 Global Browse h[p://landweb.nascom.nasa.gov/cgi- bin/browse/browsemodis.cgi
6 C6 MCD64A1 Improvements C6 input data 10- day 8- day averaging window Final contextual relabeling phase now guided by neighbor staisics derived from training sample used for spectral classificaion True small burns much less likely to be discarded No region growing in cropland Many smaller tweaks and refinements


7 DAILY SURFACE REFLECTANCE! DAILY ACTIVE FIRE MASKS! C6 MCD64 Algorithm TEMPORAL COMPOSITES ΔVI*, VI* post S*, t*, t f IQR* pre, IQR* post change summaries TEMPORAL TEXTURE! TRAINING MASK primary role of acive fire map CONDITIONAL PDFs SPATIAL PRIORS p(n b N B) LAND COVER INITIAL CLASSIFICATION CONTEXTUAL FILTER BURN MAP
8 MODIS C6 Burned Area Early Results Overall increase in burned area ~25% globally
9
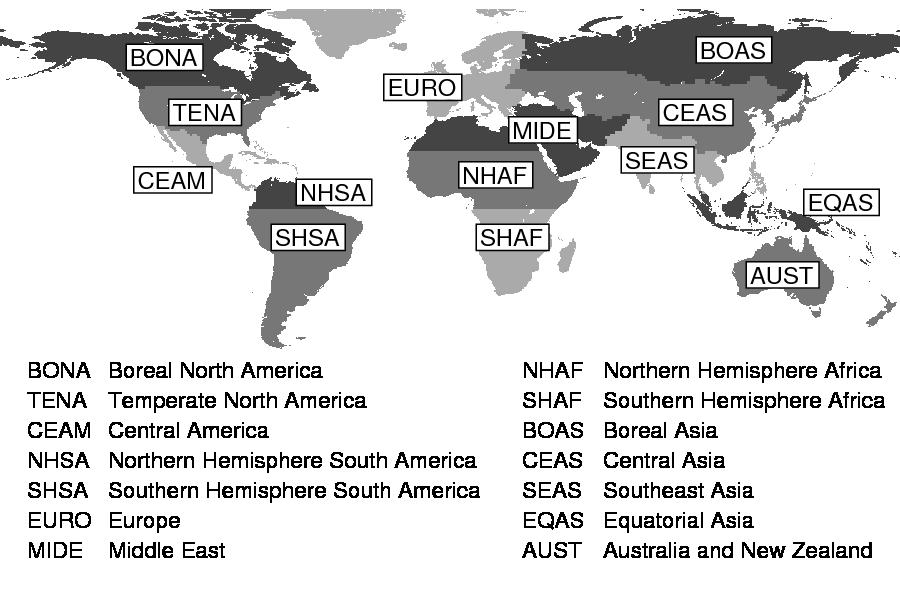
10 MCD64A Regional 2007 Burned Area Totals ( 10 4 km 2 = Mha)" " Region C5.1 C6! Global %" Boreal North America %" Temperate North America %" Central America %" NH South America %" SH South America %" Europe %" Middle East %" NH Africa %" SH Africa %" Boreal Asia %" Central Asia %" Southeast Asia %" Equatorial Asia %" Australia and NZ %" 10
11 MCD64A Regional 2002 Burned Area Totals ( 10 4 km 2 = Mha)" " Region C5.1 C6! Global %" Boreal North America %" Temperate North America %" Central America %" NH South America %" SH South America %" Europe %" Middle East %" NH Africa %" SH Africa %" Boreal Asia %" Central Asia %" Southeast Asia %" Equatorial Asia %" Australia and NZ %" 11

12 MCD64A Annual Area Burned 12
13 MODIS C6 Burned Area Early Results Overall increase in burned area ~25% globally Small burns no longer blindly eliminated


14 September 2002, MODIS Ile h13v09 (eastern Brazil) C5.1 MCD64A1 C6 MCD64A1 (4 increase)
15 MODIS C6 Burned Area Early Results Overall increase in burned area ~25% globally Small burns no longer blindly eliminated Improved (i.e., smaller) temporal uncertainty
16 Temporal Uncertainty (Global, 2006)
17 MODIS C6 Burned Area Early Results Overall increase in burned area ~25% globally Small burns no longer blindly eliminated Improved (i.e., smaller) temporal uncertainty Mapping of cropland burning somewhat cosme=cally improved Timing can sill be off due to confusion with harvest
18 AcIve Fire Burned Area
19 Quality/consistency of cropland BA mapping can sill be very poor, however. Here s an example where the C6 product is no be[er than C5, and probably even worse.
 Philip! C5.")
20 April 2002, MODIS Ile h20v11 (southern Africa) Philip! C5.1 MCD64A1 C6 MCD64A1
21 MODIS CollecIon 6/VIIRS ValidaIon Landsat- 8 imagery CEOS burned area validaion protocol Image- pair interpretaion Cloud free + within a set Ime period (~2 months) Widely tested and used in peer reviewed literature CEOS Stage 3 Product accuracy has been assessed, and the uncertainies in the product well established via independent measurements made in a systemaic and staisically robust way that represents global condiions.
22 Mali C5.1
23 Mali C6
24 VIIRS Burned Area Product Status Adapt MCD64 producion code to use VIIRS data 750- m versus 375- m bands Retain 500- m grid for MODIS compaibility
25 VIIRS Burned Area Products VIIRS CollecIon 1 VNP64A1 VNP64A1- based GIS Products (SCF) VNP64CMQ (SCF) VNP64CDQ (SCF) 500- m Monthly Shapefiles m GeoTIFF 0.25 Monthly 0.25 Daily March 2017 release significantly behind schedule due to input- data implementaion delays.

26 MODIS VIIRS VNP64A1 Prototype VIIRS* *1- km NPP_DSRFIP_L3 daily surface reflectance product used as stand- in for 500- m VIIRS daily surface reflectance.
27
Overview on Land Cover and Land Use Monitoring in Russia
 Russian Academy of Sciences Space Research Institute Overview on Land Cover and Land Use Monitoring in Russia Sergey Bartalev Joint NASA LCLUC Science Team Meeting and GOFC-GOLD/NERIN, NEESPI Workshop
Figures and tables Table 1 Annual CO emissions 1 : a priori and a posteriori estimates for selected regions, Tg a -1. Figure 1. Seasonal a priori CO
 Figures and tables Table 1 Annual CO emissions 1 : a priori and a posteriori estimates for selected regions, Tg a -1. Figure 1. Seasonal a priori CO emissions from fossil fuel, biofuel, and biomass burning
SYNTHESIS OF LCLUC STUDIES ON URBANIZATION: STATE OF THE ART, GAPS IN KNOWLEDGE, AND NEW DIRECTIONS FOR REMOTE SENSING
 PROGRESS REPORT SYNTHESIS OF LCLUC STUDIES ON URBANIZATION: STATE OF THE ART, GAPS IN KNOWLEDGE, AND NEW DIRECTIONS FOR REMOTE SENSING NASA Grant NNX15AD43G Prepared by Karen C. Seto, PI, Yale Burak Güneralp,
NOAA Snow Map Climate Data Record Generated at Rutgers
 NOAA Snow Map Climate Data Record Generated at Rutgers David A. Robinson Rutgers University Piscataway, NJ Snow Watch 2013 Downsview, Ontario January 29, 2013 December 2012 snow extent departures Motivation
Bugs in JRA-55 snow depth analysis
 14 December 2015 Climate Prediction Division, Japan Meteorological Agency Bugs in JRA-55 snow depth analysis Bugs were recently found in the snow depth analysis (i.e., the snow depth data generation process)
LANDSAF SNOW COVER MAPPING USING MSG/SEVIRI DATA
 LANDSAF SNOW COVER MAPPING USING MSG/SEVIRI DATA Niilo Siljamo and Otto Hyvärinen Finnish Meteorological Institute, Erik Palménin aukio 1, P.O.Box 503, FI-00101 Helsinki, Finland Abstract Land Surface
Long-term global time series of MODIS and VIIRS SSTs
 Long-term global time series of MODIS and VIIRS SSTs Peter J. Minnett, Katherine Kilpatrick, Guillermo Podestá, Yang Liu, Elizabeth Williams, Susan Walsh, Goshka Szczodrak, and Miguel Angel Izaguirre Ocean
Greening of Arctic: Knowledge and Uncertainties
 Greening of Arctic: Knowledge and Uncertainties Jiong Jia, Hesong Wang Chinese Academy of Science jiong@tea.ac.cn Howie Epstein Skip Walker Moscow, January 28, 2008 Global Warming and Its Impact IMPACTS
NESDIS Global Automated Satellite Snow Product: Current Status and Planned Upgrades Peter Romanov
 NESDIS Global Automated Satellite Snow Product: Current Status and Planned Upgrades Peter Romanov NOAA-CREST, City University of New York (CUNY) Center for Satellite Applications and Research (STAR), NOAA/NESDIS
 Page 1 of 5 Home research global climate enso effects Research Effects of El Niño on world weather Precipitation Temperature Tropical Cyclones El Niño affects the weather in large parts of the world. The
The global MODIS burned area product
 The global MODIS burned area product David P. Roy 1, Luigi Boschetti 2, Christopher O. Justice 3 Abstract Earth-observing satellite systems provide the potential for an accurate and timely mapping of burned
A. Windnagel M. Savoie NSIDC
 National Snow and Ice Data Center ADVANCING KNOWLEDGE OF EARTH'S FROZEN REGIONS Special Report #18 06 July 2016 A. Windnagel M. Savoie NSIDC W. Meier NASA GSFC i 2 Contents List of Figures... 4 List of
AQRP Monthly Technical Report
 AQRP Monthly Technical Report PROJECT TITLE PROJECT PARTICIPANTS Improving Modeled Biogenic Isoprene Emissions under Drought Conditions and Evaluating Their Impact on Ozone Formation Qi Ying, Gunnar W.
Leveraging Sentinel-1 time-series data for mapping agricultural land cover and land use in the tropics
 Leveraging Sentinel-1 time-series data for mapping agricultural land cover and land use in the tropics Caitlin Kontgis caitlin@descarteslabs.com @caitlinkontgis Descartes Labs Overview What is Descartes
SEASONAL RAINFALL FORECAST FOR ZIMBABWE. 28 August 2017 THE ZIMBABWE NATIONAL CLIMATE OUTLOOK FORUM
 2017-18 SEASONAL RAINFALL FORECAST FOR ZIMBABWE METEOROLOGICAL SERVICES DEPARTMENT 28 August 2017 THE ZIMBABWE NATIONAL CLIMATE OUTLOOK FORUM Introduction The Meteorological Services Department of Zimbabwe
2015 Record breaking temperature anomalies
 2015 Record breaking temperature anomalies June 2015 global temperature was the highest in 136 (since 1880) years reaching an average of 0.88 C above the 20 th century average. This is an increase of 0.12
NESDIS Global Automated Satellite Snow Product: Current Status and Recent Results Peter Romanov
 NESDIS Global Automated Satellite Snow Product: Current Status and Recent Results Peter Romanov NOAA-CREST, City University of New York (CUNY) Center for Satellite Applications and Research (STAR), NOAA/NESDIS
Supplement of Vegetation greenness and land carbon-flux anomalies associated with climate variations: a focus on the year 2015
 Supplement of Atmos. Chem. Phys., 17, 13903 13919, 2017 https://doi.org/10.5194/acp-17-13903-2017-supplement Author(s) 2017. This work is distributed under the Creative Commons Attribution 3.0 License.
ASSESSMENT OF NORTHERN HEMISPHERE SWE DATASETS IN THE ESA SNOWPEX INITIATIVE
 ASSESSMENT OF NORTHERN HEMISPHERE SWE DATASETS IN THE ESA SNOWPEX INITIATIVE Kari Luojus 1), Jouni Pulliainen 1), Matias Takala 1), Juha Lemmetyinen 1), Chris Derksen 2), Lawrence Mudryk 2), Michael Kern
Who is polluting the Columbia River Gorge?
 Who is polluting the Columbia River Gorge? Final report to the Yakima Nation Prepared by: Dan Jaffe, Ph.D Northwest Air Quality, Inc. 7746 Ravenna Avenue NE Seattle WA 98115 NW_airquality@hotmail.com December
Disaster Monitoring with Remote Sensing at CRISP, NUS
 Disaster Monitoring with Remote Sensing at CRISP, NUS KWOH, Leong Keong Director, CRISP The 3rd Sentinel Asia Joint Project Team Meeting (JPTM) Le Meridien Hotel, Singapore 13-15 March 2007 6 metre Antenna
Methods review for the Global Land Cover 2000 initiative Presentation made by Frédéric Achard on November 30 th 2000
 Methods review for the Global Land Cover 2000 initiative Presentation made by Frédéric Achard on November 30 th 2000 1. Contents Objectives Specifications of the GLC-2000 exercise Strategy for the analysis
Estimating Regional Sources and Sinks of CO 2 Using GOSAT XCO 2
 Estimating Regional Sources and Sinks of CO 2 Using GOSAT XCO 2 Feng Deng Dylan Jones Daven Henze Nicolas Bousserez Kevin Bowman Joshua Fisher Ray Nassar IWGGMS-9 YokohamaJapan May 2013 1 XCO 2 Observations
Patrick Leinenkugel. German Aerospace Center (DLR) Vortrag > Autor > Dokumentname > Datum
 Vortrag > Autor > Dokumentname > Datum") Characterisation of land surface phenology and land cover for the Mekong Basin on the basis of multitemporal and multispectral satellite data from the MODIS Sensor Patrick Leinenkugel German Aerospace
Characterisation of land surface phenology and land cover for the Mekong Basin on the basis of multitemporal and multispectral satellite data from the MODIS Sensor Patrick Leinenkugel German Aerospace
Canada only has 7 of these biomes. Which biome do you think does not exist in Canada and why?
 Climate Zones and Biomes There are 8 defined biomes Permanent ice Tundra Boreal Forest Temperate deciduous forest Temperate rainforest Grassland Desert Tropical rainforest What is a biome? a major biotic
PYROGEOGRAPHY OF THE IBERIAN PENINSULA
 PYROGEOGRAPHY OF THE IBERIAN PENINSULA Teresa J. Calado (1), Carlos C. DaCamara (1), Sílvia A. Nunes (1), Sofia L. Ermida (1) and Isabel F. Trigo (1,2) (1) Instituto Dom Luiz, Universidade de Lisboa, Lisboa,
Introducing VIIRS Aerosol Products
 1 Introducing VIIRS Aerosol Products Shobha Kondragunta NOAA/NESDIS Center for Satellite Applications and Research VIIRS Aerosol Cal/Val Team 2 Name Organization Major Task Kurt F. Brueske IIS/Raytheon
Advancements and validation of the global CryoClim snow cover extent product
 www.nr.no Advancements and validation of the global CryoClim snow cover extent product Rune Solberg1, Øystein Rudjord1, Arnt-Børre Salberg1 and Mari Anne Killie2 1) Norwegian Computing Center (NR), P.O.
4/18/2006 Olga N. Krankina, OSU
 (Northern Eurasia Landcover Dynamics Analysis) Monitoring and validating the distribution and change in land cover across Northern Eurasia Objectives Characterize land cover and its change across boreal
GI Technology for Disaster Management
 GI Technology for Disaster Management 17 th ICC on the Regional Space Applications Programme for Sustainable Development (RESAP) 26 th Nov 2013 Bangkok Thailand Period and time of seasonal in thailand
An Overview of the UW Hyperspectral Retrieval System for AIRS, IASI and CrIS
 An Overview of the UW Hyperspectral Retrieval System for AIRS, IASI and CrIS Nadia Smith a, Elisabeth Weisz b and William L. Smith Cooperative Institute for Meteorological Satellite Studies (CIMSS) Space
Global Solar Dataset for PV Prospecting. Gwendalyn Bender Vaisala, Solar Offering Manager for 3TIER Assessment Services
 Global Solar Dataset for PV Prospecting Gwendalyn Bender Vaisala, Solar Offering Manager for 3TIER Assessment Services Vaisala is Your Weather Expert! We have been helping industries manage the impact
SKILLS (MA State Standards/Learning Outcomes)
") BRISCOE MIDDLE SCHOOL, BEVERLY, MA SOCIAL STUDIES CURRICULUM MAP & PACING GUIDE REVISED: JUNE 2012 GRADE 7 AUTHORS & GRADE-7 TEACHERS: Mr. Brian Bayer-Larson/Ms. Joy Benosky/Mr. Adam Olbash SEPTEMBER OCTOBER
BRISCOE MIDDLE SCHOOL, BEVERLY, MA SOCIAL STUDIES CURRICULUM MAP & PACING GUIDE REVISED: JUNE 2012 GRADE 7 AUTHORS & GRADE-7 TEACHERS: Mr. Brian Bayer-Larson/Ms. Joy Benosky/Mr. Adam Olbash SEPTEMBER OCTOBER
CTU Presents. The Fitful Rise of Solar Cycle 24 What it Means in the Coming Year. Frank Donovan W3LPL
 CTU Presents The Fitful Rise of Solar Cycle 24 What it Means in the Coming Year Frank Donovan W3LPL Introduction This presentation focuses on: The four major fall and winter DX contests: CQ WW SSB and
International Copper Study Group April 2011 Lisbon, Portugal COPPER The Project Pipeline Presented By: Glen Jones
 International Copper Study Group April 2011 Lisbon, Portugal COPPER The Project Pipeline Presented By: Glen Jones The data contained in this presentation is a snapshot from the live Intierra database.
June 1993 T. Nitta and J. Yoshimura 367. Trends and Interannual and Interdecadal Variations of. Global Land Surface Air Temperature
 June 1993 T. Nitta and J. Yoshimura 367 Trends and Interannual and Interdecadal Variations of Global Land Surface Air Temperature By Tsuyoshi Nitta Center for Climate System Research, University of Tokyo,
SES 123 Global and Regional Energy Lab Worksheet
 SES 123 Global and Regional Energy Lab Worksheet In this laboratory exercise, you used the NOAA Reanalysis site to explore global land temperatures, including spatial and temporal variations. Understanding
Comparison of NASA AIRS and MODIS Land Surface Temperature and Infrared Emissivity Measurements from the EOS AQUA platform
 Comparison of NASA AIRS and MODIS Land Surface Temperature and Infrared Emissivity Measurements from the EOS AQUA platform Robert Knuteson, Steve Ackerman, Hank Revercomb, Dave Tobin University of Wisconsin-Madison
Climate Change Impact on Air Temperature, Daily Temperature Range, Growing Degree Days, and Spring and Fall Frost Dates In Nebraska
 EXTENSION Know how. Know now. Climate Change Impact on Air Temperature, Daily Temperature Range, Growing Degree Days, and Spring and Fall Frost Dates In Nebraska EC715 Kari E. Skaggs, Research Associate
Using VIIRS Land Surface Temperature to Evaluate NCEP North American Mesoscale Model (NAM) Forecast
 Forecast") Using VIIRS Land Surface Temperature to Evaluate NCEP North American Mesoscale Model (NAM) Forecast Zhuo Wang (University of Maryland) Yunyue Yu (NOAA/NESDIS/STAR) Peng Yu (University of Maryland) Yuling
Using VIIRS Land Surface Temperature to Evaluate NCEP North American Mesoscale Model (NAM) Forecast Zhuo Wang (University of Maryland) Yunyue Yu (NOAA/NESDIS/STAR) Peng Yu (University of Maryland) Yuling
No pause in the increase of hot temperature extremes
 SUPPLEMENTARY INFORMATION DOI: 10.1038/NCLIMATE2145 No pause in the increase of hot temperature extremes Sonia I. Seneviratne 1, Markus G. Donat 2,3, Brigitte Mueller 4,1, and Lisa V. Alexander 2,3 1 Institute
OPTIMISING THE TEMPORAL AVERAGING PERIOD OF POINT SURFACE SOLAR RESOURCE MEASUREMENTS FOR CORRELATION WITH AREAL SATELLITE ESTIMATES
 OPTIMISING THE TEMPORAL AVERAGING PERIOD OF POINT SURFACE SOLAR RESOURCE MEASUREMENTS FOR CORRELATION WITH AREAL SATELLITE ESTIMATES Ian Grant Anja Schubert Australian Bureau of Meteorology GPO Box 1289
Chapter 1 Climate in 2016
 Chapter 1 Climate in 2016 1.1 Global climate summary Extremely high temperatures were frequently observed in many regions of the world, and in particular continued for most of the year in various places
Google Earth Engine: MODIS Land Surface Temperature (LST) Training Release IRI, Earth Institute, Columbia University
 Training Release IRI, Earth Institute, Columbia University") Google Earth Engine: MODIS Land Surface Temperature (LST) Training Release 1.0.0 IRI, Earth Institute, Columbia University Pietro Ceccato Valerie Pietsch Yung-Jen Chen May 24, 2016 CONTENTS Google Earth
Google Earth Engine: MODIS Land Surface Temperature (LST) Training Release 1.0.0 IRI, Earth Institute, Columbia University Pietro Ceccato Valerie Pietsch Yung-Jen Chen May 24, 2016 CONTENTS Google Earth
Juli I. Rubin. NRC Postdoctoral Research Associate Naval Research Laboratory, Monterey, CA
 Development of the Ensemble Navy Aerosol Analysis Prediction System and its application of the Data Assimilation Research Testbed in Support of Aerosol Forecasting Juli I. Rubin NRC Postdoctoral Research
A Facility for Producing Consistent Remotely Sensed Biophysical Data Products of Australia
 TERRESTRIAL ECOSYSTEM RESEARCH NETWORK - AusCover - A Facility for Producing Consistent Remotely Sensed Biophysical Data Products of Australia June, 2011 Mervyn Lynch Professor of Remote Sensing Curtin
SEASONAL AND ANNUAL TRENDS OF AUSTRALIAN MINIMUM/MAXIMUM DAILY TEMPERATURES DURING
 SEASONAL AND ANNUAL TRENDS OF AUSTRALIAN MINIMUM/MAXIMUM DAILY TEMPERATURES DURING 1856-2014 W. A. van Wijngaarden* and A. Mouraviev Physics Department, York University, Toronto, Ontario, Canada 1. INTRODUCTION
Exploring Climate Patterns Embedded in Global Climate Change Datasets
 Exploring Climate Patterns Embedded in Global Climate Change Datasets James Bothwell, May Yuan Department of Geography University of Oklahoma Norman, OK 73019 jamesdbothwell@yahoo.com, myuan@ou.edu Exploring
REMOTELY SENSED INFORMATION FOR CROP MONITORING AND FOOD SECURITY
 LEARNING OBJECTIVES Lesson 4 Methods and Analysis 2: Rainfall and NDVI Seasonal Graphs At the end of the lesson, you will be able to: understand seasonal graphs for rainfall and NDVI; describe the concept
A new perspective on aerosol direct radiative effects in South Atlantic and Southern Africa
 A new perspective on aerosol direct radiative effects in South Atlantic and Southern Africa Ian Chang and Sundar A. Christopher Department of Atmospheric Science University of Alabama in Huntsville, U.S.A.
MODIS/Terra observed seasonal variations of snow cover over the Tibetan Plateau
 Click Here for Full Article GEOPHYSICAL RESEARCH LETTERS, VOL. 34, L06706, doi:10.1029/2007gl029262, 2007 MODIS/Terra observed seasonal variations of snow cover over the Tibetan Plateau Zhaoxia Pu, 1,2
Mission Objectives and Current Status of GOSAT (IBUKI) Japan Aerospace Exploration Agency Yasushi Horikawa
 Japan Aerospace Exploration Agency Yasushi Horikawa") Mission Objectives and Current Status of GOSAT (IBUKI) Japan Aerospace Exploration Agency Yasushi Horikawa 1 Background of the Launch of the GOSAT project 1997 Adoption of the Kyoto Protocol 2002 Ratification
Mission Objectives and Current Status of GOSAT (IBUKI) Japan Aerospace Exploration Agency Yasushi Horikawa 1 Background of the Launch of the GOSAT project 1997 Adoption of the Kyoto Protocol 2002 Ratification
Central Valley School District Social Studies Curriculum Map Grade 7. August - September
 August - September Geographical/Historical Skills Identify and analyze timelines. Construct and use cause and effect charts. Differentiate between fact and opinion. Use of word webs, flip charts, outlines
The DEIMOS Earth Observation System and the PanGeo Alliance. Contribution to CSCDA Data WareHouse 2. Fabrizio Pirondini CEO, Elecnor Deimos Imaging
 The DEIMOS Earth Observation System and the PanGeo Alliance Contribution to CSCDA Data WareHouse 2 Fabrizio Pirondini CEO, Elecnor Deimos Imaging Copernicus Space Component Data Access Workshop ESRIN,
El Nino 2015 in South Sudan: Impacts and Perspectives. Raul Cumba
 El Nino 2015 in South Sudan: Impacts and Perspectives Raul Cumba El Nino 2015-2016 The El Nino Event of 2015-2016 The 2015/16 El Nino Event Officially declared in March 2015 Now approaching peak intensity
NASA s Activities in Europe
 NASA s Activities in Europe Presented by Dr. Bill Barry NASA European Representative November 10, 2009 at the 2009 International Workshop on Environment and Alternative Energy 2 Current Activities The
What is so great about nighttime VIIRS data for the detection and characterization of combustion sources?
 Proceedings of the Asia-Pacific Advanced Network 2013 v. 35, p. 33-48. http://dx.doi.org/10.7125/apan.35.5 ISSN 2227-3026 What is so great about nighttime VIIRS data for the detection and characterization
Analysis of daily, monthly, and annual burned area using the fourth-generation global fire emissions database (GFED4)
") JOURNAL OF GEOPHYSICAL RESEARCH: BIOGEOSCIENCES, VOL. 118, 317 328, doi:10.1002/jgrg.20042, 2013 Analysis of daily, monthly, and annual burned area using the fourth-generation global fire emissions database
JOURNAL OF GEOPHYSICAL RESEARCH: BIOGEOSCIENCES, VOL. 118, 317 328, doi:10.1002/jgrg.20042, 2013 Analysis of daily, monthly, and annual burned area using the fourth-generation global fire emissions database
ASSESSMENT OF DIFFERENT WATER STRESS INDICATORS BASED ON EUMETSAT LSA SAF PRODUCTS FOR DROUGHT MONITORING IN EUROPE
 ASSESSMENT OF DIFFERENT WATER STRESS INDICATORS BASED ON EUMETSAT LSA SAF PRODUCTS FOR DROUGHT MONITORING IN EUROPE G. Sepulcre Canto, A. Singleton, J. Vogt European Commission, DG Joint Research Centre,
We greatly appreciate the thoughtful comments from the reviewers. According to the reviewer s comments, we revised the original manuscript.
 Response to the reviews of TC-2018-108 The potential of sea ice leads as a predictor for seasonal Arctic sea ice extent prediction by Yuanyuan Zhang, Xiao Cheng, Jiping Liu, and Fengming Hui We greatly
Title: Mapping and Monitoring of Boreal Wetlands
 Title: Mapping and Monitoring of Boreal Wetlands Product Leader: Kyle McDonald Affiliation: Jet Propulsion Laboratory, California Institute of Technology Product Team (confirmed members only): Mahta Moghaddam
UPDATE OF REGIONAL WEATHER AND SMOKE HAZE (December 2017)
") UPDATE OF REGIONAL WEATHER AND SMOKE HAZE (December 2017) 1. Review of Regional Weather Conditions for November 2017 1.1 In November 2017, Southeast Asia experienced inter-monsoon conditions in the first
UPDATE OF REGIONAL WEATHER AND SMOKE HAZE (December 2017) 1. Review of Regional Weather Conditions for November 2017 1.1 In November 2017, Southeast Asia experienced inter-monsoon conditions in the first
Larry Thomason, Jean-Paul Vernier, Adam Bourassa, Florian Arfeuille, Christine Bingen, Thomas Peter, Beiping Luo
 Stratospheric Aerosol Data Set (SADS Version 2) Prospectus Larry Thomason, Jean-Paul Vernier, Adam Bourassa, Florian Arfeuille, Christine Bingen, Thomas Peter, Beiping Luo Basic description of the contents
Name: Climate Date: EI Niño Conditions
 Name: Date: Base your answers to questions 1 and 2 on the maps and the passage below. The maps show differences in trade wind strength, ocean current direction, and water temperature associated with air-pressure
Our climate system is based on the location of hot and cold air mass regions and the atmospheric circulation created by trade winds and westerlies.
 CLIMATE REGIONS Have you ever wondered why one area of the world is a desert, another a grassland, and another a rainforest? Or have you wondered why are there different types of forests and deserts with
East Africa The 2015 Season (Long Rains)
") East Africa The 2015 Season (Long Rains) EAST AFRICA SEASONAL ANALYSIS - 2015 HIGHLIGHTS The Long Rains season in the Horn of Africa has come to an end in May. With no further rainfall until the Short
East Africa The 2015 Season (Long Rains) EAST AFRICA SEASONAL ANALYSIS - 2015 HIGHLIGHTS The Long Rains season in the Horn of Africa has come to an end in May. With no further rainfall until the Short
The use of spatial-temporal analysis for noise reduction in MODIS NDVI time series data
 The use of spatial-temporal analysis for noise reduction in MODIS NDVI time series data Julio Cesar de Oliveira 1,2, José Carlos Neves Epiphanio 1, Camilo Daleles Rennó 1 1 Instituto Nacional de Pesquisas
Lecture 8. Monsoons and the seasonal variation of tropical circulation and rainfall
 Lecture 8 Monsoons and the seasonal variation of tropical circulation and rainfall According to the second hypothesis, the monsoon is a manifestation of the seasonal variation of the tropical circulation
Population Density and Growth. Distribution of people on Earth
 Population Density and Growth Distribution of people on Earth Population Density! Terminology!! Population density is a measure of how compact or concentrated a population is. It takes area of land into
Lunar Eclipses and the Future of Man
 Lunar Eclipses and the Future of Man Krsanna Duran has proposed that Lunar Eclipses are important indicators of Future History, and has recently focussed on the last three Lunar Eclipses of 2009: 7 July;
South Asian Climate Outlook Forum (SASCOF-6)
") Sixth Session of South Asian Climate Outlook Forum (SASCOF-6) Dhaka, Bangladesh, 19-22 April 2015 Consensus Statement Summary Below normal rainfall is most likely during the 2015 southwest monsoon season
Sixth Session of South Asian Climate Outlook Forum (SASCOF-6) Dhaka, Bangladesh, 19-22 April 2015 Consensus Statement Summary Below normal rainfall is most likely during the 2015 southwest monsoon season
WMO SDS-WAS. Observational needs. Enric Terradellas, AEMET, Barcelona chair of the WMO SDS-WAS Steering Committtee
 WMO SDS-WAS Observational needs Enric Terradellas, AEMET, Barcelona eterradellasj@aemet.es chair of the WMO SDS-WAS Steering Committtee GAW Symposium, Geneva, Switzerland, 10-13 April 2017 WMO SDS-WAS
A Validation Protocol for Continental Scale Snow Extent Products that Incorporates Product and Reference Uncertainty
 SnowPEX Satellite Snow Product Intercomparison and Evaluation Experiment (5/2014 4/2016) Richard Fernandes, Sari Metsaemaeki, Gabriele Bippus, Rune Solberg, Chris Derksen, Kari Lujois,Thomas Nagler, Bojan
Preparation for Himawari 8
 Preparation for Himawari 8 Japan Meteorological Agency Meteorological Satellite Center Hidehiko MURATA ET SUP 8, WMO HQ, Geneva, 14 17 April 2014 1/18 Introduction Background The Japan Meteorological Agency
Characteristics of Global Precipitable Water Revealed by COSMIC Measurements
 Characteristics of Global Precipitable Water Revealed by COSMIC Measurements Ching-Yuang Huang 1,2, Wen-Hsin Teng 1, Shu-Peng Ho 3, Ying-Hwa Kuo 3, and Xin-Jia Zhou 3 1 Department of Atmospheric Sciences,
RedLatif Latin American Network of Remote Sensing and Forest Fire Sun City, South Africa Maria Isabel Cruz Lopez May 9th, 2011 RedLatif Coordinator
 RedLatif Latin American Network of Remote Sensing and Forest Fire Sun City, South Africa May 9 th, 2011 Maria Isabel Cruz Lopez RedLatif Coordinator Index 1.- Objective 2.- Members 3.- WEB page 4.- Projects
Data Origin. Ron van Lammeren CGI-GIRS 0910
 Data Origin Ron van Lammeren CGI-GIRS 0910 How to obtain geodata? Geo data initiative Executive Order 12906, "Coordinating Geographic Data Acquisition and Access: The National Spatial Data Infrastructure,"
Predicting Future CO2 Amounts and Monitoring Seasonal CO2 Fluctuations QUANTIFYING CO2 ANNUAL INCREASE
 http://visibleearth.nasa.gov/view.php?id=5772 3 Predicting Future CO2 Amounts and Monitoring Seasonal CO2 Fluctuations QUANTIFYING CO2 ANNUAL INCREASE Aguilera, Kimberly GEO 3276: GIS & GPS Applications
ERBE Geographic Scene and Monthly Snow Data
 NASA Contractor Report 4773 ERBE Geographic Scene and Monthly Snow Data Lisa H. Coleman, Beth T. Flug, Shalini Gupta, Edward A. Kizer, and John L. Robbins Science Applications International Corporation
IN-NETWORK CHLORINE RESIDUAL MANAGEMENT
 IN-NETWORK CHLORINE RESIDUAL MANAGEMENT Using GIS to assess flush point efficacy Ian Toohey, P.E. Systems Planning Austin Water TABLE OF CONTENTS 1. Background 3. Surface Creation 2. Residual Sampling
Preparation of LULC map from GE images for GIS based Urban Hydrological Modeling
 International Conference on Modeling Tools for Sustainable Water Resources Management Department of Civil Engineering, Indian Institute of Technology Hyderabad: 28-29 December 2014 Abstract Preparation
Aerosol Retrieved from MODIS: Algorithm, Products, Validation and the Future
 Aerosol Retrieved from MODIS: Algorithm, Products, Validation and the Future Presented by: Rob Levy Re-presenting NASA-GSFC s MODIS aerosol team: Y. Kaufman, L. Remer, A. Chu,, C. Ichoku,, R. Kleidman,,
Data Origin. How to obtain geodata? Ron van Lammeren CGI-GIRS 0910
 Data Origin How to obtain geodata? Ron van Lammeren CGI-GIRS 0910 Spatial Data interest Improvement of policy making. ± 90% of all information used by government has spatial characteristics SPATIAL INFORMATION
Module 2.1 Monitoring activity data for forests using remote sensing
 Module 2.1 Monitoring activity data for forests using remote sensing Module developers: Frédéric Achard, European Commission (EC) Joint Research Centre (JRC) Jukka Miettinen, EC JRC Brice Mora, Wageningen
Plans for GEMS GRG months Martin Schultz and the GRG team
 Plans for GEMS GRG months 18-30 Martin Schultz and the GRG team Sub project structure WP1: Assimilation of gas-phase chemical species in the stratosphere and troposphere leader: H. Eskes WP2: Implementation
Malawi. General Climate. UNDP Climate Change Country Profiles. C. McSweeney 1, M. New 1,2 and G. Lizcano 1
 UNDP Climate Change Country Profiles Malawi C. McSweeney 1, M. New 1,2 and G. Lizcano 1 1. School of Geography and Environment, University of Oxford. 2. Tyndall Centre for Climate Change Research http://country-profiles.geog.ox.ac.uk
Interannual variation of MODIS NDVI in Lake Taihu and its relation to climate in submerged macrophyte region
 Yale-NUIST Center on Atmospheric Environment Interannual variation of MODIS NDVI in Lake Taihu and its relation to climate in submerged macrophyte region ZhangZhen 2015.07.10 1 Outline Introduction Data
Recent Update on MODIS C6 and VIIRS Deep Blue Aerosol Products
 Recent Update on MODIS C6 and VIIRS Deep Blue Aerosol Products N. Christina Hsu, Photo taken from Space Shuttle: Fierce dust front over Libya Corey Bettenhausen, Andrew M. Sayer, and Rick Hansell Laboratory
Condensing Massive Satellite Datasets For Rapid Interactive Analysis
 Condensing Massive Satellite Datasets For Rapid Interactive Analysis Glenn Grant University of Colorado, Boulder With: David Gallaher 1,2, Qin Lv 1, G. Campbell 2, Cathy Fowler 2, Qi Liu 1, Chao Chen 1,
Supplemental Materials
 Supplemental Materials Figure S-1. Locations of the ozonesonde stations used in the TOST product for the period 2008-2012. Figure S-2. Map of the seven regions: Eastern USA, Eastern China, Atlantic, Indonesia,
Understanding the role of land cover / land use nexus in malaria transmission under changing socio-economic climate in Myanmar
 Annual Report for Year 1 June, 2017 January, 2018 NASA Land Cover Land Use Change Program Funded under grant # NNX17AI06G: Understanding the role of land cover / land use nexus in malaria transmission
Global NWP Index documentation
 Global NWP Index documentation The global index is calculated in two ways, against observations, and against model analyses. Observations are sparse in some parts of the world, and using full gridded analyses
Seasonal Climate Outlook for South Asia (June to September) Issued in May 2014
 Issued in May 2014") Ministry of Earth Sciences Earth System Science Organization India Meteorological Department WMO Regional Climate Centre (Demonstration Phase) Pune, India Seasonal Climate Outlook for South Asia (June
Ministry of Earth Sciences Earth System Science Organization India Meteorological Department WMO Regional Climate Centre (Demonstration Phase) Pune, India Seasonal Climate Outlook for South Asia (June
Phase 1 Cards. Phase 1. Phase 1. How many picnic areas does the park have? Write the answer near the legend.
 S T U D E N T H A N D O U T F Cards Write the map s title in the northwest corner above the map. How many picnic areas does the park have? Write the answer near the legend. 1 2 Draw a compass rose near
An assessment of the risk of aerial transport of rust pathogens to the Western Hemisphere and within North America
 An assessment of the risk of aerial transport of rust pathogens to the Western Hemisphere and within North America Scott A. Isard Departments of Plant Pathology and Meteorology Pennsylvania State University
Observing land from space: Interacting with land data from NASA s LP DAAC
 Observing land from space: Interacting with land data from NASA s LP DAAC Danielle Golon Innovate! Inc., contractor to the U.S. Geological Survey (USGS) Earth Resources Observation and Science (EROS) Center
GFAS Methodology & Results
 GFAS Methodology & Results Johannes W. Kaiser, Imke Hüser, Berit Gehrke Max Planck Institute for Chemistry, DE Tadas Nikonovas, Weidong Xu, Martin G. Wooster King s College London, UK Ioannis Bistinas,
Imaging the whole Earth every day. Josh Alban VP, Business Development
 Imaging the whole Earth every day Josh Alban VP, Business Development josh@planet.com Planet Labs helps you detect and act on change by imaging the whole Earth everyday. Challenges Limited Coverage Low
Pilot applications for Egypt related end-users
 GEO-CRADLE Regional Workshop Thursday, 25 th May, 2017 Pilot applications for Egypt related end-users Hesham El-Askary Chapman University Panagiotis Kosmopoulos National Observatory of Athens Stelios Kazadzis